
Measurement Method for Fluid Pressure Fluctuation in Fluid-Conveying Pipe Using PVDF Piezoelectric Film Sensor

1
State Key Laboratory of Acoustics, Institute of Acoustics, Chinese Academy of Sciences, Beijing 100190, China
2
University of Chinese Academy of Sciences, Beijing 100049, China
3
National Supercomputer Center in Tianjin, Tianjin 300457, China
*
Author to whom correspondence should be addressed.
Appl. Sci. 2021, 11(3), 1299; https://doi.org/10.3390/app11031299
Submission received: 11 December 2020
/
Revised: 23 January 2021
/
Accepted: 28 January 2021
/
Published: 1 February 2021
(This article belongs to the Special Issue Condition Monitoring and Their Applications in Industry)
Abstract
:As a representative fluid-transporting system, fluid-conveying pipes play an essential role in many fields. For a fluid-conveying pipe system in operation, fluid pulsation in pipes contains much information about fluid flow parameters (flow velocity, fluid pressure, etc.). Therefore, the measurement of fluid pulsation is important for understanding the internal fluid flow. To use polyvinylidene fluoride (PVDF) piezoelectric film sensors to indirectly measure the pressure fluctuation of the internal fluid, we simulated a fluid-conveying pipe with PVDF piezoelectric film sensors attached to the outer pipe wall. The simulation results showed that the variation of voltage signal of PVDF, circumferential stress and strain of the pipe wall, and the pressure fluctuation of internal fluid were highly positively correlated, which proved that the PVDF piezoelectric film sensor can be applied to indirectly measure the pressure fluctuation of internal fluid. We also studied the influences of flow velocity pulsation and mechanical vibration caused by the pipeline pump during operation. It is found that the flow velocity pulsation had little influence on the measurements of the variation of circumferential stress and strain of the pipe wall and the internal fluid pressure fluctuation. When both ends of the pipe were fixed by hoops, mechanical vibration had little influence on the measurement of the variation of circumferential stress and strain of the pipe wall as well as the fluid pressure fluctuation. Finally, simulation results were verified by experiments.
1. Introduction
As a representative fluid-transporting system, fluid-conveying pipes play an essential role in water conservancy and hydropower, the petrochemical industry, aerospace, and municipal drainage. The change of fluid pressure and flow velocity will cause pipe vibration and deformation. The vibration and deformation of pipe will in turn affect the internal fluid flow, which is named fluid–structure interaction (FSI). For a fluid-conveying pipe system, flow-induced vibration response is mainly a result of flow velocity pulsation and mechanical vibration caused by the pipeline pump during operation [1]. The flow velocity pulsation is caused by the interstitial pressure of the pipeline pump, and it is the main reason for pipe vibration. The mechanical vibration is caused by the vibration of the pipeline pump itself, which is attached on the pipe to affect the pipe vibration. Therefore, development of a reasonable FSI model can guide the analysis of flow-induced vibration and also help in actual pipes.
With the rapid development of technology and the continuous improvement of calculation methods, more and more researchers use simulation software to analyze the vibration, stress, and strain of fluid-conveying pipes. Several researchers [2,3,4,5,6] investigated the influence of the FSI on radial forces, pressure distribution, equivalent stress, and rotor deflection in a pipeline pump. Chen [7] studied the influence of pulsation frequency on the vibration characteristics by simulating a hydraulic flexible pipe. Simulation results showed that the vibration amplitude and frequency of the pipe increased as pulsation frequency increased, causing the natural frequency and the support stiffness of the pipe to decrease. Dai [8] simulated an L-shaped hydraulic bellow to study the vibration characteristics of the pipe when inlet pressure is a continuous pulse. The results showed that the L-shaped hydraulic bellow expanded and stretched because of fluid pulsation, which caused the pipe to vibrate violently. Liu et al. [9] investigated the effects of flow velocity on the vibration responses of flexible marine pipes. They found that the internal flow had little influence on vibration frequency and amplitude of flexible pipe when its velocity was relatively small. Yang et al. [10] simulated a fluid-conveying pipe and took into consideration friction coupling and Poisson coupling. It was found that the stress wave in the pipe wall and the pressure wave in the water were generated simultaneously.
In addition to the above-mentioned theories and simulation results, some researchers attempted to measure the pressure fluctuation of the internal fluid using piezoelectric sensors. Nan et al. [11] used a flexible aluminum nitride (AIN) film sensor to measure pressure fluctuation in pipe systems and vibration of pipe walls. Liang et al. [12] developed a flexible lead zirconate titanate (PZT) diaphragm sensor and investigated its performance in measuring fluctuating pressures in the low-frequency range. The experimental results showed that the sensor was highly sensitive to low and quasi-static pressure load. Muggleton et al. [13] reported that a polyvinylidene fluoride (PVDF) sensor located on a flexible side branch of a fluid-filled pipe can effectively monitor pressure in the main pipe. Okosun et al. [14] validated through experiments that PVDF patches are able to effectively monitor and detect leakage in metal pipes. The authors also presented a numerical model that includes FSI, which estimates the vibrations and dynamic strains on a fluid-carrying pipe as well as the impact of leaks [15]. Although these researchers have used different piezoelectric sensors to measure pressure fluctuation in pipe, no measurement principles have been given to clearly describe the relationship between detected signals of sensors and internal fluid pulsation.
Recently, we carried out a study on the indirect measurement of the pressure fluctuation of internal fluid using piezoelectric PVDF sensors. We analyzed the measurement principle on the basis of a numerical model, and then corresponding experiments were conducted. Numerical results agreed well with experiments, which proved that the measurement principle is correct and the measurement method for fluid pressure fluctuation is feasible.
2. Modeling a Fluid-Conveying Pipe with PVDF Piezoelectric Film Sensor
Considering the circular cross-section of the pipe wall, it is advantageous to use PVDF piezoelectric film sensors to measure the stress and strain in curved surface because it is flexible and robust. In order to understand the physical principle among fluid, pipe, and PVDF film, we modeled this fluid-conveying pipe with PVDF film by commercial ANSYS software.
Flows in pipes in real applications are normally turbulent. In practice, there are three main methods for the analysis of turbulent flows, namely, direct numerical simulation (DNS), large eddy simulation (LES), and Reynolds-averaged Navier–Stokes (RANS) models. Among them, the DNS has the highest accuracy and can be used to simulate turbulence of all scales, although the computation cost is high. Therefore, it is difficult to apply it to turbulence simulation. Although the RANS has the advantage of costing less computational resources, its accuracy is poor. The LES is a numerical simulation method between the RANS and DNS, which combines the advantages of both and is very suitable for turbulence simulation [15]. For the reasons above, we chose the LES to simulate the turbulent flow in the pipe.
Fluid–structure interaction and electromechanical coupling are used in finite element method (FEM) simulation of a fluid-conveying pipe with PVDF piezoelectric thin film attached to the outer wall. The FEM is a numerical technique that provides approximate solutions of boundary value problems for partial differential equations.
2.1. Fluid–Structure Interaction
First, the FEM formalism for the equation of motion of internal fluid flow is [16]
where denotes the pressure vector of the fluid, denotes the second derivative of fluid pressure vector with respect to time, denotes the first derivative of fluid pressure vector with respect to time, is the mass matrix of the fluid, is the damping matrix of the fluid, is the stiffness matrix of the fluid, and denotes the load vector of the force applied to the fluid by the pipe.
Then, considering the movements of the pipe under internal fluid forces and external forces such as the mechanical vibration of the pump, the FEM for the pipe is [17,18]
where denotes the displacement vector of the pipe, denotes the second derivative of pipe displacement vector with respect to time, denotes the first derivative of pipe displacement vector with respect to time, is the mass matrix of the pipe, is the damping matrix of the pipe, is the stiffness matrix of the pipe, denotes the load vector of the force applied to the pipe by the fluid, and denotes the load vector of external forces to the pipe.
From the discussion above, we know that the FSI is reflected in and , as follows [19]
where is the density of water and is the coupling matrix at the fluid-structure interface.
The coupling equation of the internal fluid and the pipe can be obtained from Equation (1) to Equation (4):
Continuity of force and displacement is imposed at the fluid–structure interface. Figure 1 shows the transitive relation at the fluid–structure interface, where physical quantities such as force and displacement are exchanged across the interface.
A two-way FSI analysis that coupled the Fluent solver with Transient Structural Solver in ANSYS Workbench was conducted in our study. In each time step, the force data obtained from the calculation of the fluid domain are transferred to the equation of motion of the pipe for calculation, and the displacement data obtained from the equation of motion of the pipe are transferred back to the equation of motion of the fluid for calculation.
2.2. Electromechanical Coupling
The internal fluid pressure can be transferred through the fluid–structure interface to load the pipe in the form of stress and strain [7]. Moreover, the contact region between pipe and PVDF piezoelectric thin films is set to bonded contact region, which means that there is no normal separation and relative tangential sliding on the contact surface. Thus, the continuity of displacement, stress, and strain is imposed at the contact region.
The stress and strain of the pipe causes mechanical deformation of the polarized piezoelectric film, and electrical charges are generated on its polarized surface simultaneously. The mechanical deformation can be attributed to mechanical behavior, and charge generation can be attributed to electrical behavior. In piezoelectricity theory, the electromechanical coupling between mechanical quantities (stress, strain) and electrical quantities (electric displacement, electric field intensity) of the piezoelectric film is described by piezoelectric equation.
The piezoelectric equation of the PVDF piezoelectric thin film is
where denotes the electric displacement vector, is the piezoelectric constant matrix, denotes the stress vector, is the dielectric permittivity matrix, and denotes the electric field intensity vector. There is no external electric field when the piezoelectric film is used as a receiving sensor, i.e., is set to zero. Equation (6) can be simplified to
Applying element discretization and using the Hamilton’s principle, we derive the finite element dynamic equation for the piezoelectric film as [20]
where is the mass matrix of piezoelectric film, is the damping matrix of piezoelectric film, is the stiffness matrix of piezoelectric film, is the dielectric permittivity matrix, is the piezoelectric coupling matrices, denotes the displacement vector, denotes the electric potential vector, denotes the second derivative of electric potential vector with respect to time, denotes the first derivative of electric potential vector with respect to time, denotes the force vector, and denotes the charge vector.
Measuring the pressure fluctuation of the internal fluid using piezoelectric sensors is a complex problem. The key to solving this problem is finding the correlation between fluid pressure and voltage of PVDF film, and thus we first studied the correlation between fluid pressure and stress and strain of the pipe on the basis of the simulation results of FSI. Then, we investigated the correlation between voltage of PVDF film and stress and strain of the pipe on the basis of the simulation results of electromechanical coupling. Finally, we analyzed the feasibility of using PVDF piezoelectric thin film sensors to measure the pressure fluctuation of the internal fluid on the basis of the above studies.
3. Parameter Setting
Combining the fluid–structure interaction and electromechanical coupling mentioned above, we constructed the geometrical model of a fluid-conveying pipe with PVDF piezoelectric thin films attached to the outer wall, as shown in Figure 2. The figure shows a pipe that is 4 mm in thickness, 300 mm in length, and 60 mm in its inner diameter. The length of the PVDF piezoelectric thin film is 20 mm. The film width is 10 mm, and the film thickness is 0.5 mm.
The relationship among internal fluid pressure signal, stress and strain signals of pipe wall, and piezoelectric sensor response signal without the influences of flow velocity pulsation and mechanical vibration were first investigated. We constructed the fluid model by ANSYS Fluent in ANSYS Workbench. Because the geometry of the fluid domain is a cylinder, we used structured meshing to mesh it. The finite element model of the fluid domain is shown in Figure 3.
Transient analysis was selected in Fluent. Considering the influence of gravity, we applied a gravity load in the Y direction of the fluid domain, and the gravitational acceleration was set to −9.81 m/s2. The fluid was water with a density of 998.2 kg/m3. The viscous model was set to LES, and wall-adapting local eddy-viscosity (WALE) subgrid-scale model was chosen [21]. From the previous turbulence simulations, we know that WALE subgrid-scale model can produce satisfactory fluid simulation results in a wide range of flow velocities. The velocity-inlet boundary condition (BC) was selected for the pipe inlet. The velocity magnitude was set to 1.6 m/s, and gauge pressure was set to 100 kPa, considering the fluid pressure measured in experiments. The pressure-outlet BC was selected for the pipe outlet, and gauge pressure was also set to 100 kPa. The outer surface of the fluid was set to fluid–structure interface.
Then, the finite element model of pipe and PVDF piezoelectric thin films was constructed by using the structured meshing in Transient Structural, as shown in Figure 4. Since polyvinyl chloride (PVC) has small rigidity and it is highly deformable, it is convenient to carry out experiments with this pipe material. The pipe material was specified to be PVC, of which density was 1380 kg/m3, Young’s modulus was 3.4 GPa, and Poisson’s ratio was 0.319. The density of PVDF piezoelectric thin films was 1780 kg/m3. The gravitational acceleration was also set to −9.81 m/s2 in the Y direction of the pipe. The pipe support type was specified to be fixed supports as both inlet and outlet boundary conditions. The internal wall of the pipe was set to fluid–structure interface. The PVDF piezoelectric thin films were set to piezoelectric body.
The interactive transmission of data between the fluid and the structure was realized by System Coupling in ANSYS Workbench. The time step size was set to 0.001 s, and the simulation time was set to 0.15 s.
4. Results and Analysis
4.1. Fluid–Structure Interaction Analysis
In the finite element model of the fluid domain, we created three planes perpendicular to the direction of fluid flow, corresponding to the locations where PVDF piezoelectric thin films were attached, namely, Plane1, Plane2, and Plane3, as shown in Figure 5.
Three data extraction points, namely, Point1, Point2, and Point3, were set in pipe wall, corresponding to the three planes in the fluid domain, as shown in Figure 6.
Considering the circular shape of cross-sections, we compared the circumferential stress and strain signals at Point1 with the fluid pressure signal, as shown in Figure 7a,b. In Figure 7, the Y-axis on the left stands for pressure, which is the blue curve, and the Y-axis on the right represents circumferential strain or circumferential stress, which is the green curve. Figure 7a,b shows intuitively that the variation of circumferential stress and strain signals at Point1 was very close to the fluid pressure fluctuation signal. To study the correlation between two signals more accurately, we used correlation coefficient to quantitatively describe their degree of correlation. The correlation coefficient is defined as
where denotes the correlation coefficient of signal i and signal j, denotes the covariance of signal i and signal j, denotes the variance of signal i, and denotes the variance of signal j. According to Equation (9), a correlation of +1 indicates a perfect positive correlation, meaning that signal i and signal j change in the same direction simultaneously.
The correlation coefficients of the circumferential strain and circumferential stress signals at Point1 with the fluid pressure signal calculated by Equation (9) were 0.9256 and 0.9225, respectively, which were both very close to 1. A conclusion can be drawn that the variation of circumferential stress and strain at Point1 was highly positively correlated to the pressure fluctuation of internal fluid. We also compared the circumferential stress and strain signals at Point2 and Point3 with the fluid pressure signal. Similar conclusions can be drawn from the correlation coefficients, as shown in Table 1. Thus, the pressure fluctuation of internal fluid can be measured indirectly by measuring the variation of circumferential stress and strain of the pipe wall.
4.2. Electromechanical Coupling Analysis
As shown in Figure 2, the crystal orientation of flexible PVDF piezoelectric film made it suitable for the detection of circumferential stress and strain of the pipe wall. Circumferential strain and circumferential stress signals at Point1 were compared with the voltage signal of the piezoelectric thin film labeled PVDF1, as shown in Figure 8a,b. The correlation coefficients were 0.9437 and 0.9570, respectively. Comparison of signals measured at Point2 and Point3 are listed in Table 2. Thus, it can be concluded that the voltage variation of PVDF piezoelectric film sensor was highly positively correlated with the variation of circumferential stress and strain of the pipe wall.
In conclusion, the PVDF piezoelectric film sensor can be applied to indirectly measure the pressure fluctuation of internal fluid by measuring the variation of circumferential stress and strain of the pipe wall.
5. Influences of Flow Velocity Pulsation and Mechanical Vibration
The above study was conducted without taking into consideration influences outside the pipeline system. The flow velocity pulsation and mechanical vibration caused by the pipeline pump in the actual pipeline system affect the measurement accuracy of the PVDF piezoelectric film sensor. Therefore, we next performed two simulations to analyze these two sources of influence.
5.1. Flow Velocity Pulsation
To study the influence of flow velocity pulsation, we set the internal fluid to pulsation flow. First, the influence of pulsation frequency was studied. Under the premise that the inlet velocity was still 1.6 m/s, the pulsation frequencies were set to 5, 10, 20, and 40 Hz. The pulsation amplitudes were all set to 0.1 m/s, which meant that the flow velocity oscillated between 1.5 m/s and 1.7 m/s. Keeping all the other conditions unchanged, we compared the circumferential stress and strain signals of the pipe wall and the fluid pressure signal with the voltage signal of PVDF piezoelectric thin film on the basis of the simulation results. The correlation coefficients are listed in Table 3 and Table 4. It can be seen that the flow velocity pulsation frequency had little influence on the measurements of the variation of circumferential stress and strain of the pipe wall and the fluid pressure fluctuation.
Then, the influence of pulsation amplitude was studied. The pulsation amplitudes were set to 0.025 m/s, 0.05 m/s, and 0.1 m/s, and the pulsation frequencies were all set to 40 Hz. Keeping other conditions unchanged, we compared the circumferential stress and strain signals of the pipe wall and the fluid pressure signal with the voltage signal of PVDF piezoelectric thin film on the basis of simulation results. The correlation coefficients are listed in Table 5 and Table 6. Figure 9a–c shows the curves of physical quantities (circumferential stress and strain of the pipe wall and fluid pressure) in comparison with voltage signals, as pulsation frequency was 40 Hz and pulsation amplitude was 0.1 m/s. It can be concluded from Table 5 and Table 6 and Figure 9 that the flow velocity pulsation amplitude had little influence on the measurement of the PVDF piezoelectric film sensor. In conclusion, the flow velocity pulsation caused by the pipeline pump had little influence on the measurements of the variation of circumferential stress and strain of the pipe wall as well as the internal fluid pressure fluctuation by PVDF piezoelectric film sensor. Moreover, the accuracy of measurement was higher when the PVDF piezoelectric film sensor was placed in the middle of the pipe.
5.2. Mechanical Vibration
Because the fluid-conveying pipe is fixed at regular intervals with fixing devices to reduce pipe vibration in actual application, we added hoops to fix the pipe model to better simulate it. The inner diameter of the hoop was 68 mm. The hoop width was 6 mm, and the hoop thickness was 2 mm. Since steel has large rigidity and it is difficult to deform, it is suitable to use this material to support the pipeline structure. The hoop material was specified to be structural steel, of which the density was 7850 kg/m3, Young’s modulus was 200 GPa, and Poisson’s ratio was 0.3. To study the influence of mechanical vibration, we applied a sinusoidal vibration (Y direction) to the inlet and outlet faces of the pipe, as shown in Figure 10a. First, the influence of the mechanical vibration frequency was studied. The vibration frequencies were set to 5, 10, 20, and 40 Hz, and the vibration amplitudes were all set to 0.1 mm. Simultaneously, the pulsation amplitudes of the flow velocity were set to 0.1 m/s, and the pulsation frequencies were set to 40 Hz. Figure 10b shows the sinusoidal vibration as the vibration frequency was 40 Hz and the vibration amplitude was 0.1 mm. Keeping other settings unchanged, we compared the circumferential stress and strain signals of the pipe wall and the fluid pressure signal with the voltage signal of PVDF piezoelectric thin film on the basis of simulation results. The correlation coefficients are listed in Table 7 and Table 8. It is shown that the mechanical vibration frequency had little influence on the strong correlation between physical quantities (including circumferential stress and strain of the pipe wall and fluid pressure) and the signal of the PVDF piezoelectric film sensor when both ends of the pipe were fixed by hoops.
Then, the influence of the mechanical vibration amplitude was studied. The vibration amplitudes were set to 0.1, 0.2, 0.3, and 0.4 mm, and the vibration frequencies were all set to 40 Hz. Keeping all the other settings unchanged, we compared the circumferential stress and strain signals of the pipe wall and the fluid pressure signal with the voltage signal of PVDF piezoelectric thin film on the basis of simulation results. The correlation coefficients between physical quantities and PVDF signals are listed in Table 9 and Table 10. Figure 11a–c displays the curves that compared the physical quantities and the measured signal of PVDF films as the vibration frequency was 40 Hz and the vibration amplitude was 0.1 mm. It can be concluded from Table 9 and Table 10 and Figure 11 that the mechanical vibration amplitude had little influence on the measurement of the PVDF piezoelectric film sensor. In conclusion, the mechanical vibration caused by the pipeline pump had little influence on the measurements of the variation of circumferential stress and strain of the pipe wall as well as the internal fluid pressure fluctuation by PVDF piezoelectric film sensor when both ends of the pipe were fixed by hoops.
6. Experimental Testing
The experimental setup for the fluid-conveying pipe was composed of three parts: pipeline systems, PVDF piezoelectric film sensors for measurement, and the system for signal acquisition and processing, as shown in Figure 12. To minimize possible electromagnetic interference from outside environment, we installed a shield case to cover the PVDF piezoelectric film sensors.
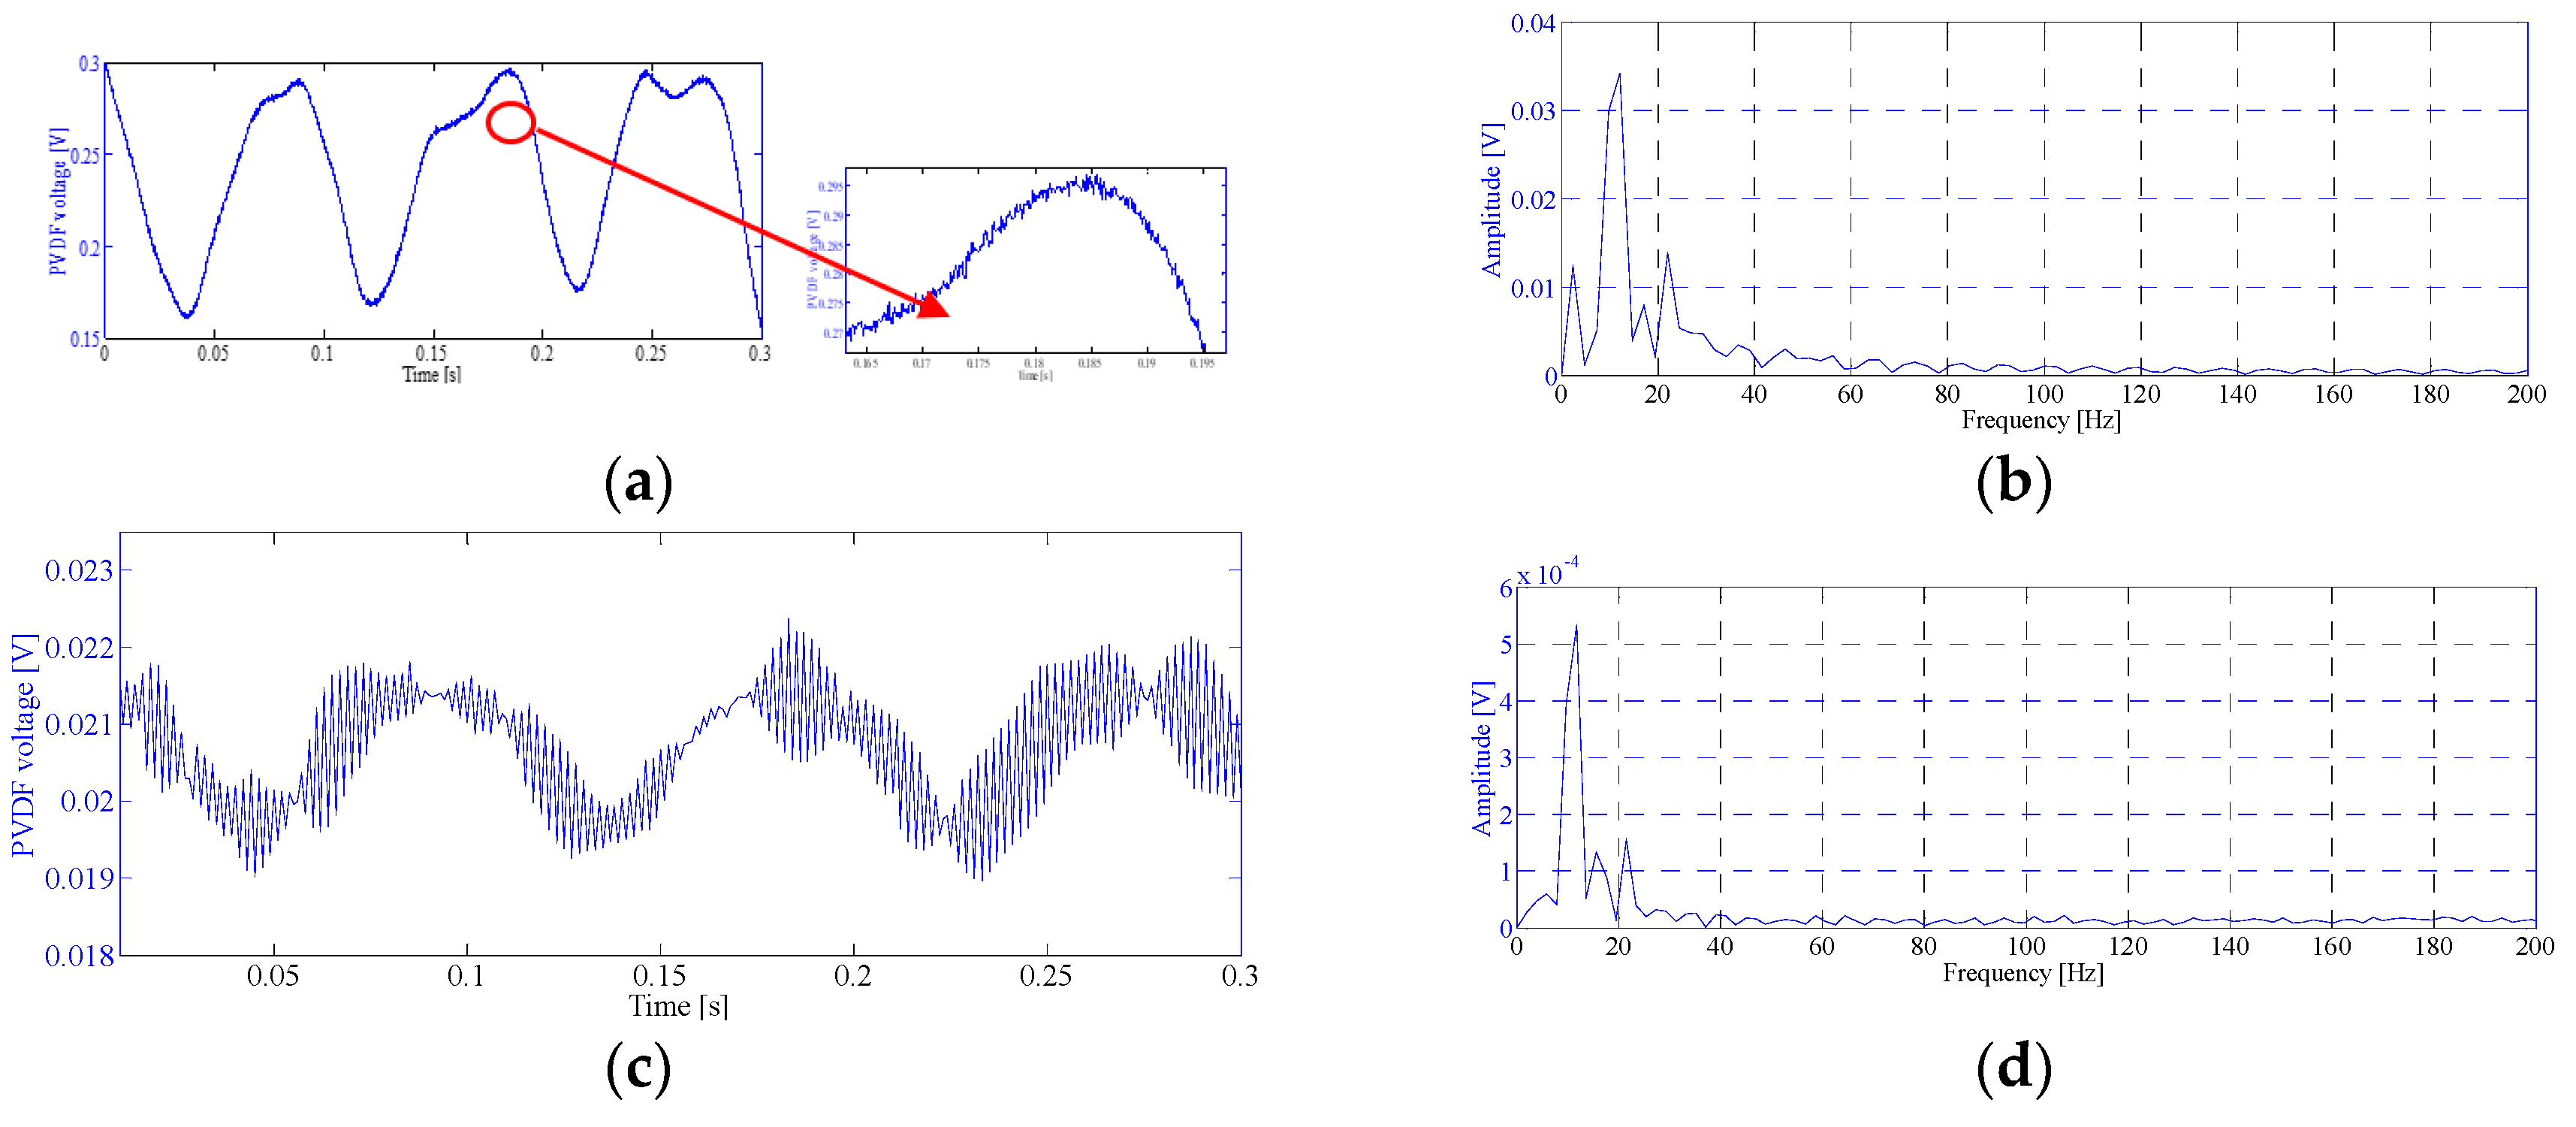
The experimental data, the voltage of PVDF piezoelectric film sensors, were filtered and amplified by a preamplifier circuit, as shown in Figure 13a. Spectrum analysis of the experimental data is shown in Figure 13b. The simulation data under the same flow velocity are shown in Figure 13c, and their spectrum analysis is shown in Figure 13d.
From Figure 13, it can be seen that the curve patterns of the simulation results and experimental results matched well when the mean velocity of the internal fluid was 1.6 m/s. Moreover, the dominant vibration frequency of the experimental results was 11 Hz, which differed from the simulation results only in its magnitude. The possible reasons were as follows: (1) the preamplifier circuit amplified the measured voltage of the PVDF piezoelectric film sensor; (2) the boundary condition constraint was different, namely, the hoops in the experimental measurement for the displacement restraint capacity of the actual pipe was much smaller than fixed support in the simulation; (3) the amplitudes of the flow velocity pulsation and mechanical vibration were set too small in the simulation, making the turbulence simulation signal obvious; (4) the simulation results were obtained under ideal conditions, while the experimental results were measured under realistic conditions (environmental temperature, noise interference, etc.), and thus there will be differences. We will continue to research and analyze this in the future.
7. Conclusions
In this paper, we first analyzed the circumferential stress and strain signals of the pipe wall and the fluid pressure signal on the basis of the FSI and found that the variation of circumferential stress and strain of the pipe wall was highly positively correlated with the pressure fluctuation of internal fluid. We next analyzed the voltage signal of PVDF piezoelectric thin film and the circumferential stress and strain signals of the pipe wall on the basis of the electromechanical coupling and found that the voltage variation of PVDF piezoelectric film sensor was highly positively correlated with the variation of circumferential stress and strain of the pipe wall. In conclusion, the PVDF piezoelectric film sensor can be applied to indirectly measure the pressure fluctuation of internal fluid by measuring the variation of circumferential stress and strain of the pipe wall. Then, the influences of flow velocity pulsation and mechanical vibration caused by the pipeline pump were studied. It was found that the flow velocity pulsation had little influence on the measurements of the variation of circumferential stress and strain of the pipe wall and the internal fluid pressure fluctuation; the mechanical vibration had little influence on the measurements of the variation of circumferential stress and strain of the pipe wall as well as the internal fluid pressure fluctuation by PVDF piezoelectric film sensor when both ends of the pipe were fixed by hoops. Finally, the simulation was verified by experiments. Therefore, the above research is of great significance and can guide the application of the PVDF piezoelectric film sensor in practical engineering measurements of fluid flow parameters in pipe-like structures.
Author Contributions
Conceptualization, S.L. and X.W.; data curation, S.L. and Y.K.; formal analysis, S.L. and X.W.; funding acquisition, X.W.; investigation, S.L. and X.W.; methodology, S.L. and X.W.; project administration, X.W.; resources, X.W.; software, X.P.; supervision, X.W. and X.P.; validation, S.L. and X.W.; visualization, S.L. and X.W.; writing—original draft, S.L., X.W. and Y.K.; writing—review and editing, S.L., X.W., Y.K. and X.P. All authors have read and agreed to the published version of the manuscript.
Funding
This research was funded by National Natural Science Foundation of China, grant number 11674351.
Institutional Review Board Statement
Not applicable.
Informed Consent Statement
Not applicable.
Data Availability Statement
Not applicable.
Conflicts of Interest
The authors declare no conflict of interest.
References
- Wang, T. Dynamic Analysis and Vibration Control Analysis of Liquid-Conveying Pipe System Based on ANSYS Workbench; Hebei University of Science & Technology: Shijiazhuang, China, 2011. [Google Scholar]
- Drewczynski, M.; Solution, G.E.; Rzadkowski, R. A stress analysis of a compressor blade in partially blocked inlet condition. Proc. Inst. Mech. Eng. Part G J. Aerosp. Eng. 2015, 230, 934–952. [Google Scholar] [CrossRef]
- Gong, C.D.; Lee, H.S.; Kim, I.K. Aerodynamic and Structural Design of A High Efficiency Small Scale Composite V ertical Axis Wind Turbine Blade. J. Korean Soc. Aeronaut. Space Sci. 2011, 39, 758–765. [Google Scholar]
- Kang, H.S.; Kim, Y.J. Optimal design of impeller for centrifugal compressor under the influence of one-way fluid-structure interaction. J. Mech. Sci. Technol. 2016, 30, 3953–3959. [Google Scholar] [CrossRef]
- Ying, Q.; Zhuge, W.; Zhang, Y.; Zhang, L. Design Optimization of A Small Scale High Expansion Ratio Organic Vapour Turbo Expander for Automotive Application. Energy Procedia 2017, 129, 1133–1140. [Google Scholar] [CrossRef]
- Gu, Y.; Pei, J.; Yuan, S.; Xing, L.; Stephen, C.; Zhang, F.; Wang, X. Effects of blade thickness on hydraulic performance and structural dynamic characteristics of high-power coolant pump at overload condition. Proc. Inst. Mech. Eng. Part A J. Power Energy 2018, 232, 992–1003. [Google Scholar] [CrossRef]
- Chen, X. Study on the Dynamic Characteristics of Hydraulic Flexible Pipe Fluid-Structure Coupling Vibration; Hunan University of Science and Technology: Xiangtan, China, 2015. [Google Scholar]
- Dai, Z. Vibration Analysis of L Type Hydraulic Bellows Based on Fluid Solid Coupling; Hunan University of Science and Technology: Xiangtan, China, 2017. [Google Scholar]
- Liu, B.; Chen, Z.; Bao, J.; Cui, Z. Numerical simulation for effects of pipeline internal flow on vibration of flexible marine pipe. J. Vib. Shock 2020, 39, 117–185. [Google Scholar]
- Yang, C.; Yi, M. Numerical solution of fluid-structure interaction in liquid-filled pipes by method of characteristics. J. Chin. J. Mech. Eng. 2007, 20, 48–53. [Google Scholar] [CrossRef]
- Nan, B.; Lchiki, M.; Ueno, N.; Fukuda, O.; Akiyama, M. A flexible piezoelectric film sensor for fault diagnosis of pipe systems. In Proceedings of the 33rd IEEE Annual Conference on Industrial Electronics Society, Taipei, Taiwan, 5–8 November 2007; pp. 2181–2186. [Google Scholar]
- Liang, R.; Wang, Q.M. Pulse pressure sensor based on flexible PZT thick-film composite device. In Proceedings of the 2014 IEEE International Ultrasonics Symposium, Chicago, IL, USA, 3–6 September 2014; pp. 1559–1562. [Google Scholar]
- Muggleton, J.M.; Brennan, M.J.; Pinnington, R.J.; Gao, Y. A novel sensor for measuring the acoustic pressure in buried plastic water pipes. J. Sound Vib. 2006, 295, 1085–1098. [Google Scholar] [CrossRef]
- Okosun, F.; Cahill, P.; Hazra, B.; Pakrashi, V. Vibration-based leak detection and monitoring of water pipes using output-only piezoelectric sensors. Eur. Phys. J. Spec. Top. 2019, 228, 1659–1675. [Google Scholar] [CrossRef]
- Okosun, F.; Celikin, M.; Pakrashi, V. A Numerical Model for Experimental Designs of Vibration-Based Leak Detection and Monitoring of Water Pipes Using Piezoelectric Patches. Sensors 2020, 20, 6708. [Google Scholar] [CrossRef] [PubMed]
- Ni, Z. Vibration Mechanics; Xi’an Jiaotong University Press: Xi’an, China, 1986; pp. 342–388. [Google Scholar]
- Peng, G.; Wang, Z.; Yan, Z.; Liu, R. Strength analysis of a large centrifugal dredge pump case. Eng. Fail. Anal. 2009, 16, 321–328. [Google Scholar]
- Saeed, R.; Galybin, A. Simplified model of the turbine runner blade. Eng. Fail. Anal. 2009, 16, 2473–2484. [Google Scholar] [CrossRef]
- Cook, R.D. Concepts and Applications of Finite Element Analysis; John Wiley & Sons: New York, NY, USA, 2002. [Google Scholar]
- Dong, X.; Peng, Z.; Zhang, W.; Hua, H.; Meng, G. Research on spillover effects for vibration control of piezoelectric smart structures by ANSYS. J. Math. Probl. Eng. 2014, 2014, 1–8. [Google Scholar] [CrossRef]
- Nicoud, F.; Frédéric, D. Subgrid-Scale Stress Modelling Based on the Square of the Velocity Gradient Tensor. J. Flow Turbul. Combust. 1999, 62, 183–200. [Google Scholar] [CrossRef]
Figure 1.
Transitive relation at fluid–structure interface.
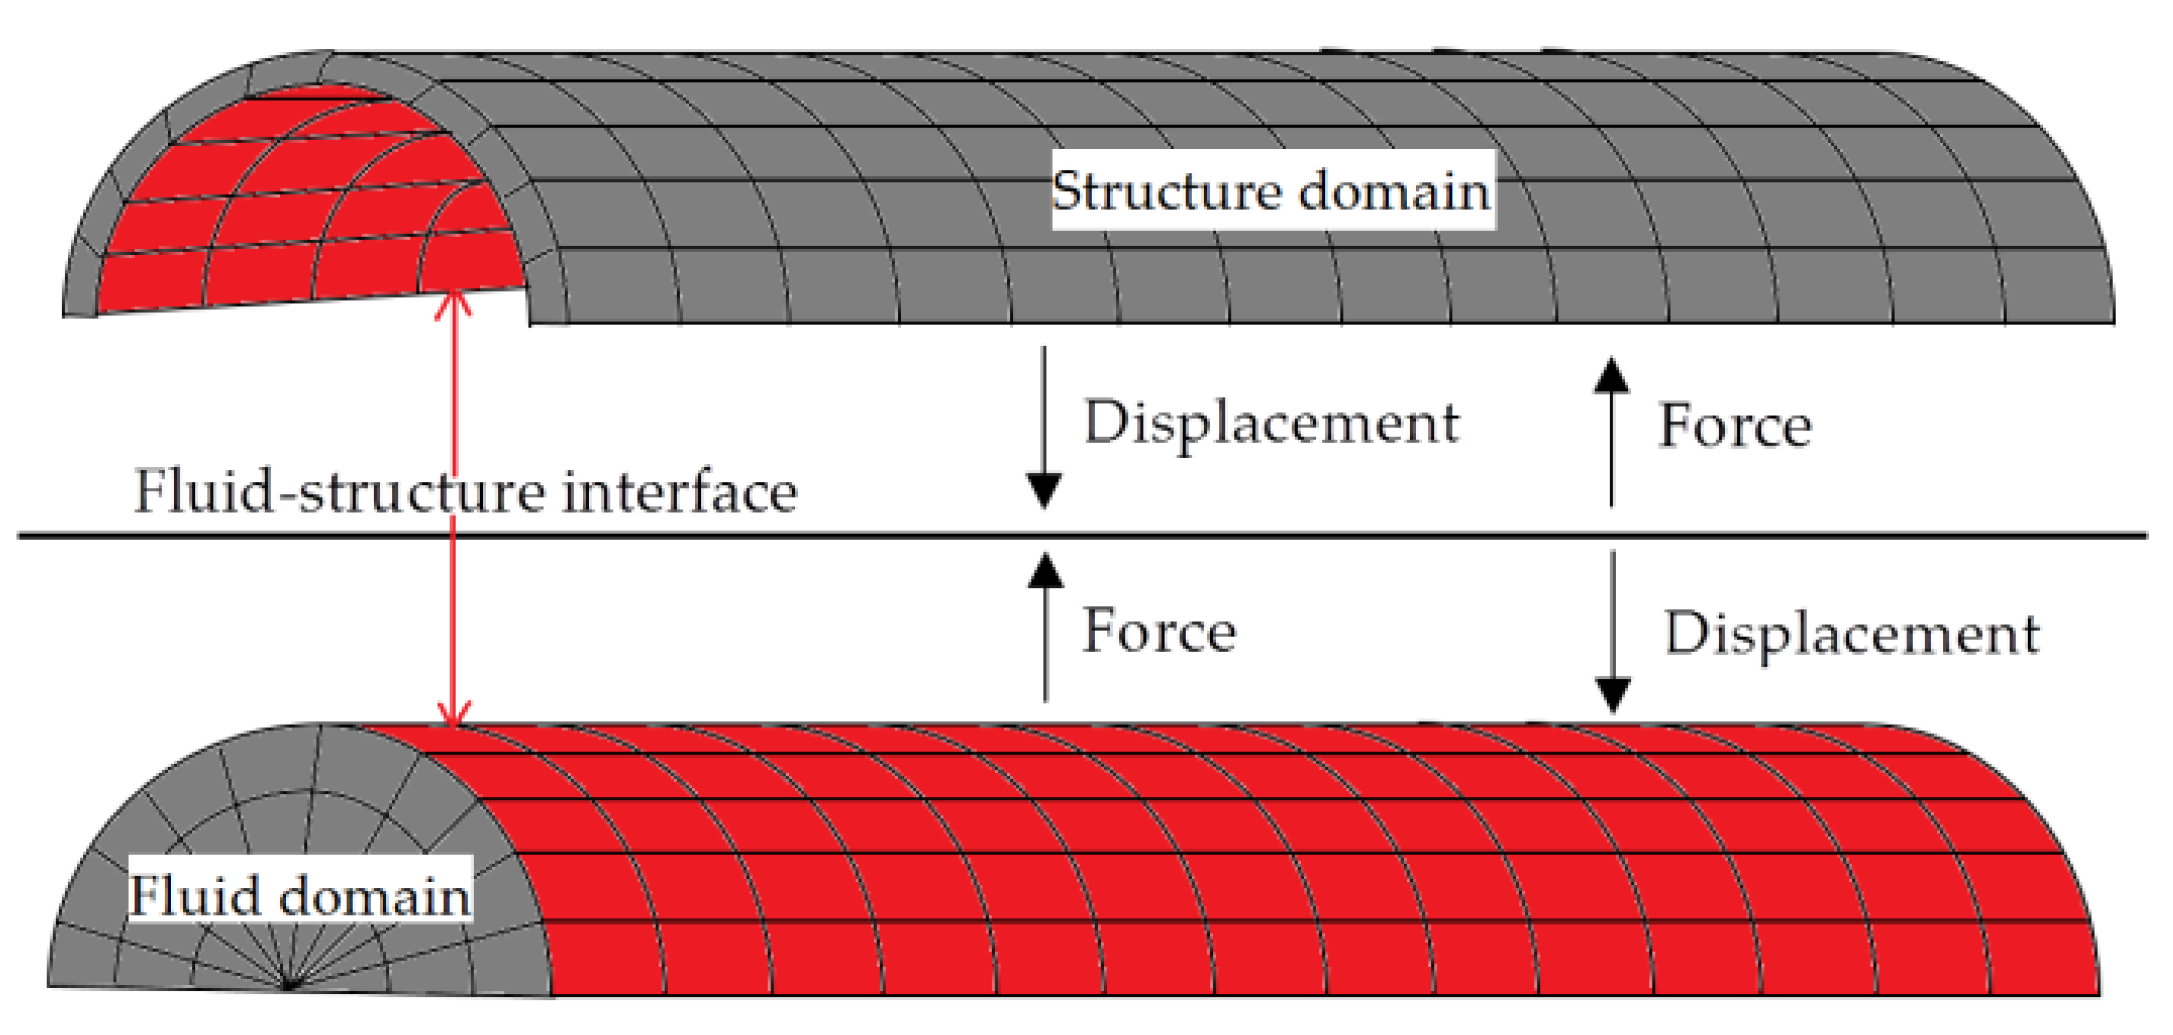
Figure 2.
The geometrical model.
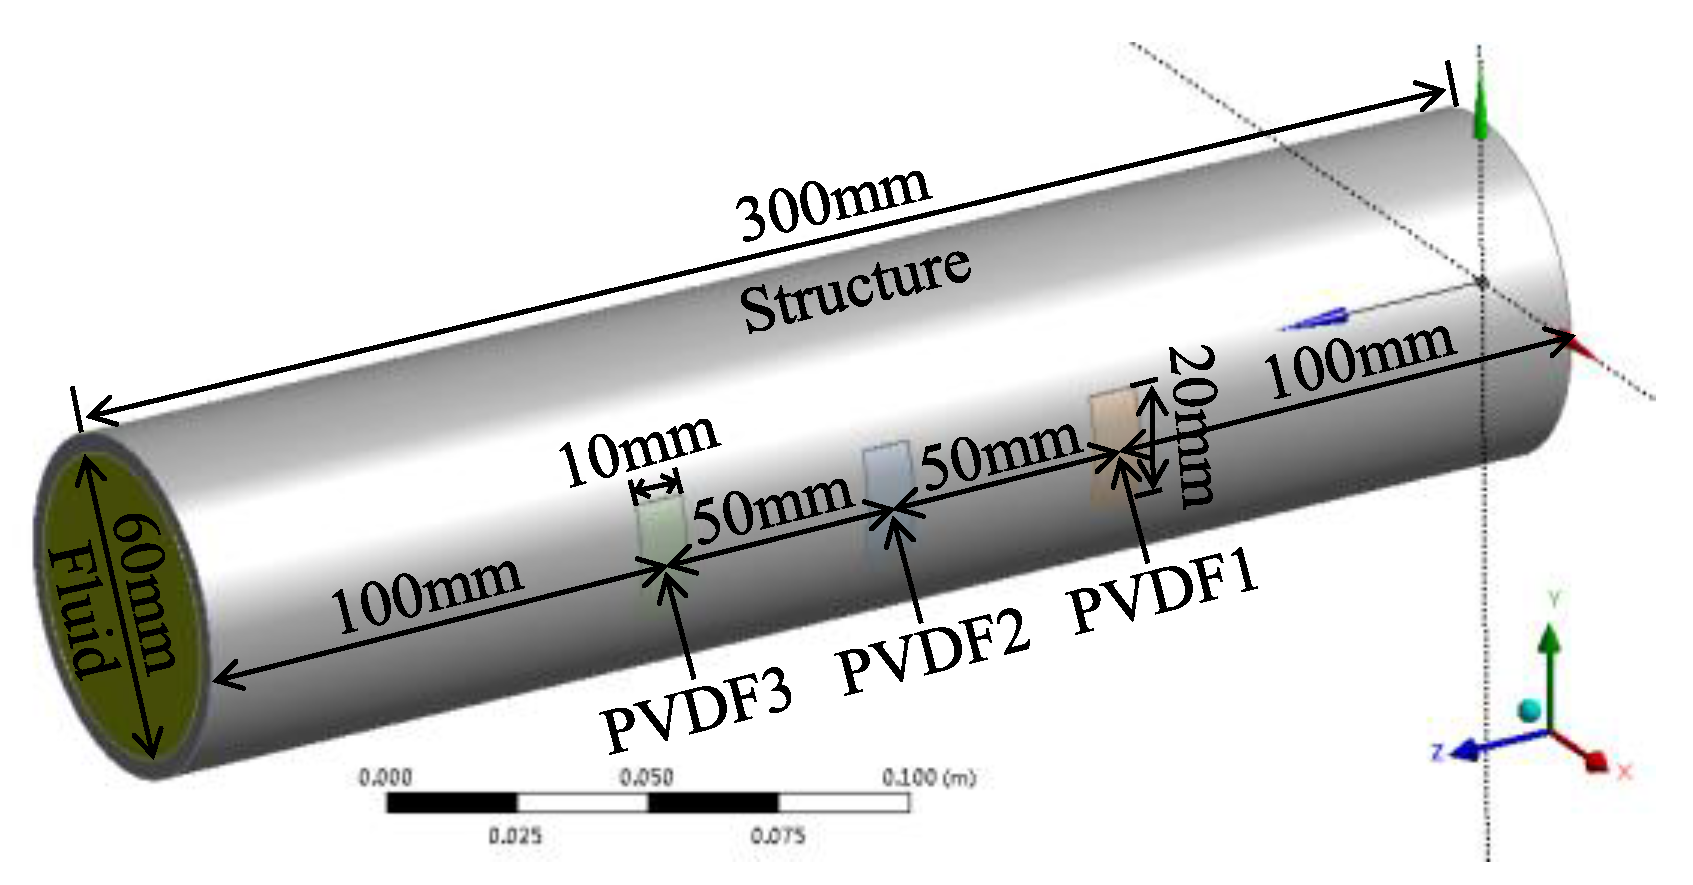
Figure 3.
The finite element model of fluid domain.
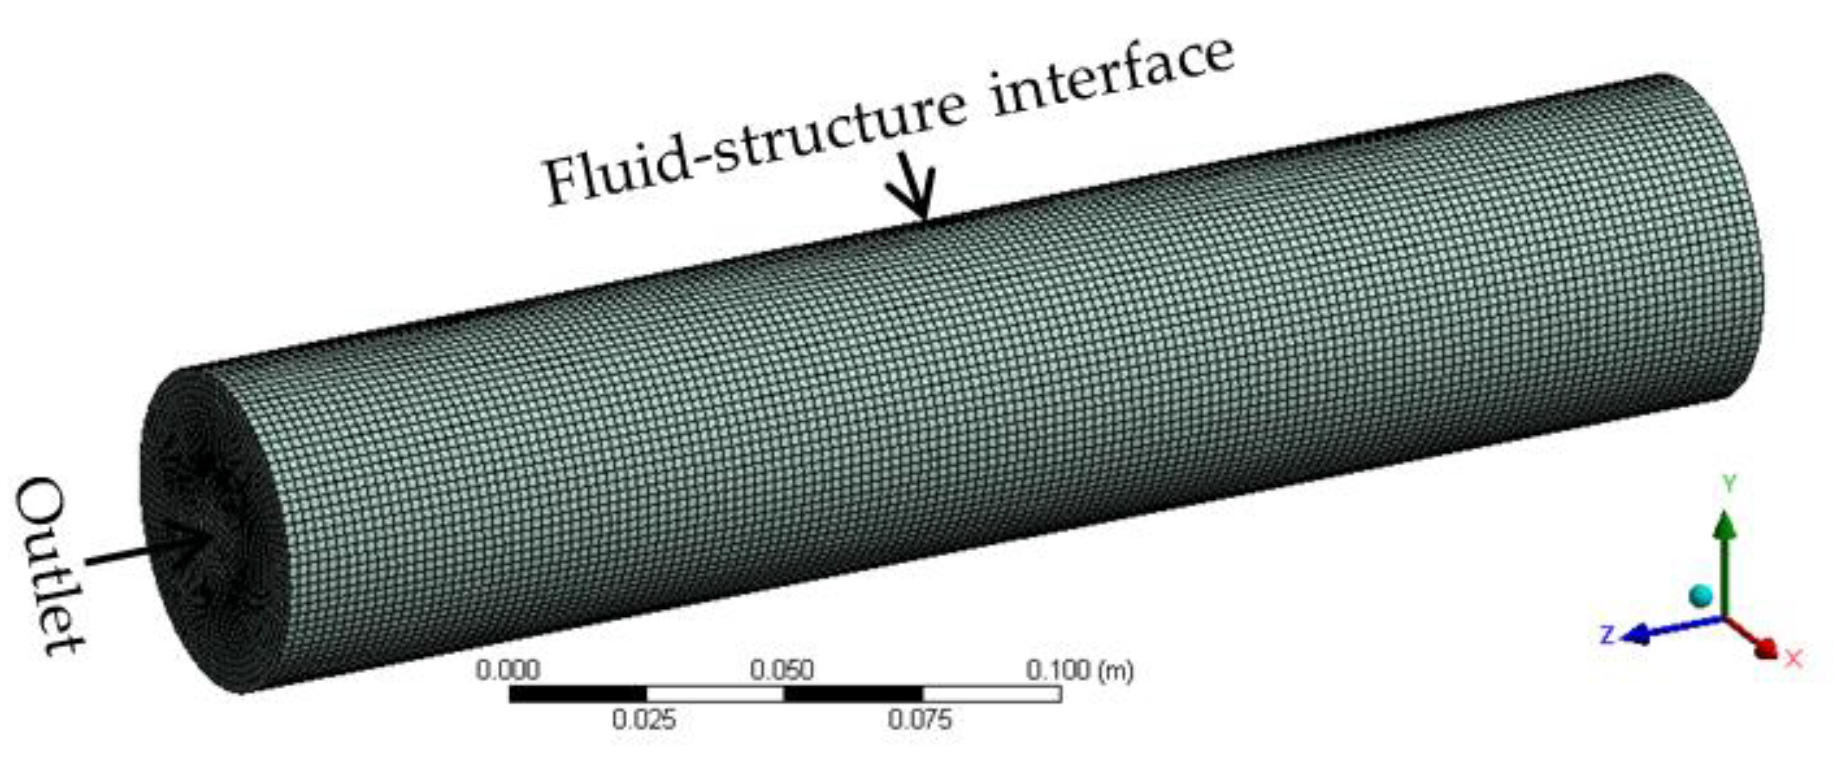
Figure 4.
The finite element model of pipe and polyvinylidene fluoride (PVDF) piezoelectric thin films.
Figure 4.
The finite element model of pipe and polyvinylidene fluoride (PVDF) piezoelectric thin films.
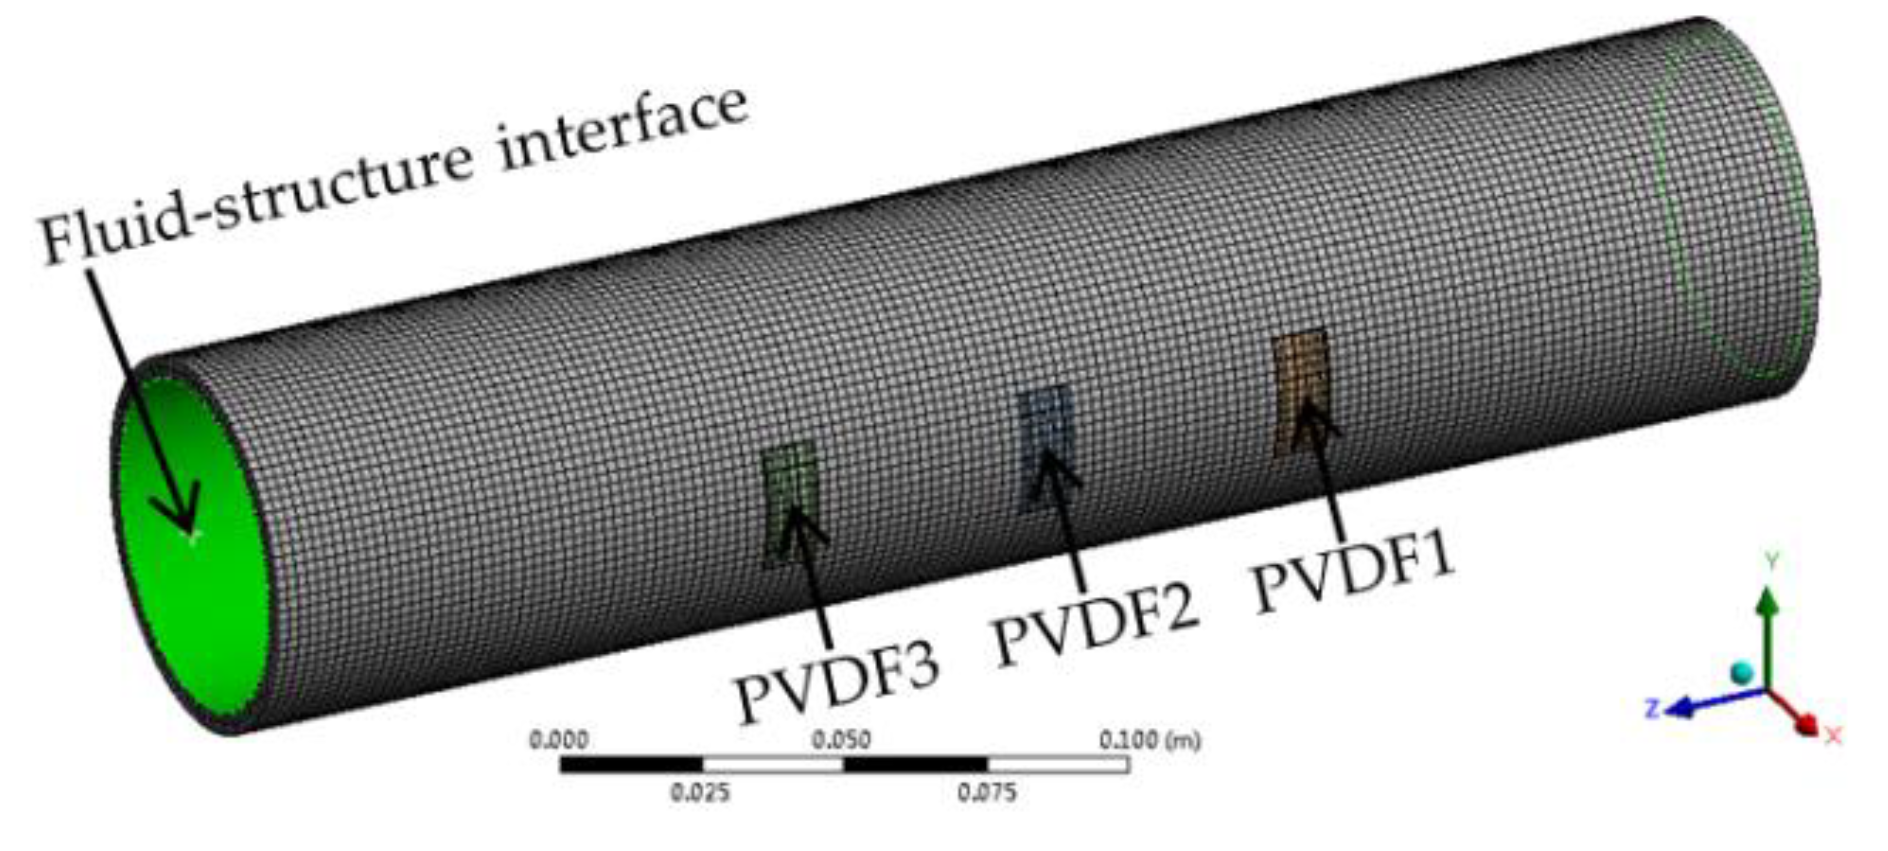
Figure 5.
Diagram of cross-sections.
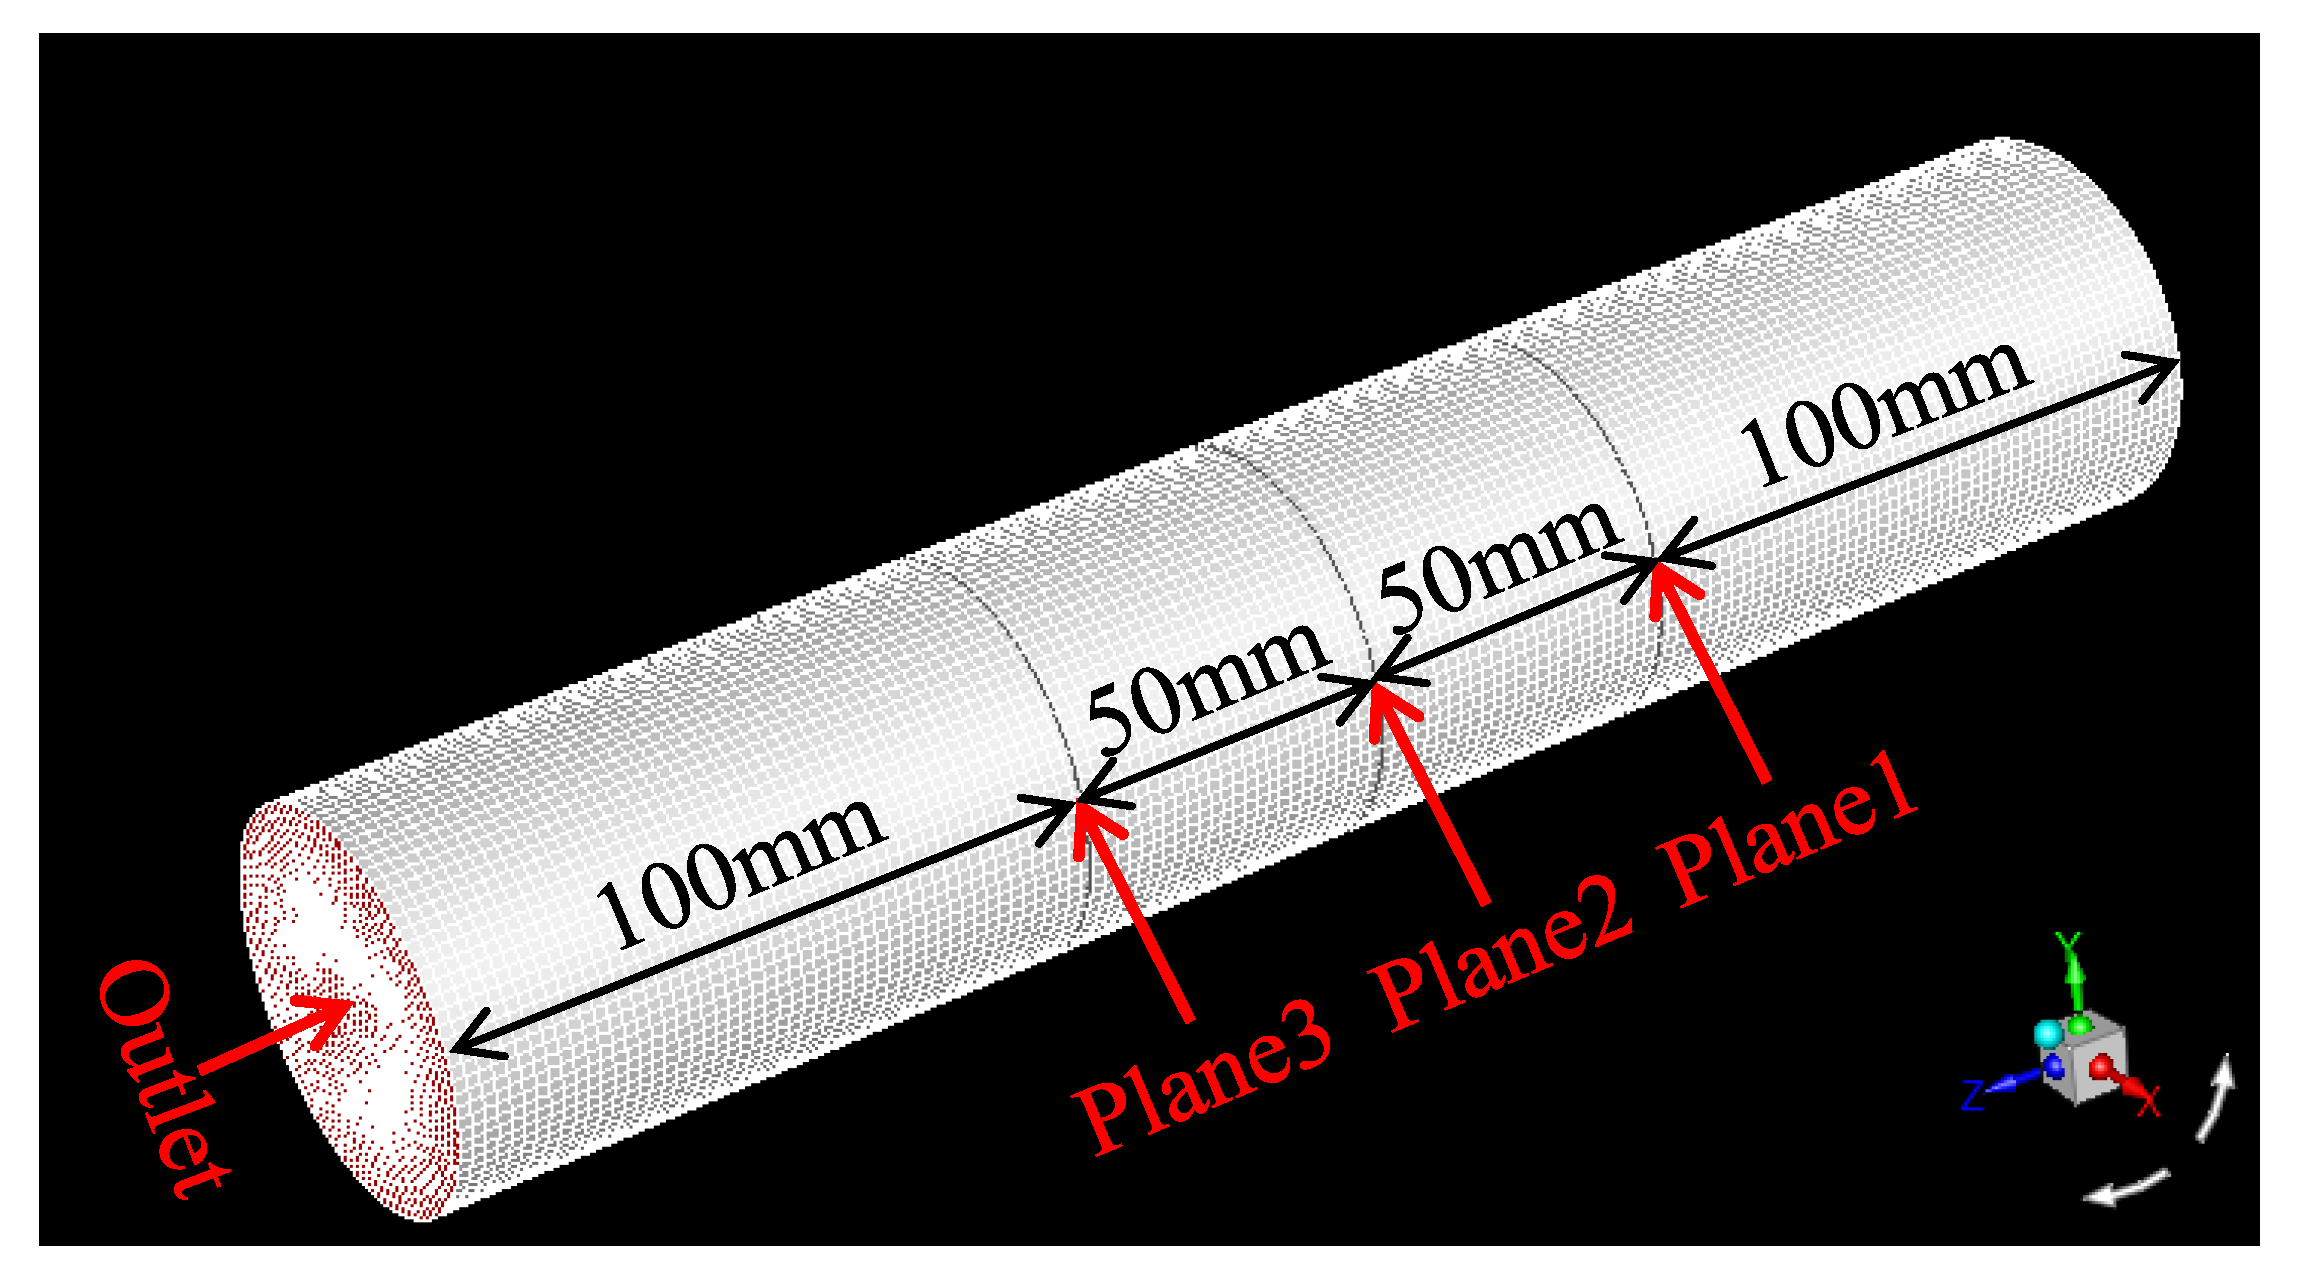
Figure 6.
Diagram of data extraction points.

Figure 7.
Comparison curves of (a) fluid pressure and circumferential strain at Point1; (b) fluid pressure and circumferential stress at Point1.
Figure 7.
Comparison curves of (a) fluid pressure and circumferential strain at Point1; (b) fluid pressure and circumferential stress at Point1.

Figure 8.
Comparison curves of (a) circumferential strain and PVDF voltage; (b) circumferential stress and PVDF voltage.
Figure 8.
Comparison curves of (a) circumferential strain and PVDF voltage; (b) circumferential stress and PVDF voltage.
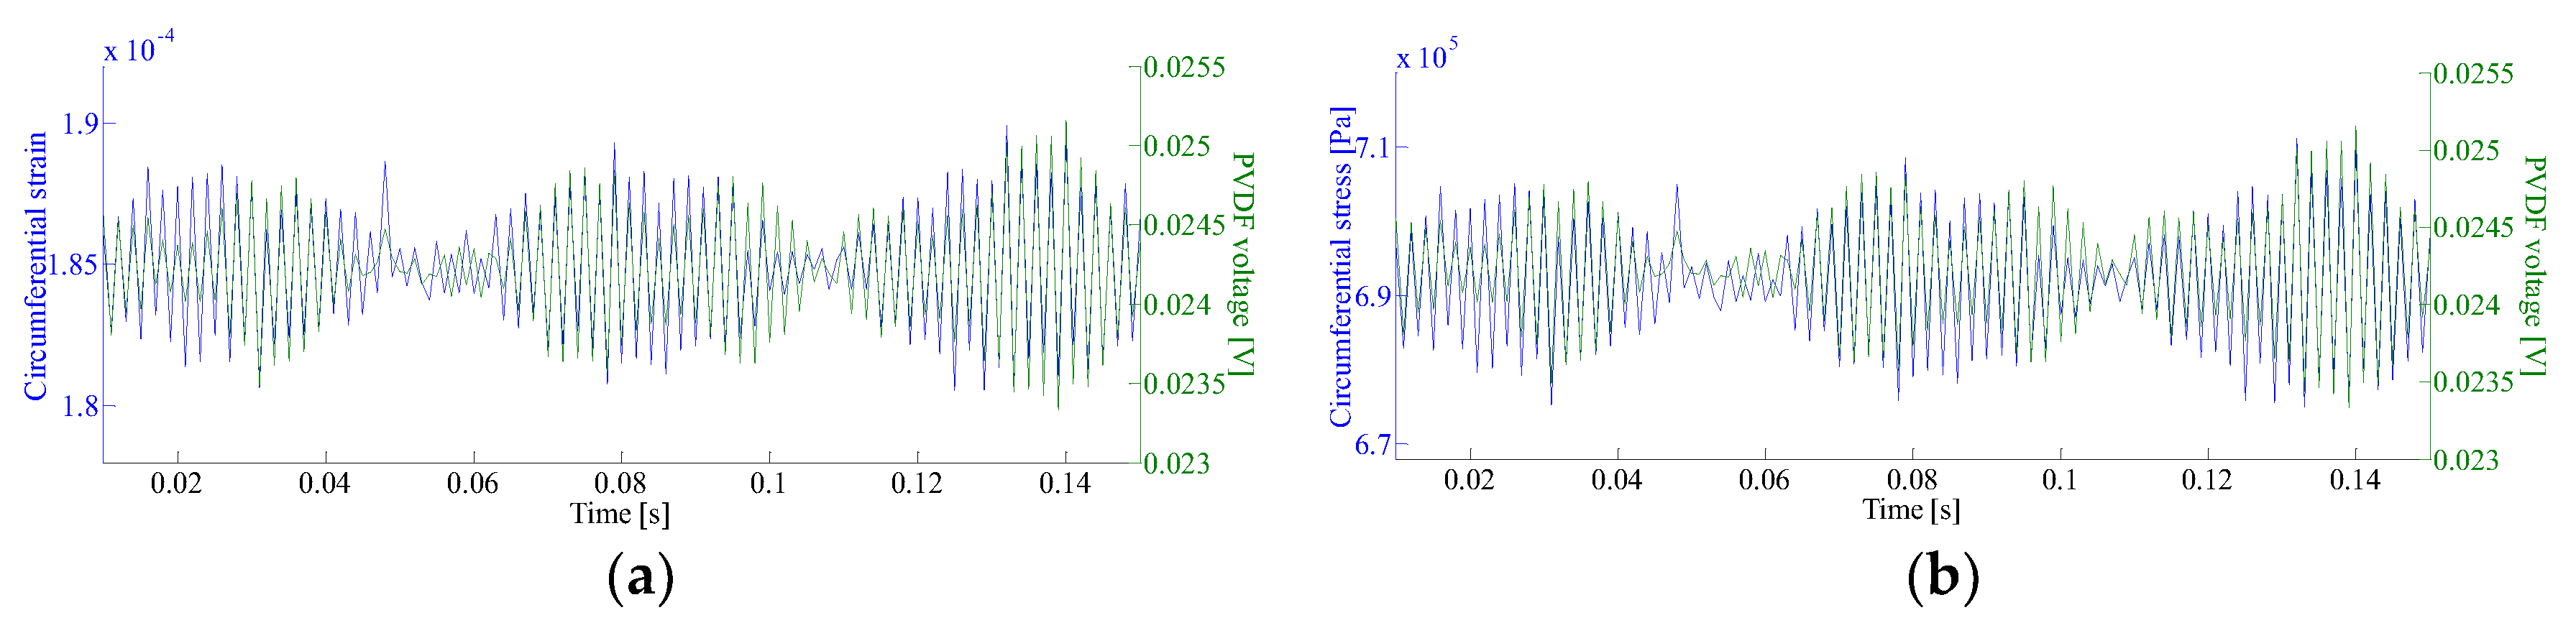
Figure 9.
Comparison curves of (a) circumferential strain at Point2 and PVDF2 voltage; (b) circumferential stress at Point2 and PVDF2 voltage; (c) fluid pressure and PVDF2 voltage.
Figure 9.
Comparison curves of (a) circumferential strain at Point2 and PVDF2 voltage; (b) circumferential stress at Point2 and PVDF2 voltage; (c) fluid pressure and PVDF2 voltage.

Figure 10.
Diagram of (a) mechanical vibration; (b) sinusoidal vibration.
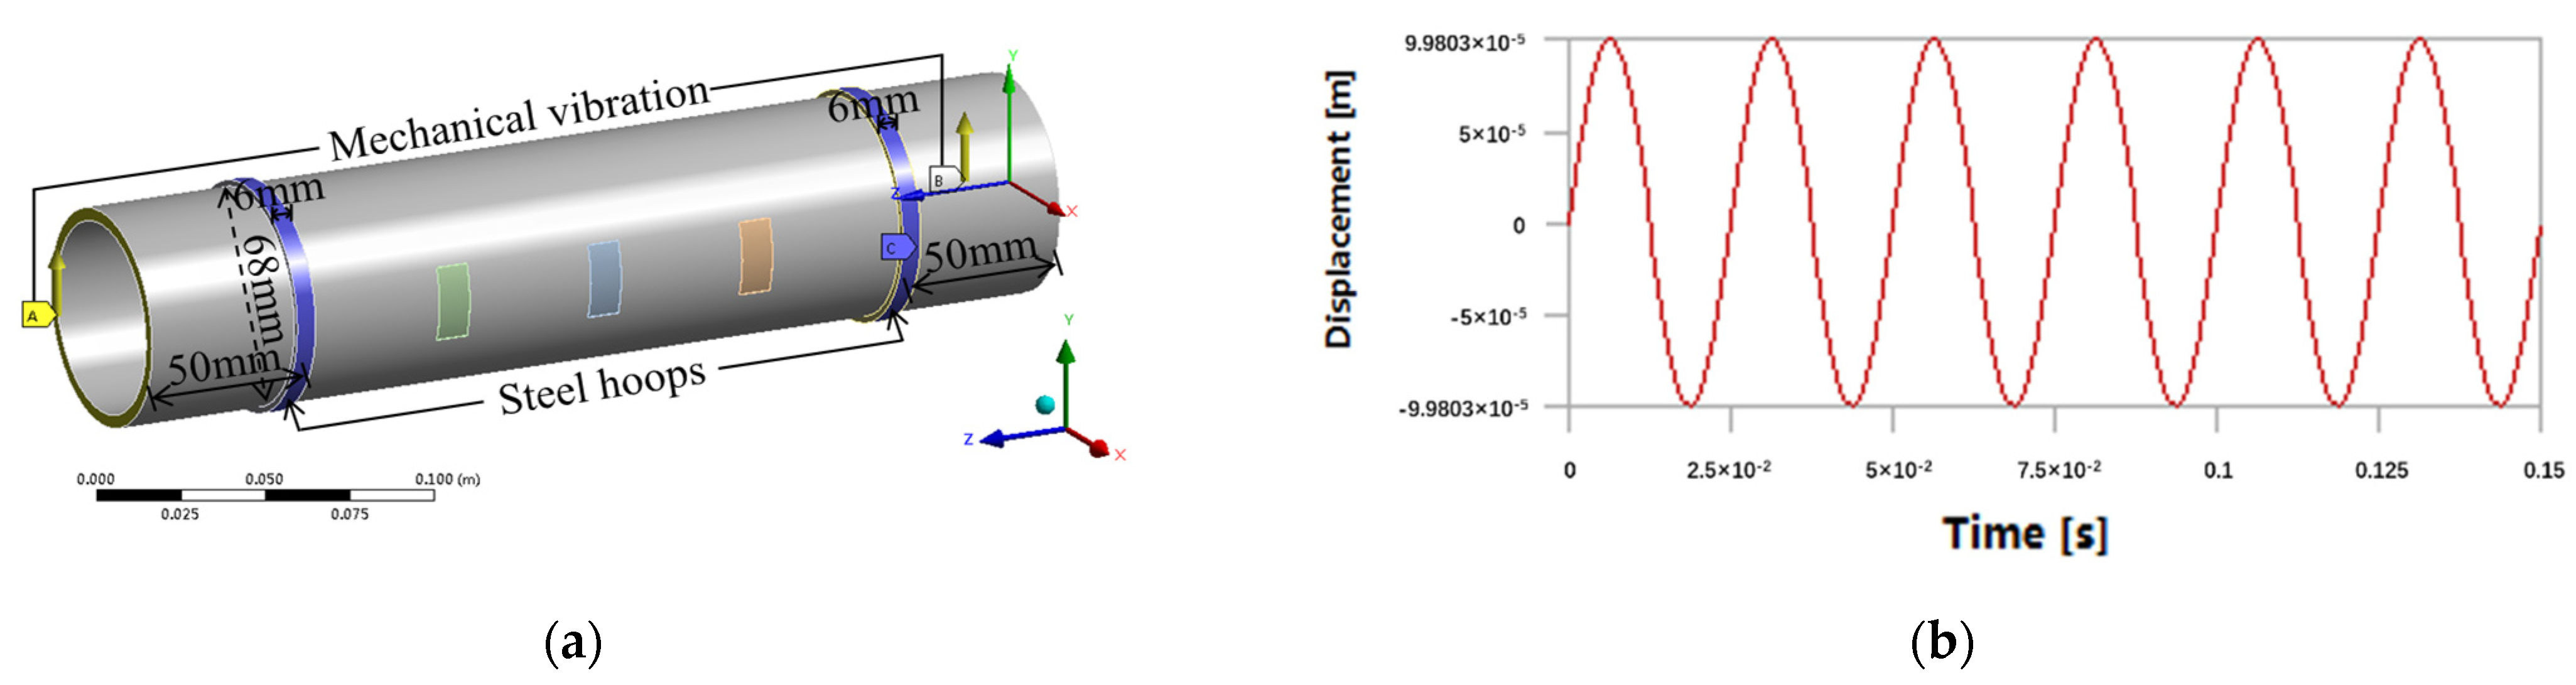
Figure 11.
Comparison curves of (a) circumferential strain at Point2 and PVDF2 voltage; (b) circumferential stress at Point2 and PVDF2 voltage; (c) fluid pressure and PVDF2 voltage.
Figure 11.
Comparison curves of (a) circumferential strain at Point2 and PVDF2 voltage; (b) circumferential stress at Point2 and PVDF2 voltage; (c) fluid pressure and PVDF2 voltage.
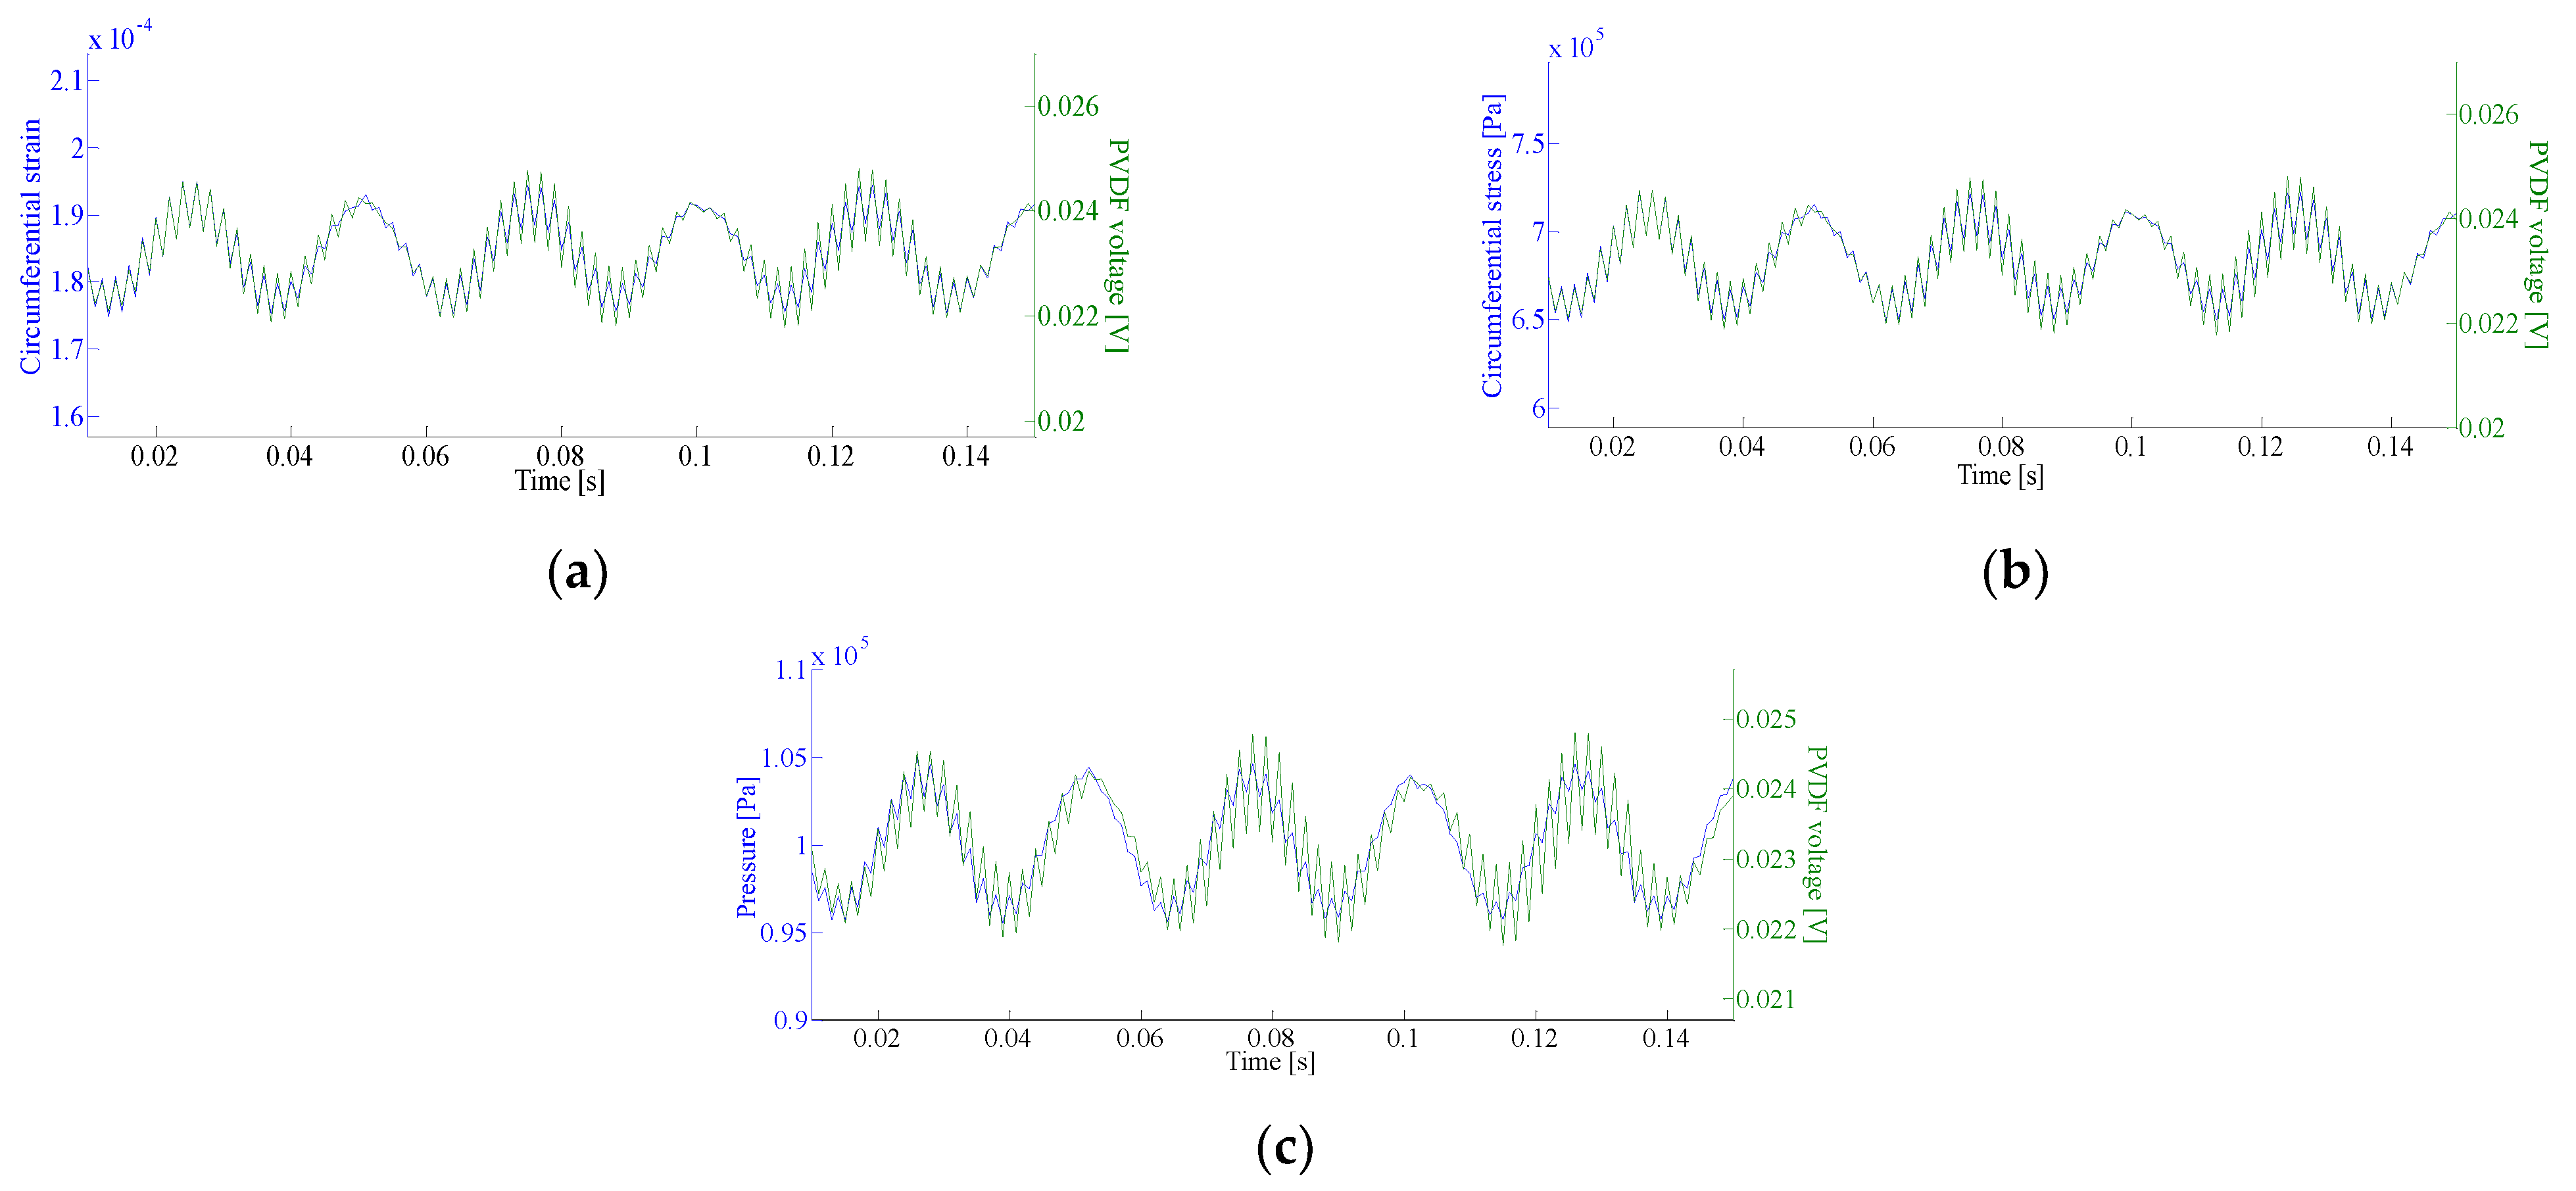
Figure 12.
Experimental setup: (a) panoramic view; (b) details of the pipe and the signal processing unit.
Figure 12.
Experimental setup: (a) panoramic view; (b) details of the pipe and the signal processing unit.
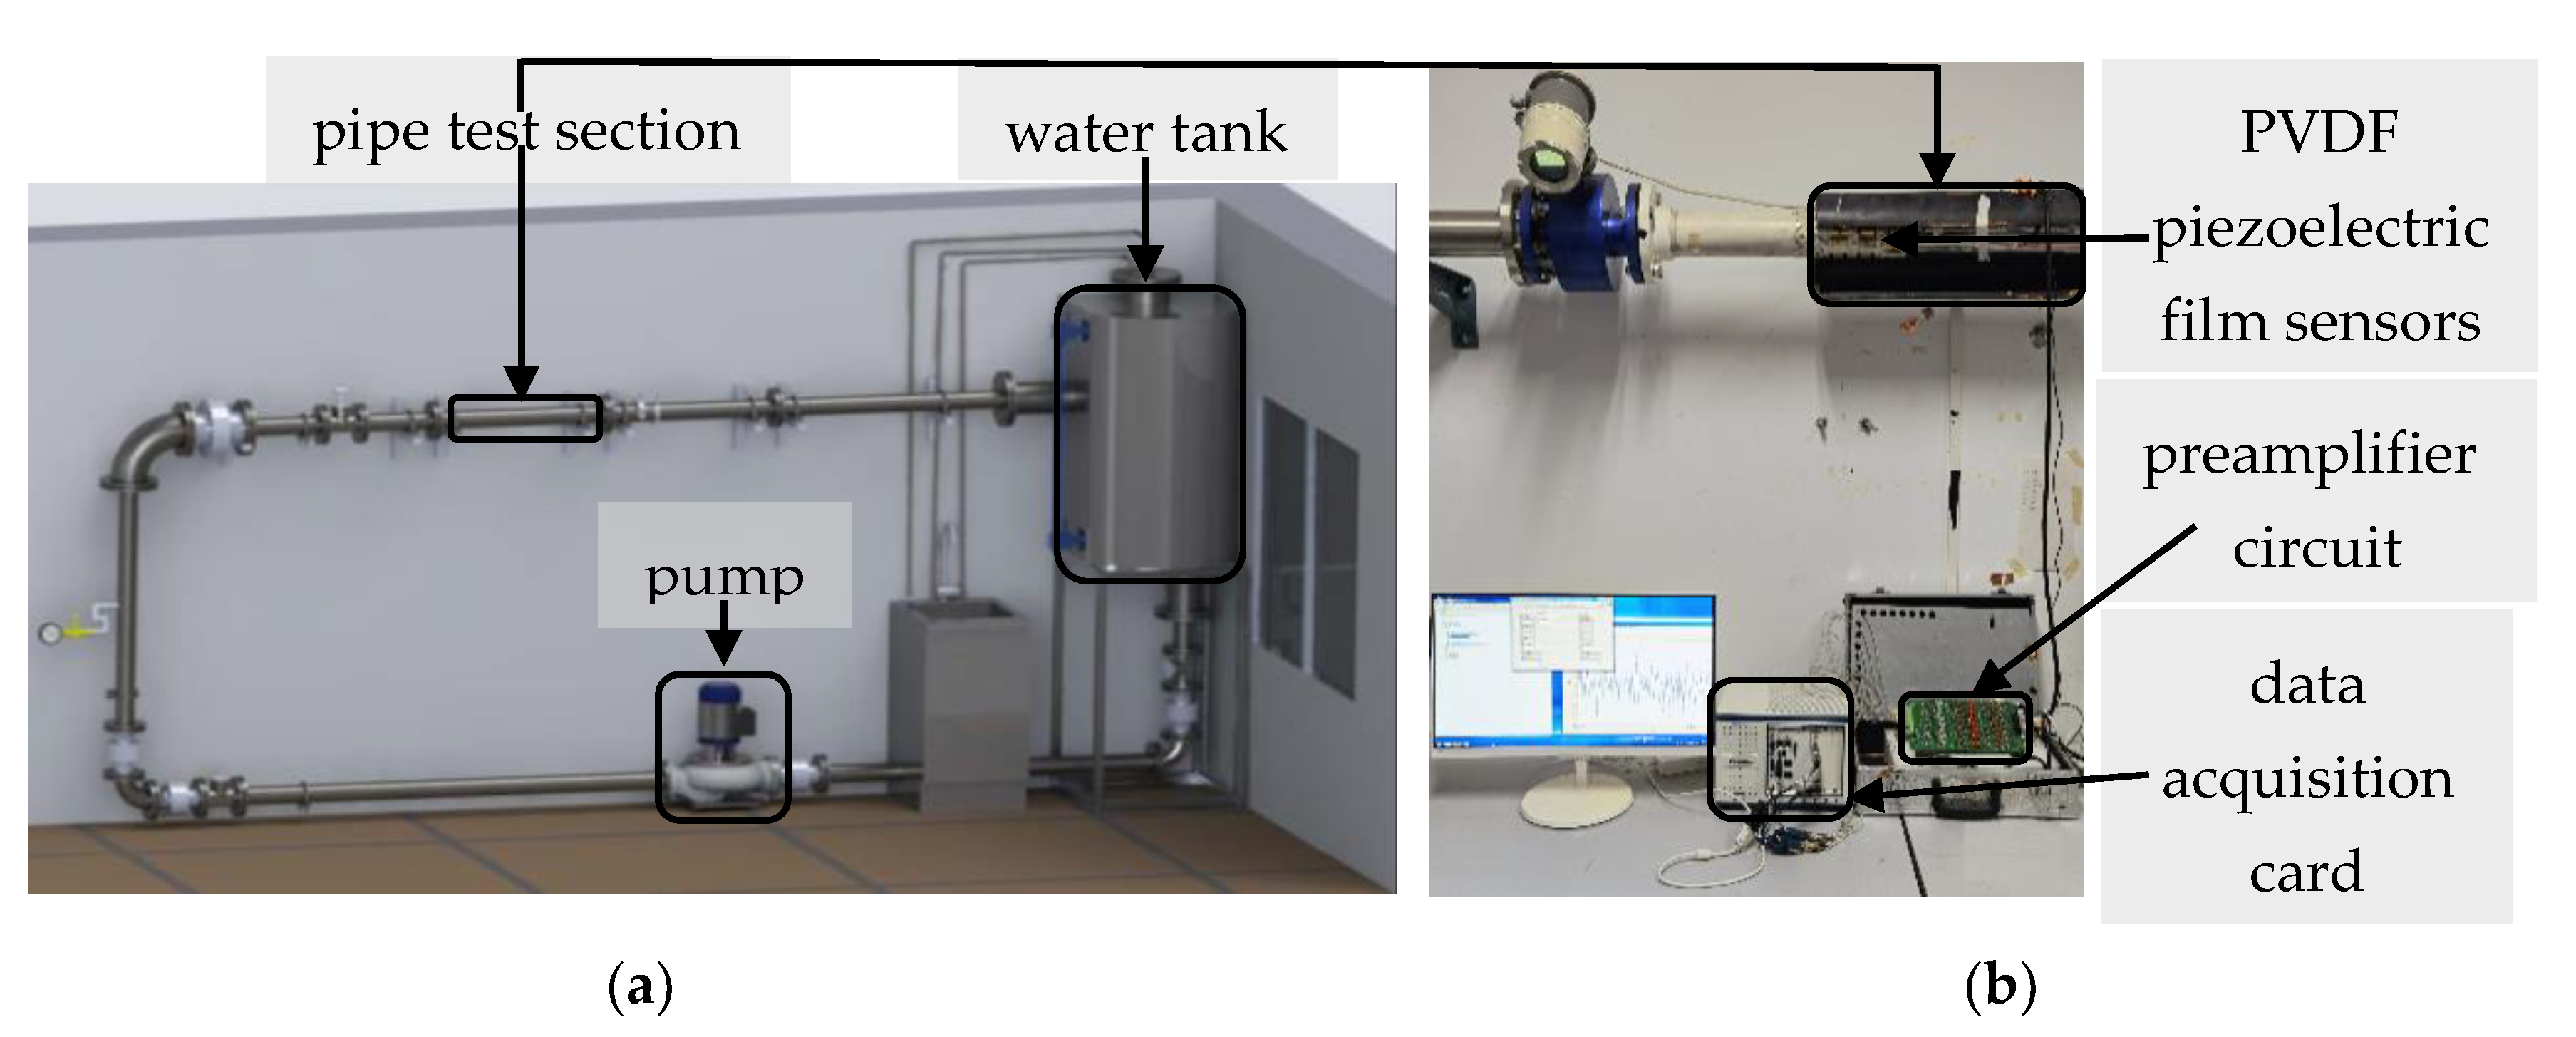
Figure 13.
Diagrams of (a) experimental results; (c) simulation results. Frequency analysis diagrams of (b) experimental results; (d) simulation results.
Figure 13.
Diagrams of (a) experimental results; (c) simulation results. Frequency analysis diagrams of (b) experimental results; (d) simulation results.

Table 1.
Correlation coefficient.
| Circumferential Strain and Fluid Pressure | Circumferential Stress and Fluid Pressure | |
|---|---|---|
| Point1 and Plane1 | 0.9256 | 0.9225 |
| Point2 and Plane2 | 0.9318 | 0.9311 |
| Point3 and Plane3 | 0.9223 | 0.9261 |
Table 2.
Correlation coefficient.
| Circumferential Strain and PVDF Voltage | Circumferential Stress and PVDF Voltage | |
|---|---|---|
| Point1 and PVDF1 | 0.9437 | 0.9570 |
| Point2 and PVDF2 | 0.9924 | 0.9912 |
| Point3 and PVDF3 | 0.9583 | 0.9483 |
Table 3.
Correlation coefficient.
| Pulsation Frequency (Hz) | Ponit1 and PVDF1 | Point2 and PVDF2 | Ponit3 and PVDF3 | |||
|---|---|---|---|---|---|---|
| Circumferential Strain and PVDF Voltage | Circumferential Stress and PVDF Voltage | Circumferential Strain and PVDF Voltage | Circumferential Stress and PVDF Voltage | Circumferential Strain and PVDF Voltage | Circumferential Stress and PVDF Voltage | |
| 0 | 0.9437 | 0.9570 | 0.9924 | 0.9912 | 0.9583 | 0.9483 |
| 5 | 0.9277 | 0.9438 | 0.9989 | 0.9973 | 0.9187 | 0.9309 |
| 10 | 0.9453 | 0.9668 | 0.9981 | 0.9977 | 0.9368 | 0.9542 |
| 20 | 0.9609 | 0.9695 | 0.9974 | 0.9980 | 0.9608 | 0.9717 |
| 40 | 0.9728 | 0.9786 | 0.9986 | 0.9989 | 0.9668 | 0.9767 |
Table 4.
Correlation coefficient.
| Pulsation Frequency (Hz) | Plane1 and PVDF1 | Plane2 and PVDF2 | Plane3 and PVDF3 |
|---|---|---|---|
| Pressure and Voltage | Pressure and Voltage | Pressure and Voltage | |
| 0 | 0.8651 | 0.9754 | 0.8598 |
| 5 | 0.8323 | 0.9631 | 0.8397 |
| 10 | 0.8686 | 0.9712 | 0.8536 |
| 20 | 0.8971 | 0.9598 | 0.8911 |
| 40 | 0.9164 | 0.9457 | 0.9098 |
Table 5.
Correlation coefficient.
| Pulsation Amplitude (m/s) | Point1 and PVDF1 | Point2 and PVDF2 | Point3 and PVDF3 | |||
|---|---|---|---|---|---|---|
| Circumferential Strain and PVDF Voltage | Circumferential Stress and PVDF Voltage | Circumferential Strain and PVDF Voltage | Circumferential Stress and PVDF Voltage | Circumferential Strain and PVDF Voltage | Circumferential Stress and PVDF Voltage | |
| 0 | 0.9437 | 0.9570 | 0.9924 | 0.9912 | 0.9583 | 0.9483 |
| 0.025 | 0.9498 | 0.9605 | 0.9952 | 0.9973 | 0.9589 | 0.9687 |
| 0.05 | 0.9676 | 0.9748 | 0.9973 | 0.9979 | 0.9636 | 0.9737 |
| 0.1 | 0.9728 | 0.9786 | 0.9986 | 0.9989 | 0.9668 | 0.9767 |
Table 6.
Correlation coefficient.
| Pulsation Amplitude (m/s) | Plane1 and PVDF1 | Plane2 and PVDF2 | Plane3 and PVDF3 |
|---|---|---|---|
| Pressure and Voltage | Pressure and Voltage | Pressure and Voltage | |
| 0 | 0.8651 | 0.9754 | 0.8598 |
| 0.025 | 0.8756 | 0.9704 | 0.8689 |
| 0.05 | 0.8085 | 0.9562 | 0.8897 |
| 0.1 | 0.9164 | 0.9457 | 0.9098 |
Table 7.
Correlation coefficient.
| Vibration Frequency (Hz) | Ponit1 and PVDF1 | Point2 and PVDF2 | Ponit3 and PVDF3 | |||
|---|---|---|---|---|---|---|
| Circumferential Strain and PVDF Voltage | Circumferential Stress and PVDF Voltage | Circumferential Strain and PVDF Voltage | Circumferential Stress and PVDF Voltage | Circumferential Strain and PVDF Voltage | Circumferential Stress and PVDF Voltage | |
| 0 | 0.9544 | 0.9632 | 0.9641 | 0.9735 | 0.9533 | 0.9660 |
| 5 | 0.9611 | 0.9692 | 0.9535 | 0.9656 | 0.9293 | 0.9468 |
| 10 | 0.9752 | 0.9802 | 0.9564 | 0.9677 | 0.9387 | 0.9539 |
| 20 | 0.9775 | 0.9783 | 0.9716 | 0.9756 | 0.9389 | 0.9473 |
| 40 | 0.9727 | 0.9781 | 0.9812 | 0.9834 | 0.9436 | 0.9592 |
Table 8.
Correlation coefficient.
| Vibration Frequency (Hz) | Plane1 and PVDF1 | Plane2 and PVDF2 | Plane3 and PVDF3 |
|---|---|---|---|
| Pressure and Voltage | Pressure and Voltage | Pressure and Voltage | |
| 0 | 0.9207 | 0.9179 | 0.9075 |
| 5 | 0.9211 | 0.9145 | 0.8973 |
| 10 | 0.9234 | 0.9187 | 0.9046 |
| 20 | 0.9198 | 0.9221 | 0.8996 |
| 40 | 0.9317 | 0.9373 | 0.9012 |
Table 9.
Correlation coefficient.
| Vibration Amplitude (mm) | Point1 and PVDF1 | Point2 and PVDF2 | Point3 and PVDF3 | |||
|---|---|---|---|---|---|---|
| Circumferential Strain and PVDF Voltage | Circumferential Stress and PVDF Voltage | Circumferential Strain and PVDF Voltage | Circumferential Stress and PVDF Voltage | Circumferential Strain and PVDF Voltage | Circumferential Stress and PVDF Voltage | |
| 0 | 0.9544 | 0.9632 | 0.9641 | 0.9735 | 0.9533 | 0.9660 |
| 0.1 | 0.9727 | 0.9781 | 0.9812 | 0.9834 | 0.9436 | 0.9592 |
| 0.2 | 0.9873 | 0.9898 | 0.9772 | 0.9828 | 0.9576 | 0.9689 |
| 0.3 | 0.9907 | 0.9925 | 0.9767 | 0.9856 | 0.9589 | 0.9696 |
| 0.4 | 0.9866 | 0.9893 | 0.9768 | 0.9824 | 0.9534 | 0.9654 |
Table 10.
Correlation coefficient.
| Vibration Amplitude (mm) | Plane1 and PVDF1 | Plane2 and PVDF2 | Plane3 and PVDF3 |
|---|---|---|---|
| Pressure and Voltage | Pressure and Voltage | Pressure and Voltage | |
| 0 | 0.9207 | 0.9179 | 0.9075 |
| 0.1 | 0.9317 | 0.9373 | 0.9012 |
| 0.2 | 0.9282 | 0.9314 | 0.9063 |
| 0.3 | 0.9369 | 0.9195 | 0.8982 |
| 0.4 | 0.9305 | 0.9294 | 0.8874 |
Publisher’s Note: MDPI stays neutral with regard to jurisdictional claims in published maps and institutional affiliations. |
© 2021 by the authors. Licensee MDPI, Basel, Switzerland. This article is an open access article distributed under the terms and conditions of the Creative Commons Attribution (CC BY) license (http://creativecommons.org/licenses/by/4.0/).
Share and Cite
MDPI and ACS Style
Liu, S.; Wu, X.; Kong, Y.; Peng, X. Measurement Method for Fluid Pressure Fluctuation in Fluid-Conveying Pipe Using PVDF Piezoelectric Film Sensor. Appl. Sci. 2021, 11, 1299. https://doi.org/10.3390/app11031299
AMA Style
Liu S, Wu X, Kong Y, Peng X. Measurement Method for Fluid Pressure Fluctuation in Fluid-Conveying Pipe Using PVDF Piezoelectric Film Sensor. Applied Sciences. 2021; 11(3):1299. https://doi.org/10.3390/app11031299
Chicago/Turabian StyleLiu, Song, Xianmei Wu, Yuanyuan Kong, and Xiuqian Peng. 2021. "Measurement Method for Fluid Pressure Fluctuation in Fluid-Conveying Pipe Using PVDF Piezoelectric Film Sensor" Applied Sciences 11, no. 3: 1299. https://doi.org/10.3390/app11031299
Note that from the first issue of 2016, this journal uses article numbers instead of page numbers. See further details here.