
Experimental Study on Electrical Resistivity Characteristics of Saturated Sand Mixes with Bentonite Slurry

1
School of Civil and Transportation Engineering, Ningbo University of Technology, Ningbo 315211, China
2
School of Civil Engineering, Beijing Jiaotong University, Beijing 100044, China
3
Key Laboratory of Urban Underground Engineering of the Education Ministry, Beijing Jiaotong University, Beijing 100044, China
4
School of Civil Engineering and Architecture, Jiangsu University of Science and Technology, Zhenjiang 212003, China
*
Author to whom correspondence should be addressed.
Appl. Sci. 2021, 11(24), 12126; https://doi.org/10.3390/app112412126
Submission received: 13 September 2021
/
Revised: 22 November 2021
/
Accepted: 2 December 2021
/
Published: 20 December 2021
(This article belongs to the Special Issue Tunneling and Underground Engineering: From Theories to Practices)
Abstract
:Bentonite slurry is widely used in underground and geotechnical engineering because of its strong ability of wall protection. Slurry penetration, which is of great significance for the soil stability, is difficult to observe directly during the soil and slurry interaction. Slurry penetration would change the electrical resistivity of soil, which provides an indirect method to monitor the degree of slurry penetration. This paper aimed to investigate the electrical resistivity characteristics of soil-bentonite mixtures. Several test groups with different material components were carried out. The effects of some factors including water environment, CMC (carboxymethyl cellulose) contents, soil particle gradation, and electrode distance on the electrical resistivity of slurry-soil mixtures were studied and the relationship between soil electrical resistivity and slurry concentration was established. The results in this paper can provide references for the application of the electrical method on slurry penetration.
1. Introduction
Bentonite slurry has been widely employed in underground and geotechnical engineering such as slurry pressure balance (SPB) shield tunneling, horizon directional drilling (HDD), diaphragm wall, and cast-in-place pile, etc. [1,2,3]. Fresh slurry is pumped to the front of the work face and the muck is taken out by slurry. Additionally, the bentonite slurry can serve as the medium to support the side wall of the bore hole [4]. The effect of support action depends on the formation and quality of the filter cake [5]. The process of slurry penetration has attracted extensive attention because of its great importance in the formation of filter cakes [6,7]. However, the observation of slurry penetration is very challenging during the soil–slurry interaction.
Because of the advantages of non-invasion, high-efficiency, and low cost, the electrical characterization of soil water content [8,9], underground solute transport [8,10,11], and soil liquefaction [12], etc. has been given more and more attention. For example, the electrical resistivity is generally used to characterize the degree of saturation, pollutant concentration, and porosity of soil. Shea and Luthin [13] observed that the electrical resistivity and salinity for the soil water content ranging from saturation to −3 kPa water potential had a linear relationship between each other. Kalinski and Kelly [14] estimated the volumetric water content through pore solution resistivity, indicating that the electrical resistivity decreases when the water conductivity increases with a given water content. Additionally, different ions present in the solution (H+, OH−, SO42−, Na+, Cl−, etc.) affect the conductivity because of differences in ion mobility. This explains why soil solutions at the same concentration, but exhibiting different ionic compositions, may have different electrical conductivities. Other researchers have also studied salt water intrusion in coastal areas by measuring the electrical resistivity [15,16,17]. The same principles apply to slurry penetration into sand. The value of soil electrical resistivity as an indicator can reflect the state of slurry penetration at some point during the soil–slurry interaction. However, none of the literature has reported on the electrical resistivity characteristics of soil–slurry mixtures, which are important for the quantitative observation of slurry penetration. The penetration velocity of slurry in sand is far slower than the electric current. Therefore, a group of static electrical resistivity of soil–slurry mixture can replace the electrical resistances of sand at a certain moment during slurry penetration. The relationship can be established between electrical resistances and slurry concentration in a given soil. We can learn the slurry concentration within soil pores indirectly by this relationship during further slurry penetration experiments.
This paper aims to characterize the soil-slurry mixtures using the electrical resistivity method. The influences of water environment, CMC (carboxymethyl cellulose) additive, soil gradation, and electrode distance on electrical resistivity characteristics of soil samples with different slurry concentrations were obtained. The results can provide significant references for the application of the electrical resistivity method in the research of slurry penetration.
2. Slurry Penetration Mechanism and Test
During the construction of excavation engineering projects, bentonite slurry mainly has the following functions [18]: (1) serve as a support medium to balance the underground earth and water pressure and ensure adequate face stability; (2) exchange muck from the excavation face to the ground surface; (3) improve the physical properties of soil after slurry penetration; and (4) reduce the friction between soil and excavation tools or machines, and decrease the temperature of excavation tools or machines. The function (1) that originates from oil exploration technology is the most important for bentonite slurry in excavation engineering.
By means of experiments and theoretical analysis, Müller-Kirchenbauer [19] realized that there are three main types of slurry-soil interaction. The first one describes the stagnation of bentonite particles at the beginning of slurry penetration, which results in the formation of a whole filter cake mode (Type I); the second describes the migration of slurry particles at the beginning of slurry penetration and the following formation of filter cake, which is called the permeability zone plus filter cake mode (Type II); and the third describes the migration of slurry particles with slurry penetration always but without a filter cake on the excavation surface, which is called the whole permeability zone mode (Type III) [20,21]. Type I mode usually appears in low-permeability cohesive soil. We tried to avoid Type III mode, which means the wrong choice of slurry materials. Type II mode is the common phenomenon in the sand stratum.
Furthermore, Talmon et al. [22] investigated the pressure transfer mechanisms with Type II mode, which distinguished two phases of the process. The first is characterized as the viscous mud spurt, since the slurry penetrates the soil very rapidly in this phase. In the following second phase, when the penetration rate slows down, the bentonite slurry begins to consolidate and the associated formation of filter cake helps to seal the face and transfer the slurry support pressure onto the soil skeleton. This mechanism was also verified by Xu et al. [23].
Although the slurry easily penetrates into pores in the highly permeable coarse soil, bentonite particles in the slurry may clog the pore space in stratum, which is called the filtration effect [24]. The clogged bentonite particles in the soil can promote the formation of the filter cake. Obviously, slurry penetration, as the fundamental stage, has a great impact on the formation process and properties of the membrane or filter cake.
Figure 1 shows a filtration column test devices that is widely used to study the process of slurry penetration. The slurry is placed upon a soil sample in a filtration column and penetrated into the soil by applying the pressures via piston or air pressure. The volume of water drainage and pore water pressure along the soil column can be obtained during slurry penetration by measuring the cylinder and pressure gauges installed on the side of the filtration column. Utilizing the filtration column test (Figure 1b), Fritz et al. [25] investigated the ability of slurry with various additives to form the lower-permeable filter cake in the highly permeable ground. Min et al. [20,21] conducted a series of studies to investigate the filter cake formation during the construction of shield tunnels. Xu et al. [26] eventually demonstrated the relationships between the bentonite concentration of slurry, slurry penetration velocity, and the range of slurry penetration depth. Yin et al. [27] also employed filtration column tests to explore the distribution of bentonite concentration along the soil column and the range of slurry penetration depth by measuring the electrical conductivity of leachate and scanning electron microscope (SEM) qualitatively. However, it is difficult to observe the process of slurry penetration directly in all of the above tests.
3. Experimental Principle and Apparatus
In order to realize the function of observation in real time during slurry penetration, electrical resistivity can be used to reflect the status of slurry invasion. Bentonite is a kind of clay mineral. When mixed with water, the bentonite particles carrying numerous negative charges will greatly reduce the electrical resistivity of water. Therefore, the slurry penetration can result in the reduction in electrical resistivity of pore fluid in saturated soil, which is a reliable indicator of the concentration of bentonite slurry particles in soil pores. According to the research of Archie [28], the electrical resistivity of the soil and rock can be described by a power function,
where ρ is electrical resistivity; ρl is electrical resistivity of pore liquor; α is an empirical constant that is sometimes called the “tortuosity constant” or the “lithology constant” [29]; φ is porosity of soil; S is degree of saturation; m is cementation exponent, which is related to the degree of cementation of the rock fabric, higher values of m make the formation factor, and hence the rock conductivity, more sensitive to changes in porosity [30]; and n is the saturation exponent obtained by experiments. Therefore, in this paper, the relationship between the slurry concentration and soil electrical resistivity can be established by the electrical resistivity test.
Figure 2 shows the schematic and photograph of the test apparatus used for measuring the soil electrical resistivity. The device consists of a soil sample box, soil resistivity meter, and a computer for continuous data logging during the experiments. It can be seen from Figure 2a that the basic operation principle of the soil resistivity meter used in this experiment is Wheatstone bridge [9], and the frequency of electrical resistivity measurements performed with about 0.2 Hz. The dimensions of the soil sample box were 120 mm length, 40 mm width, and 60 mm height. The prepared soil samples were placed in the box and two coppery electrode slices (40 mm × 80 mm) were installed in the sample box.
4. Materials and Method
4.1. Raw Materials
4.1.1. Soil Samples and Water Environment
In engineering practice, the behavior of the slurry penetration is greatly dependent on the soil properties, water environment, and slurry property at the same operating conditions. For more concise discussion, only the soil gradation, water environment, slurry penetration mass, and CMC additive contents were considered in detail. In this study, China ISO (International Organization for Standardization) standard sand was used to prepare the soil samples. Two types of soil gradation, 0.5~2 mm and 0.075~2 mm, were used in the tests. The grain size distribution of both types of sand is shown in Figure 3. The water environment of the saturated sand is widely acknowledged as a vital factor for the slurry penetration and soil resistivity. Three types of water environment with different seawater content (0%, 25%, and 100%) were considered in those tests. The water environment had a 0% seawater content equal to the deionized water while the 100% seawater content corresponded to the synthetic seawater prepared according to ASTM D1141-98 [31]. The proportions of each component in the substitute ocean water are shown in Table 1. The total salt concentration was 3.58% and NaCl accounted for 68.4% of the total salt mass.
4.1.2. Bentonite Slurry
The bentonite slurry was mixed with the soil samples. Eight different bentonite mass concentrations (i.e., the weight ratio of the retention slurry to pore water in the soil) were designed from 1% to 8%. The slurry used in these tests was composed of sodium bentonite and CMC. The grain size distribution of sodium bentonite was measured by the laser particle size analyzer as shown in Figure 4. The specific gravity and viscosity of the bentonite slurry were measured by the slurry specific gravity scale and a NDJ-5S digital rotational viscometer, respectively, as shown in Table 2. CMC, as a kind of industrial monosodium glutamate, has been widely used in slurry preparation. It can be used to improve the performance of bentonite slurry (e.g., reduce critical shear stress, extend shelf-life, and improve high-temperature stability, etc.). The CMC was used to increase the slurry viscosity and three different CMC mass concentrations, 0%, 1%, and 4%, were adopted in this study.
4.2. Test Procedure
The slurry was prepared by mixing the sodium bentonite and water for 20 min and further hydrated for 24 h in beakers as specified by API [32]. The CMC was dissolved in water in advance with a mass ratio of 1:99, and the salt water was also prepared beforehand. Then, the CMC solution and salt were poured into the slurry in proportion if necessary. After preparing the slurry, a certain mass of dried sand and slurry were mixed up, and saturated for 24 h with the freshness protection package to avoid the reduction in water. Then, the soil-slurry mixture was put into the soil sample box, and the porosity of soil samples was controlled in 0.35 by means of vibration, until the soil sample reached the calculated height. Redundant slurry on the surface of the soil samples was sucked out by droppers. After the soil sample preparation, two electrodes were connected with the resistivity meter to measure the soil resistivity. The value of soil resistivity was selected until the change of measurement value less than 0.01 Ω·m within 0.2 s.
Two types of soil samples with 0.5~2 mm and 0.075~2 mm soil gradation were employed in this experiment. The soil samples with 0.075~2 mm soil gradation were arranged to investigate the influence of soil structures with the same porosity on the soil electrical resistivity. As shown in Table 3, six groups of soil samples were measured by a resistivity meter at different conditions, and in each group, eight soil samples with different slurry mass concentrations (from 1% to 8%) were included.
5. Results and Discussion
5.1. Water Environment
The soil samples were saturated by different amounts of slurry without CMC. The water environment was deionized water. The electrical resistivity of soil samples is shown in Figure 5. For comparison purposes, the electrical resistivity of the slurry concentrations is also presented in this figure. Due to the increased number of ions, the electrical resistivity of soil samples and slurry decreased with the increase in slurry concentration. However, the slurry viscosity increased with the increase in the slurry concentration, which resulted in blocking the ionic migration in the soil pore space. Therefore, the decrease rates of the soil resistivity gradually slowed down when the slurry concentrations in the soil reached a high value. The electrical resistivity of soil samples and slurry can be fitted well by power functions with coefficients of determination R2 = 0.96 and 0.98, respectively, as a function of the slurry concentration, as shown below,
where c refers to the slurry concentration.
According to Equation (1), the formation factor F of the saturated soil can be expressed as,
The formation factor F reflects the influence of the soil structure on the electrical resistivity. A smaller value of F indicates that the soil structure is easier for the ions to pass through. Figure 6 shows the change in formation factors of soil with different amounts of slurry mixture. Micrographs of the soil samples with a 5× magnification are also shown in this figure. They show that the F of soil samples increased with the increase in the slurry concentration. The microscope images show that the size of the slurry particles increased with the increase in slurry concentration. Although the mixture of the bentonite slurry can significantly increase the number of free ions, the soil structure can also be changed due to the aggregation of the bentonite particles. With the increase in the number and size of the slurry particles, it is much easier to clog the pore space of soil samples, which can reduce the free space of ion migration in the soil-slurry mixture samples. Therefore, the magnitude of soil resistivity is a result of competition between the soil formation factor and electrolytes. The slurry-induced changes in soil structure cannot be ignored when the slurry penetration is assessed in practical engineering, otherwise the magnitude as well as the migration distance of the slurry will be overestimated.
As shown in Figure 6, the relation between the formation factor F and slurry concentrations c can be described by an exponential function as,
where α(c) = c0.2292 and m = 1.64 in this group of tests. Due to the influence of bentonite particles on the soil structure, the coefficient α in Equation (4) was considered as a variable value instead of a constant.
With the increased amount of offshore engineering, slurry has been applied more prevalently in the environment of seawater. In order to discuss the influence of seawater on slurry penetration, the soil samples were saturated by slurry without CMC, and three types of water environment with different seawater content (0%, 25%, and 100%) were considered in the tests. The electrical resistivity of soil samples with different slurry concentrations is shown in Figure 7. The electrical resistivity of the soil samples under deionized water conditions was much larger than that under seawater conditions. It indicated that the soil electrical resistivity decreased with the increase in seawater content. Since the amount of free ions in seawater is much greater than that in slurry, the slurry penetration is more difficult to change the soil electrical resistivity. Hence, it is very difficult to evaluate the slurry penetration in offshore engineering with soil electrical resistivity.
Figure 8 shows the change in soil formation factors under different water environments. The formation factors of soil samples increased with the decrease in seawater content. The soil samples with different seawater contents presented a similar change where the corresponding formation factors increased with the increase in slurry concentration. Due to the large amount of free ions in seawater, the soil mixed with seawater was less sensitive to the slurry concentration. Moreover, when slurry penetrates into the soil under a seawater environment, those cations in the seawater can neutralize some of the anions on the surface of bentonite particles. The bentonite particles then flocculated into aggregates and deposited rapidly. As shown in Figure 9, the sedimentation of bentonite particles increased the pore spaces of soil samples, which can promote the migration of free ions in soil pores, resulting in a decrease in the formation factor. The reaction of cations and anions between seawater and bentonite can also contribute to the formation of filter cakes and the increase in the bleeding rate of slurry [33].
5.2. CMC Contents
In this study, three different CMC contents of 0%, 1%, and 4% were selected to investigate their influences on the soil electrical resistivity. The soil samples were saturated by slurry with CMC proportionally, and the water environment was deionized water. Figure 10 shows the change in the electrical resistivity of soil samples and corresponding slurry with different CMC contents. The electrical resistivity of soil samples and slurry decreased with the increase in CMC contents. However, such influence of the CMC contents on both the soil samples and slurry gradually reduced with the increase in the slurry concentration.
Figure 11 shows the change in soil formation factors with different CMC contents. The formation factors of soil increased with the increase in slurry concentrations while they decreased with the increase in CMC contents. For the microstructural analysis, Figure 12 and Figure 13 present the grain size distributions and micrographs (20×) of slurry with different CMC contents. The slurry sample with the concentration of 4% was selected for the tests. As shown in Figure 12, the aggregate size measured by laser particle size analyzer corresponding to the maximum frequency increased from 0.089 to 0.123 mm with the decrease in the CMC contents. A similar change was also observed in Figure 13. The zeta potential is an indirect measure of the net charge on the colloidal particles in the slurry and reflects the ability of the particles to repel or attract each other. The zeta potential, which is an important indicator for the slurry stability, is also given in this figure. The larger the absolute value of the zeta potential, the more stable the slurry. It was measured by Zetasizer (Malvern, UK). The value of the zeta potential increased from −28.5 to −10.8 mV with the increase in CMC contents, and negative signs indicated that slurry particles carried negative charges. It turned out that the increase in CMC contents enhanced repulsive forces among the slurry particles and behaved as the dispersant in the slurry material. In summary, the increase in the CMC contents produces aggregates with smaller size and increases the pore spaces of soil samples, resulting in a decrease in the formation factor.
5.3. Particle Gradation of Soil Samples
The soil electrical resistivity with two different soil particle gradations was compared as shown in Figure 14. The gradation of both soil samples was 0.075~2 mm and 0.5~2 mm, respectively. The soil samples were saturated by slurry without CMC, and the water environment was deionized water. The electrical resistivity of the soil samples with a 0.075~2 mm gradation was smaller than that of the soil samples with a 0.5~2 mm gradation. Although the porosity of the two types of soil samples was the same, the soil samples with a lower size limit provides larger pore space for ion migration. Thus, the soil resistivity greatly relies on the soil particle size.
5.4. Electrode Distance
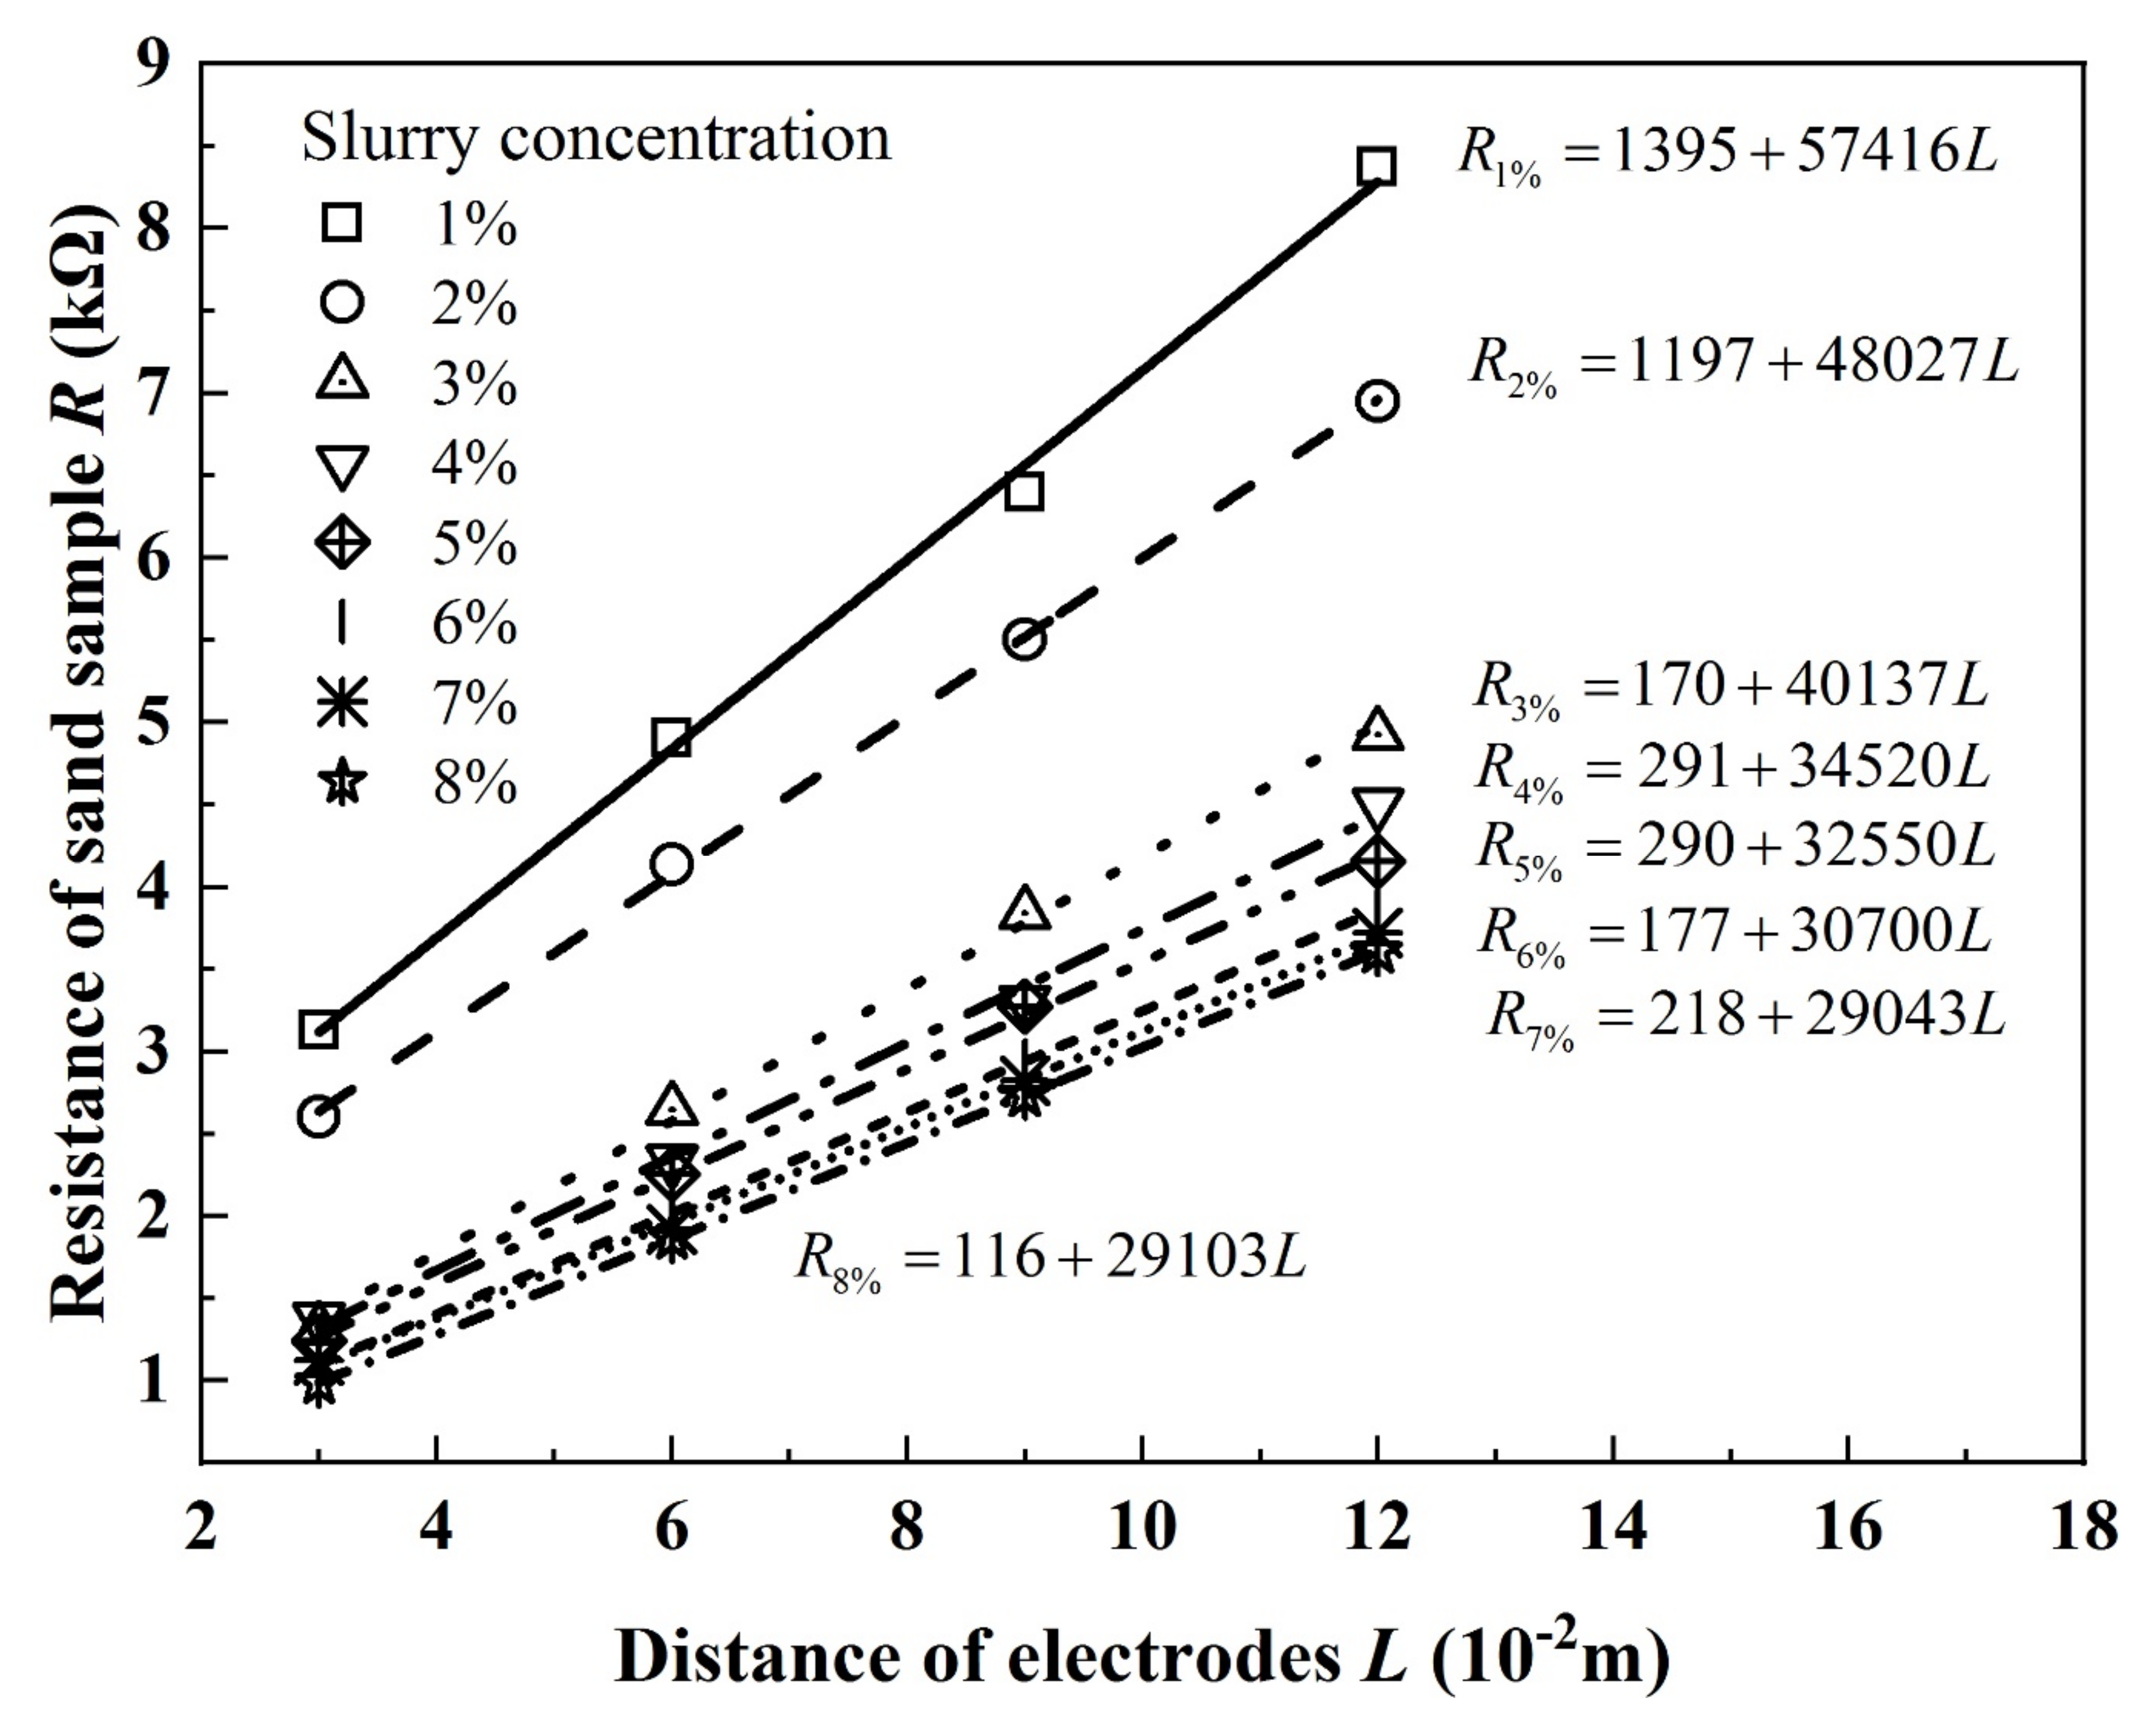
The different electrode distance was achieved through inserting the electrode into the soil at a particular position between the fixed electrodes. The soil samples were saturated by slurry without CMC, and the water environment was deionized water. Figure 15 shows the change in soil resistance with different measured distances of the electrodes. The intercepts of fitting curves on the y-axis denotes the contact resistance, which is the sum of the constriction resistance and resistance of the film [34,35,36]. It was observed that a stable linear relation existed between the resistance of soil samples R and distance of electrodes L. R increased with the increase of L. However, due to the increased amount of bentonite particles between the electrodes and soil sample, the contact resistances decreased with the increase in slurry concentration [37]. The variance of the contact resistances may bring about a strong deviation in soil electrical resistivity in two-point tests.
6. Conclusions
Slurry penetration is an essential stage when used for balancing the earth and water pressure in underground and geotechnical engineering. In this study, experiments including slurry property tests and electrical resistivity of soil samples with different amounts of bentonite slurry were conducted to investigate the effects of the water environment, CMC additive, soil particle gradation, and electrode distance. The empirical formulas between electrical resistivity of slurry-soil mixtures and bentonite slurry concentrations were established. The main conclusions of this study are as follows:
- (1)
- The slurry penetration observably increased the number of ions in saturated soil and decreased the electrical resistivity of soil. The relation between soil electrical resistivity and amount of slurry penetration can be expressed by the power function of slurry concentration. Additionally, the soil porosity and particle gradation also exerts influences on the soil electrical resistivity.
- (2)
- Seawater and CMC decreased the electrical resistivity of bentonite slurry and slurry-soil mixture. Since the amount of free ions in seawater is much greater than that in slurry, the effect of bentonite slurry on the soil electrical resistivity can be ignored. Besides, the bentonite particles flocculate into aggregates rapidly in a seawater environment, which further promotes the decrease in soil resistivity. Therefore, the method of electrical resistivity measurement in this paper is not applicable in the offshore engineering.
- (3)
- The magnitude of soil resistivity is a result of competition between the soil formation factor and electrolytes. Engineers cannot ignore the slurry-induced changes of soil structure when assessing the slurry penetration in practical engineering, otherwise the magnitude as well as the migration distance of the slurry will be overestimated.
- (4)
- Contact resistance between electrode slices and soil samples decreased with the increase in slurry penetration. The variance of the contact resistances may bring about a strong deviation in the soil electrical resistivity. In order to obtain a stable and reliable value of soil electrical resistivity, multiple tests with different distances are recommended and the soil electrical resistivity can be determined by calculating the slope of fitting curves.
In the actual project, formation is always heterogeneous and changeful. More studies concentrating on the electrical resistivity character of soil before and after slurry penetration are still necessary. The electric method applied on the excavation face of the slurry balance shield is a less-studied topic worldwide, but future studies that consider the electrical resistivity character of a soil-slurry mixture could provide knowledge in this area.
Author Contributions
Conceptualization, J.M.; methodology, B.W.; validation, D.Y., and D.J.; investigation, S.W.; resources, D.Y.; data curation, S.W.; writing—original draft preparation, J.M.; writing—review and editing, D.J.; visualization, J.M.; supervision, D.Y.; project administration, D.Y.; funding acquisition, D.Y. All authors have read and agreed to the published version of the manuscript.
Funding
This research was funded by Joint Funds of the National Natural Science Foundation of China, grant number U1834208.
Institutional Review Board Statement
Not applicable.
Informed Consent Statement
Not applicable.
Acknowledgments
This study was supported by the Joint Funds of the National Natural Science Foundation of China (Grant No. U1834208). Their support is gratefully acknowledged.
Conflicts of Interest
The authors declare no conflict of interest.
References
- Anagnostou, G.; Kovári, K. Face stability in slurry and EPB shield tunneling. Geotech. Asp. Undergr. Constr. Soft Ground 1996, 28, 453–458. [Google Scholar]
- Nasiri, A.; Ghaffarkhah, A.; Moraveji, M.K.; Gharbanian, A.; Valizadeh, M. Experimental and field test analysis of different loss control materials for combating lost circulation in bentonite mud. J. Nat. Gas Sci. Eng. 2017, 44, 1–8. [Google Scholar] [CrossRef]
- Lei, M.F.; Yao, L.; Cao, C.Y. Design method of slurry volume–weight in trenching construction of underground diaphragm wall in soft stratum. Geotech. Geol. Eng. 2017, 35, 2697–2704. [Google Scholar]
- Horizon Directional Drilling. Available online: https://v.qq.com/x/page/u066245aulf.html (accessed on 1 November 2021).
- Cast-in-Place Pile. Available online: http://cn.trustexporter.com/cp-jgejic/o6495620.htm (accessed on 1 November 2021).
- Zhang, Z.; Yin, T.; Huang, X.; Dias, D. Slurry filtration process and filter cake formation during shield tunnelling: Insight from coupled CFD-DEM simulations of slurry filtration column test. Tunn. Undergr. Space Technol. 2019, 87, 64–77. [Google Scholar] [CrossRef]
- Mao, J.H.; Yuan, D.J.; Jin, D.L.; Liu, S.N. Influence of Cutting Tools on Filter Cake Formation during Slurry Shield Tunnelling. KSCE J. Civ. Eng. 2021, 25, 2261–2274. [Google Scholar] [CrossRef]
- Nie, Y.X.; Hu, L.; Wen, Q. The quantitative relationship of soil resistivity and saturation degree. Chin. J. Rock Mech. Eng. 2016, 35, 3441–3448. [Google Scholar]
- Wang, B.H.; Wang, Z.H.; Jiang, P.P.; Zhou, A.Z. Electrical resistivity characteristics of saturated sand with varied porosities. Chin. J. Geotech. Eng. 2017, 9, 1739–1745. [Google Scholar]
- Depountis, N.; Harris, C.; Davies, M. An assessment of miniaturised electrical imaging equipment to monitor pollution plume evolution in scaled centrifuge modelling. Eng. Geol. 2001, 60, 83–94. [Google Scholar] [CrossRef]
- Fukue, M.; Minato, T.; Matsumoto, M.; Horibe, H.; Taya, N. Use of a resistivity cone for detecting contaminated soil layers. Eng. Geol. 2001, 60, 361–369. [Google Scholar] [CrossRef]
- Jinguuji, M.; Toprak, S.; Kunimatsu, S. Visualization technique for liquefaction process in chamber experiments by using electrical resistivity monitoring. Soil Dyn. Earthq. Eng. 2007, 27, 191–199. [Google Scholar] [CrossRef]
- Shea, P.F.; Luthin, J.N. An Investigation of the Use of The Four-Electrode Probe for Measuring Soil Salinity In Situ. Soil Sci. 1961, 92, 331–339. [Google Scholar] [CrossRef]
- Pincus, H.; Kalinski, R.; Kelly, W. Estimating Water Content of Soils from Electrical Resistivity. Geotech. Test. J. 1993, 16, 323. [Google Scholar] [CrossRef]
- Nowroozi, A.A.; Horrocks, S.B.; Henderson, P. Saltwater intrusion into the freshwater aquifer in the eastern shore of Virginia: A reconnaissance electrical resistivity survey. J. Appl. Geophys. 1999, 42, 1–22. [Google Scholar] [CrossRef]
- Acworth, R.I. Investigation of dryland salinity using the electrical image method. Soil Res. 1999, 37, 623–636. [Google Scholar] [CrossRef]
- Yaramanci, U. Geoelectric exploration and monitoring in rock salt for the safety assessment of underground waste disposal sites. J. Appl. Geophys. 2000, 44, 181–196. [Google Scholar] [CrossRef]
- Zhu, W.; Min, F.L.; Zhong, X.C. Slurry and Filter Cake in Slurry Shield; Science Press: Beijing, China, 2016; pp. 10–11. [Google Scholar]
- Müller, K.H. Stability of slurry trenches. In Proceedings of the 5th European Conference on Soil Mechanics and Foundation Engineering, Madrid, Spain, 10–19 April 1972; pp. 543–553. [Google Scholar]
- Min, F.; Zhu, W.; Han, X. Filter cake formation for slurry shield tunneling in highly permeable sand. Tunn. Undergr. Space Technol. 2013, 38, 423–430. [Google Scholar] [CrossRef]
- Min, F.L.; Zhu, W.; Wei, D.W.; Xia, S.Q. Change of pore water pressure in soil as filter cakes formed on excavation face in slurry shield. Chin. J. Geotech. Eng. 2013, 35, 722–727. [Google Scholar]
- Talmon, A.M.; Mastbergen, D.R.; Huisman, M. Invasion of Pressurized Clay Suspensions into Granular Soil. J. Porous Media 2013, 16, 351–365. [Google Scholar] [CrossRef]
- Xu, T.; Bezuijen, A.; Dias, T. Slurry infiltration ahead of slurry TBM’s in saturated sand: Laboratory tests and consequences for practice. In Proceedings of the 9th International Symposium on Geotechnical Aspects of Underground Construction in Soft Ground, Sao Paulo, Brazil, 3–6 April 2017; pp. 121–126. [Google Scholar] [CrossRef]
- Zied, S.; Jean, C.; Luc, D.; Dupla, J.C. Evaluation of elementary filtration properties of a cement grout injected in a sand. Can. Geotech. J. 2006, 43, 1273–1289. [Google Scholar]
- Fritz, P. Additives for Slurry Shields in Highly Permeable Ground. Rock Mech. Rock Eng. 2006, 40, 81–95. [Google Scholar] [CrossRef]
- Xu, T.; Bezuijen, A. Pressure infiltration characteristics of bentonite slurry. Géotechnique 2019, 69, 364–368. [Google Scholar] [CrossRef]
- Yin, X.S.; Chen, R.P.; Li, Y.C.; Qi, S. A column system for modeling bentonite slurry infiltration in sands. J. Zhejiang Univ. Sci. A (Appl. Phys. Eng.) 2016, 17, 818–827. [Google Scholar] [CrossRef] [Green Version]
- Archie, G.E. The Electrical Resistivity Log as an Aid in Determining Some Reservoir Characteristics. Trans. AIME 1942, 146, 54–62. [Google Scholar] [CrossRef]
- Glover, P.W.J. Archie’s law—A reappraisal. Solid Earth 2016, 7, 1157–1169. [Google Scholar] [CrossRef] [Green Version]
- Glover, P. Geophysical Properties of the Near Surface Earth: Electrical Properties. In Treatise on Geophysics; Elsevier: Amsterdam, The Netherlands, 2015; Volume 11, pp. 89–137. [Google Scholar]
- ASTM D1141-98(2003): Standard Practice for the Preparation of Substitude Ocean Water; American Society for Testing and Materials: West Conshohocken, PA, USA, 2003.
- API: Recommended Practice Standard Procedure for Field Testing Water-Based Drilling Fluids, 13B-1, 3rd ed.; American Petroleum Institute: Washington, DC, USA, 2003.
- Min, F.; Du, J.; Zhang, N.; Chen, X.; Lv, H.; Liu, L.; Yu, C. Experimental study on property change of slurry and filter cake of slurry shield under seawater intrusion. Tunn. Undergr. Space Technol. 2019, 88, 290–299. [Google Scholar] [CrossRef]
- Alshawabkeh, A.N.; Gale, R.J.; Ozsu-Acar, E.; Bricka, R.M. Optimization of 2-D Electrode Configuration for Electrokinetic Remediation. Soil Sediment Contam. Int. J. 1999, 8, 617–635. [Google Scholar] [CrossRef]
- Braunovic, M.; Konchits, V.V.; Myshkin, N.K. Electrical Contacts: Fundamentals, Applications and Technology; CRC Press: Boca Raton, FL, USA, 2007. [Google Scholar]
- Zhuang, Y.-F.; Wang, Z. Interface Electric Resistance of Electroosmotic Consolidation. J. Geotech. Geoenvironmental Eng. 2007, 133, 1617–1621. [Google Scholar] [CrossRef]
- Greenwood, A.J. Constriction resistance and the real area of contact. Br. J. Appl. Phys. 1966, 17, 1621. [Google Scholar] [CrossRef]
Figure 1.
Schematic layout of a filtration column test. (a) Designed by Min et al. [20,21]. (b) Designed by Fritz [25]. (c) Designed by Xu [26].
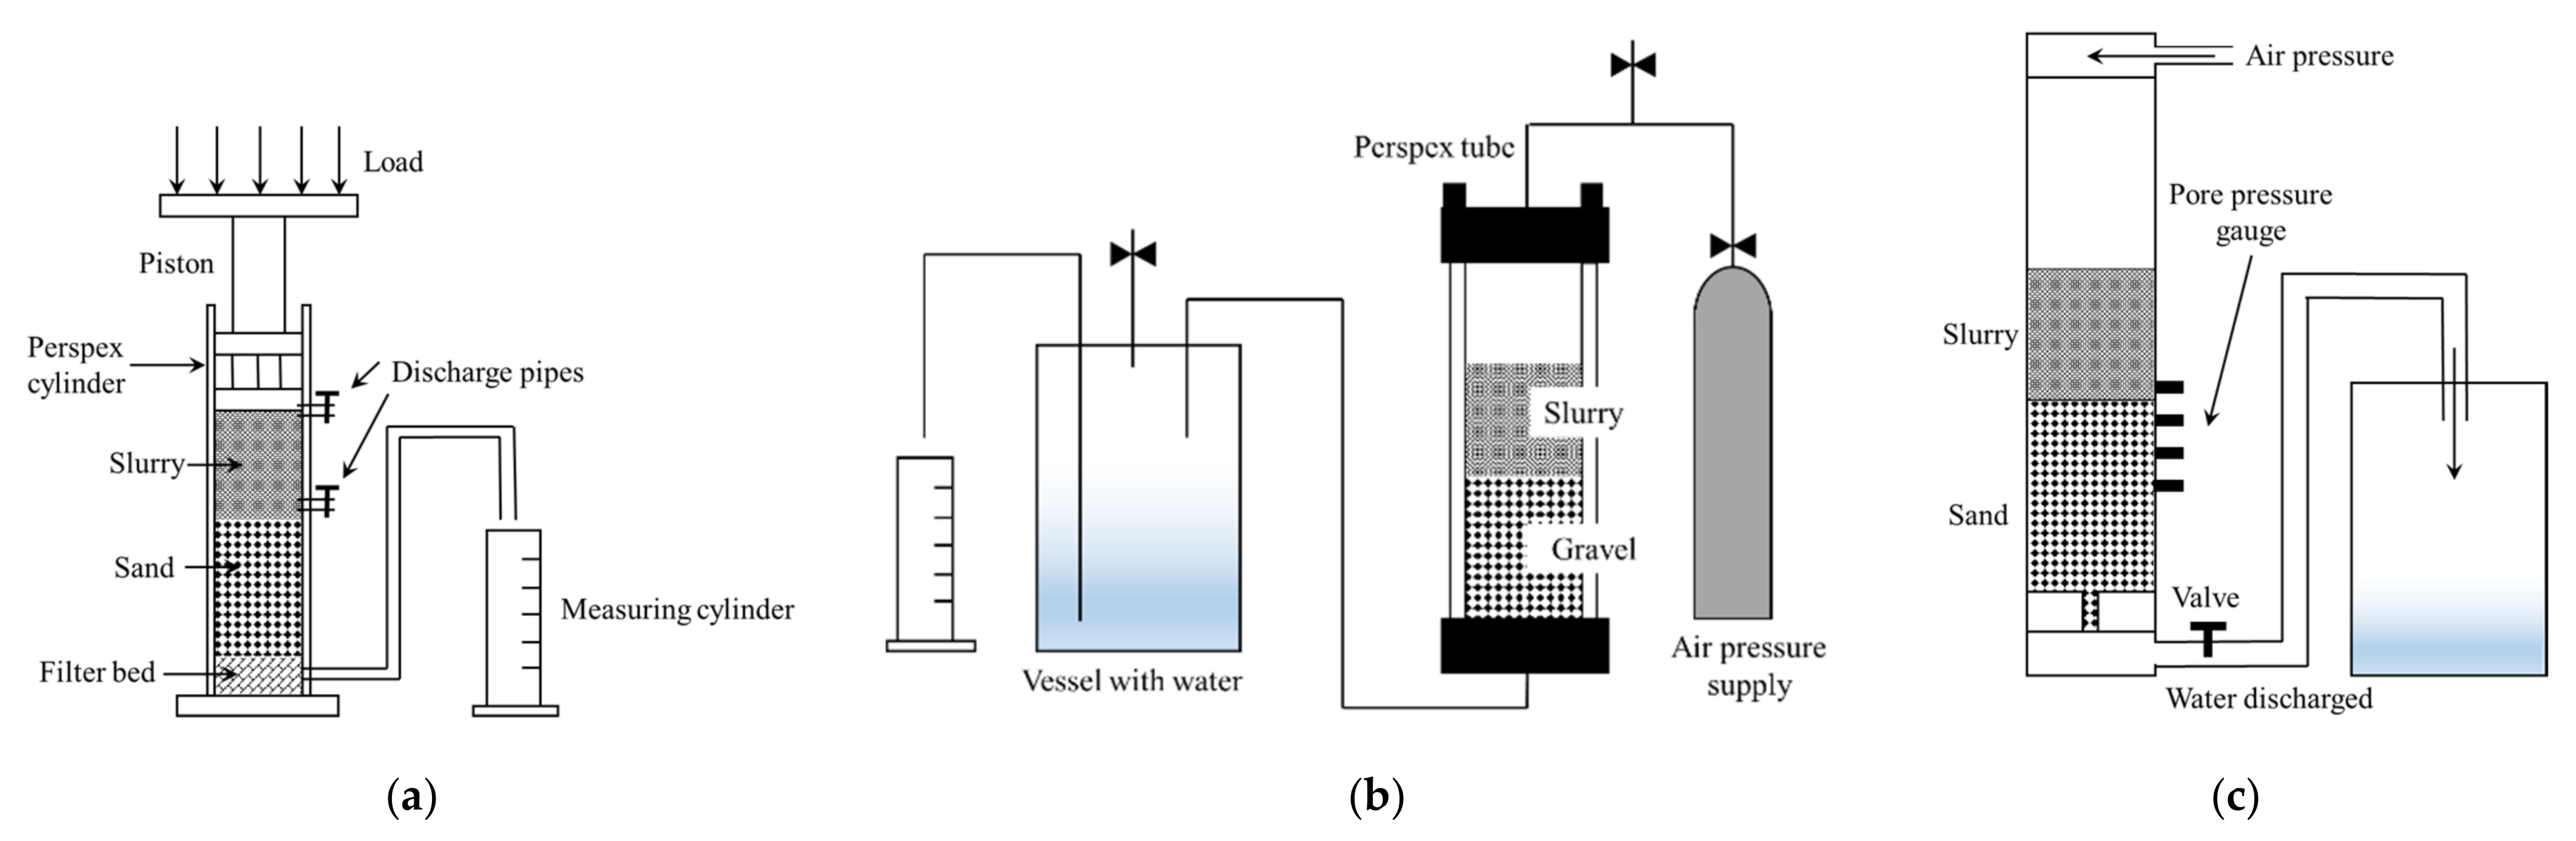
Figure 2.
Experimental setup of soil electrical resistivity. (a) Schematic. (b) Photograph.
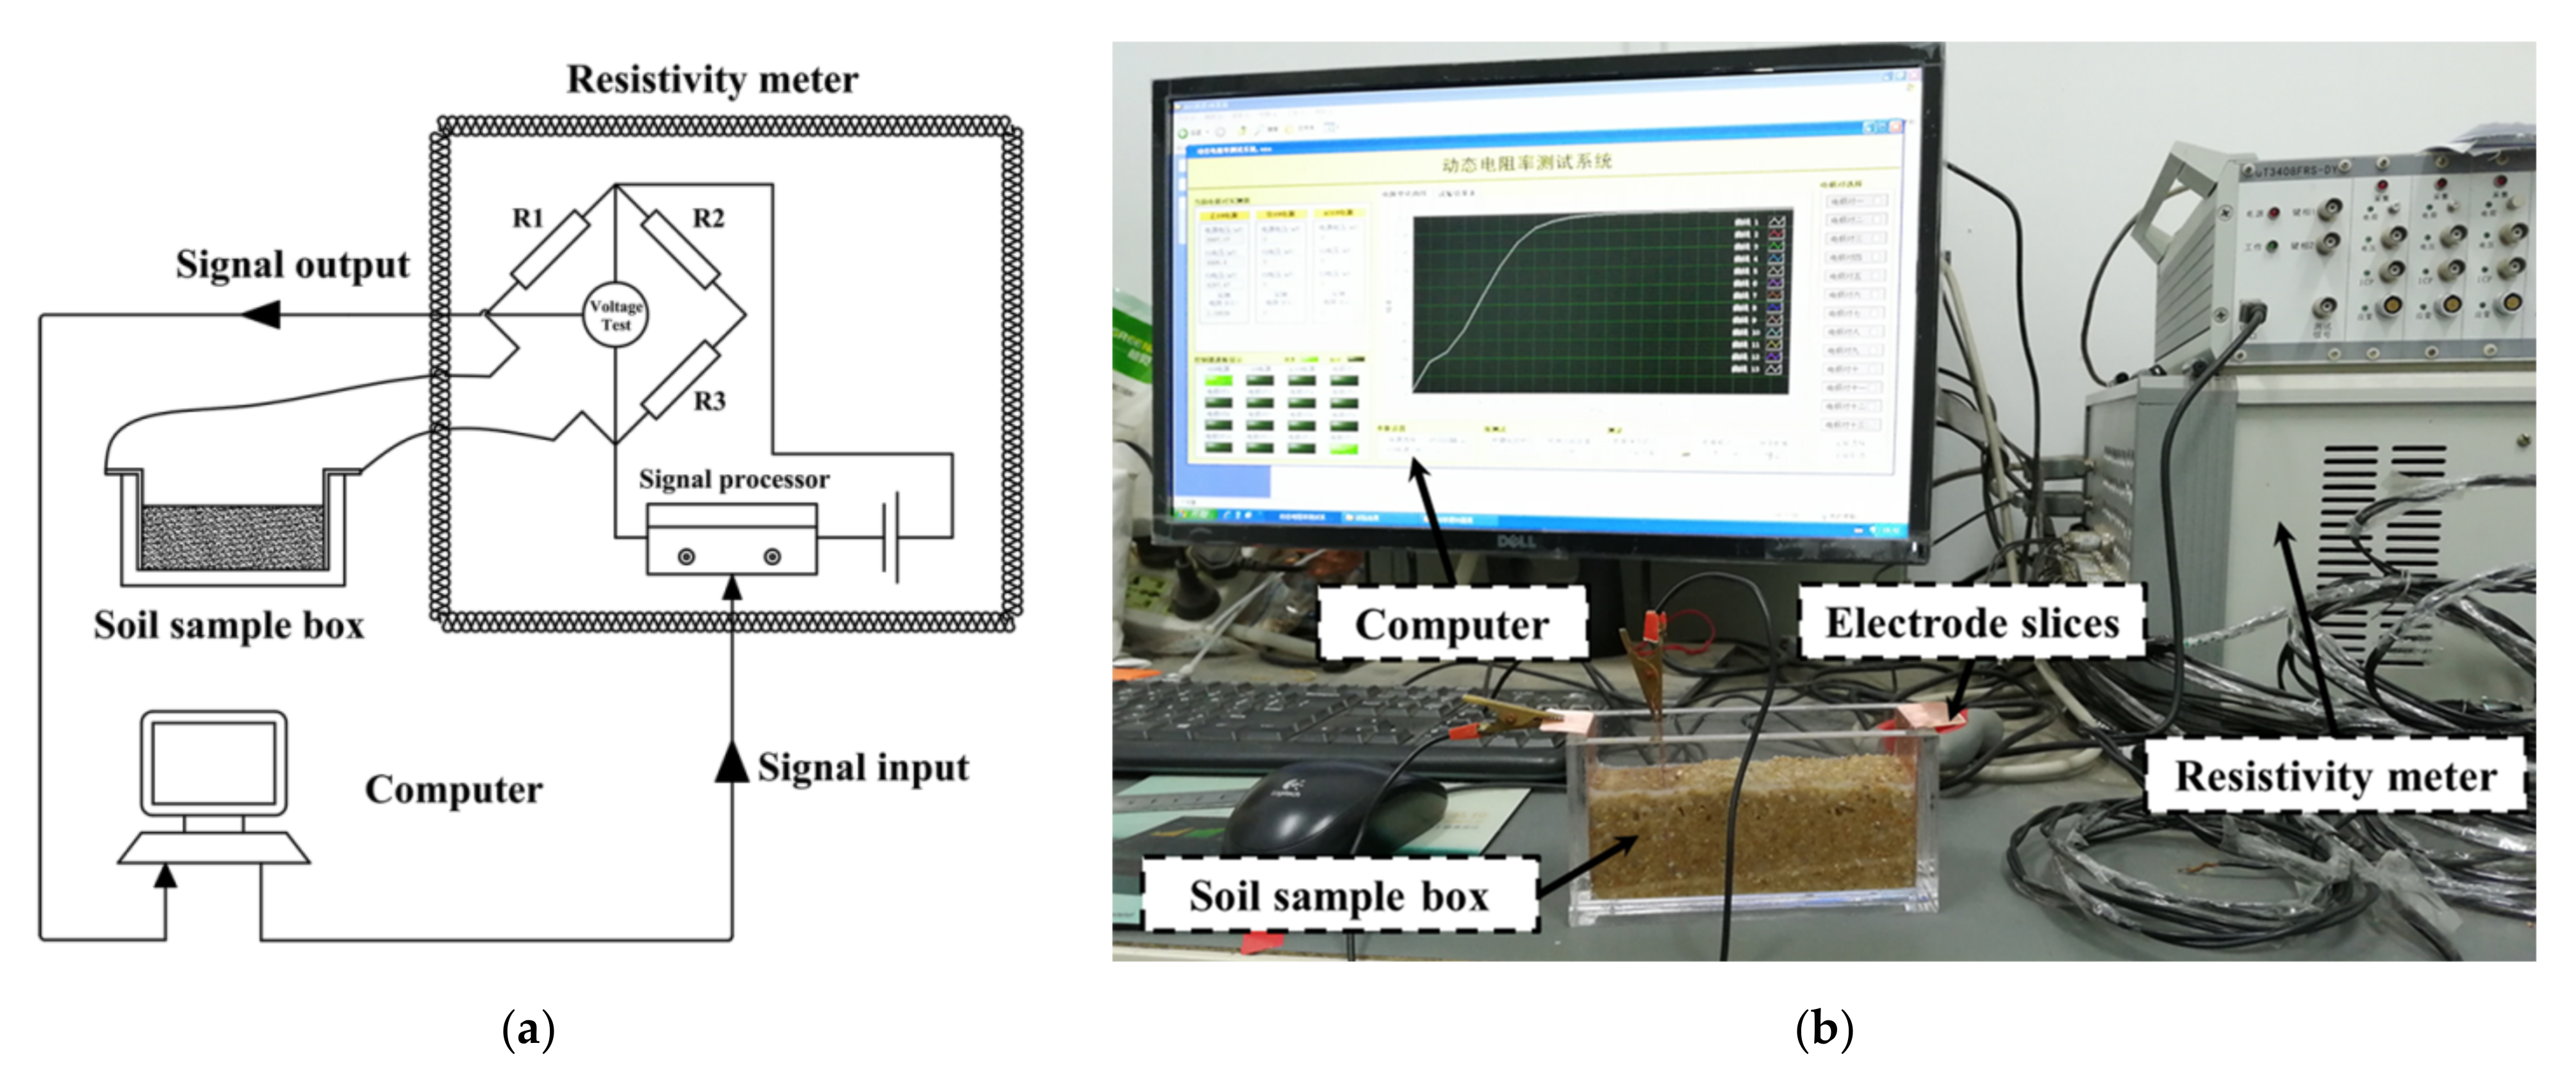
Figure 3.
Grain size distribution of two types of sand used in the experiments.
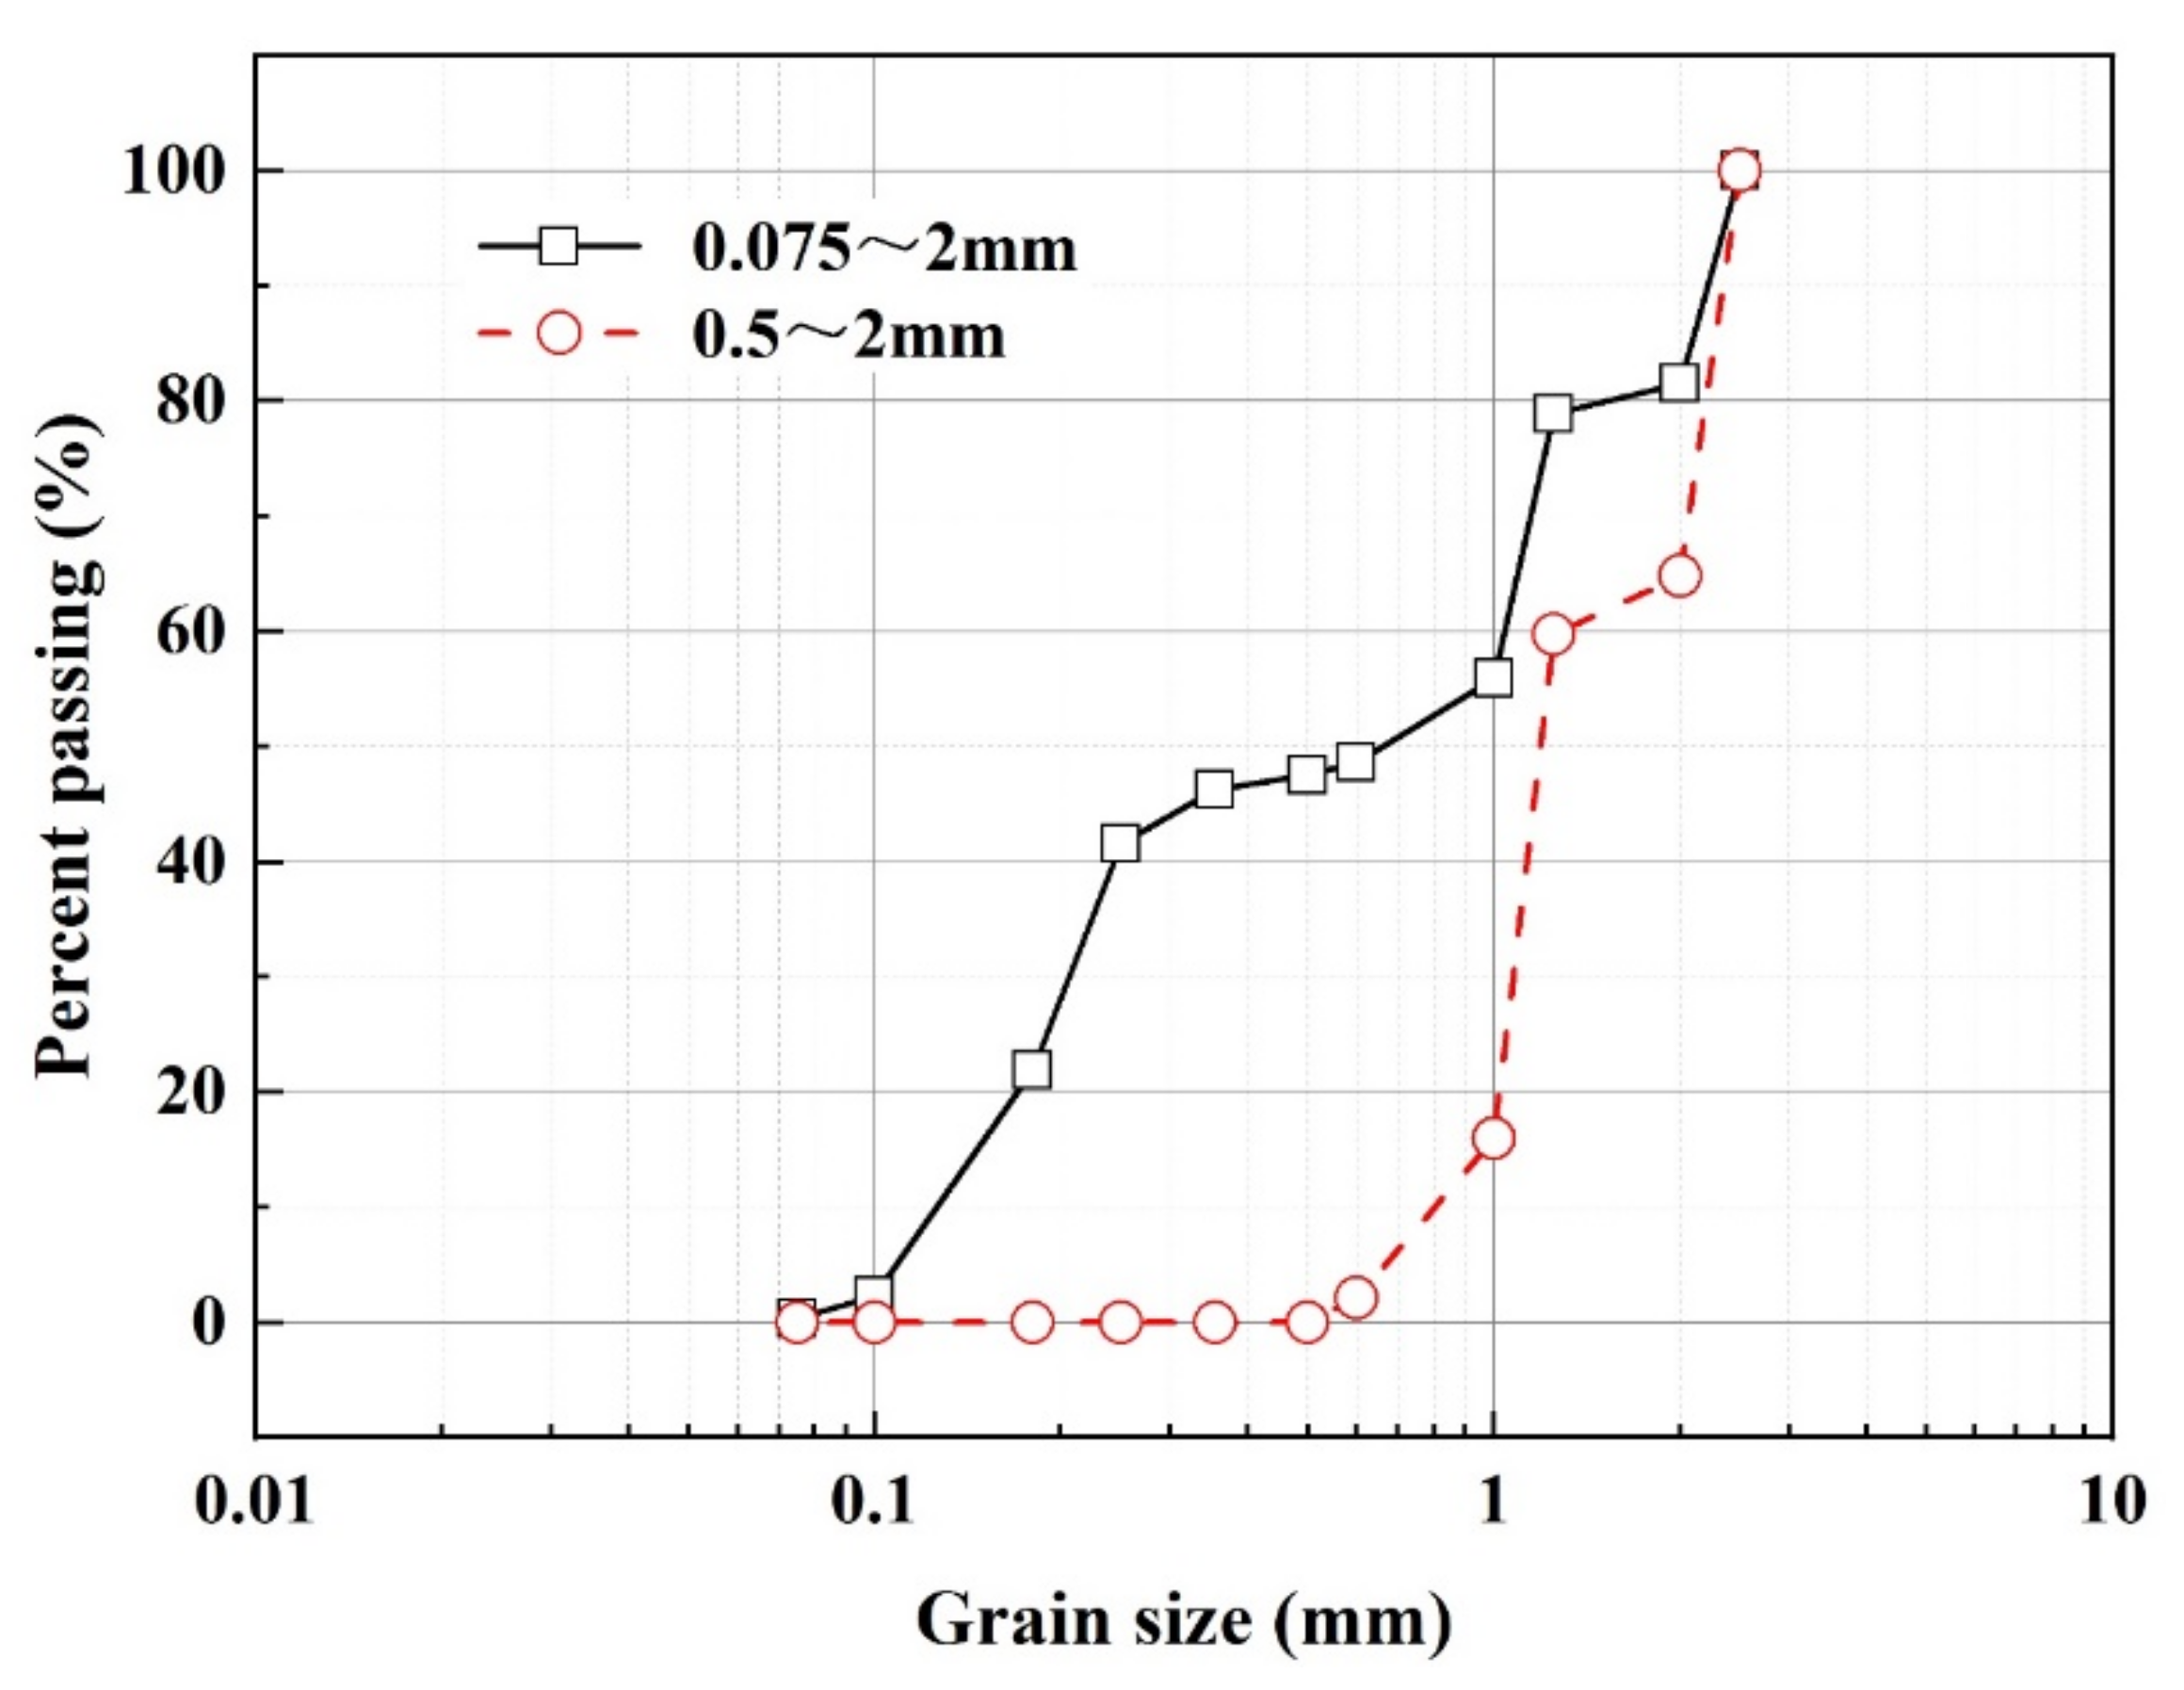
Figure 4.
Grain size distribution of bentonite particles.

Figure 5.
Electrical resistivity of the slurry and sand samples (0.5~2 mm) with different slurry concentrations.
Figure 5.
Electrical resistivity of the slurry and sand samples (0.5~2 mm) with different slurry concentrations.
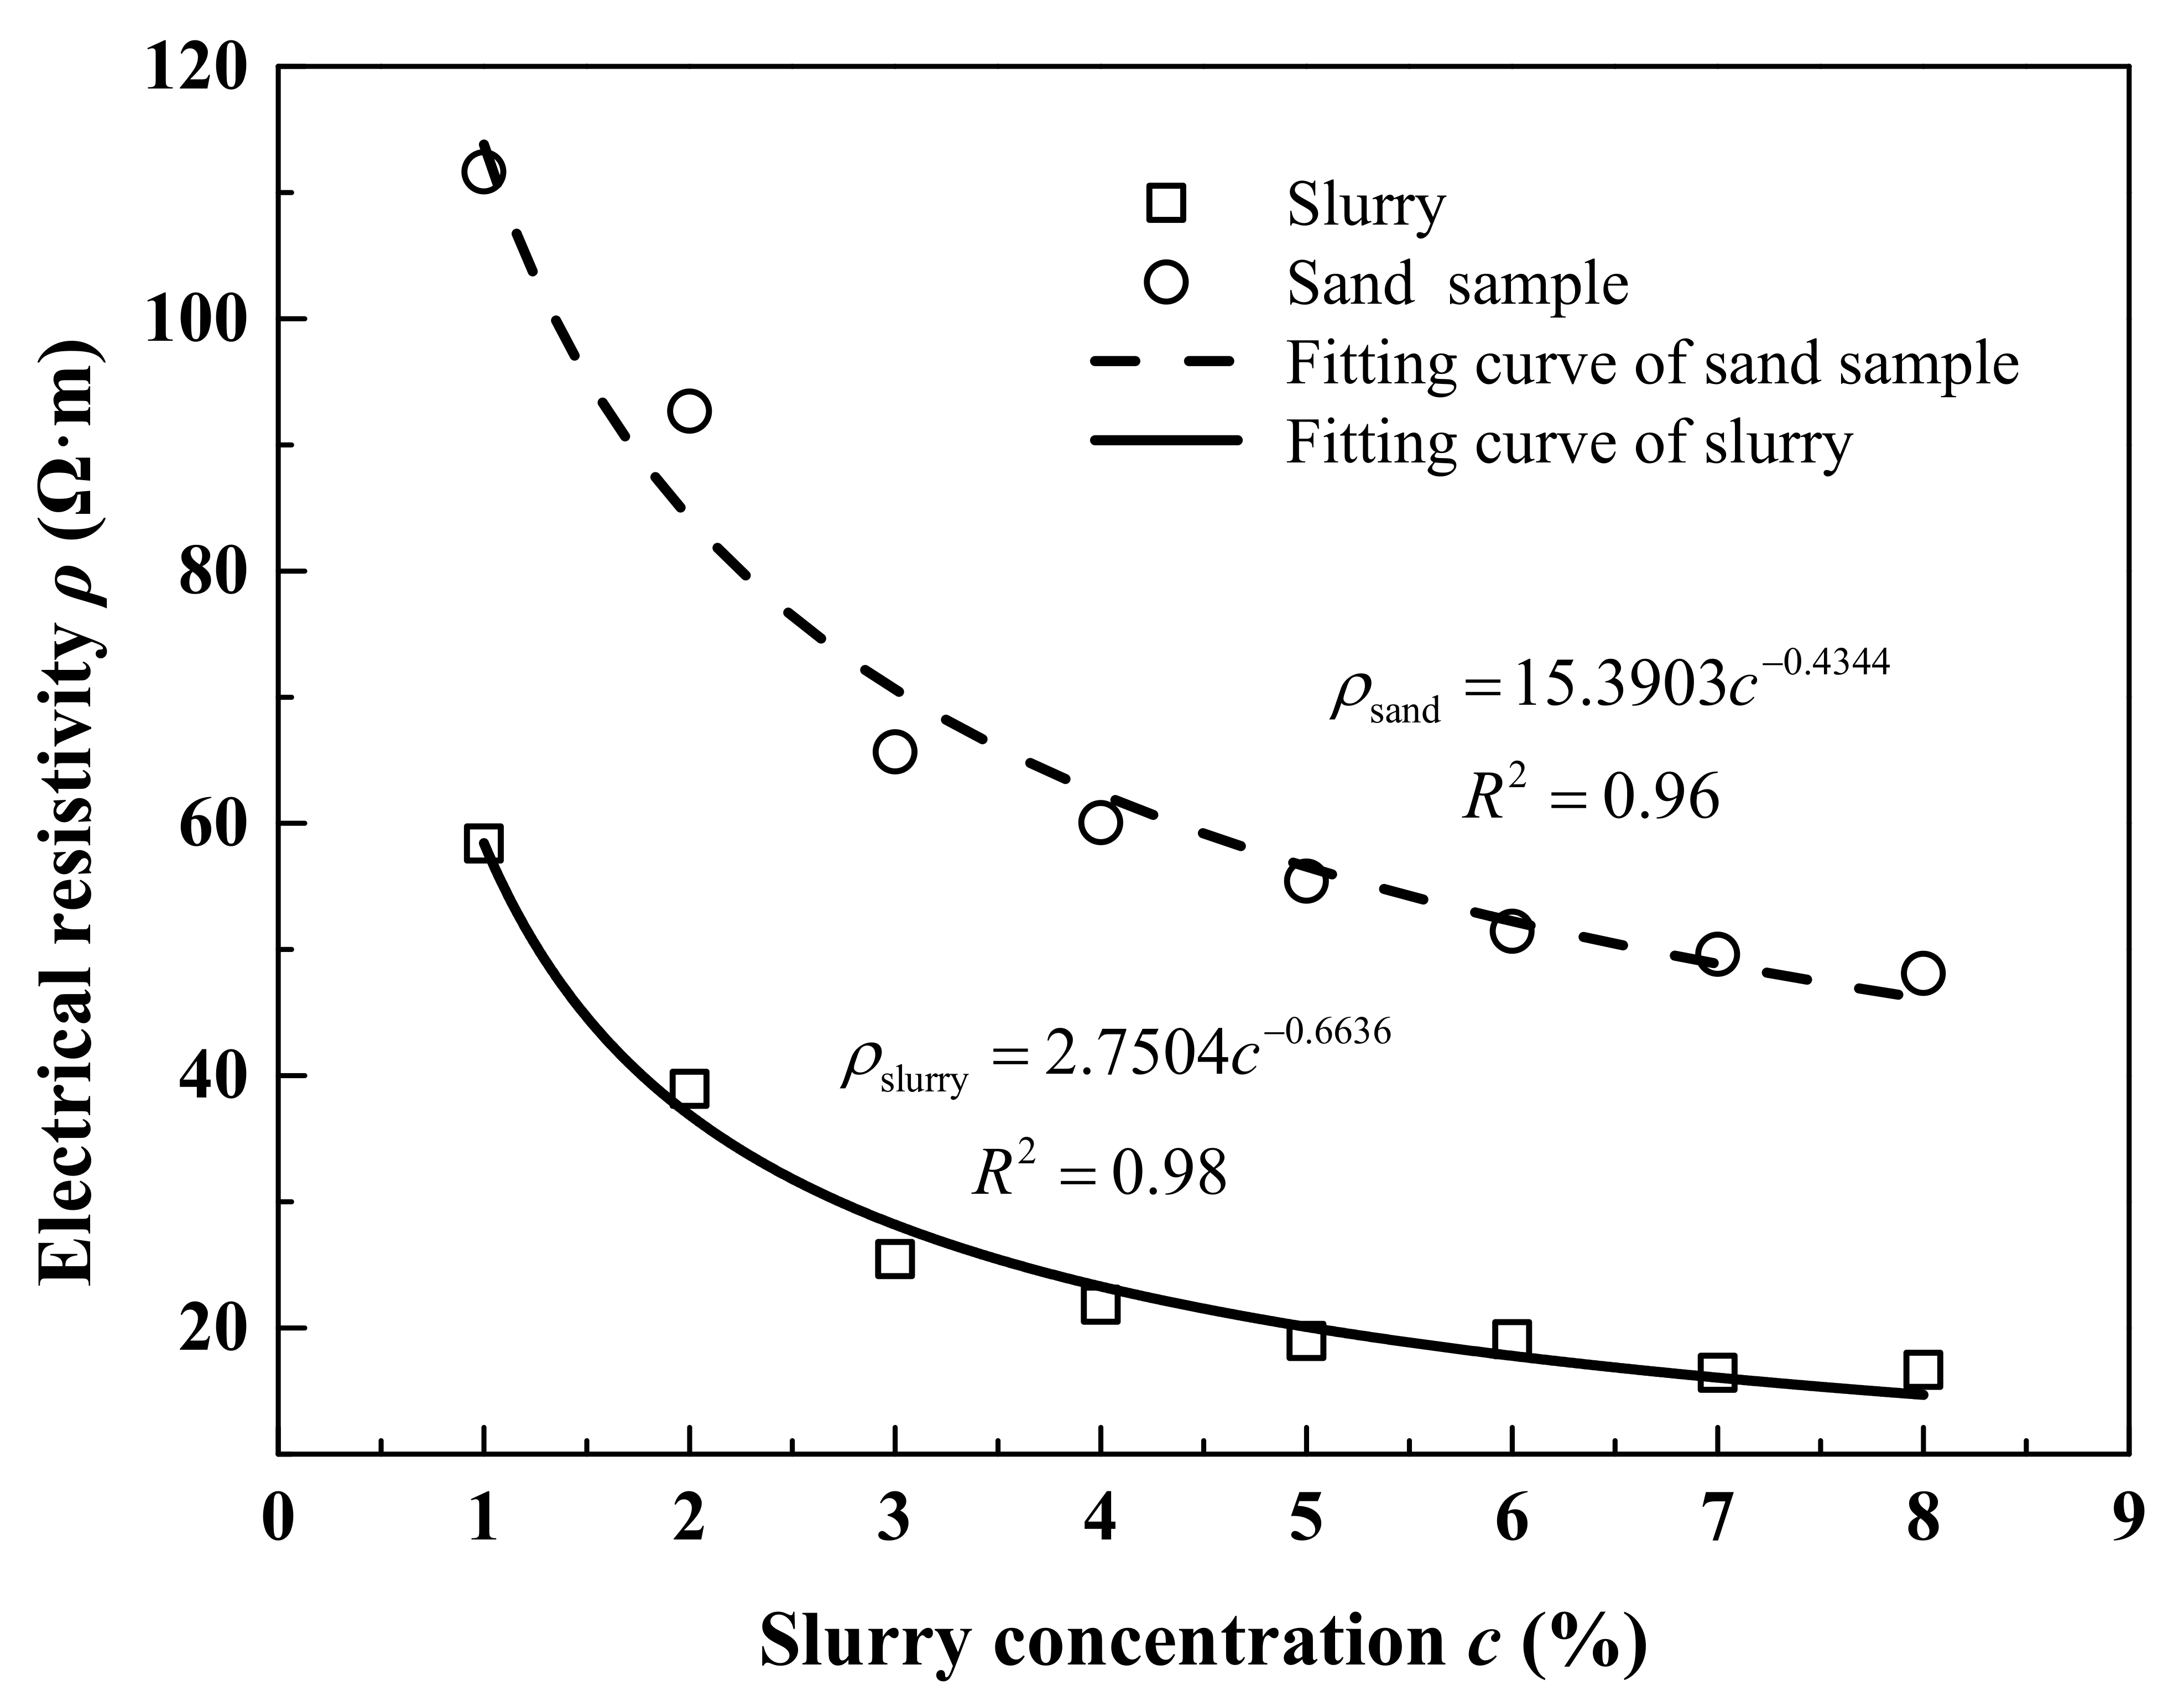
Figure 6.
Formation factor of sand samples (0.5~2 mm) with different slurry concentrations.
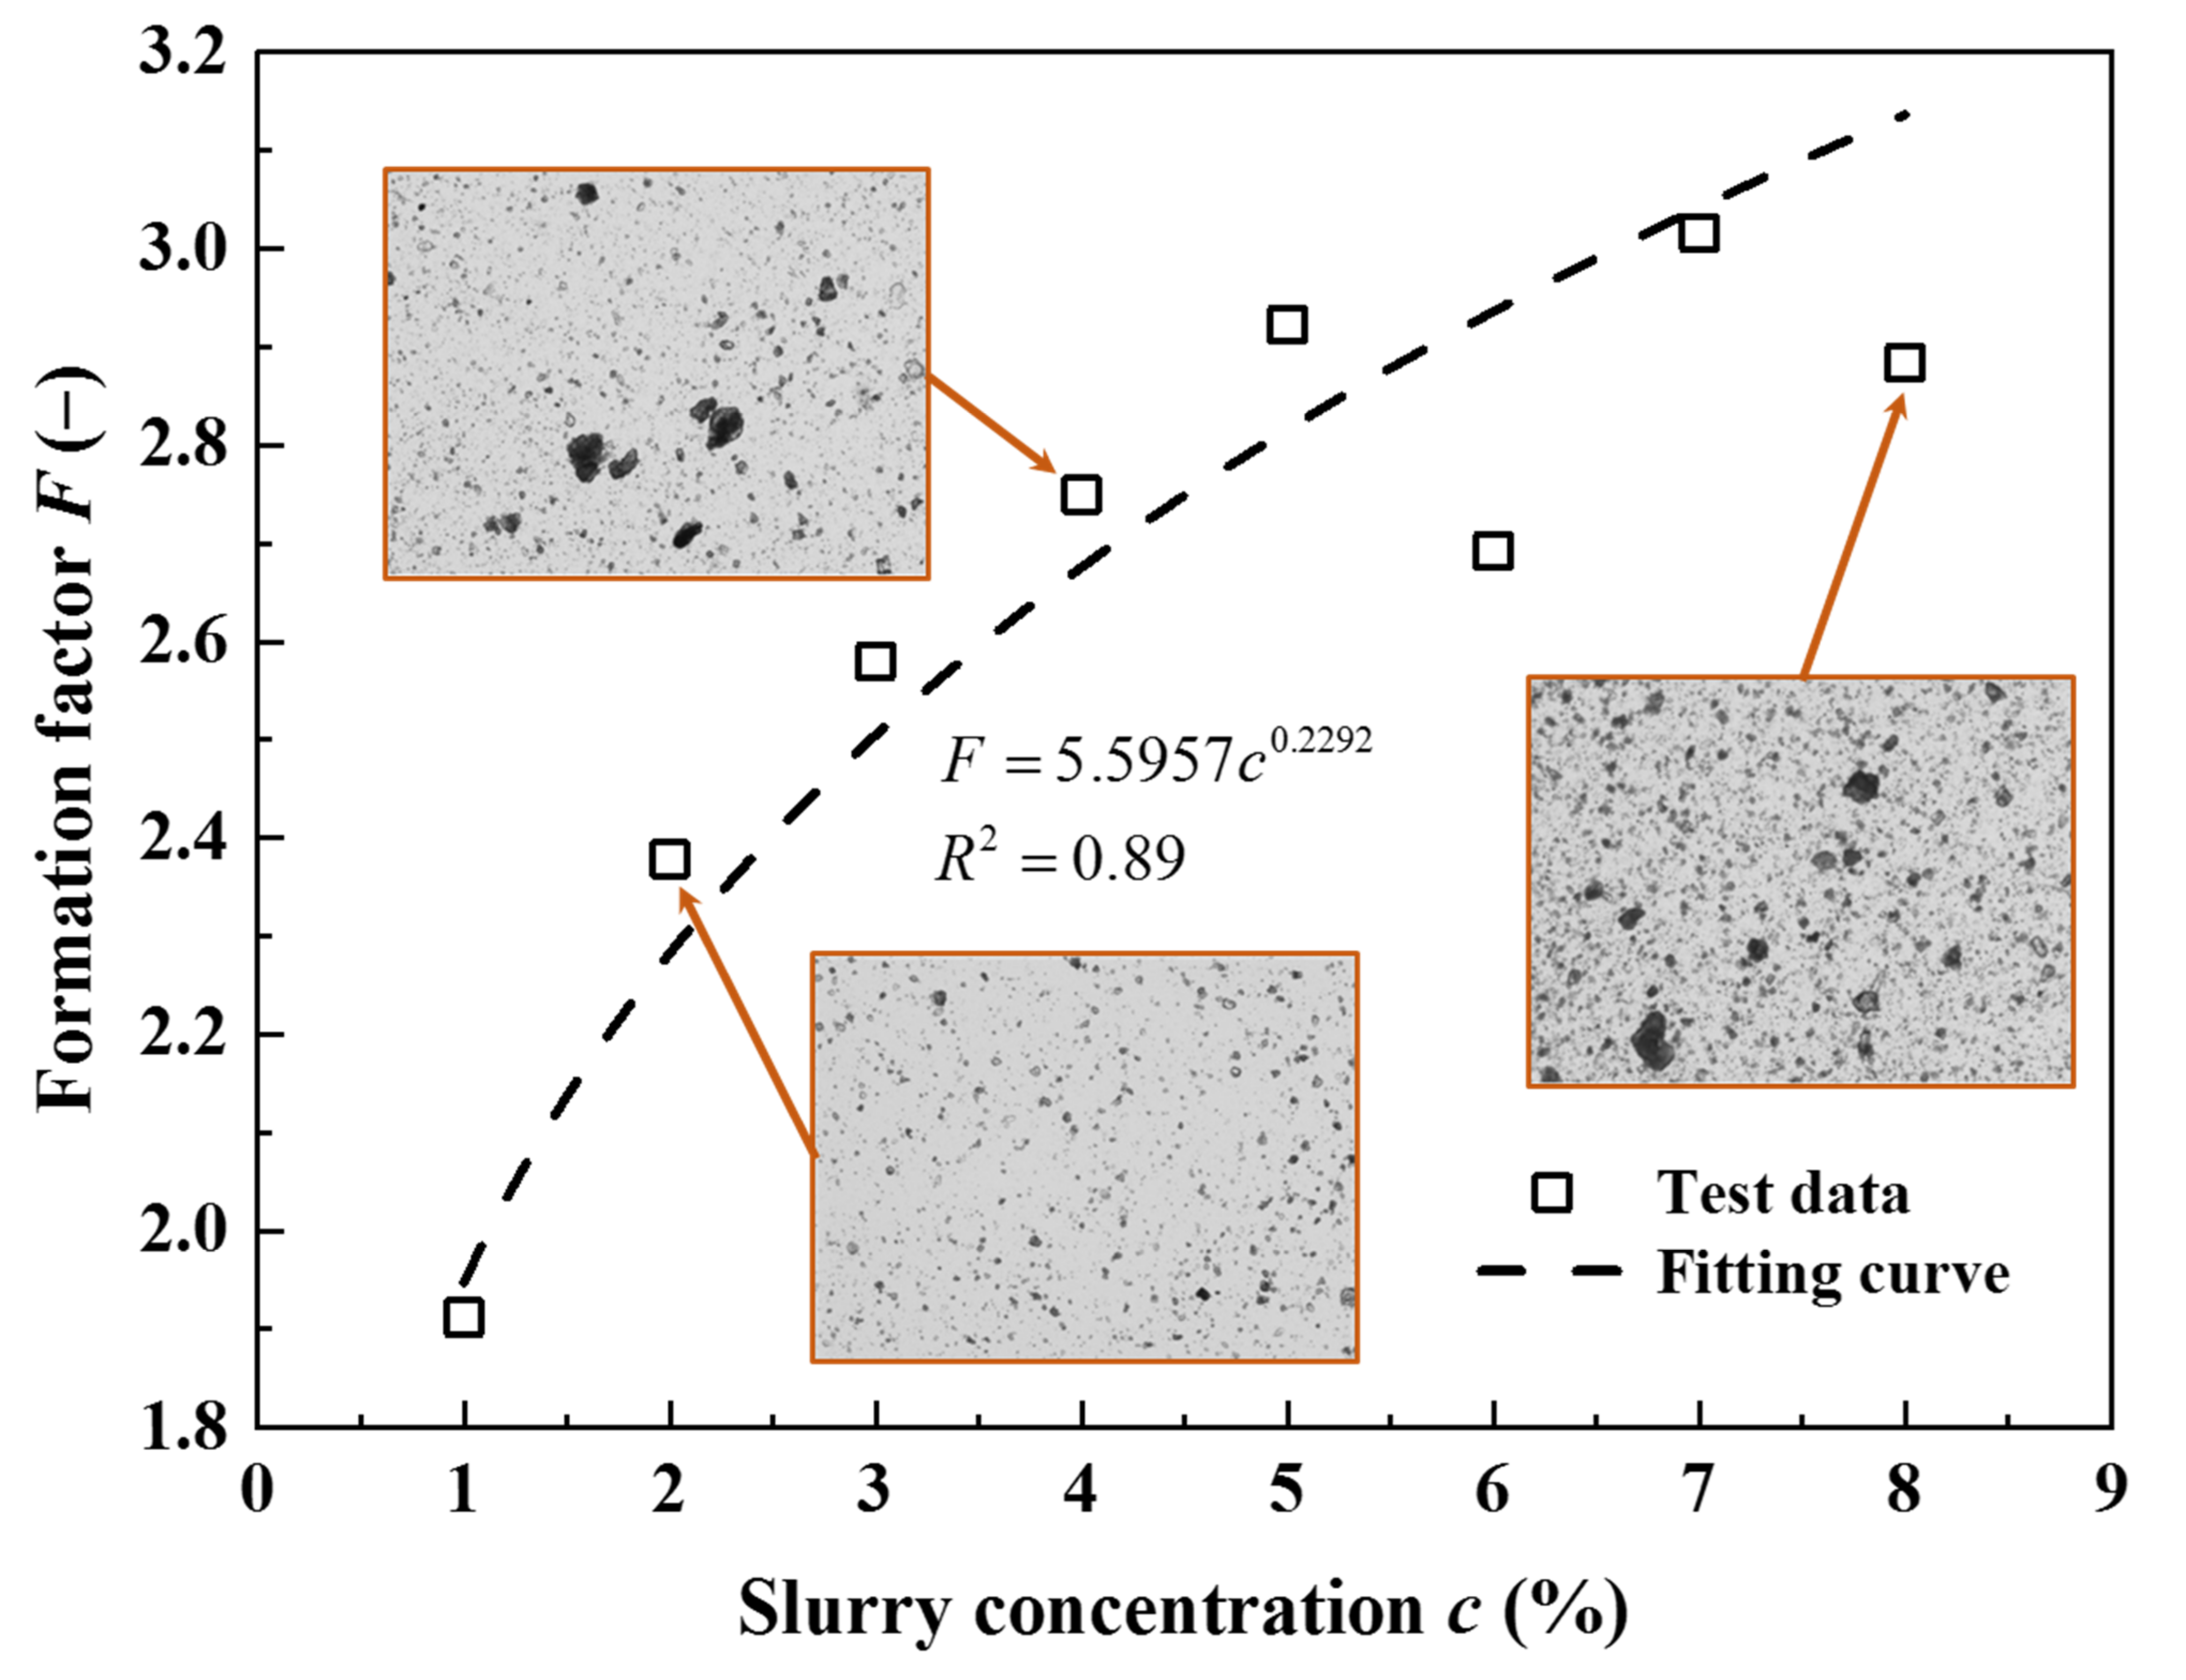
Figure 7.
Electrical resistivity of sand samples (0.5~2 mm) with different slurry concentrations.
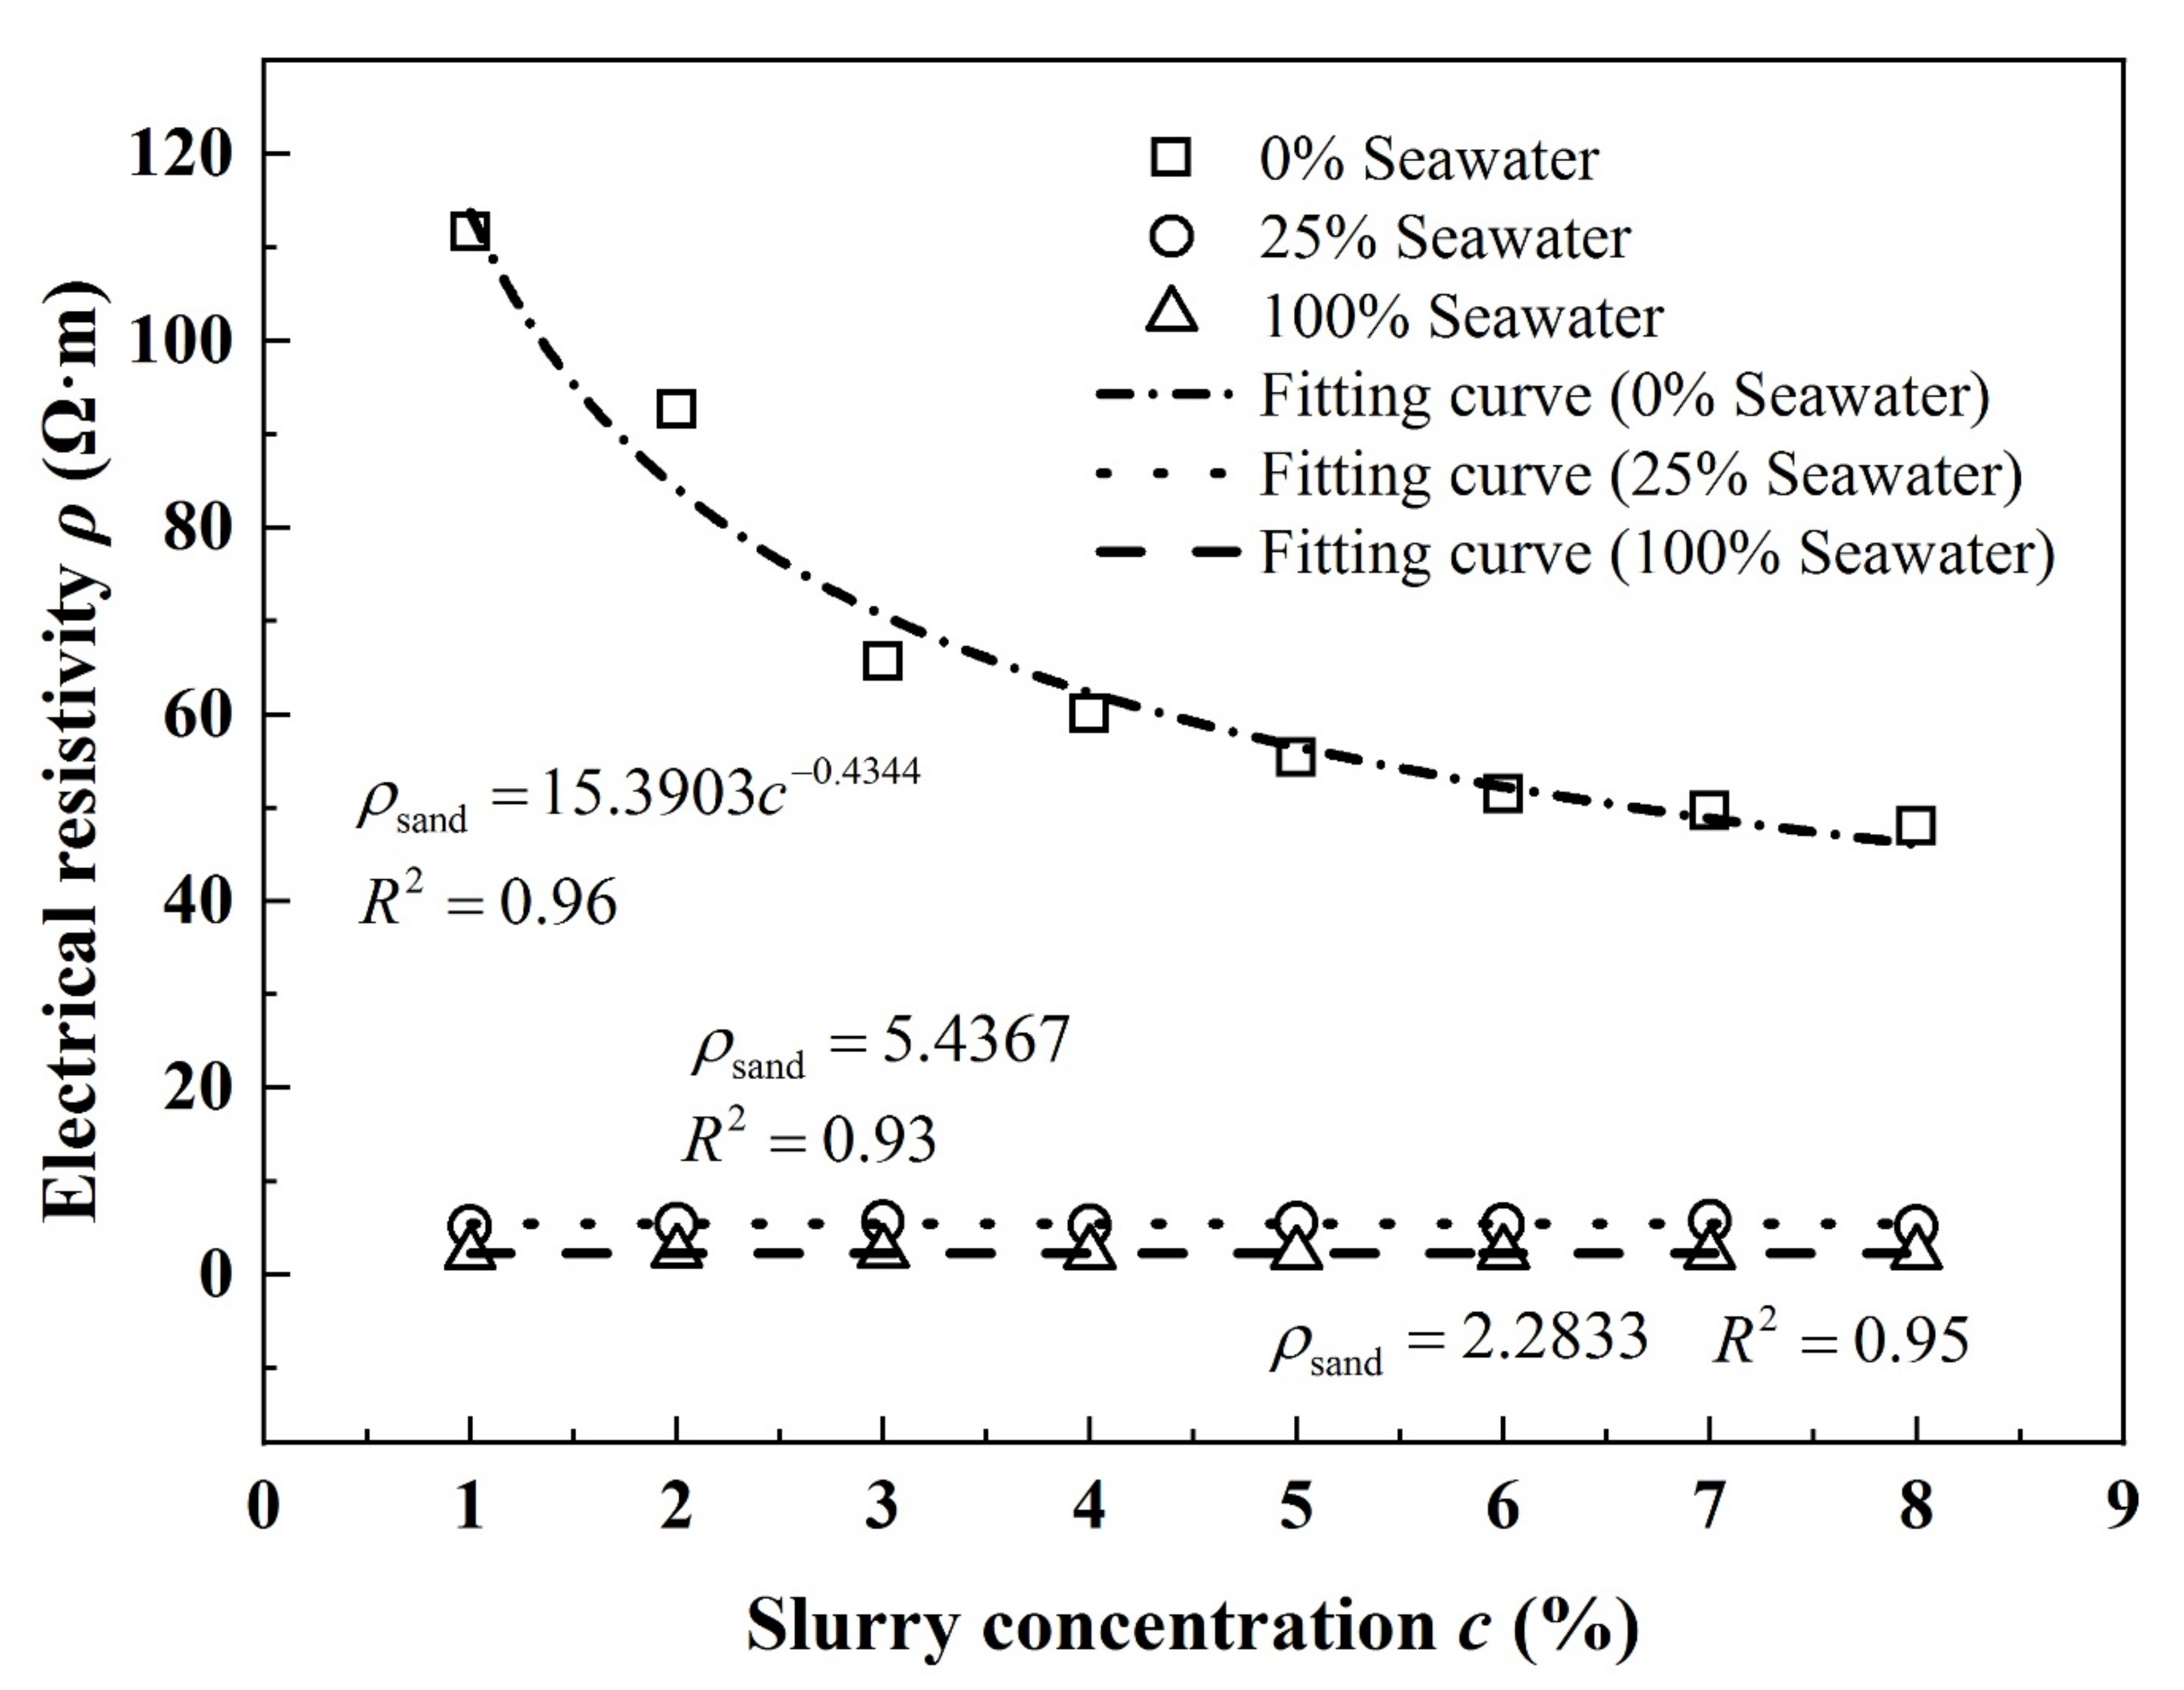
Figure 8.
Relation between formation factor of sand samples and slurry concentrations with different water environments.
Figure 8.
Relation between formation factor of sand samples and slurry concentrations with different water environments.
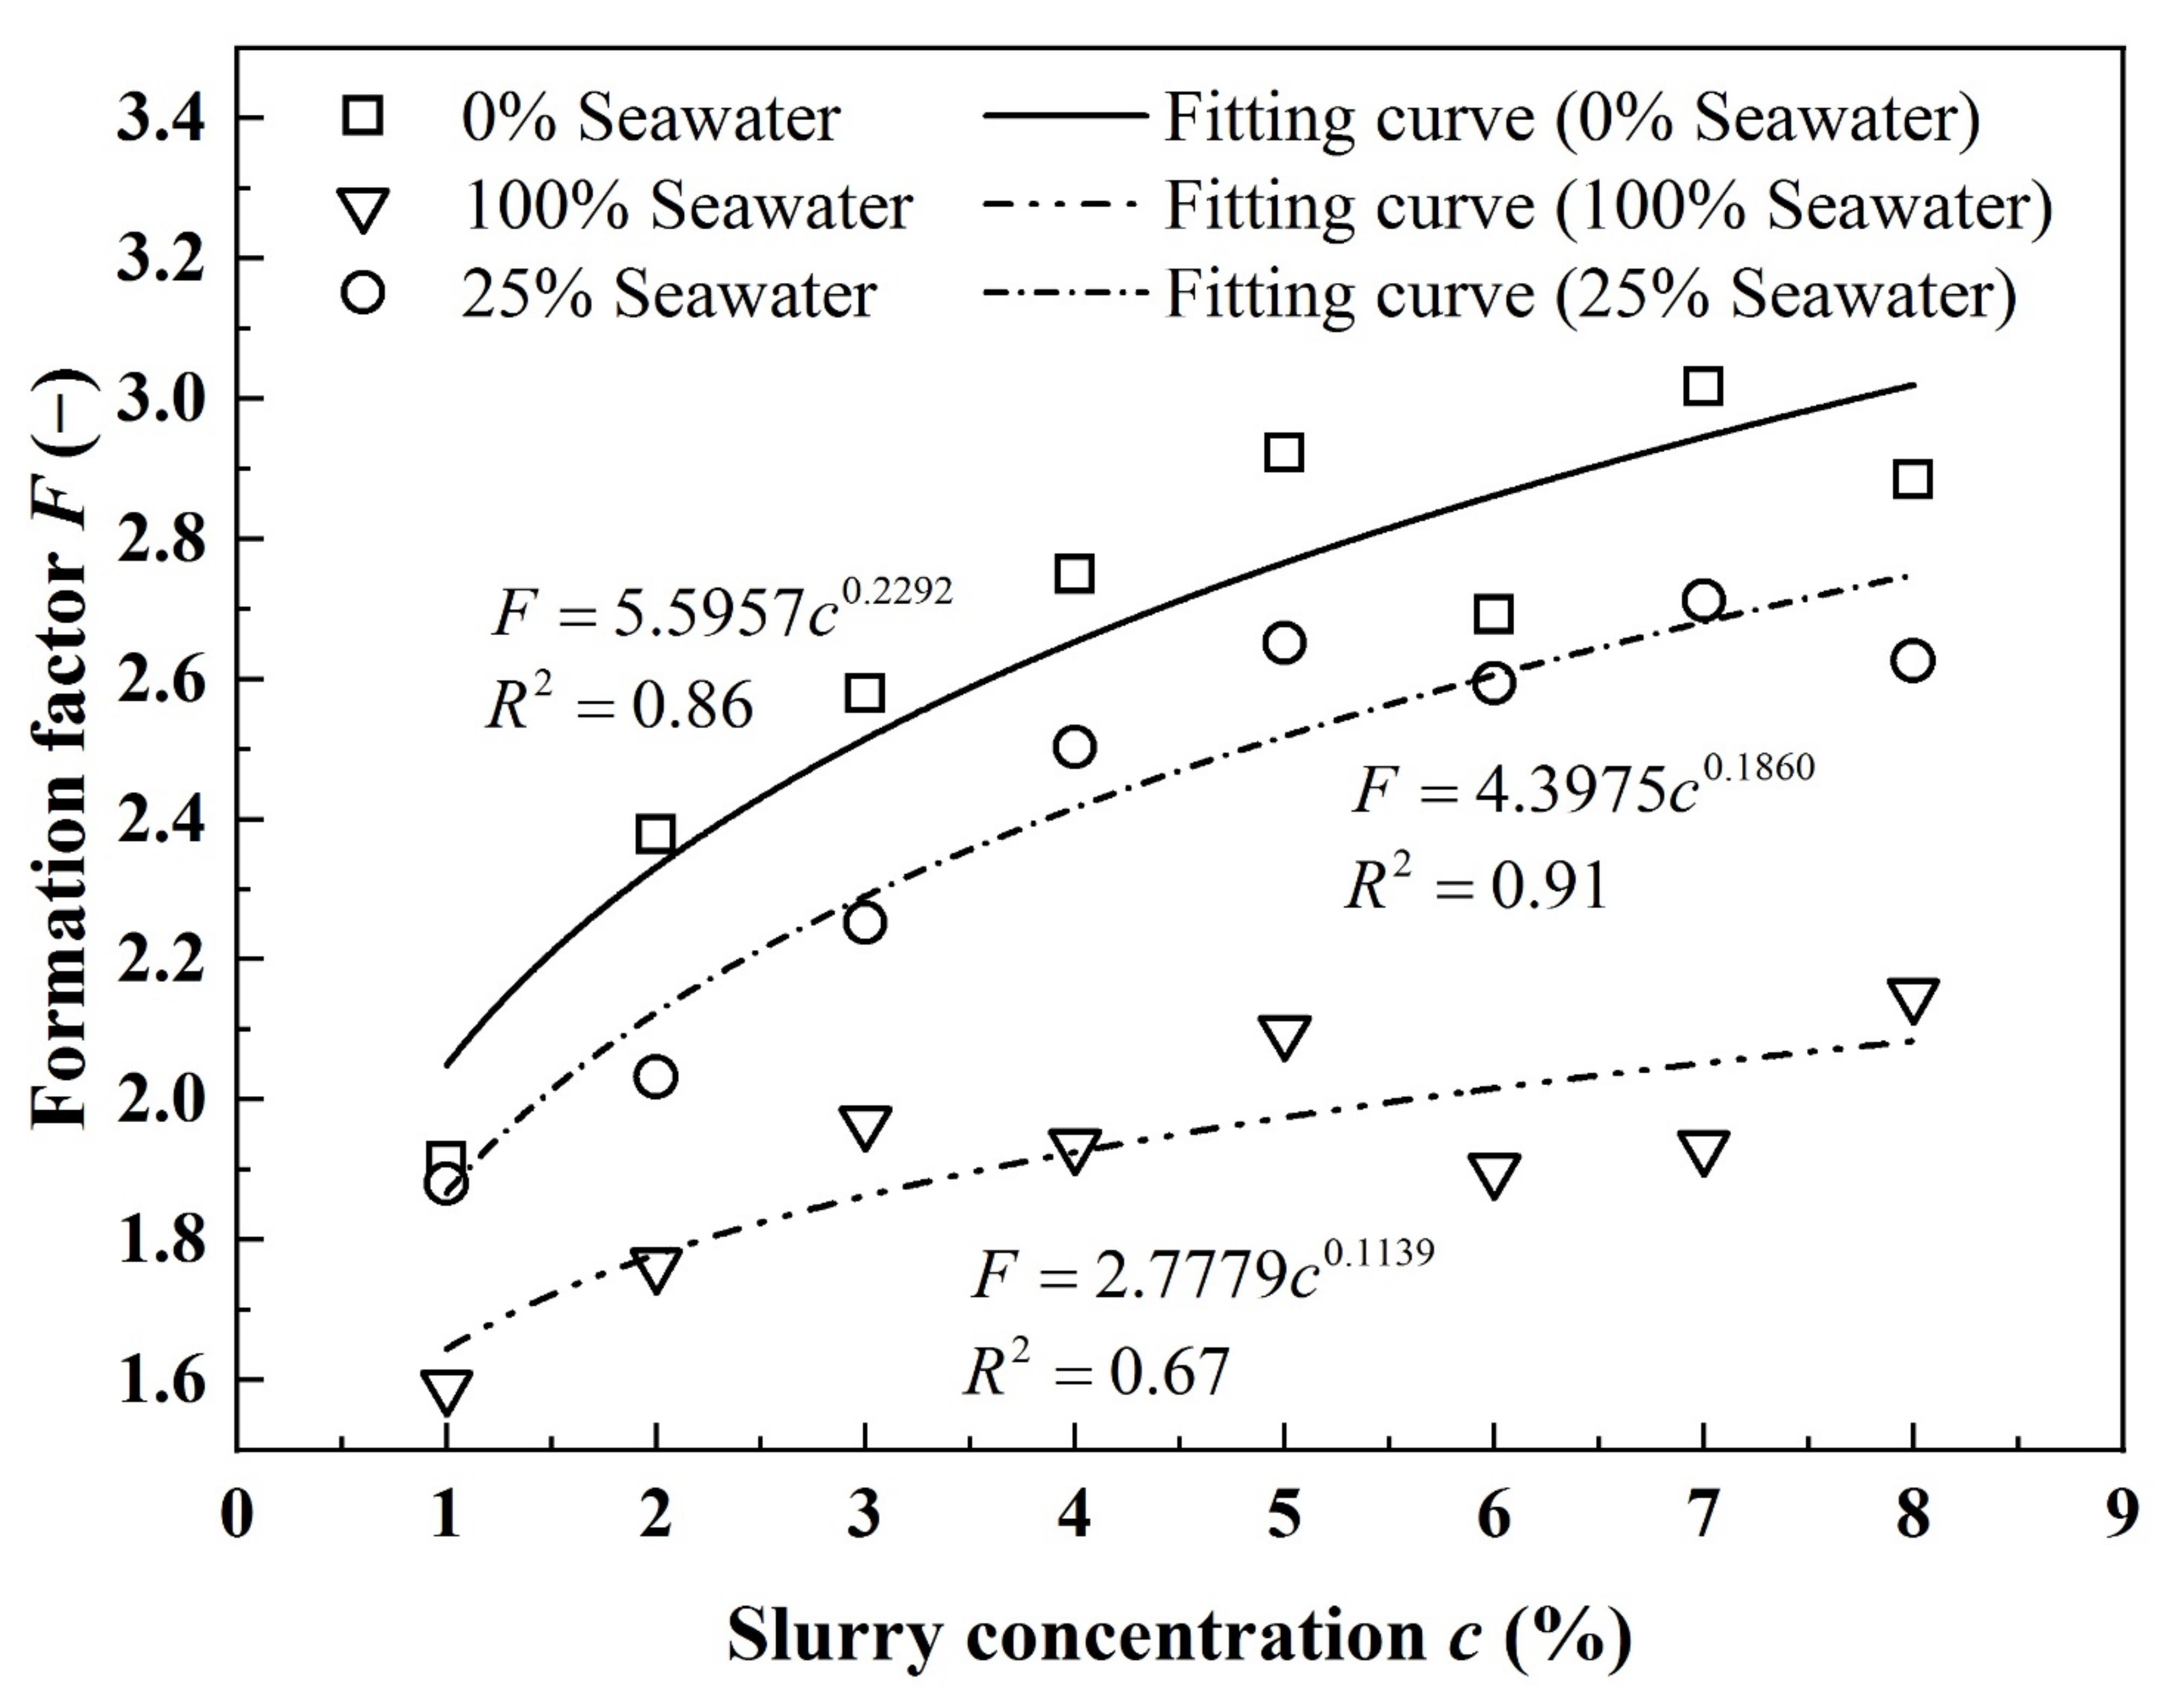
Figure 9.
Schemes of slurry particle distribution. (a) Seawater. (b) Deionized water.

Figure 10.
Relation between electrical resistivity of the samples (slurry and sand) and slurry concentrations with different CMC contents.
Figure 10.
Relation between electrical resistivity of the samples (slurry and sand) and slurry concentrations with different CMC contents.
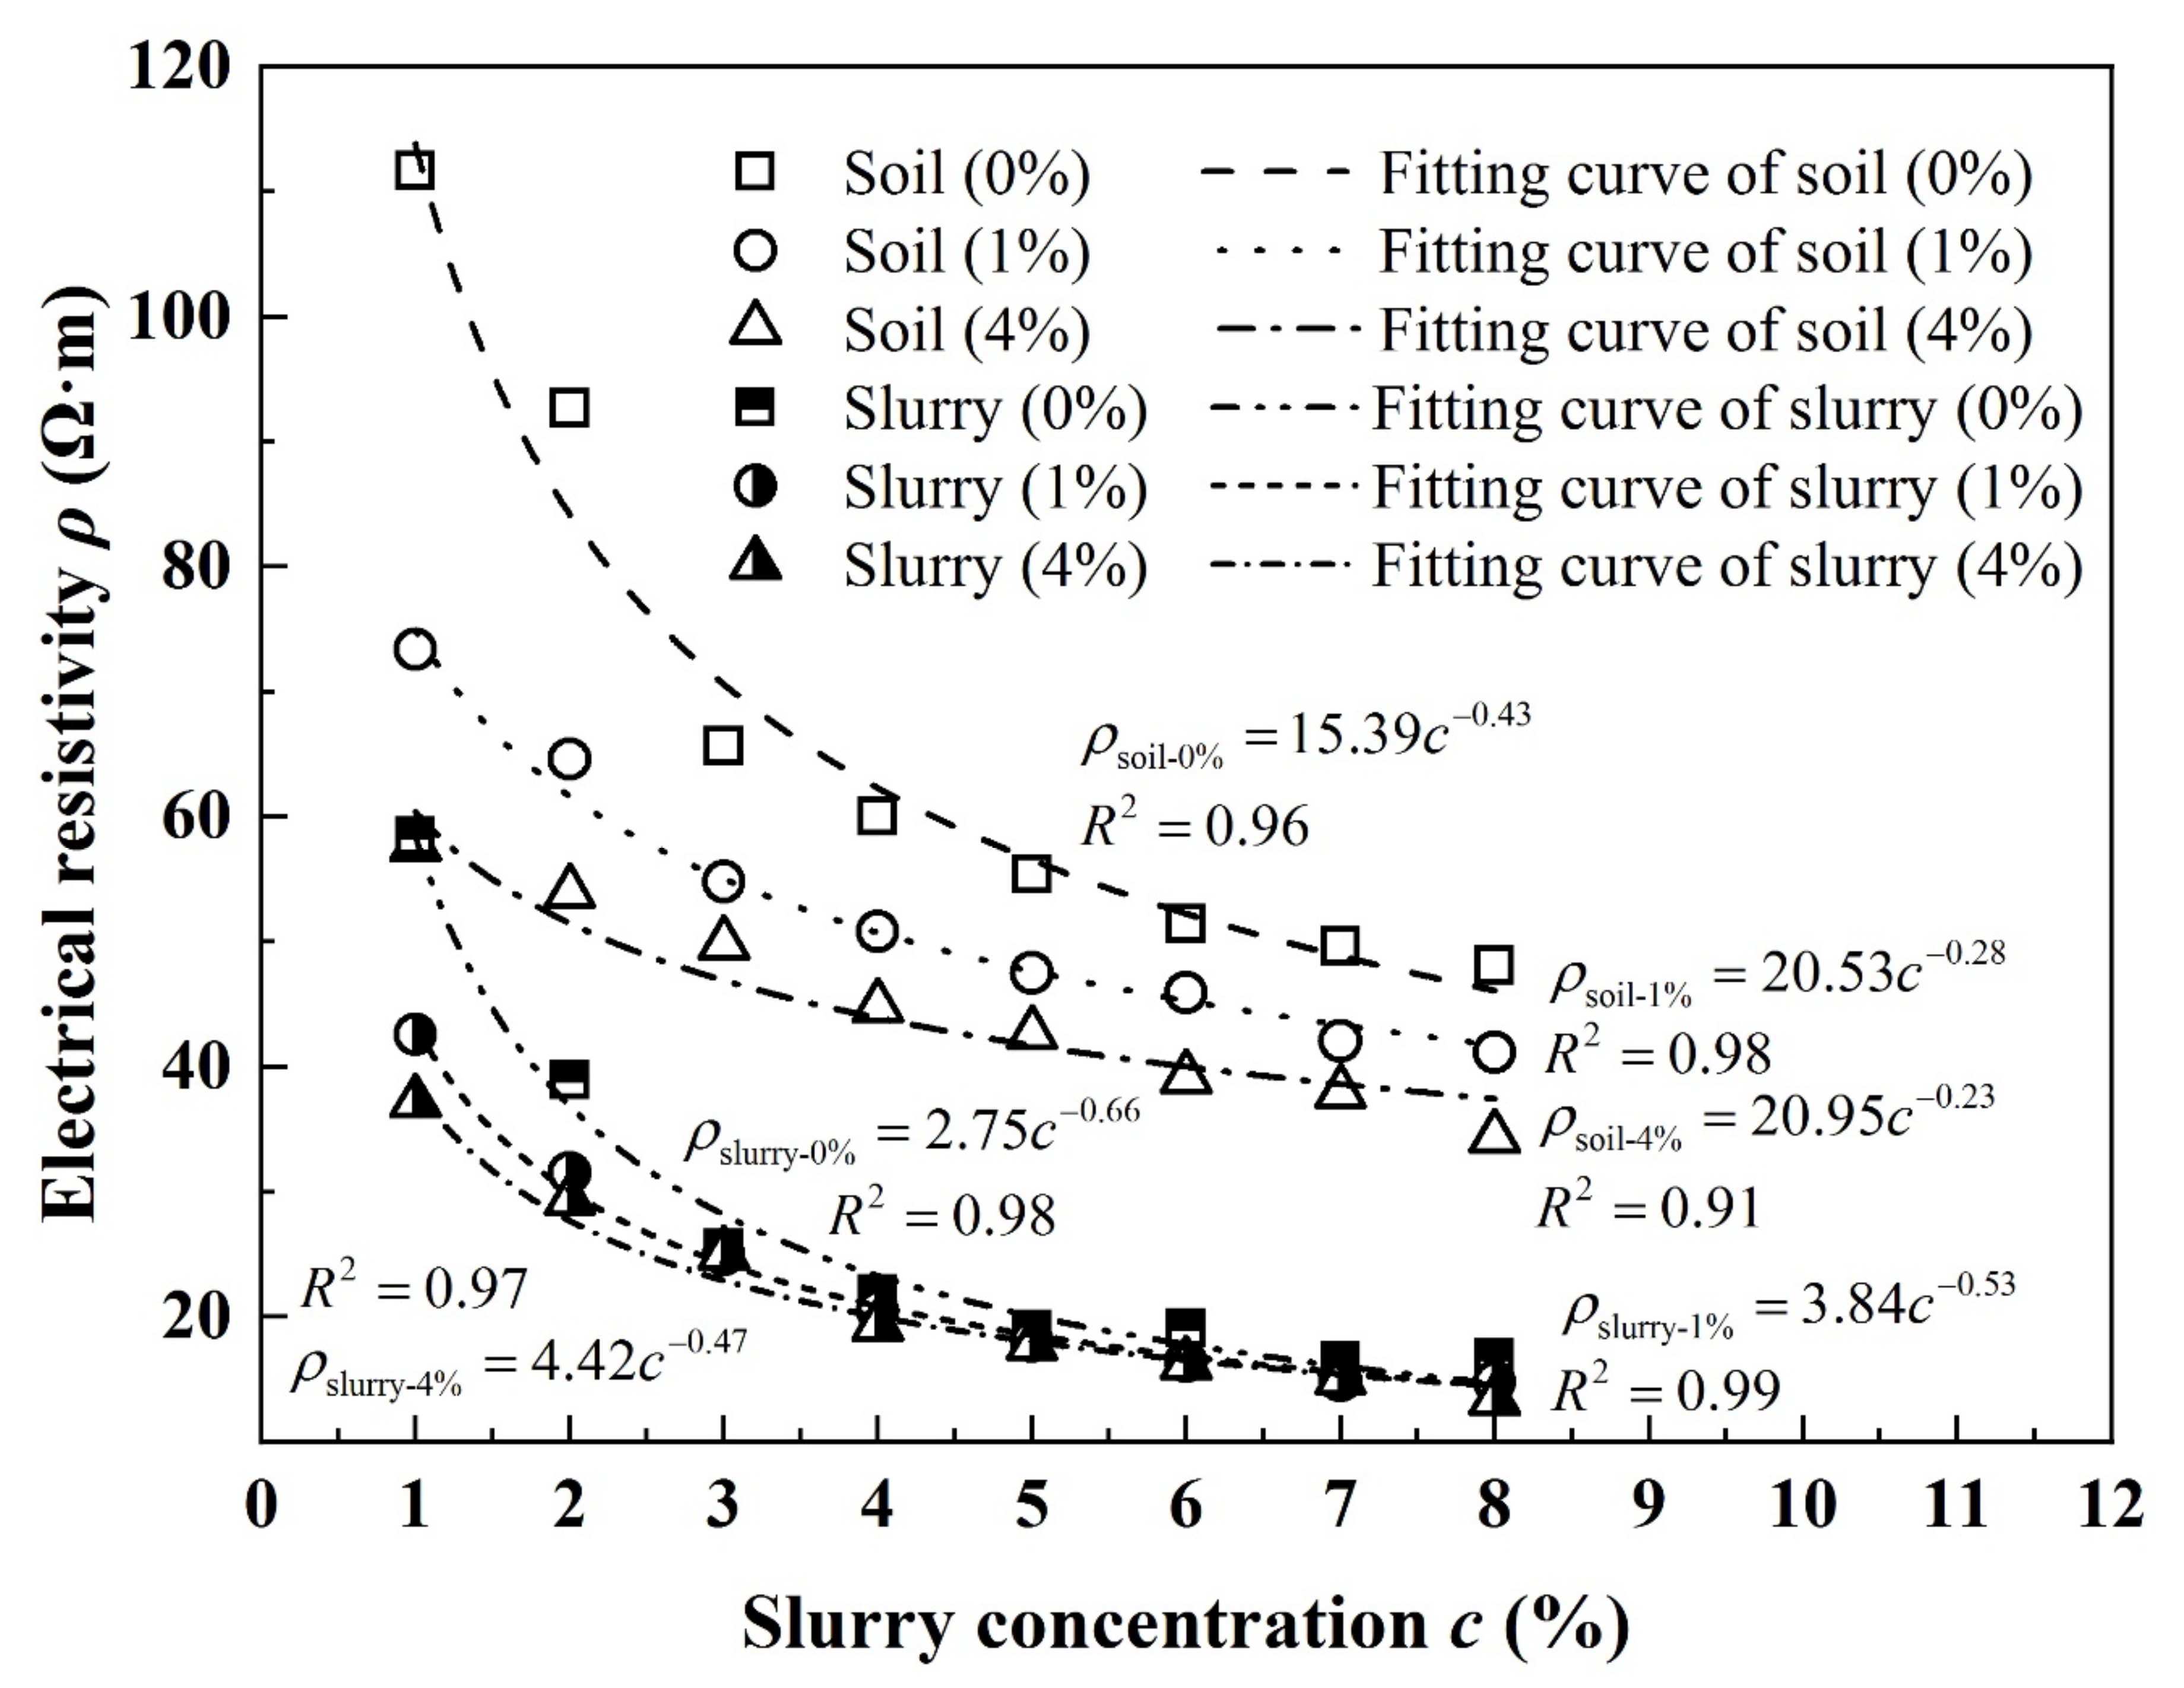
Figure 11.
Formation factor of soil samples (0.5~2 mm) with different slurry concentrations.
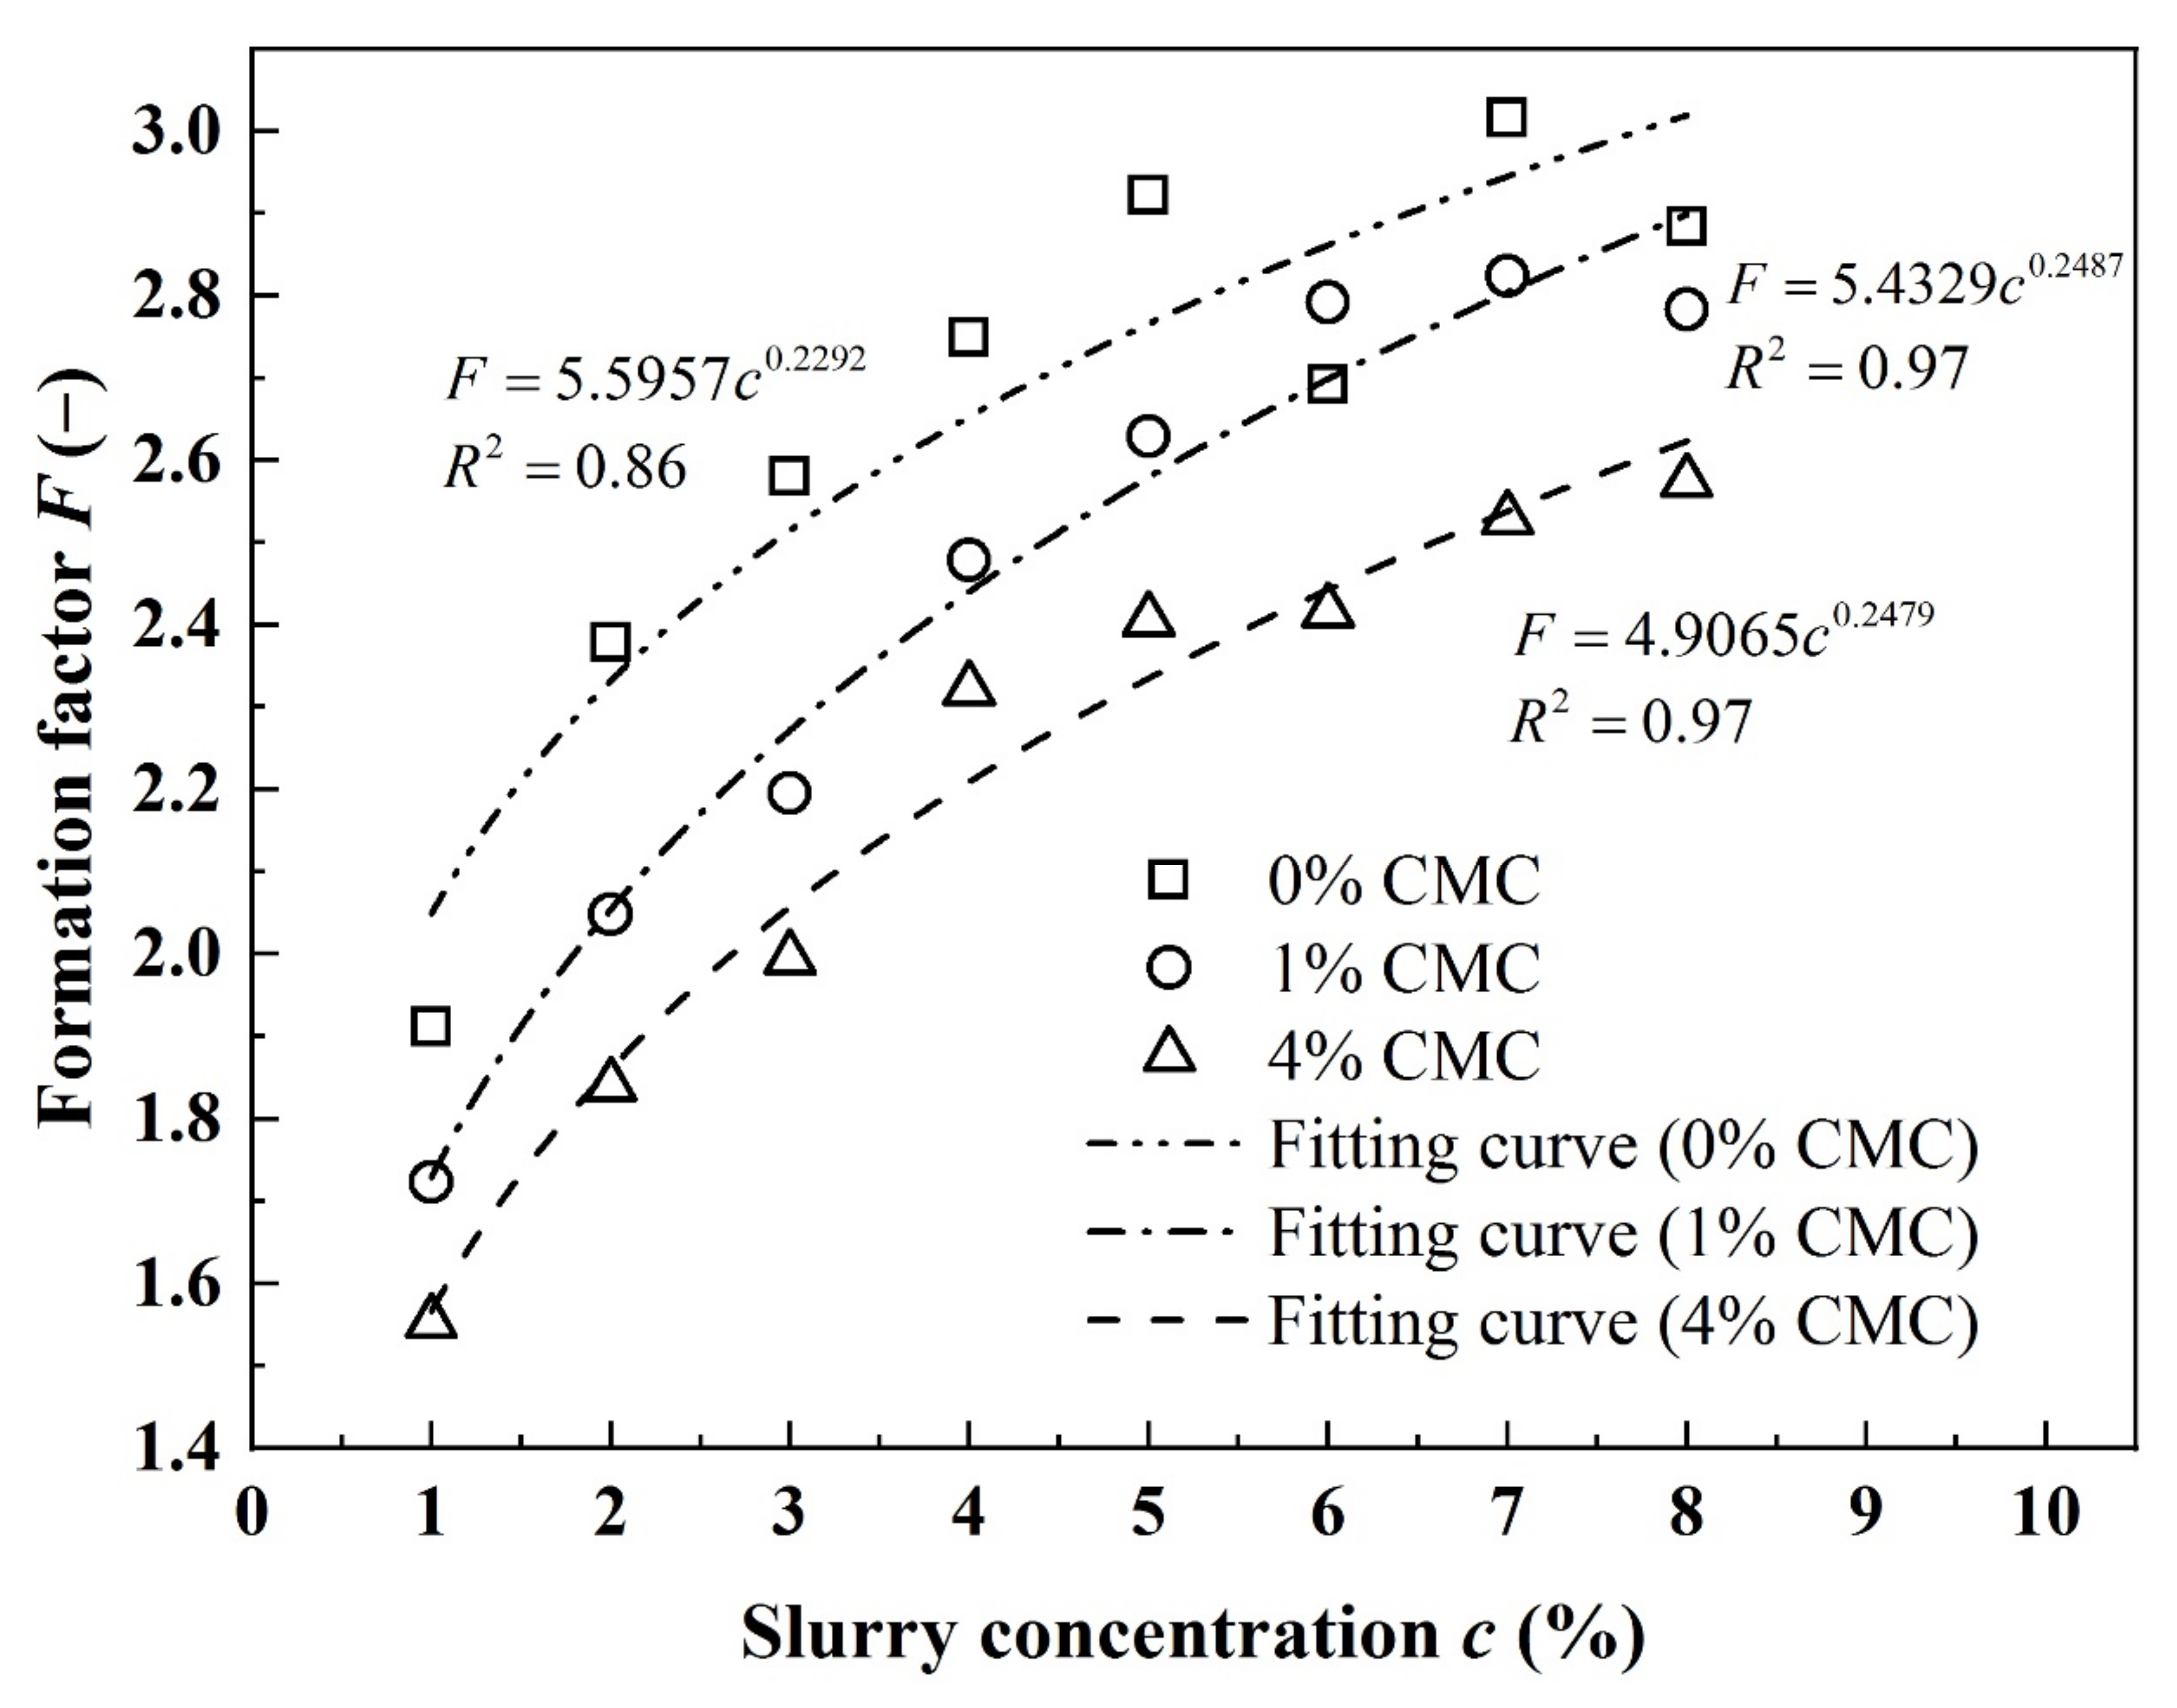
Figure 12.
Frequency distribution of slurry aggregate size.
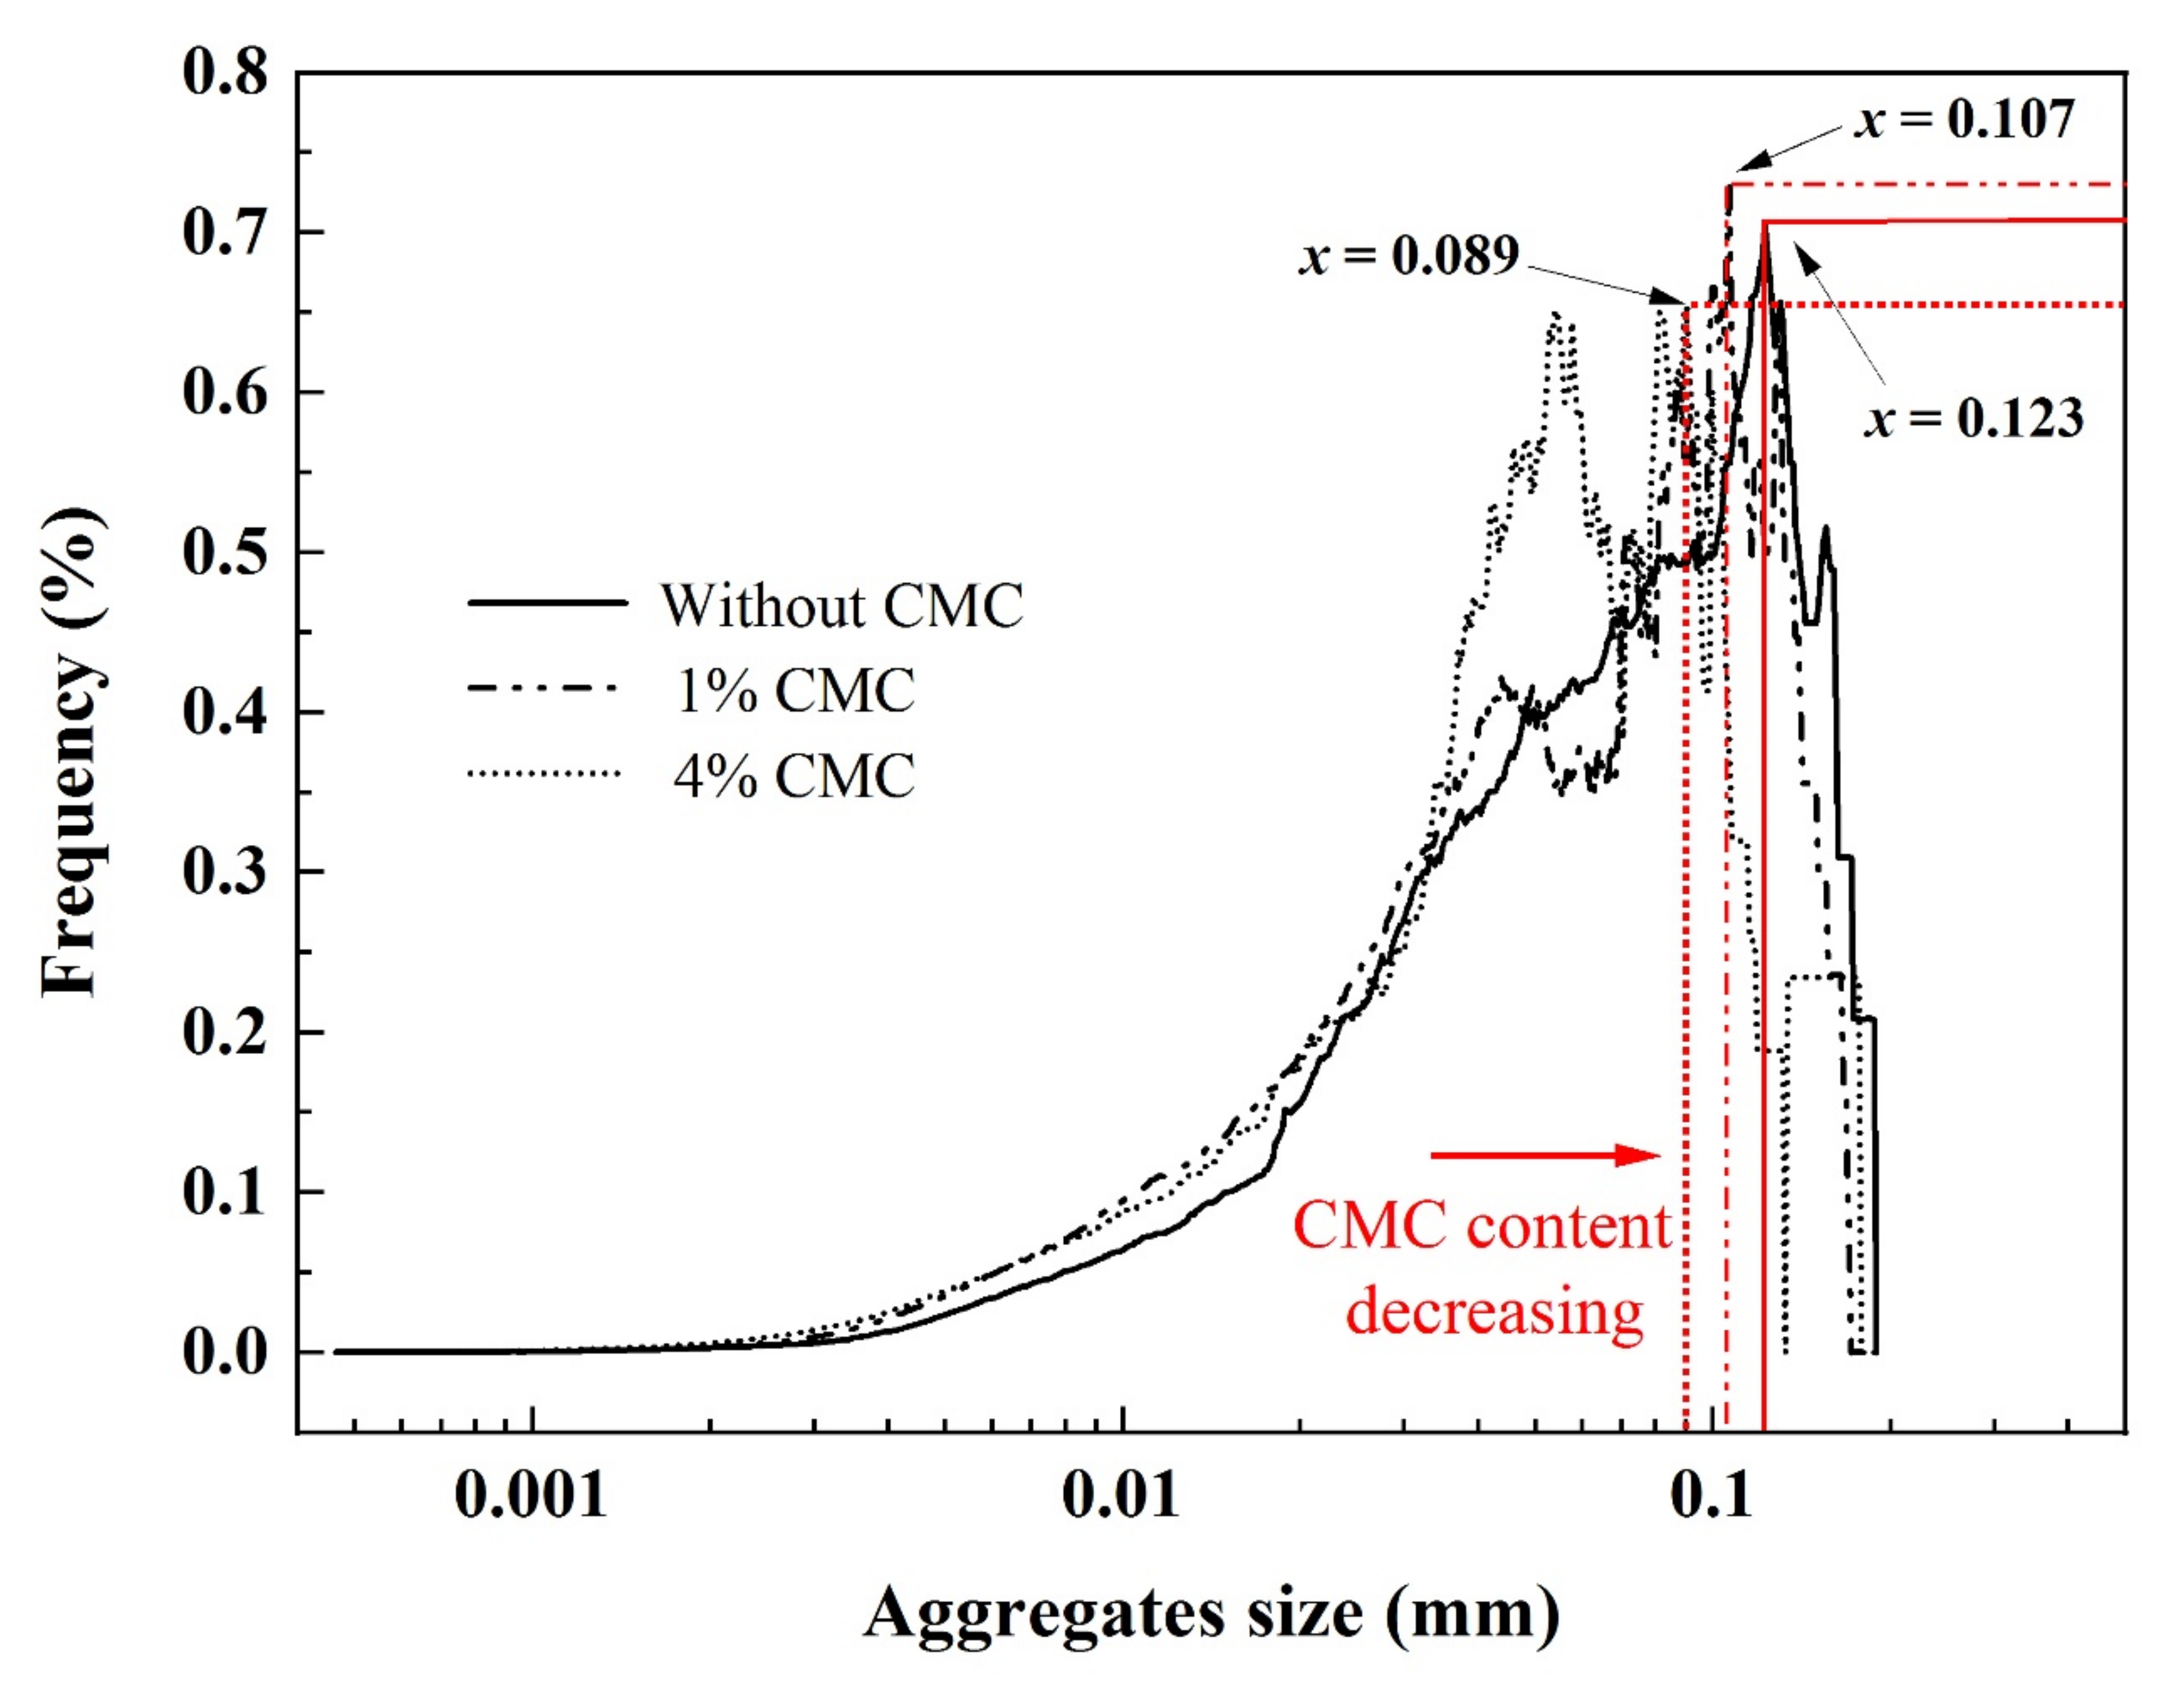
Figure 13.
Micrographs of slurry with magnification at 20×. (a) 0% CMC. (b) 1% CMC. (c) 4% CMC.
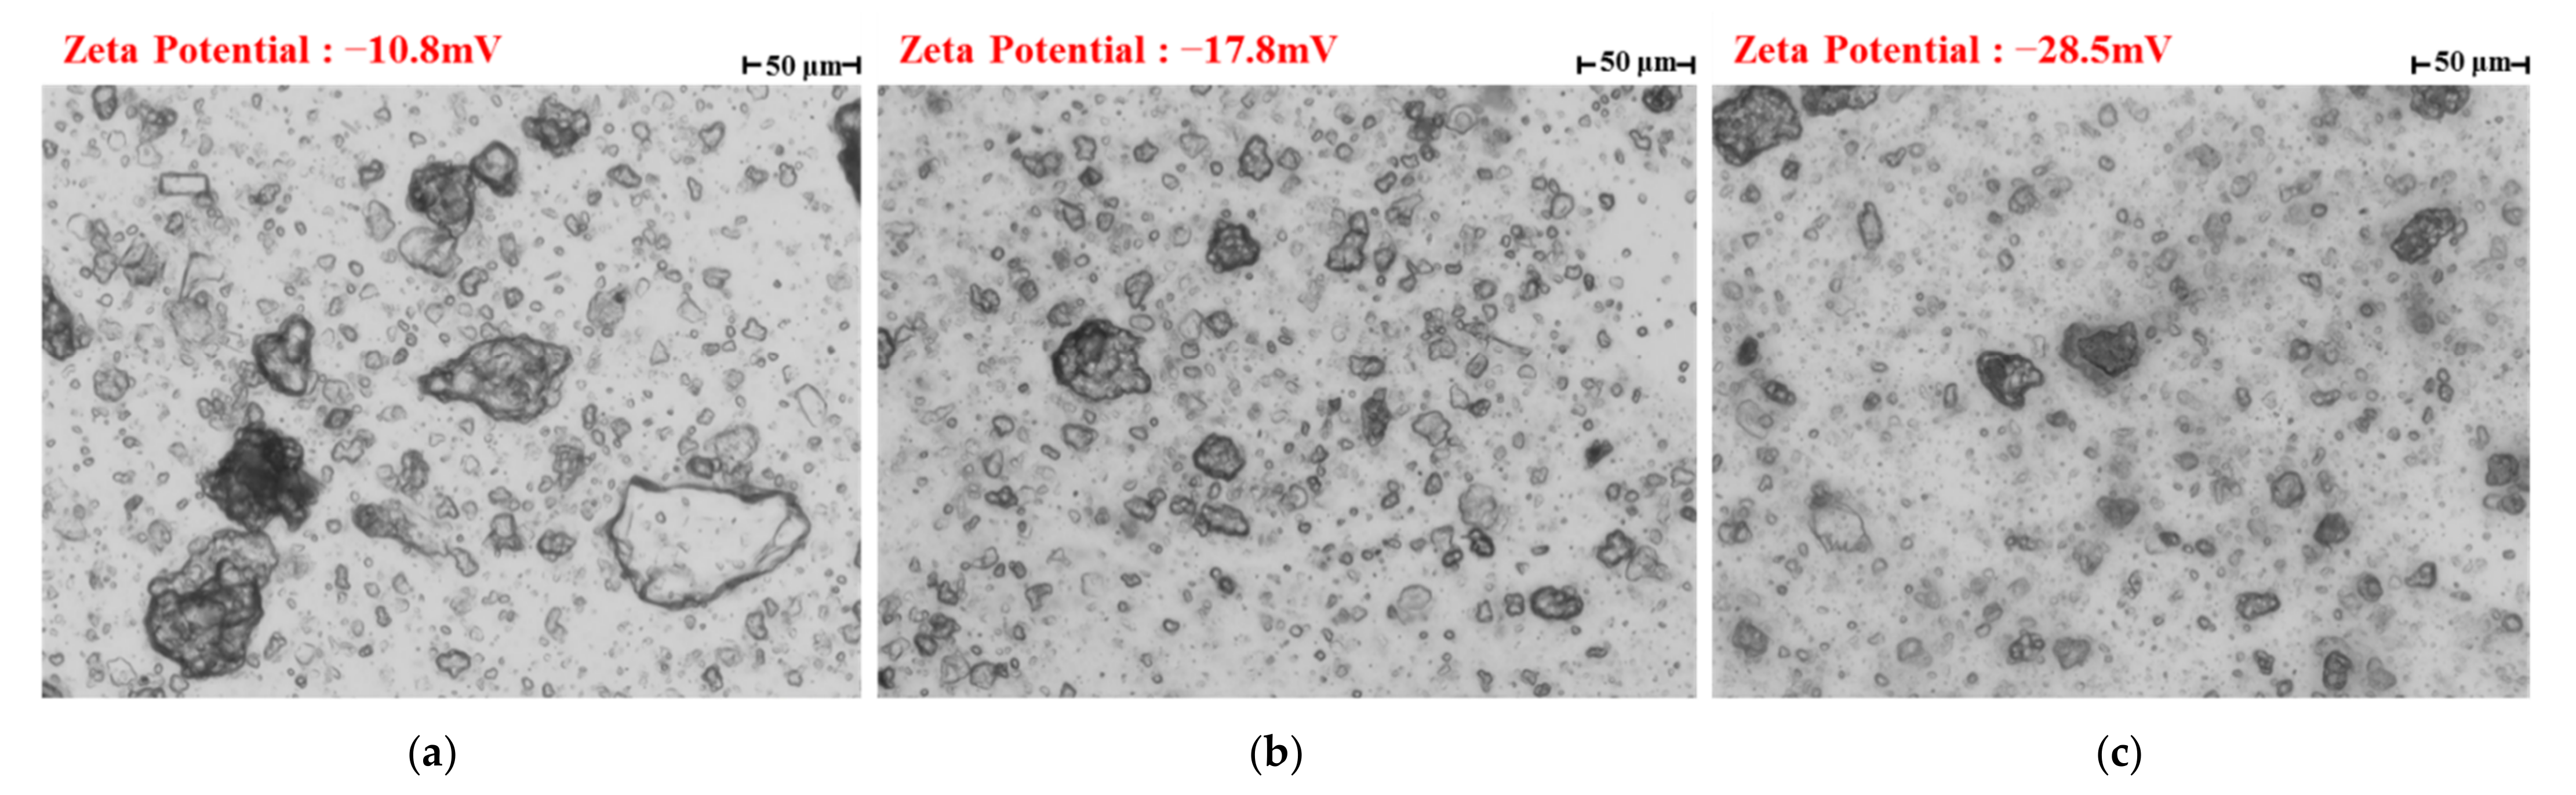
Figure 14.
Electrical resistivity of slurry and sand samples with different slurry concentrations.

Figure 15.
Resistance of sand samples (0.5~2 mm) with electrode distance.

Table 1.
Components of substitute ocean water.
| Salt composition | NaCl | MgCl2 | Na2SO4 | CaCl2 | KCl | NaHCO3 |
| Concentration (g/L) | 24.53 | 5.20 | 4.09 | 1.16 | 0.69 | 0.20 |
Table 2.
Specific gravity and viscosity of the slurry samples.
| Slurry Concentrations/(%) | 1 | 2 | 3 | 4 | 5 | 6 | 7 | 8 |
|---|---|---|---|---|---|---|---|---|
| Specific gravity/(−) | 1.01 | 1.01 | 1.02 | 1.03 | 1.03 | 1.04 | 1.05 | 1.05 |
| Viscosity/(mPa·s) | 4.61 | 5.41 | 8.14 | 12.65 | 24.72 | 74.27 | 275.58 | 428.07 |
Table 3.
Test groups with different influence factors.
| Soil Gradation | Water Environment | Slurry Penetration | |
|---|---|---|---|
| Contents of CMC Solution | Contents of Bentonite | ||
| I (0.5~2 mm) | 0%-Deionized water | 0% | 1~8% |
| 1% | 1~8% | ||
| 4% | 1~8% | ||
| 25%-Seawater | 0% | 1~8% | |
| 100%-Seawater | 0% | 1~8% | |
| II (0.075~2 mm) | 0%-Deionized water | 0% | 1~8% |
Publisher’s Note: MDPI stays neutral with regard to jurisdictional claims in published maps and institutional affiliations. |
© 2021 by the authors. Licensee MDPI, Basel, Switzerland. This article is an open access article distributed under the terms and conditions of the Creative Commons Attribution (CC BY) license (https://creativecommons.org/licenses/by/4.0/).
Share and Cite
MDPI and ACS Style
Mao, J.; Yuan, D.; Jin, D.; Wang, B.; Wu, S. Experimental Study on Electrical Resistivity Characteristics of Saturated Sand Mixes with Bentonite Slurry. Appl. Sci. 2021, 11, 12126. https://doi.org/10.3390/app112412126
AMA Style
Mao J, Yuan D, Jin D, Wang B, Wu S. Experimental Study on Electrical Resistivity Characteristics of Saturated Sand Mixes with Bentonite Slurry. Applied Sciences. 2021; 11(24):12126. https://doi.org/10.3390/app112412126
Chicago/Turabian StyleMao, Jiahua, Dajun Yuan, Dalong Jin, Binghui Wang, and Shangkun Wu. 2021. "Experimental Study on Electrical Resistivity Characteristics of Saturated Sand Mixes with Bentonite Slurry" Applied Sciences 11, no. 24: 12126. https://doi.org/10.3390/app112412126
Note that from the first issue of 2016, this journal uses article numbers instead of page numbers. See further details here.