
Using Brain-Computer Interface to Control a Virtual Drone Using Non-Invasive Motor Imagery and Machine Learning


1
Department Telematics and Electronics for Transports, University “Politehnica” of Bucharest, 060042 Bucharest, Romania
2
Department Engineering and Management for Transports, University “Politehnica” of Bucharest, 060042 Bucharest, Romania
*
Author to whom correspondence should be addressed.
Appl. Sci. 2021, 11(24), 11876; https://doi.org/10.3390/app112411876
Submission received: 20 November 2021
/
Revised: 8 December 2021
/
Accepted: 12 December 2021
/
Published: 14 December 2021
(This article belongs to the Special Issue New Trends in Robotics, Automation and Mechatronics (RAM))
Abstract
:In recent years, the control of devices “by the power of the mind” has become a very controversial topic but has also been very well researched in the field of state-of-the-art gadgets, such as smartphones, laptops, tablets and even smart TVs, and also in medicine, to be used by people with disabilities for whom these technologies may be the only way to communicate with the outside world. It is well known that BCI control is a skill and can be improved through practice and training. This paper aims to improve and diversify signal processing methods for the implementation of a brain-computer interface (BCI) based on neurological phenomena recorded during motor tasks using motor imagery (MI). The aim of the research is to extract, select and classify the characteristics of electroencephalogram (EEG) signals, which are based on sensorimotor rhythms, for the implementation of BCI systems. This article investigates systems based on brain-computer interfaces, especially those that use the electroencephalogram as a method of acquisition of MI tasks. The purpose of this article is to allow users to manipulate quadcopter virtual structures (external, robotic objects) simply through brain activity, correlated with certain mental tasks using undecimal transformation (UWT) to reduce noise, Independent Component Analysis (ICA) together with determination coefficient (r2) and, for classification, a hybrid neural network consisting of Radial Basis Functions (RBF) and a multilayer perceptron–recurrent network (MLP–RNN), obtaining a classification accuracy of 95.5%. Following the tests performed, it can be stated that the use of biopotentials in human–computer interfaces is a viable method for applications in the field of BCI. The results presented show that BCI training can produce a rapid change in behavioral performance and cognitive properties. If more than one training session is used, the results may be beneficial for increasing poor cognitive performance. To achieve this goal, three steps were taken: understanding the functioning of BCI systems and the neurological phenomena involved; acquiring EEG signals based on sensorimotor rhythms recorded during MI tasks; applying and optimizing extraction methods, selecting and classifying characteristics using neuronal networks.
1. Introduction
Over time, people have been fascinated by the idea of creating an interface that allows machines to “read” and interpret thoughts correctly for the automatic execution of tasks. Recent discoveries in the fields of neuroscience and engineering make it possible to translate this idea, seen in the past as a myth, into applications that have proven to be viable, although only in a small field [1,2,3]. Although the idea has persisted for a long time, the complexity in its implementation means that, even today when technology has reached huge evolutionary proportions, interfacing the biological with machines (robots/computational structures) [4] is perhaps too much of a challenge. However, through the ambition and perseverance of scientists, researchers and those people eager to find solutions to problems that seem impossible to solve, the transition from the prototype stage to the large-scale implementation of brain-computer interface applications is just a matter of time [5].
The implementation of an operative communication solution, coming as an alternative to the use of speech, gesturing hand movements or head movements, is a considerable help in improving the situations of people with severe disabilities [6,7] whose motor functions are reduced due to accidents or diseases, and have musculoskeletal system difficulties such as paraplegia, paralysis or loss of limbs. BCI systems based on sensorimotor rhythms are known as motor imagery (MI) BCI systems [8]. Sensorimotor rhythms include alpha (8–13 Hz) and beta (14–26 Hz) frequency bands [9,10]. When a human imagines a motor action without any actual movement, the power of alpha and beta rhythms can decrease or increase in the sensorimotor cortices over the contralateral hemisphere and the ipsilateral hemisphere; this phenomenon is called event-related desynchronization/synchronization (ERD/ERS). EEG allows completely new possibilities to research the activities of the human brain [11]. It uses electrodes placed directly on the scalp to measure the electrical potentials generated by the electrical activity of the brain, which have a small amplitude (5–100 μV). Due to the skin, bone tissue (skull) and other tissues that separate the electrodes from the actual electrical activity, the signals tend to be attenuated and quite noisy. Therefore, while EEG measurements have a good temporal resolution with delays of tens of milliseconds, the spatial resolution tends to be small, varying, at best, to an accuracy of about 2–3 cm but usually even less. Two centimeters on the cerebral cortex may be the difference between deducing that the user is listening to music when, in fact, he is moving his hands [12]. Therefore, the interface that has as its starting point the potentials generated by the brain (EEG signals) is called the “brain-computer interface” (BCI).
The first applications for interfacing the biological with machines have their origin in the military field [13,14,15]. The competitive environment made these applications develop very quickly, and the ideas were later taken over and implemented in other fields, such as medicine and the video game industry [16,17]. BCI-based technology is a powerful tool for communication between systems and users. A particularly important aspect is that in BCI applications, there is no need for the intervention of the muscular system. Therefore, one of the main aspects of the studies is to help people with disabilities by implementing solutions that will improve their way of life [18,19].
A brain-computer interface is a system that allows a person to send commands to an electronic device just by simple voluntary variation in brain activity (thoughts) [20,21,22,23,24]. These terms refer to an interface that takes signals generated by the brain and transmits them in an interpretable form to electronic devices. The fundamental steps that a BCI system follows are:
- measuring electrical, magnetic activity or any other form of physical manifestations of the oscillating activity of the brain;
- interpretating acquired signals;
- transposing signals into viable commands for a computer or various other devices (robotic structures, wheelchair, bionic elements, brain-to-vehicle).
In other words, the brain-computer interface translates users’ intentions, which have an impact on the encephalographic signal, into control signals for various external computerized devices [25]. The biggest advantage of BCI systems is that there is no need to activate peripheral muscles or nerve structures, and the applications are very diverse [26,27,28,29,30], in areas such as wheelchair control [31,32,33], internet browsing [34,35], games [36] and brain-to-vehicle [15,37].
Nowadays, researchers have begun to develop completely different types of BCI systems, which, although at a theoretical stage, do not seem impossible to implement. These new systems are a significant part of the development of artificial intelligence. The fundamental idea is to load all the functions of the brain into a robotic assembly [38,39], giving it the ability to be autonomous (to make decisions in the field of the space of random variables encountered).
The proposed investigation is conducted through experimental studies, which propose improved stimuli and tasks on the interests and preferences of users in a BCI architecture based on motor imagery. A comparison with a second method is made of the cognitive mental states of the users, aiming at the subsequent improvement of the control within a BCI. Paradigms investigate brain fluctuations induced by various stimuli and activities to provide the means to detect significant neural information in brain activity that is critical to a BCI-like application. While the first paradigm considers sensorimotor rhythms, the second paradigm is based on Event-Related Potentials (ERPs). Most BCI paradigms consider the temporal information or spectral information of the activity generated by the brain, but rarely is the research performed as a whole, simultaneously considering the analysis of the time–frequency domain. As will be seen in this paper, the analysis that considers a single domain could be suboptimal because brain activity presents additional information that is visible in both the temporal and spectral domains. Therefore, this article deals with methodological improvements that include complementary information, obtaining a more accurate analysis of data that exceeds the performance of most available methods. BCI systems have a wide range of applications from quite simple to complex. There are BCI applications for spelling, simple computer games, wheelchair control, internet browsing or in a virtual environment [40,41]. Usually, applications are specially built for a certain type of BCI, being part of an integrated system. BCI systems that can connect and effectively control other devices are quite rare. An increasing number of systems allow the control of more sophisticated devices, including orthoses, prostheses, drones, robotic arms or even mobile robots. BCI systems can also be used for neurorehabilitation [42,43,44,45].
In this article, we propose a new approach to a BCI system based on the use of filter benches to reduce noise using UWT wavelet multiresolution analysis, the development of a generalized detector using ICA and r2 algorithms to extract features and optimize the detection test and, for classification, we use a hybrid neural network consisting of RBF and MLP–RNN. We also combine the two paradigms used in BCI based on five motor imagery tasks and cognitive mental states tasks, which can be determined by simultaneously analyzing the alpha and beta waves used in video games. This approach has a unique character according to the mentioned literature. The paper is structured as follows: in the first part we present the way of accomplishing the MI tasks of acquisition and training and the mathematical algorithms used in the processing and classification of EEG signals. In the second part, we present the results obtained and the conclusions.
2. Materials and Methods
2.1. The Structure of a Brain-Computer Interface
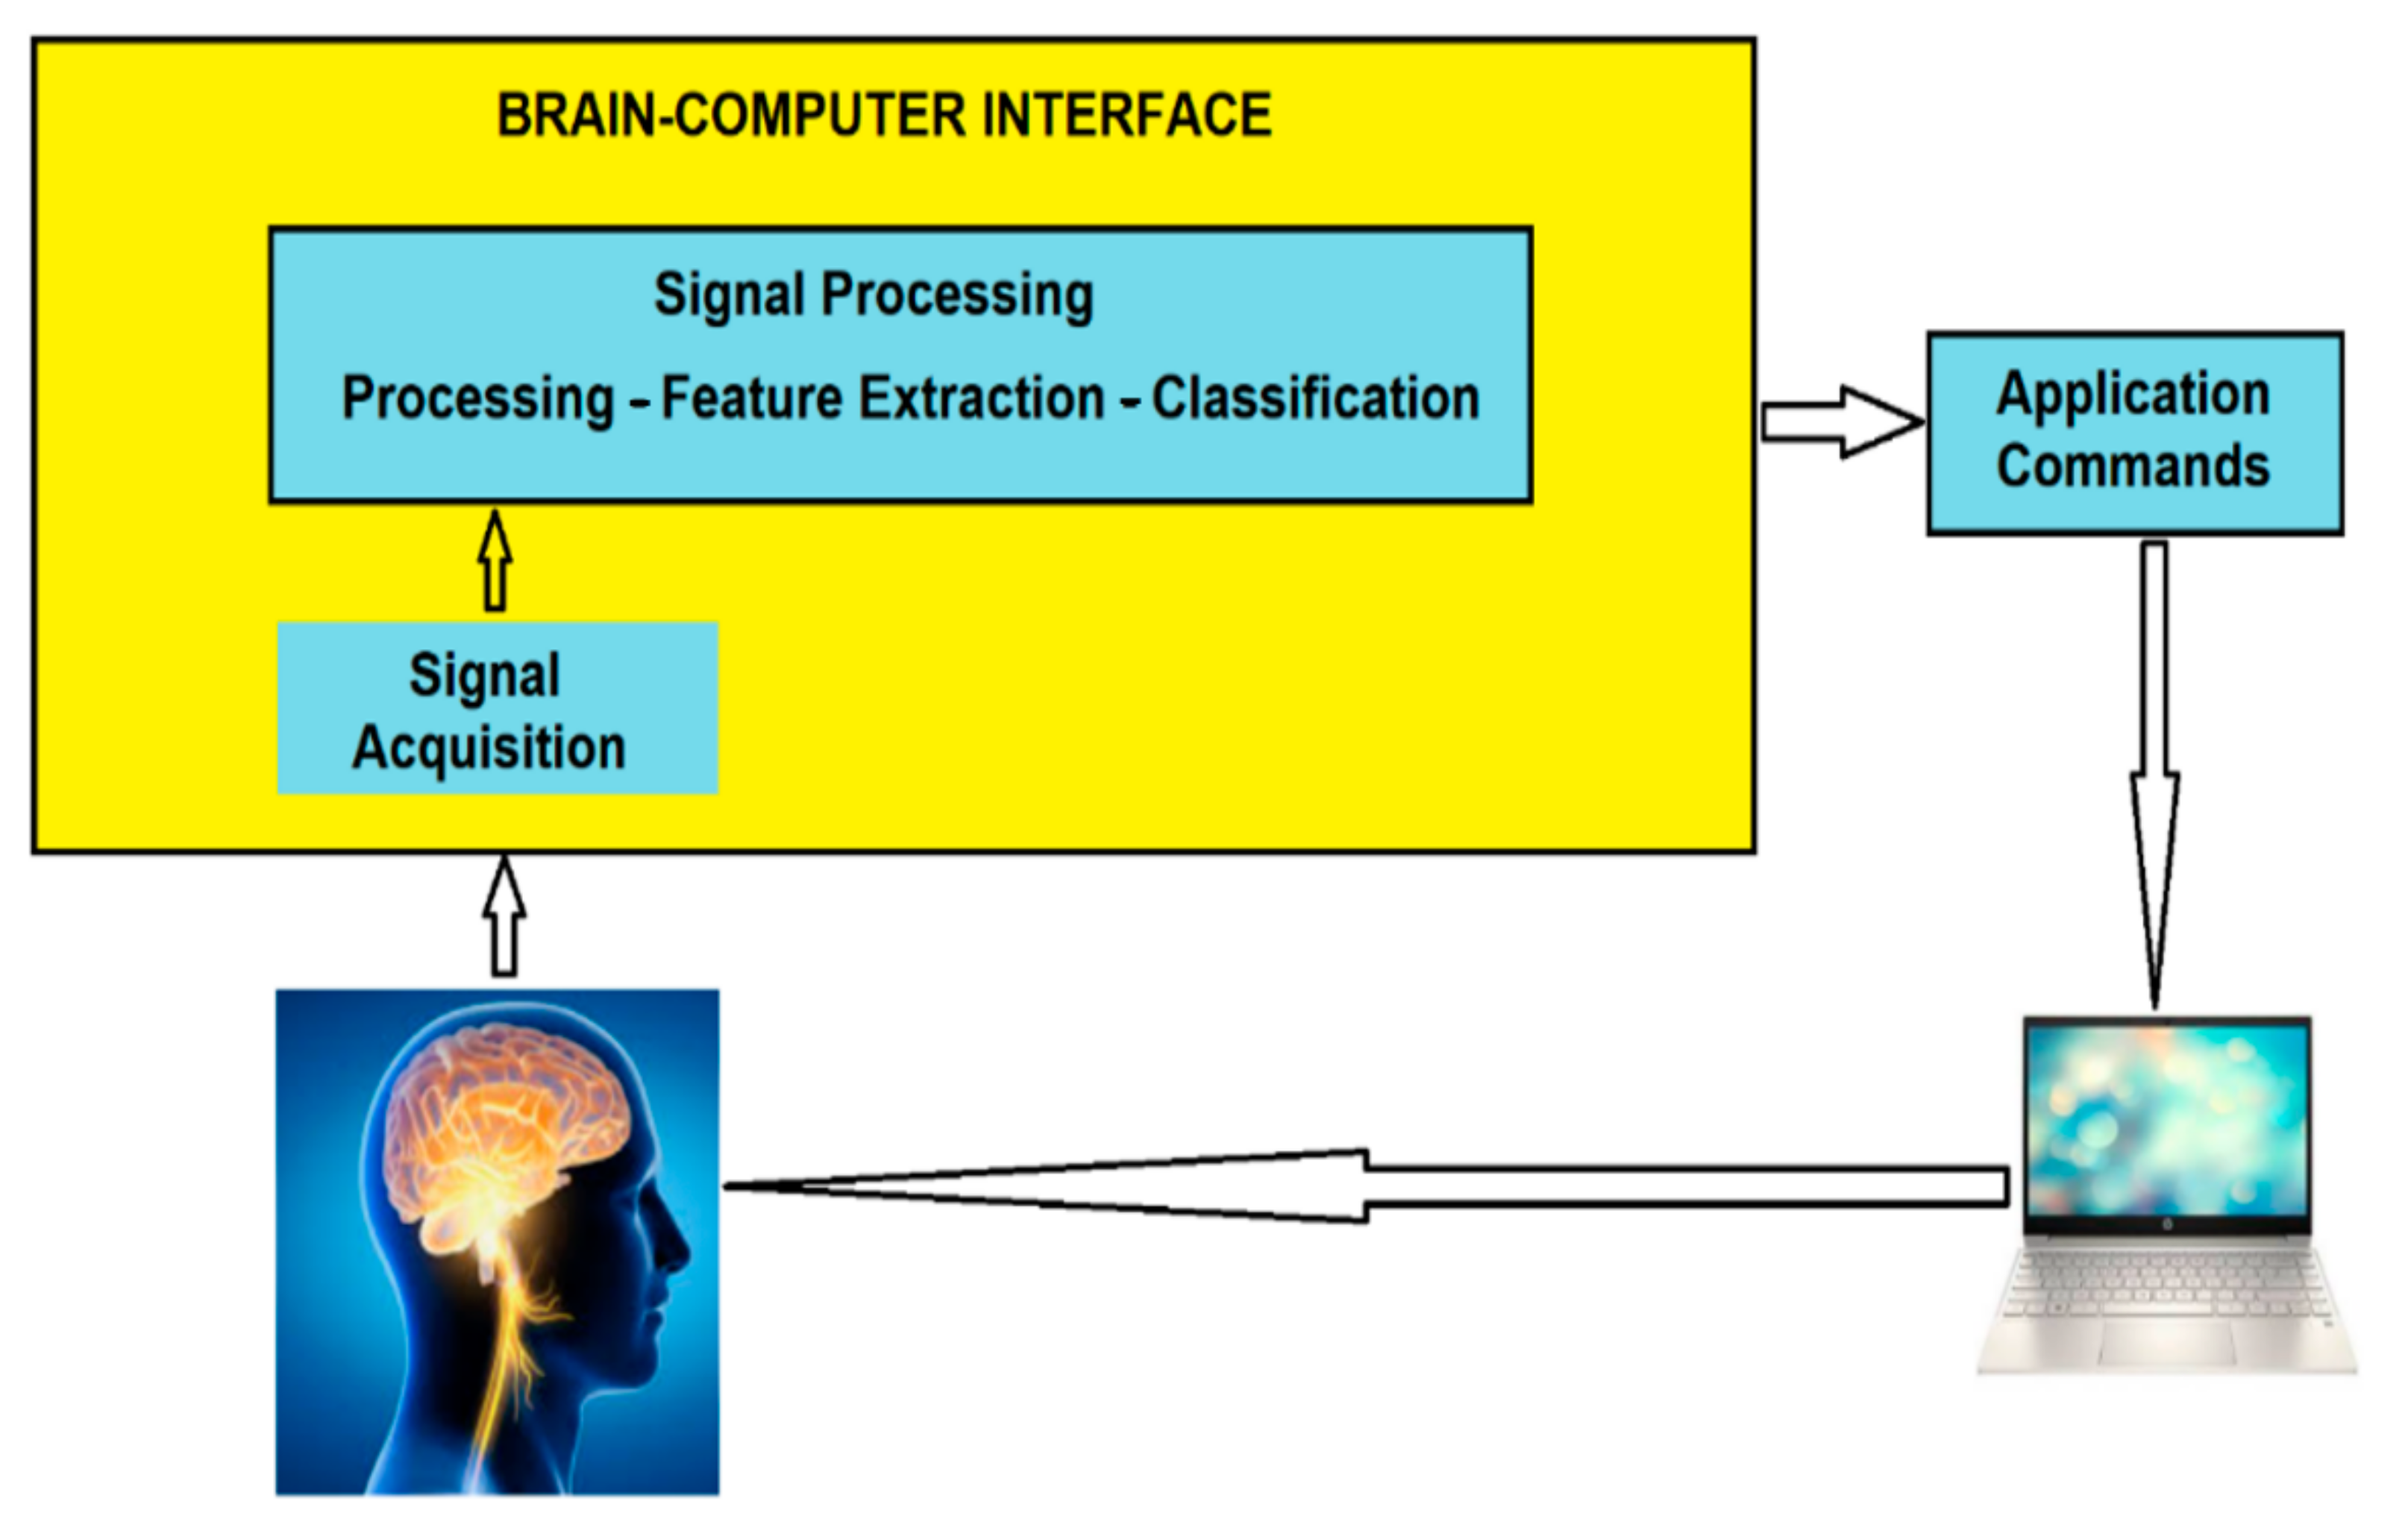
A brain-computer interface is a system that allows a person to send commands to an electronic device just by simple voluntary variation of brain activity (thoughts). In other words, the brain-computer interface translates users’ intentions, which have an impact on the encephalographic signal, into control signals for various external computerized devices. In fact, this works through the interaction of adaptive controllers: the brain (seen as such a regulator that produces signals) and the interface itself (EEG sensors and DAQ/Data AcQuisition card), which translates signals into commands. Figure 1 represents the components of a BCI system.
2.2. Experimental Setup
For the acquisition of EEG signals, we used a BCI system produced by G-Tec and the software applications were developed by us. The data were recorded using eight non-invasive electrodes placed on the scalp according to the international standard 10–20. The channels chosen for electrode placement were: CP3, CP4, P3, C3, Pz, C4, P4 and Cz (Figure 2). These channels were chosen in both hemispheres, according to the appearance of sensorimotor rhythms in these areas. The reference electrode is placed on the right ear. In the first phase, the distance between the ion and the nation is measured, and the ground electrode, which is placed on the FP1 channel, must be located at 10% of the measured distance. Then the electrodes are fixed on the helmet and the skin is contacted with a conductive gel. After completing these steps, the data can be recorded, but not before informing the subject about the tasks he/she has to perform during paradigm. The recordings were made on 60 subjects in the biomedical signal processing laboratory within the faculty of transports, electronics and telecommunications department. Subjects are placed in front of a monitor on which either left and right arrows are displayed successively or nothing is displayed. They must look carefully at the direction indicated by the arrow and imagine the movement of the hand indicated by it and, when nothing appears on the monitor, the subject must relax. The sampling frequency was 1 kHz and the visual stimulus time was 4 s. First, we processed the data obtained so that they could be used in subsequent experiments and analyses, and so that the signals corresponding to the motor imagery movement of the left hand and the right hand, and those corresponding to relaxation were extracted, then the 30 attempts were mediated.
Experimental Design and Protocol
An important aspect of BCI systems is that the user has to perform various mental tasks and strategies in order to generate specific traits. Brain-computer communication is based on these mental strategies, which are defined and limited by the abilities of the subjects. In other words, BCI systems are created according to the needs and skills of the subjects. However, the subjects also have the duty to learn different strategies and to train their brain to generate certain models that the systems can “understand”. The most used mental strategies are motor imagery and selection (focusing on different objects, focusing on attention). In paradigms based on the method of selective attention, external stimuli are used in various forms: visual, auditory or somatosensory. The most used stimuli are the visual ones. Paradigms developed based on visual stimuli are divided into two categories depending on the brain characteristics they produce: paradigms based on the P300 potential, paradigms based on SSVEP (Steady State Visual Evoked Potential). Paradigms based on sensorimotor rhythms have a completely different approach. Compared to selective attention-based BCI systems, there is no need to use external stimuli. The movement of any limb or the simple contraction of a muscle is felt in the electrical activity of the brain. Any movement is the result of a brain-generated impulse, not the other way around. Thus, we can say that the movements exist only due to the central nervous system, and the lack of movements is not necessarily due to brain inactivity but to the interruption of the transmission pathway (peripheral nervous system) of the impulse. We can say that there is brain activity related to the movement itself even before it occurs, there being obvious changes in sensorimotor rhythms. These sensorimotor rhythms (SMR) refer to the oscillations that occur in activity in the motor or somatosensory regions of the brain. Just imagining the movement of some limbs can cause changes in sensorimotor rhythms.
For classification we need two types of records: records made in the learning paradigm and records made during testing. During the test, the motor imagery movement of one hand is used, the hand for which the best results were obtained in the offline analysis, so the classification is performed separately for the left hand and the right hand, respectively. In this test paradigm, the subject must guide a ball so that its motor imagery moves to the left and right, and so that the balance tilts to one side or the other. When the ball is on the left or right side, the subject should imagination the movement of his left/right hand, and when the ball is at rest (left/right or center balance), the subject should relax (Figure 3).
The subject must perform different motor imagery movements at times specified in the experiment created in the program. Images are displayed on a monitor that suggest successive states of rest and movement of the ball. The subject must be careful and follow exactly the directions in the pictures, otherwise the experiment is no longer valid for what is being followed. Each subject participated in three sessions of online BCI control—left and right (L/R) ball movement—on separate days. There were ten runs of BCI control in each of the three sessions, and each run took about 5–6 min with an interval of 1–2 min according to the subject’s willingness. There were 25 trials in each run and 250 trials in each session.
Each motor imagery complex was repeated several times during a purchase. In the signal processing stage, the segments specific to the associated classes are extracted for each acquisition made. The test application transmits to the purchasing software the time points at which the markers must be placed on the purchased signals. At each transition from one stimulus to another, a marker with the class number to which it belongs is placed on the acquired signal.
During the tests, the 6 mental tasks necessary to control the virtual drone were created:
- Imagery of the movement of the right and left hand: For the task of the left/right hand the subject was instructed to imagine the movement of the arm of the right/left hand to correspond to the movement of the right/left ball. The subject was instructed to repeatedly perform this imaginary movement, at his own pace, as the ball moved, for 4–5 s.
- Imagery of the movement of the right/left foot: For the task of the foot, the subject was instructed to imagine the movement of the right/left foot to correspond to the movement of the right/left ball. Similarly, the subject was instructed to repeatedly perform this imaginary movement, at his own pace, as the ball moved, for 4–5 s
- Imagery of the handling of a cube with both hands: For the imagery of handling a cube load, the subject was instructed to imagine handling a Rubik’s cube with both hands. To ease the imagery, a real Rubik’s cube was placed on a table in front of him at a distance of 30 cm. Similarly, the subject was instructed to repeatedly perform this imaginary movement, at his own pace, for 4–5 s.
- Musical imagery: Finally, for the task of musical imagery, the subject was instructed to remember only instrumental music, without lyrics, to avoid associating language-related areas of the brain for 4–5 s.
2.3. Proposed Methodology for Signal Processing
The Figure 4 shows the proposed methodology for processing EEG signals.
2.3.1. Noise Reduction and Multiresolution Analysis Using Undecimated Wavelet Transform (UWT)
The wavelet transforms of any signal defined for any moment of time is defined as
where with . The term represents a scaling factor, while is a translation factor. Common wavelet basis functions are the Haar wavelet, Symlets wavelet, Daubechies wavelet and Mexican Hat wavelet [46].
The process of reducing noise from UWT transformed EEG signals performs multiresolution analysis to detect transient and non-stationary phenomena by decomposing them into sub-bands of analysis. After detection, the transient phenomena related to noise are eliminated and the signal is reconstructed [47].
Choosing the order of the Daubechies wavelet was conducted based on the same reason, db02 proved to produce the smoother result (Figure 5).
Following the tests, we showed that the sensorimotor rhythms were more obvious on the C3 and CP3 channels for the signals corresponding to the imagery of the right-hand movement and the C4 and CP4 channels for the signals recorded during the imagery of the left-hand movement. Therefore, we applied the multiresolution UWT analysis only for these channels. Considering that the frequency of the recorded EEG signal is between 0–128 Hz, and the spectrum of the mu rhythm is between 8 and 12 Hz and for the beta rhythm between 12 and 30 Hz, it is necessary to decompose the wavelet multiresolution up to level 4. After the first decomposition level the EEG signal is decomposed into the high frequency detail coefficient D1 (64–128 Hz) and the low frequency approximation coefficient A1 (0–64 Hz). At the next level the coefficient A1 is decomposed in turn into the coefficient of detail D2 (32–64 Hz) and the approximation coefficient A2 (0–32 Hz). Following this procedure, D3 (16–32 Hz), A3 (0–16 Hz), D4 (8–16 Hz) and A4 (0–8 Hz) are also obtained. Figure 6 shows the use of the UWT transform, direct and inverse for two levels of decomposition.
Because the resolution of UWT decompositions decreases simultaneously with the increase in the decomposition level, we chose a maximum of 4 levels of multiresolution analysis. UWT analysis provides very good results for reducing noise and signal artifacts allowing more efficient processing. Figure 7 shows the multiresolution analysis mode using UWT for EEG signal.
2.3.2. Analysis Using the Coefficient of Determination r2
The analysis is based on the calculation of the coefficient of determination r2 and on the visual inspection of the EEG spectrum. r2 is the square of the correlation coefficient and represents the coefficient of determination between the two parameters that form Pearson’s correlation coefficient r. These parameters being the covariance of the series and the product of their standard deviations.
The statistical index r2 has values between 0 and 1 and can be considered as an index that shows how different two signals are (at a certain frequency/channel). The difference between the signals can be explained by the fact that they come from different sources (in our case they correspond to different tasks, motor imagery and relaxation). A value of r2 close to 1 indicates a good discrimination of sensorimotor rhythms. The coefficient r is calculated as follows
where X = x1, x2, …, xn and Y = y1, y2, …, yn are the measured values, and are the sampling averages of the respective series.
After each training paradigm, the acquired signals are analyzed to decide whether or not they were recorded correctly in terms of MI sensorimotor discrimination. Figure 8 shows the values of the coefficient of determination calculated for the signal corresponding to MI of the movement of the left hand vs. relaxation, and Figure 9 presents the values for the coefficient of determination calculated for the signal corresponding to the MI of the movement of the right hand vs. relaxation.
The channels of interest in the case of motor imagery of the left hand are C4, CP4 and P4; for the signals recorded by us the best value of r2 was obtained on the C4 channel, and the best values are obtained on channels of interest, CP4 and C4. It is also observed that the highest value of r2 was about 0.45.
For the right hand, it is observed that we obtained higher values for r2 on channels 1 (CP3), 3 (P3) and 4 (C3) in the frequency range 14–22 Hz. On these channels, the maximum value of r2 was about 0.3.
Analyzing the signals from all subjects in this way, we prepared Table 1. For the article in Table 1, we present the results for 5 subjects (relevant summary). This table provides information for 45 subjects (in full form) because they only discriminated the sensorimotor rhythms from the 60 who performed the experiment. Table 1 contains information on the frequency of occurrence of MI sensorimotor rhythms and the corresponding channels, as well as the maximum value of the statistical index r2.
At this stage the acquisition of EEG signals is presented. Acquiring signals is a very important step, even decisive, in terms of success and results of the next stages, requiring significant resources of time and volunteers willing to perform experiments. The research on the acquired data is much more efficient, knowing all the details and conditions in which the recordings were made but also the opinions of the volunteers and their statements about the experiment and whether or not they managed to imagery their movement, this being a no just easy to do. A small, viable database containing EEG signals was recorded during MI hand movement from 45 subjects. This database contains both drive signals (32 in number) and test signals (13 in number), which is quite rare in databases available on the Internet. An important contribution is the realization of one’s own calculation code of the coefficient of determination and the obtaining of clearer results and higher values of r2 with it.
2.3.3. Proposed Method for Extracting Characteristics Using ICA Together with r2
The proposed method for extracting features from EEG signals is based on the method Independent Component Analysis (ICA) and the coefficient of determination r2 and involves the following steps:
- -
- one recording made during training is imported;
- -
- the signals corresponding to the motor imagery movement of the right hand, the left hand and relaxation are extracted;
- -
- each signal (relaxation or motor imagery movement of the right or left hand) is converted into the frequency domain using the power spectral density;
- -
- filter each signal (motor imagery of the movement of the hand right/left and relaxation) with a wavelet UWT;
- -
- the coefficient of determination (according to the method proposed in the previous paragraph) is calculated for the filtered signal corresponding to the motor imagery load of the right/left hand versus the filtered signal corresponding to relaxation;
- -
- graphical display of results according to frequency and channels;
- -
- the ICA algorithm is applied, which is based on the Second-Order Blind Identification (SOBI) algorithm, for all three signals, in order to estimate the mixing matrix and the sources;
- -
- the columns of the source matrix are normalized;
- -
- the norms of the columns of the mixing matrix are calculated;
- -
- these columns are ordered in descending order according to the corresponding norms;
- -
- the first three columns of the mixing matrix are retained and the rest are equal to zero;
- -
- the signal is reconstructed after the first three sources;
- -
- the coefficient of determination is calculated for the reconstructed signals after the application of the ICA corresponding to the imagery tasks of the right/left hand movement versus the reconstructed signal corresponding to the relaxation;
- -
- graphical display of results according to frequency and channels.
- -
- The method was implemented in the LabVIEW software environment.
2.3.4. Classification of Motor Imagery Tasks from EEG Signals
For the classification of motor imagery task from EEG waves, we propose a hybrid neuronal network RBF based on RNN to which we add an additional MLP layer to increase performance.
Radial Function Based (RBF) Neuronal Network
Neural networks with radial transfer functions, also called type networks “RBF” (“Radial Basis Functions”), are considered universal approximators and consist of a number of N input units, K units on the hidden layer and M output units. These networks differ from the multilevel feedforward ones by the integration and transfer functions specific to the hidden level.
A unit k on the hidden level produces a signal corresponding to an input signal X, given by the relation
where is the vector of the weights of the connections to the unit hidden k, also called its center or prototype. Thus, the function of the integration associated with the hidden unit is based on the calculation of a distance between the input vector and the corresponding center.
Euclidean distance is the most commonly used and is given by the relationship
Transfer functions are characterized by radial symmetry and have locality property, i.e., they produce significant values not only for small values of the argument but for large values tending to zero. The usual transfer functions are Gaussian or Cauchy. The network produces an output vector Y ∈ RM that has the components
where is the matrix of the weights of the connections between the hidden and the output level. If the input data range is covered by the receptive fields of the units on the hidden layer, then a good behavior of the network will be obtained. RBF networks are universal approximators, the quality of the approximation depending on the number of hidden units.
For example, 4 neurons in the output layer are needed to classify 4 classes of EEG signals (Figure 10).
Deep Neuronal Network
To see the separability of the classes, various architectures of deep neural networks were used. As previously mentioned, the features provided as input data consist of the correlations extracted with the ICA and r2 algorithms. Thus, the networks were tested with a number of hidden layers ranging from 1 to 7. Additionally, the number of neurons on each layer varied between 8 and 256 (more precisely, 8, 16, 32, 128, 256 neurons per layer were used). The activations tested were sigmoid, tanh and arctan. They were used due to the fact that they are known to have good results, especially for class problems [48,49], but also for estimation problems [50].
Results with activation functions that deny components’ negatives (e.g., ReLU, Leaky ReLU) were not used in this paper because they provided random responses (an accuracy of around 50%). One possible reason for this is the phenomenon called dying ReLU. It refers to the fact that if too many weights take values below 0 the activation result will be 0, so data discrimination becomes impossible.
The optimization technique used was Stochastic Gradient Descent (SGD). This algorithm is used in the field of deep neural networks and generally provides satisfactory results [51,52,53,54]. The proposed method is a simple one from GD (Gradient Descent) in the sense that, instead of calculating the gradient for the whole lot at each iteration, the gradient is calculated only for a randomly chosen value from the lot. Therefore, the learning process is stochastic and depends on these chosen values. In this way, it is desired that Equation (6) for GD behave relatively similarly to Equation (7) for SGD, having the advantage of a much smaller calculation volume
In these formulas, z refers to the pair (x; y), meaning the input value (associated output value) and is the pair chosen at time t.
3. Results
3.1. Denoising Using Wavelet UWT
The denoising, multiresolution decomposition and reconstruction was tested with all the orders of the Daubechies, Coiflet, Symlets and Haar wavelets, but the most suitable for highlighting the desynchronization of the sensorimotor rhythms, in the case of the acquired signals, proved to be the Haar function, following visual analysis of the waveforms. Multiresolution wavelet analysis was applied on channels C3, CP3, C4 and CP4. The sub-component signals that are represented below are the ones of interest: the fourth order detail coefficient with the frequency 8–16 Hz and the third order detail coefficient with the 16–32 Hz frequency.
In Figure 13, the desynchronization of the sensorimotor rhythms are shown, which in our case represented a decrease in the amplitude of the signal corresponding to the motor imagery towards the signal corresponding to relaxation. For example, if the fourth order detail coefficient (corresponding to MI the left hand movement versus relaxation on the C4 channel) is chosen, then, in Figure 13, the desynchronization is observed: in the 8–9 Hz and 12–13 Hz frequency bands; at 10–11 Hz in the second graph; at 10 Hz and 12–13 Hz when the decomposition is performed with the Haar wavelet (where there is a very good increase in the amplitude of the signal corresponding to relaxation compared to the corresponding signal imagery movement).
The wavelet transform favors the detection of sensorimotor rhythms that can be used for a brain-computer interface used by people with neuromotor deficiencies but with the state of the central nervous system and the visual analyzer in good condition. With the help of multiresolution decomposition and reconstruction on four levels, the signal can be analyzed in the frequency bands 8–16 Hz and 16–32 Hz, which is very useful because the sensorimotor rhythms have frequencies in these intervals.
In this method, the feature matrix is formed using the multiresolution decomposition performed only with the Haar wavelet. The classification is made for the three channels C3, CP3 and P3, corresponding to the motor imagery of the right hand and C4, CP4 and P4, corresponding to the motor imagery of the left hand.
3.2. Proposed Method for Extracting Characteristics Using ICA Together with r2 Algorithms
The filtering results are displayed using the coefficient of determination in Figure 14. Higher values of r2 can be observed on channels CP3, C3 and P3 in the frequency band 15–22 Hz for the task of imagery of the right hand, and for imagery of the left hand on the channels C4 and CP4 at 15–22 Hz.
The coefficients of determination obtained after the signal reconstruction after the application of ICA are represented in Figure 15. It can be seen that after applying the ICA, in the case of imagery of the right hand, the highest values of r2 are for channels C3, Cz and CP3 in the 22–27 Hz frequency band, corresponding to the beta rhythm. For the signal corresponding to the motor imagery of the left hand, the highest values of r2 are obtained for channel C4 at the frequency of 22–27 Hz.
3.3. Neuronal Network
Because of the database, we used a batch size of value 1 (only one example was evaluated for updating the parameters). In addition, to ensure that all architectures were tested under the same conditions, the number of epochs was always 100. The tests were performed in two stages.
In the first stage, the database was divided into two: the training part with a size of 350 and the test part with a size of 39, equivalent to a division of 90% and 10%. During training, the purpose of the network is to determine the weights that allocate the ideal labels to the input values. The data that the network learns are called the training batch. To test the possibility of generalizing the found function, some values are kept separate (called the test batch) and passed through the network. If the results are good, we can say that the network has learned and is able to classify the new data.
At this stage, different deep neural network architectures were tested. During the tests, the hyperparameters of the system were modified. More precisely, we experimented with various values for the number of neurons, the layer, and various activation functions—tanh, arctan and sigmoid. The three activation functions were chosen because they have an S shape, which increases the separability of the input data. The neural architecture tested for the tanh function had five layers and 16 neurons per layer, and the best cost recorded on the test was 0.32 with an accuracy of 90.18%. The results obtained for the tanh activation function are presented in Table 2.
The next activation function tested was sigmoid, and the best cost on the test batch was 0.35 at an accuracy of 94.65%. It was also observed that, with the increase in the number of hidden layers and even the number of neurons, the network begins to stop learning and gives random results for training data. The results obtained for the sigmoid activation function are presented in Table 3.
Next, we tested the activation function arctan. This time the number of hidden layers was 1–7, and the number of neurons was varied according to Table 4. In this case, the minimum cost found on the test batch was 0.31 at an accuracy of 95.67% with seven hidden layers and 16 neurons on each layer. The results obtained for the arctan activation function are presented in Table 4.
The best result was obtained using an architecture with six hidden states, eight neurons on each hidden layer, and each layer (excluding the output layer, which had softmax) having the arctan activation function. The accuracy of classes (in this case, on the test group) was 95.67%.
In the second stage, optimization, validation and an increase in generalization capacity, the database used in stage one was divided into 80% for training and 20% for testing (another test was conducting for ordering the datasets into 80% for training, 10% for validation and 10% for testing) using the SGD optimization algorithm.
The algorithms presented in this article were developed in the LabVIEW 2020 SP1 programming environment with a 17-inch high-performance portable computing system with an Intel processor, four cores @ 3.2 GHz, 16 GB DDR3 RAM @ 1600 MHz, 256 GB SSD, 1 TB HDD, and high-performance dedicated video card, optimized for computer graphics, with task motor imagery detection for optimized for computer graphics to train and test the MLP–RNN neural network with ICA and r2 algorithms.
The final part of a deep network is represented by one or more fully connected multilayer perceptron (MLP) layers that perform the classification part, using as inputs the outputs of the initial recurrent part (characteristics automatically extracted by it) obtained for each applied signal network input.
The optimizer is the algorithm that decides in which direction and how strongly to change the weights in the network. In order to adjust the parameters of a network (weights and displacements), an optimizer must be used that decides the modification strategy according to the gradients obtained with the help of the loss function. The algorithm used is Calibrated Stochastic Gradient Descent (CSGD). The optimizer requires specifying the size of the optimization step, also called the learning rate, which in our tests was kept constant at 10−5.
It is, practically speaking, an iterative optimization process that aims to reduce the error (respectively the difference between the expected output and the one obtained in that iteration) estimated using a cost (or loss) function. In this way, those inputs and characteristics that are the most relevant for obtaining the desired output are enhanced.
This experiment resulted in a classification accuracy of 95.67%, recall of 0.96 and micro average F1 score of 0.97. The confusion matrix is shown in Table 5 and the classification report is given in Table 6.
This was to be expected as the cost does not provide information on accuracy. The latter is calculated according to the formula
and the cost function used is binary cross-entropy and behaves according to the following law
In the field of neural networks, there are two phenomena that can occur during training: underfitting and overfitting. The first refers to when learning is stopped too quickly compared to the number of epochs.
Analyzing the results presented in this article, we can say that in no variant of the tested architecture was there overfitting. However, the rule of saving the model was: keep the one that has the lowest cost on the test lot. Thus, all results presented are not affected by either underfitting or overfitting.
Table 7 contains the classification rates obtained with hybrid RBF MLP–RNN neural network for three channels (C3, CP3, P3). Regarding the signals recorded when the subjects performed the task of MI of the right hand, it can be mentioned that through the implemented hybrid RBF MLP–RNN method, good results are obtained for all subjects. The highest classification percentage is 95%. Performing arithmetic means for all subjects, on each channel and for each method, the highest percentage is 93.6% and is obtained with the hybrid RBF MLP–RNN for channel P3.
Table 8 contains the classification rates obtained with hybrid RBF MLP–RNN for three channels, for subjects performing motor imagery left hand tasks. The highest rating obtained is 95%. Performing arithmetic averages for all subjects, on each channel and for each method, the highest percentage is 95% for CP4.
In order to increase the degree of generalization and to obtain much better results in the classification of EEG signals, through the use of neural networks, a much larger database with signals is needed in order to ensure sufficient data in the training of the network. In other words, the neural network provides better answers if it is sufficiently well trained and if the learning data follow a certain pattern, for each class involved.
3.4. Development Virtual Drone
Using the obtained results, a virtual drone (3D avatar simulation) was controlled with the help of acquired brain waves and analyzed with the proposed algorithm. Based on inertial XYZ-world coordinates of the drone’s center of mass and Euler rotation angles (roll rotation about x axis, pitch rotation about y axis and yaw rotation about z axis) obtained by a mathematical model, and in accordance with the simulated model, we also developed a 3D animation of the behavior of the drone in LabVIEW 3D animation as presented in Figure 16.
To create a BCI connection between the developed EEG sensors (acquisition headset) and the virtual avatar quadcopter, we used the developed software interface based on motor imagery tasks, capturing the EEG signals from the BCI headset and turning them into computer commands. We trained four distinguished mental tasks, one for each direction in which we proposed to use the virtual quadcopter.
Figure 17 shows the acquired EEG signals specific to the sensors used: C3, CP3 and P3, corresponding to the motor imagery of the right hand and C4, CP4 and P4, corresponding to the motor imagery of the left hand.
Figure 18a–d shows the BCI simulation results for the virtual quadcopter.
The control of an aerial drone through biopotentials is an important point in the development of robotic systems. In robotics, human–robot interaction is seen with the most interest, especially in medical applications, dedicated to people with disabilities and for increasing low cognitive performance.
The brain-computer interface is a relatively new and reliable technology that can play an important role in various fields. Through this research, we proposed an unconventional method of controlling a drone directly by brain signals obtained by a BCI system. To achieve the proposed goal, we developed a mathematical model and we simulated the operation in the MATLAB-LabVIEW virtual development environment for the virtual quadcopter and the proposed BCI architecture. We developed a 3D animation of the behavior of the avatar quadcopter in the LabVIEW environment based on the presented algorithms. The application in its current form can be used in the medical field for the recovery of patients with various neurological disorders, for increasing low cognitive performance and increasing the drone driving skills of military personnel.
4. Discussion
Comparison between Classifiers Used for BCI and Our Method
In order to be able to compare the results of the classifiers used in this study we made the graphs in Figure 19 and Figure 20 corresponding to the subjects performing tasks of motor imagery of the right hand tasks of motor imagery of the left hand respectively. In Figure 18 it can be observed that most of the maximum values of the classification of 94% are obtained with the LDA classifier based on ICA but also with this classifier for six situations the lowest values of the classification are obtained. From here we can conclude that this method is quite sensitive to being used for the implementation of a brain-computer interface. Moreover 95.67% is obtained when using the hybrid RBF MLP–RNN classifier in two situations. With this classification method very good results are obtained for most subjects. Quite good results for all subjects are also obtained with the LDA-based normalized feature matrix. It is observed that for most subjects higher classification rates are obtained with the proposed method.
In Figure 20, it is observed that the maximum classification rates of 95.6% (five subjects), are also obtained with the LDA classifier based on the ICA method. However, the most minimum classification rates (five subjects) are obtained with the same classification method. Stable classification methods, with which good results are obtained for all subjects, are the hybrid RBF MLP–RNN and LDA, which use features from multiresolution decomposition.
In conclusion, the safest, most accurate classifier with which to obtain the highest classification rates higher than those obtained with the traditional classifiers used in BCI, is the hybrid RBF MLP–RNN classifier proposed in the article. The highest rating rate obtained with this classifier is 95.67%. Although most of the maximum results of 94% are obtained with the LDA classifier based on the ICA method, the weakest results are also obtained with it. This classifier is very unstable and of very poor accuracy. Another classifier with which the lowest results are obtained, a proportion of approximately 30% of the total subjects, is the classifier that uses k-nearest neighbors algorithm (k-NN).
Limitation and Future Works. The combined analysis of this study gave us a pool of subjects and a unique opportunity to study the learning effect across training sessions. However, there were only three training sessions for each subject. We did see some significant changes in behavioral performance such as the improvement in statistical analysis, and other trends of neurophysiological results including the increase in de-synchronization/synchronization (ERD/ERS) lateralization for right-hand tasks, although they were not statistically significant. It is not clear yet when the change in behavioral performance might saturate and when significant changes in neurophysiological characteristics such as the r2 value, whether ERD lateralization might emerge and saturate in this study. In addition, the session interval for each participant varied between 1 day to 2 weeks due to scheduling conflicts for a large number of subjects. This might introduce an extra variance to the result. In the future, it is worth conducting a study that consists of more BCI sessions in a large number of subjects with more controllable session intervals. Furthermore, other metrics might help to explore the change in data distribution within and across the sessions, and this might extract some additional information that may help to optimize the experiment in the future.
5. Conclusions
This article presents and deals with the three components of the brain-computer interface: the acquisition of signals, the processing of these signals and the control of an external device. Computer control is performed with the algorithm proposed in the article during recording test signals when subjects control a virtual drone on a computer monitor just by motor imagery of the movement of a hand. The acquisition of EEG signals and their processing was, instead, the main concern.
In conclusion, in the article, we propose some new ideas: using the programming languages LabVIEW and MATLAB, we demonstrate that the proposed algorithms give remarkable performances using the UWT algorithm for noise reduction and multiresolution analysis and the reconstruction of EEG signals; we propose a method for extracting the features of EEG signals, which uses ICA and the coefficient of determination r2; to achieve the classification of motor imagery loads from EEG signals purchased, we propose a hybrid neural network classifier based on the RBF network and MLP–RNN network. The maximum classification rate obtained by this method is 95.67%. Continuing with the implementation of classification methods, the performance of the LDA classifier that uses features extracted using multiresolution wavelet analysis and ICA is analyzed. The maximum classification rate obtained by this method is 91%, and the maximum average for all subjects is about 80%, compared to 95.67% obtained with the proposed hybrid RBF MLP–RNN hybrid applying the extraction of features using the ICA and r2 algorithm.
Author Contributions
Conceptualization, C.D.; methodology, C.D. and I.-M.C.; software, C.D.; validation, C.D. and I.-M.C.; formal analysis, C.D., A.S. and I.-M.C.; investigation, C.D. and I.-M.C.; resources, C.D.; data curation, C.D.; writing—original draft preparation, C.D.; writing—review and editing, A.S. and I.-M.C.; visualization, I.-M.C.; supervision, C.D. and A.S. funding acquisition, A.S., C.D. and I.-M.C. All authors have read and agreed to the published version of the manuscript.
Funding
The research work contained in this paper was supported within the frame of the project “Innovative system for cross-border fight against terrorism, organized crime, illegal trafficking in goods and persons”, national funding SIPOCA-SMIS 121596, 2021.
Institutional Review Board Statement
Not applicable.
Informed Consent Statement
Not applicable.
Data Availability Statement
Not applicable.
Acknowledgments
We thank the management of the Faculty of Transportation, the Department of Electronics and Telecommunications, University Politehnica of Bucharest, Romania, for the use of research from the Artificial Intelligence Laboratory.
Conflicts of Interest
The authors declare no conflict of interest.
References
- Jeong, J.H.; Lee, D.H.; Ahn, H.J.; Lee, S.W. Towards Brain-Computer Interfaces for Drone Swarm Control. In Proceedings of the 2020 8th International Winter Conference on Brain-Computer Interface (BCI), Gangwon, Korea, 26–28 February 2020; IEEE: Piscataway, NJ, USA, 2020; pp. 1–4. [Google Scholar] [CrossRef] [Green Version]
- Chen, S.C.; See, A.R.; Chen, Y.J.; Yeng, C.H.; Liang, C.K. The use of a brain computer interface remote control to navigate a recreational device. Math. Probl. Eng. 2013, 2013, 823736. [Google Scholar] [CrossRef]
- Chamola, V.; Vineet, A.; Nayyar, A.; Hossain, E. Brain-Computer Interface-Based Humanoid Control: A Review. Sensors 2020, 20, 3620. [Google Scholar] [CrossRef]
- Li, G.; Zhang, D. Brain-computer interface controlled cyborg: Establishing a functional information transfer pathway from human brain to cockroach brain. PLoS ONE 2016, 11, e0150667. [Google Scholar] [CrossRef] [Green Version]
- Kübler, A.; Holz, E.; Kaufmann, T.; Zickler, C. A user centred approach for bringing BCI controlled applications to end-users. Brain-Comput. Interface Syst. Recent Prog. Future Prospect. 2013, 1, 19. [Google Scholar] [CrossRef] [Green Version]
- Holz, E.M.; Botrel, L.; Kaufmann, T.; Kübler, A. Long-term independent brain-computer interface home use improves quality of life of a patient in the locked-in state: A case study. Arch. Phys. Med. Rehabil. 2015, 96, S16–S26. [Google Scholar] [CrossRef]
- Sharma, V.; Sharma, A. Review on: Smart home for disabled using brain-computer interfaces. J. Inf. Sci. Comput. Technol. 2015, 2, 142–146. [Google Scholar]
- Hamedi, M.; Salleh, S.H.; Noor, A.M. Electroencephalographic motor imagery brain connectivity analysis for BCI: A review. Neural Comput. 2016, 28, 999–1041. [Google Scholar] [CrossRef]
- Kim, Y.; Ryu, J.; Kim, K.K.; Took, C.C.; Mandic, D.P.; Park, C. Motor imagery classification usingmu and beta rhythms of EEGwith strong uncorrelated transformbased complex common spatial patterns. Comput. Intell. Neurosci. 2016, 2016, 1489692. [Google Scholar] [CrossRef] [PubMed] [Green Version]
- Brinkman, L.; Stolk, A.; Dijkerman, H.C.; Lange, F.P.; Toni, I. Distinct roles for alpha-and beta-band oscillations during mental simulation of goal-directed actions. J. Neurosci. 2014, 34, 14783–14792. [Google Scholar] [CrossRef] [PubMed]
- Korovesis, N.; Kandris, D.; Koulouras, G.; Alexandridis, A. Robot motion control via an EEG-based brain-computer interface by using neural networks and alpha brainwaves. Electronics 2019, 8, 1387. [Google Scholar] [CrossRef] [Green Version]
- Stefan, C.; Boboc, C. Interfata creier-calculator: Utilizarea semnalului electric al creierului în aplicatii practice (Brain-Computer Interface: Brain Electric Signal used in Practical Applications). Electroteh. Electron. Autom. 2016, 64, 91. [Google Scholar]
- Guger, C.; Harkam, W.; Hertnaes, C.; Pfurtscheller, G. Prosthetic control by an EEG-based brain-computer interface (BCI). In Proceedings of the Aaate 5th European Conference for the Advancement of Assistive Technology, Düsseldorf, Germany, 1–4 November 1999; pp. 3–6. [Google Scholar]
- Wang, H.; Li, T.; Huang, Z. Remote control of an electrical car with SSVEP-Based BCI. In Proceedings of the 2010 IEEE International Conference on Information Theory and Information Security, Beijing, China, 17–19 December 2010; pp. 837–840. [Google Scholar] [CrossRef]
- Li, J.Y.; Wang, H.J. Design of the remote control car system based on Brain-computer interface. In Applied Mechanics and Materials; Trans Tech Publications Ltd.: Bäch, Switzerland, 2013; Volume 391, pp. 584–587. [Google Scholar] [CrossRef]
- Long, S.; Zhou, Z.; Yu, Y.; Liu, Y.; Zhang, N. Research on vehicle control technology of brain-computer interface based on SSVEP. In Proceedings of the 2019 International Conference on Image and Video Processing, and Artificial Intelligence, Shanghai, China, 27 November 2019; International Society for Optics and Photonics: Bellingham, WA, USA; Volume 11321, p. 113212Q. [Google Scholar] [CrossRef]
- Akman Aydin, E.D.A.; Bay, Ö.; Güler, İ. Implementation of an Embedded Web Server Application for Wireless Control of Brain Computer Interface Based Home Environments. J. Med. Syst. 2016, 40, 1–10. [Google Scholar] [CrossRef]
- Nijholt, A.; Tan, D.; Pfurtscheller, G.; Brunner, C.; Millán, J.D.R.; Allison, B.; Graimann, B.; Popescu, F.; Blankertz, B.; Müller, K.R. Brain-computer interfacing for intelligent systems. IEEE Intell. Syst. 2008, 23, 72–79. [Google Scholar] [CrossRef] [Green Version]
- LaFleur, K.; Cassady, K.; Doud, A.; Shades, K.; Rogin, E.; He, B. Quadcopter control in three-dimensional space using a noninvasive motor imagery-based brain-computer interface. J. Neural Eng. 2013, 10, 046003. [Google Scholar] [CrossRef] [Green Version]
- Hornero, R.; Corralejo, R. Brain Computer Interface (BCI) Systems Applied to Cognitive Training and Home Automation Control to Offset the Effects of Ageing; University of Valladolid: Valladolid, Spain, 2012. [Google Scholar]
- Wolpaw, J.R.; Birbaumer, N.; McFarland, D.J.; Pfurtscheller, G.; Vaughan, T.M. Brain-computer interfaces for communication and control. Clin. Neurophysiol. 2002, 113, 767–791. [Google Scholar] [CrossRef]
- Pfurtscheller, G.; Neuper, C.; Birbaumer, N. Motor Cortex in Voluntary Movements, Chapter Human Brain-Computer Interface; CRC Press: Boca Raton, FL, USA, 2005; pp. 367–401. [Google Scholar]
- Birbaumer, N. Breaking the silence: Brain-computer interfaces (BCI) for communication and motor control. Psychophysiology 2006, 43, 517–532. [Google Scholar] [CrossRef]
- Hoffmann, U.; Vesin, J.-M.; Ebrahimi, T. Recent advances in brain-computer interfaces. In Proceedings of the IEEE International Workshop on Multimedia Signal Processing (MMSP07), Chania, Greece, 1–3 October 2007. [Google Scholar]
- Cabestaing, F.; Rakotomamonjy, A. Introduction aux interfaces cerveau-machine. In Proceedings of the 21e Colloque GRETSI sur le Traitement du Signal et des Images, Troyes, France, 11–14 September 2007; pp. 617–620. [Google Scholar]
- Zhu, Y.; Xu, K.; Xu, C.; Zhang, J.; Ji, J.; Zheng, X.; Zhang, H.; Tian, M. PET Mapping for Brain-Computer Interface Stimulation of the Ventroposterior Medial Nucleus of the Thalamus in Rats with Implanted Electrodes. J. Nucl. Med. 2016, 57, 1141–1145. [Google Scholar] [CrossRef] [PubMed] [Green Version]
- Millán, J.D.R. Brain-computer interfaces. In Handbook of Brain Theory and Neural Networks, 2nd ed.; Arbib, M.A., Ed.; The MIT Press: Cambridge, MA, USA, 2002; pp. 178–181. [Google Scholar]
- Nicolelis, M.A.L. Actions from thoughts. Nature 2001, 409, 403–407. [Google Scholar] [CrossRef]
- Dornhege, G.; Millán, J.D.R.; Hinterberger, T.; McFarland, D.J.; Müller, K.-R. (Eds.) Towards Brain-Computer Interfacing; MIT Press: Cambridge, MA, USA, 2007. [Google Scholar]
- Allison, B.Z.; Wolpaw, E.W.; Wolpaw, J.R. Brain-computer interface systems: Progress and prospects. Expert Rev. Med. Devices 2007, 4, 463–474. [Google Scholar] [CrossRef]
- Williamson, J.; Murray-Smith, R.; Blankertz, B.; Krauledat, M.; Müller, K.R. Designing for uncertain, asymmetric control: Interaction design for brain-computer interfaces. Int. J. Hum.-Comput. Stud. 2009, 67, 827–841. [Google Scholar] [CrossRef]
- Carlson, T.; Leeb, R.; Chavarriaga, R.; Millán, J.D.R. The birth of the brain-controlled wheelchair. In Proceedings of the 2012 IEEE/RSJ International Conference on Intelligent Robots and Systems, Vilamoura, Portugal, 7–12 October 2012; pp. 5444–5445. [Google Scholar] [CrossRef] [Green Version]
- Millán, J.D.R.; Renkens, F.; Mourińo, J.; Gerstner, W. Noninvasive brain-actuated control of a mobile robot by human EEG. IEEE Trans. Biomed. Eng. 2004, 51, 1026–1033. [Google Scholar] [CrossRef] [Green Version]
- Millán, J.D.R.; Renkens, F.; Mourińo, J.; Gerstner, W. Brainactuated interaction. Artif. Intell. 2004, 159, 241–259. [Google Scholar] [CrossRef] [Green Version]
- Karim, A.A.; Hinterberger, T.; Richter, J.; Mellinger, J.; Neumann, N.; Flor, H.; Kübler, A.; Birbaumer, N. Neural internet: Web surfing with brain potentials for the completely paralyzed. Neurorehabil. Neural Repair 2006, 20, 508–515. [Google Scholar] [CrossRef]
- Martišius, I.; Damaševičius, R. A Prototype SSVEP Based Real Time BCI Gaming System. Comput. Intell. Neurosci. 2016, 2016, 3861425. [Google Scholar] [CrossRef] [PubMed] [Green Version]
- Rouillard, J.; Cabestaing, F.; Vannobel, J.M.; Bekaert, M.H. Supervising SSSEP experiments with a Bluetooth Android remote control application. In Proceedings of the International Conference on Applied Human Factors and Ergonomics, Orlando, FL, USA, 21–25 July 2018. [Google Scholar]
- Nissan Brain-to-Vehicle Technology Redefines Future of Driving. Available online: https://global.nissannews.com/en/releases/180103-01-e?source=nng (accessed on 12 October 2020).
- Gundelakh, F.; Stankevich, L.; Sonkin, K. Mobile robot control based on noninvasive brain-computer interface using hierarchical classifier of imagined motor commands. In Proceedings of the MATEC Web of Conferences, České Budějovice, Czech Republic, 23–24 November 2017; EDP Sciences: Ulis, France, 2018; Volume 161, p. 03003. [Google Scholar] [CrossRef]
- Lampe, T.; Fiederer, L.D.; Voelker, M.; Knorr, A.; Riedmiller, M.; Ball, T. A brain-computer interface for high-level remote control of an autonomous, reinforcement-learning-based robotic system for reaching and grasping. In Proceedings of the 19th International Conference on Intelligent User Interfaces, Haifa, Israel, 24–27 February 2014; pp. 83–88. [Google Scholar] [CrossRef] [Green Version]
- Dumitrescu, C.; Raboaca, M.S.; Felseghi, R.A. Methods for Improving Image Quality for Contour and Textures Analysis Using New Wavelet Methods. Appl. Sci. 2021, 11, 3895. [Google Scholar] [CrossRef]
- Su, Y.; Qi, Y.; Luo, J.X.; Wu, B.; Yang, F.; Li, Y.; Zhuang, Y.; Zheng, X.; Chen, W.D. A hybrid brain-computer interface control strategy in a virtual environment. J. Zhejiang Univ. Sci. C 2011, 12, 351–361. [Google Scholar] [CrossRef]
- Duan, X.; Xie, S.; Xie, X.; Meng, Y.; Xu, Z. Quadcopter flight control using a non-invasive multi-modal brain computer interface. Front. Neurorobot. 2019, 13, 23. [Google Scholar] [CrossRef]
- Rosca, S.; Leba, M.; Ionica, A.; Gamulescu, O. Quadcopter control using a BCI. In IOP Conference Series: Materials Science and Engineering; IOP Publishing: Bristol, UK, 2018; Volume 294, p. 012048. [Google Scholar] [CrossRef]
- Chiuzbaian, A.; Jakobsen, J.; Puthusserypady, S. Mind Controlled Drone: An Innovative Multiclass SSVEP based Brain Computer Interface. In Proceedings of the 2019 7th International Winter Conference on Brain-Computer Interface (BCI), Gangwon, Korea, 18–20 February 2019; pp. 1–5. [Google Scholar] [CrossRef] [Green Version]
- Minea, M.; Dumitrescu, C.; Minea, V. Intelligent Network Applications Monitoring and Diagnosis Employing Software Sensing and Machine Learning Solutions. Sensors 2021, 21, 5036. [Google Scholar] [CrossRef] [PubMed]
- Simona Răboacă, M.; Dumitrescu, C.; Filote, C.; Manta, I. A New Adaptive Spatial Filtering Method in the Wavelet Domain for Medical Images. Appl. Sci. 2020, 10, 5693. [Google Scholar] [CrossRef]
- Han, S.-J.; Song, M.; Kim, J.; Lee, W.-S.; Lee, H.-K. Classification of temporal bone pneumatization based on sigmoid sinus using computed tomography. Clin. Radiol. 2007, 62, 1110–1118. [Google Scholar] [CrossRef]
- Mou, L.; Ghamisi, P.; Zhu, X.X. Deep recurrent neural networks for hyperspectral image classification. IEEE Trans. Geosci. Remote Sens. 2017, 55, 36393655. [Google Scholar] [CrossRef] [Green Version]
- Liao, B.; Ma, C.; Xiao, L.; Lu, R.; Ding, L. An arctan-activated wasd neural network approach to the prediction of dow jones industrial average. In International Symposium on Neural Networks; Springer: Cham, Switzerland, 2017. [Google Scholar]
- Bottou, L. Large-scale machine learning with stochastic gradient descent. In Proceedings of the COMPSTAT’2010, Paris, France, 22–27 August 2010; Physica-Verlag HD: Heidelberg, Germany, 2010. [Google Scholar]
- Johnson, R.; Zhang, T. Accelerating stochastic gradient descent using predictive variance reduction. Adv. Neural Inf. Process. Syst. 2013, 26, 315–323. [Google Scholar]
- Zinkevich, M.; Weimer, M.; Smola, A.J.; Li, L. Parallelized stochastic gradient descent. Adv. Neural Inf. Process. Syst. 2010, 4, 2595–2603. [Google Scholar]
- Zhang, T. Solving large scale linear prediction problems using stochastic gradient descent algorithms. In Proceedings of the Twenty First International Conference on Machine Learning, New York, NY, USA, 4–8 July 2004; p. 116. [Google Scholar]
Figure 1.
The block diagram of BCI system for MI classification.

Figure 2.
The electrode that was marked in yellow denoted those used for online control.

Figure 3.
The paradigm of testing, controlling (moving) the ball. The ball is the cursor and moving the ball is the target. (A) Before the ball reaches the target to move to the right (the subject imagination the movement of the right hand). (B) When the ball reaches the state of equilibrium—stop (the subject relaxes). When the moving target is reached, the ball stops. (C) Before the ball reaches the left target (the subject imagines the movement of the left hand). When the ball reaches the state of equilibrium—stop (the subject relaxes). (D) The state of equilibrium (relaxation).

Figure 4.
Flow-chart indicating EEG data-processing pipeline.

Figure 5.
Noise reduction for a signal (AC voltage) using UWT wavelet.

Figure 6.
UWT transform, direct and inverse for two levels of decomposition, one-dimensional case.

Figure 7.
Multiresolution UWT decomposition for EEG signal.

Figure 8.
Coefficient of determination calculated for the signal corresponding to MI of the left hand vs. relaxation.
Figure 8.
Coefficient of determination calculated for the signal corresponding to MI of the left hand vs. relaxation.

Figure 9.
Coefficient of determination calculated for the signal corresponding to the MI of the right hand vs. relaxation.
Figure 9.
Coefficient of determination calculated for the signal corresponding to the MI of the right hand vs. relaxation.

Figure 10.
RBF neural network architecture used to classify EEG signals.

Figure 11.
EEG signals associated with MI left hand used for RBF training and testing.

Figure 12.
EEG signals associated with MI right hand used for RBF training and testing.

Figure 13.
The detail coefficient of order 4 for the signal corresponding to motor imagery of the movement of the left hand and for the signal recorded during relaxation: 8–9 Hz (a), 10–11 Hz (b), 12–13 Hz (c), using Haar function.
Figure 13.
The detail coefficient of order 4 for the signal corresponding to motor imagery of the movement of the left hand and for the signal recorded during relaxation: 8–9 Hz (a), 10–11 Hz (b), 12–13 Hz (c), using Haar function.

Figure 14.
Determination coefficient calculated for the filtered signal.

Figure 15.
Coefficient of determination calculated for the reconstructed signal after the ICA has been applied.
Figure 15.
Coefficient of determination calculated for the reconstructed signal after the ICA has been applied.

Figure 16.
3D animation of the behavior of the drone in LabVIEW 3D animation.

Figure 17.
EEG signals used: C3, CP3 and P3, corresponding to the motor imagery of the right hand and C4, CP4 and P4, corresponding to the motor imagery of the left hand.
Figure 17.
EEG signals used: C3, CP3 and P3, corresponding to the motor imagery of the right hand and C4, CP4 and P4, corresponding to the motor imagery of the left hand.

Figure 18.
BCI simulation results for the virtual quadcopter; (a) start position, (b) activate drone, (c) move to left and (d) move to right.
Figure 18.
BCI simulation results for the virtual quadcopter; (a) start position, (b) activate drone, (c) move to left and (d) move to right.

Figure 19.
Graphical representation of results with all classification methods used for subjects performing the task of motor imagery of the right hand.
Figure 19.
Graphical representation of results with all classification methods used for subjects performing the task of motor imagery of the right hand.

Figure 20.
Graphical representation of the results with all classification methods used for subjects performing the task of motor imagery of the left hand.
Figure 20.
Graphical representation of the results with all classification methods used for subjects performing the task of motor imagery of the left hand.


Table 1.
Information about the subject in different repetitive stages.
| Subject S | Imagery /Motion | Frequency (Hz) | Location | Max r2 Channel |
|---|---|---|---|---|
| St 1 | Right/Left | 15–24/15–20 Hz | CP3, P3, C3/CP4, C4 | 0.321 (CP3)/0.499 (CP4) |
| St 2 | Right/Left | 18–22/20–22 Hz | CP3, P3/C4 | 0.256 (CP3)/0.218 (CP4) |
| St 3 | Right/Left | 12–22/14–20 Hz | CP3, C3, P3/CP4, C4 | 0.332 (CP3)/0.360 (P4) |
| St 4 | Right/Left | 18–22/12–20 Hz | P3, Pz, CP3/CP4, C4 | 0.450 (P3)/0.360 (CP4) |
| St 5 | Right/Left | 8–10/18–20 Hz | P3, P4/CP4 | 0.231 (P4)/0.268 (CP4) |
Table 2.
The results obtained for the tanh activation function.
| Number of Neurons | Training | Testing | ||
|---|---|---|---|---|
| Cost | Accuracy | Cost | Accuracy | |
| 8 | 0.57 | 75.57 | 0.35 | 87.05 |
| 16 | 0.58 | 72.00 | 0.32 | 90.18 |
| 32 | 0.58 | 73.29 | 0.46 | 88.62 |
| 64 | 0.56 | 74.56 | 0.34 | 87.18 |
| 128 | 0.54 | 74.23 | 0.38 | 85.65 |
| 256 | 0.55 | 75.83 | 0.38 | 89.97 |
Table 3.
The results obtained for the sigmoid activation function.
| Number of Neurons | Training | Testing | ||
|---|---|---|---|---|
| Cost | Accuracy | Cost | Accuracy | |
| 8 | 0.51 | 72.87 | 0.35 | 94.65 |
| 16 | 0.52 | 74.00 | 0.38 | 84.65 |
| 32 | 0.58 | 72.89 | 0.41 | 84.62 |
| 64 | 0.53 | 74.00 | 0.38 | 93.23 |
| 128 | 0.59 | 64.25 | 0.38 | 82.35 |
| 256 | 1.55 | 52.63 | 0.75 | 90.17 |
Table 4.
The results obtained for the arctan activation function.
| Number of Neurons | Training | Testing | ||
|---|---|---|---|---|
| Cost | Accuracy | Cost | Accuracy | |
| 8 | 0.67 | 67.87 | 0.35 | 95.67 |
| 16 | 0.67 | 64.53 | 0.31 | 95.37 |
| 32 | 0.55 | 72.79 | 0.31 | 92.62 |
| 64 | 0.58 | 74.31 | 0.33 | 88.53 |
| 128 | 0.52 | 78.25 | 0.34 | 87.38 |
| 256 | 0.55 | 71.13 | 0.35 | 94.17 |
Table 5.
The confusion matrix from MLP–RNN with ICA and r2.
| Predicted Label | ||||
|---|---|---|---|---|
| Background Noise | Single MI Task | Two MI Tasks | ||
| True Label | Background Noise | 1.00 | 0.00 | 0.00 |
| Single MI task | 0.00 | 0.96 | 0.06 | |
| Two MI tasks | 0.00 | 0.93 | 0.57 | |
Table 6.
Classification report for MLP–RNN with ICA and r2.
| Classes | Precision | Recall | F1 Score |
|---|---|---|---|
| Background Noise | 1 | 1 | 1 |
| Single MI task | 0.99 | 0.98 | 0.98 |
| Two MI tasks | 0.98 | 0.97 | 0.97 |
| Average/total | 0.98 | 0.95 | 0.96 |
Table 7.
Hybrid RBF MLP–RNN classifier results for motor imagery right hand.
| Subject | Right Hand | Hybrid NN-C3 | Hybrid NN-CP3 | Hybrid NN-P3 |
|---|---|---|---|---|
| St 1 | Imagery | 95% | 95% | 92% |
| St 2 | Imagery | 95% | 86% | 91% |
| St 3 | Imagery | 91% | 95% | 95% |
| St 4 | Imagery | 95% | 95% | 95% |
| St 5 | Imagery | 86% | 95% | 95% |
Table 8.
Hybrid RBF MLP–RNN classifier results for motor imagery left hand.
| Subject | Left Hand | Hybrid NN-C4 | Hybrid NN-CP4 | Hybrid NN-P4 |
|---|---|---|---|---|
| St 1 | Imagery | 91% | 95% | 95% |
| St 2 | Imagery | 91% | 95% | 91% |
| St 3 | Imagery | 95% | 95% | 95% |
| St 4 | Imagery | 95% | 95% | 91% |
| St 5 | Imagery | 95% | 95% | 95% |
Publisher’s Note: MDPI stays neutral with regard to jurisdictional claims in published maps and institutional affiliations. |
© 2021 by the authors. Licensee MDPI, Basel, Switzerland. This article is an open access article distributed under the terms and conditions of the Creative Commons Attribution (CC BY) license (https://creativecommons.org/licenses/by/4.0/).
Share and Cite
MDPI and ACS Style
Dumitrescu, C.; Costea, I.-M.; Semenescu, A. Using Brain-Computer Interface to Control a Virtual Drone Using Non-Invasive Motor Imagery and Machine Learning. Appl. Sci. 2021, 11, 11876. https://doi.org/10.3390/app112411876
AMA Style
Dumitrescu C, Costea I-M, Semenescu A. Using Brain-Computer Interface to Control a Virtual Drone Using Non-Invasive Motor Imagery and Machine Learning. Applied Sciences. 2021; 11(24):11876. https://doi.org/10.3390/app112411876
Chicago/Turabian StyleDumitrescu, Catalin, Ilona-Madalina Costea, and Augustin Semenescu. 2021. "Using Brain-Computer Interface to Control a Virtual Drone Using Non-Invasive Motor Imagery and Machine Learning" Applied Sciences 11, no. 24: 11876. https://doi.org/10.3390/app112411876
Note that from the first issue of 2016, this journal uses article numbers instead of page numbers. See further details here.