
Optical Diagnostics during Pulsed Laser Ablation in Liquid (PLAL) for the Production of Metallic Nanoparticles


1
CNR-NANOTEC, c/o Chemistry Department, University of Bari, Via Orabona 4, 70126 Bari, Italy
2
Chemistry Department, University of Bari, Via Orabona 4, 70126 Bari, Italy
*
Author to whom correspondence should be addressed.
Appl. Sci. 2021, 11(21), 10344; https://doi.org/10.3390/app112110344
Submission received: 29 September 2021
/
Revised: 28 October 2021
/
Accepted: 29 October 2021
/
Published: 3 November 2021
(This article belongs to the Special Issue Recent Advances in Plasma Technology and Applications)
Abstract
:Pulsed laser ablation in liquid (PLAL) is gaining an important role as a methodology for producing nanostructures without the use of chemicals and stabilizers. Several nanomaterials have been produced and the engineering of PLAL is becoming an important task for the dissemination of this approach for nanostructure production. Monitoring the processes involved in the PLAL during nanostructure production can be extremely useful for improving the experimental methods and for pushing PLAL to new material formation. In this paper, we discuss the use of optical techniques for investigating the specific stages involved in the production of nanomaterials with PLAL. In particular, the recent advancements of these optical techniques for each specific stage of the PLAL process will be discussed: optical emission spectroscopy and imaging for the investigation of the plasma phase, shadowgraph imaging for the investigation of the cavitation bubble dynamics and different scattering techniques for the visualization of the produced nanostructure.
1. Introduction
Recently, the use of plasma for producing nanostructures of different materials are gaining growing interest. One of the most powerful methods for producing nanoparticles (NPs) with plasma is the use of laser pulse, namely, pulsed laser ablation in liquid (PLAL) or laser-assisted synthesis in solution (LASiS) [1,2]. In this technique, the material ejection is obtained by focusing a laser pulse on a specific target immersed in liquid. The laser-induced plasma (LIP) and cavitation bubble generation are the main processes occurring after the laser-matter interaction. During the plasma and cavitation bubble evolution, the production of NPs, generally with the same composition of the target, occurs. One of the most attractive features of such a tool for NP production is that with a very simple set-up, it is possible to obtain high quality NPs, in terms of purity and size distribution. Moreover, PLAL does not require stabilizers or chemical compounds for their growth and stabilization in solution.
In the last decades, several kinds of nanostructures have been produced with PLAL including metallic NPs [1], various carbon NPs and nanotubes [3], alloy NPs, core-shell NPs [4], etc.
Despite the ease of the instrumental set up, the process is very complex to investigate for several reasons: the plasma produced with laser−matter interaction in water has a maximum dimension comparable to the laser spot size and a lifetime at microsecond scale; the emission of the plasma contains poor information on the ablated species because it is dominated by continuum radiation. A few hundreds of ns after the laser pulse, the cavitation is induced around the plasma and it evolves very fast in the order of hundreds of microseconds changing, in turn, the refraction index. Finally, during the PLAL processes, the observation of the NPs’ evolution is very difficult with visible sources, since the NPs themselves have a smaller size than the visible light wavelength. The previously mentioned issues imply the necessity of using high temporally and spatially resolved techniques to retrieve information on the generation of NPs during the PLAL processes. Optical tools like optical emission spectroscopy (OES), shadowgraph and laser scattering techniques are generally employed for the diagnostics of the processes occurring during PLAL, while most of information is obtained with theoretical calculation [5,6]. In this paper, a general overview of these techniques including the advantages and disadvantages is discussed.
2. Materials and Methods
The employed laser was ns pulsed laser (Quanta System, PILS-GIANT, 6 ns pulse duration) operating with the fundamental (1064 nm) and the second harmonic (532 nm), a repetition rate varying between 1 and 10 Hz and with energy varying between 50 mJ and 217 mJ, depending on the experiment performed. The processes of laser ablation in liquid were studied during the production of NPs with high temporal and spatial resolution techniques, as described in further paragraphs. The laser ablation in liquid was performed by focusing the laser beam on a target immersed in deionized water using a stainless steel chamber with a set of optics for laser transmission and the collection of the plasma emission and/or shadowgraph detection. For the optical emission spectroscopy, a spectrometer (Jobin Yvon TRIAX 550) equipped with an intensified charge-coupled device (ICCD) as the detector (Jobin Yvon i3000) was employed. For the shadowgraph technique a collimated light source obtained by a set of lenses and a fast ICCD detection system (New iStar, Andor) coupled with a pulse generator (Stanford inc. DG 535) for the laser pulse-ICCD synchronization were employed. The laser scattering measurements during the PLAL processes were performed with a continuum laser DPSS at 532 nm (Cobolt Samba, 25 mW, CW) by employing the same spectroscopic system used for the shadowgraph experiment. For each presented experiment, the laser focal position onto the target surface and the water were changed after each measurement to always have a flat target and fresh water, respectively. The laser crater on the target had a diameter of 1 ± 0.2 mm.
The targets were titanium (99.995% pure, 1” diameter × 0.125” thick, Kurt J. Lesker) and silver (99.99% pure, 1” diameter × 0.125” thick, Kurt J. Lesker).
3. Temporal sequence of PLAL processes
- (a)
- laser ablation and plasma production,
- (b)
- plasma expansion and shockwave propagation,
- (c)
- cavitation bubble expansion and compression,
- (d)
- NPs releasing in solution.
PLAL starts with the interaction of the laser pulse with the target. The laser pulse energy is converted into electron excitation in the material and the generation of charged particles (electrons and ions) occurs by multiphoton ionization. Because of these processes, the target material is ejected in a few tens of fs. In the case of ns irradiation, the laser pulse continues to interact with the ablated material and in particular with the free electrons, releasing further energy and heating the electron and, consequently, inducing the plasma.
The plasma reaches a temperature of several thousands of Kelvin and consequently, it transfers part of its energy to the surrounding liquid. In these conditions, a thin layer of vapor at high temperature is suddenly formed. As a consequence of the high temperature, the vapor pressure is very high and this layer starts to expand at supersonic speed inducing the cavitation bubble. When the bubble reaches its equilibrium with the surrounding liquid, the expansion stops and the liquid mass accumulated at the border of the bubble compresses the vapor inducing the collapse stage. If enough energy has been stored in the bubble, the latter rebounds, inducing further expansion/compression stages. Recently, it has been shown that the compression stage plays an important role in the release of the formed NPs into the solution because the electrostatic pressure of the NP cloud inside the bubble becomes greater than the pressure of the liquid at the border [8].
4. OES for the Laser Induced Plasma Investigation
As mentioned in the previous paragraph, in the case of ns-laser ablation, the source of material for NP generation is the plasma. For this reason, retrieving information on the plasma system is of great importance to understand the PLAL processes. As a consequence of the high ionization degree and the high temperature, the plasma is characterized by an intense emission of light that can be investigated with the optical emission spectroscopy, OES. The instrumental set up for OES is sketched in Figure 2, where the integrated plasma emission intensity is collected on the slit of the spectrometer through a lens and the spectrometer is coupled with an ICCD to obtain the temporal evolution acquisition of the plasma emission.
In the case of laser-induced plasma in liquid, the plasma expansion is notably confined, not only for the low compressibility of the liquid phase, but especially because the fast energy transfer from the plasma to the liquid induces the vaporization of the surrounding liquid and the production of a water vapor thin layer [9]. The latter, that is the starting point of the cavitation bubble [13], is characterized by high temperature and high pressure and consequently expands in all directions. Therefore, the high pressure of the cavitation at the early stage of bubble formation contains the plasma and confines it in a small volume. The main effect of this strong confinement is that the matter in the plasma phase holds a high number density for the entire plasma lifetime [9,12]. This phenomenon can be directly appreciated with the spectral features of the plasma emission. The emission spectrum of the laser-induced plasma is characterized by the absence of discrete emission lines and by a continuum spectrum resembling the Planck-like distribution of photons, as shown in Figure 3a, where a typical example of temporal evolution of the continuum radiation spectra of LIP is shown. The absence of the discrete emission lines that generally characterize laser-induced plasma in a gas and vacuum environment, is related to the high-density effects. According to Fermi or Debye theories, the cut-off of the levels occurs when excited levels cannot be achieved as a consequence of a sharp lowering of the ionization energy [13]. This happens because of the high density (1020–1022 cm−3) that constrains the excited atom’s expansion (Fermi)—the distance between particles is smaller than the size of the excited particle—or because of the high electron number density (1019–1021 cm−3) that affects the Coulomb potential of the particle (Debye−Huckel effect) [14]. For this condition, the radiative recombination is the main contribution to the spectrum as discussed in Ref. [15]. As a result of this high density effect, the spectral distribution is proportional to the Planck’s distribution [15].
In the visible range of the spectrum, the Wien’s approximation can be assumed so that [7]:
In Equation (1), h is the Planck constant, k the Boltzmann constant, c the speed of the light and G(T, Ne) represents a function depending on detection efficiency, on the electron number density (Ne) and plasma temperature (T), but not on the wavelength. The Planck distribution can be plotted in the logarithmic form to determine the temperature of the plasma from the inverse of the slope as shown in Figure 3b:
Note that the intensity, Iλ, used in the Planck plot is integrated over a small wavelength range (e.g., corresponding to the spectral resolution of the detection system). As an example of the result obtained with temporally resolved OES, Figure 3c shows the temporal temperature evolution determined from the continuum spectra of Figure 3a.
Another interesting measurement of the plasma evolution can be performed by the fast imaging technique. The imaging of the total emission of plasma can also be simply detected with an ICCD coupled to an objective for studying the dynamics of the plasma [11]. Then, plasma emission imaging and OES can be matched for retrieving temporally resolved spatial maps of temperature. This can be obtained as sketched in Figure 4: the plasma emission image is split and focused on different areas of the ICCD. Along the optical paths, two narrowband filters at two different wavelengths are located in the optical paths of the split image, therefore the simultaneous acquisition of two plasma images at different wavelengths is collected. In this way, it is possible to employ Equation (2) in the form of an intensity ratio for the estimation of the temperature trend across the plasma. Although this approach is not so accurate as the one using a Planck-like distribution obtained with the wavelength range of the whole visible spectrum, if the two filter wavelengths are optically far enough (>100 nm) from each other, the investigation of the temperature of the plasma with a micrometric spatial resolution can be done as shown in Figure 5. Ref. [7] describes in detail both the experimental procedures and the used equations for retrieving the plasma temperature maps temporally and spectrally resolved.
As an example, Figure 5 shows the temperature maps obtained with laser ablation of a titanium target immersed in water. In particular, Figure 5 reports the results at three delay times from the laser pulse and the corresponding axial temperature profile along the expansion axis of the plasma. It is evident that the temperatures were not homogeneous in the whole plasma volume since the map presented the inner zone with lower values with respect to those at the edge of the plasma (30% hotter). At longer delay times, the temperatures tended to reach homogeneous values all over the plasma volume. On the other hand, from the plasma images, the plasma volume as a function of time could be estimated. This information can be very important if the ablated mass can be measured independently, for example, by measuring the ablated volume of the crater because it allows the calculation of the ablated mass from the density of the target [17]. When the total ablated mass and the plasma volume are known, the initial number density can be determined. Moreover if the initial number density and the plasma temperature is known, the Saha equation [18] can be applied and the temporal and spatial evolution of the number density of the species in the plasma can be determined. The details of these calculations are reported in Ref. [7]. The traditional OES on plasma emission, although it allows good temporal resolution, does not permit spatial resolution and, consequently, the estimated temperature is spatially integrated along the all emitting volume. Since it does not allow the observation of several aspects of the plasma structure, the coupling of plasma OES and emission imaging can introduce a deeper inspection of the plasma characteristics during its expansion dynamics in water. As a matter of fact, the temperature and number density spatial distributions can reveal important information about the formation mechanisms of NPs during the ablation in water, as reported in Ref. [7].
5. Shadowgraph Technique for the Cavitation Bubble Investigation
The laser-induced cavitation bubble dynamics can be studied by employing a high temporally resolved shadowgraph technique [9,19,20,21].
In Figure 6, a typical sketch for the shadowgraph technique is shown.
The bubble is generated by the fast energy exchanges between the plasma and the liquid and its evolution strictly depends on laser pulse characteristics as wavelength, output energy and focusing condition, pulse duration, external pressure [11,22]. As an example, at atmospheric external pressure, the ns laser-induced bubble duration is usually in the order of hundreds of microseconds, that is orders of magnitude longer than the plasma duration itself [23]. The bubble dynamics consists of an early expansion stage, a maximum expansion, reached when the vapor pressure inside the bubble equals the surrounding water pressure, and a further shrinking stage where the bubble collapses. After the first collapse, a bubble rebound can occur with a higher order bubble formation, depending on the initial laser energy [24]. When higher order bubbles are induced, the expansion/compression stages resemble a damping oscillator, until all energy of the cavitation bubble is dissipated into the surrounding liquid.
The evolution of the radius of a cavitation bubble can be experimentally determined from the shadowgraph images, as reported in Figure 6b where Ry is employed to determine the bubble radius, Rx is employed to determine the bubble front expansion, z is the shadowgraph detection direction and x is the laser direction. The determination of the radii can be directly employed for the determination of the vapor pressure inside the bubble during the bubble dynamics.
From the experimental point of view, Figure 7 shows the temporal evolution of a laser-induced bubble on Ag target immersed in water. Figure 8 shows the experimental bubble radius determined from the shadowgraph images reported in Figure 7.
As a matter of fact, by determining the bubble radius at each observation time, the estimation of pressure and of the temperature inside the bubble with the hardcore Van der Waals model can be performed [8,9]. In Ref. [25], the Rayleigh–Plesset equation was employed starting from the experimental parameters. In particular, to take into account the liquid compressibility, the Keller–Miksis formulation [24] was used, starting from the initial experimental radius (in this case, equal to the laser spot size, but the first experimental radius determined with the shadowgraph image can also be employed) and assuming an adiabatic Van der Waals equation of state for the gas in the spherical bubble. With this approach, the radius, and in turn the volume, are related to the vapor pressure and temperature. The theoretical estimation of the bubble radius, pressure and temperature evolution of the vapor inside the bubble can also be done as in Ref. [26] where the extreme conditions of the pressure reached during the collapse stage were revealed.
Once the estimation of vapor pressure inside the bubble is determined, a comparison with the electrostatic pressure due to the NPs inside the bubble volume can be investigated in order to obtain an evaluation of the number of the NPs ejected in the water during the bubble dynamics. When the bubble begins to expand, the NPs produced in the plasma stage occupy the whole bubble volume following its dynamics. Immediately after the plasma stage, the NPs have absorbed enough charge on their surface to produce an electrostatic pressure whose behavior follows the bubble radius evolution. When the NPs’ electrostatic pressure is higher than the pressure at the water/vapor boundary, the NPs escape from the cavitation bubble and are released in solution. In Ref. [8], by the comparison between the bubble water pressure and the NPs’ electrostatic pressure and by an estimation of the number of the AgNPs, the releasing of the NPs from the cavitation bubble to the liquid has been modeled.
In Figure 8, the same procedures described in [8] have been followed for estimating the percentages of ejected AgNPs during the bubble evolution of Figure 7. In this case, most of AgNPs ejection occurs immediately after the beginning of the expansion phase and, to a greater extent, between the collapsing stage and the bubble rebound.
6. NP Visualization during the PLAL Processes
In the last years, part of the literature on the PLAL was dedicated to the NP formation mechanism during the different PLAL steps occurring before the NPs releasing in solution. The study of the PLAL processes coupled with the investigation of NP location and the mechanisms of release in solution is a very important goal for the control and the systematic production of NPs. The NPs before the release in solution are trapped inside the cavitation bubble following, of course, the bubble dynamics as discussed in the previous section. The visualization of the NPs inside the cavitation bubble during its evolution by the use of optical diagnostics is extremely difficult just because the bubble surrounds the NPs and light scattering is not so efficient when scatters are smaller than the incident wavelength.
One of the most powerful techniques for obtaining information on the size and mass of particles inside the bubble is the small-angle X-ray scattering (SAXS), usually obtained by synchrotron-radiation [27]. A simpler way [10] to check qualitatively the location of the NPs in the bubble is to shoot a second laser pulse focused inside the bubble produced by the first laser pulse in order to produce a secondary plasma from the material ablated by the first pulse. This technique, that is double pulse laser ablation in liquid (DP-LAL), can be efficiently used as a diagnostic tool for understanding the distribution of NPs in the bubble volume. Finally, also the light-scattering-based technique [9,28] has been used for the inspection of the materials inside the cavitation bubble during its evolution.
In the following, a brief description of the techniques mentioned above is given.
In Ref. [29], small-angle X-ray scattering was used during the cavitation bubble evolution to identify the species inside the bubble generated by laser ablation of a silver target in water with temporal and spatial resolution. Since the X-rays can penetrate the bubble interior, X-ray scattering can analyze the nanometer-sized particle distributions. Figure 9a shows a sketch of the employed experimental set-up, and Figure 9b, the main results obtained with this technique. The authors of Ref. [29] show in detail how, in the bubble volume, during the bubble evolution, two different groups of particle size distributions can be identified. One contains particles around 8–10 nm size and the other one contains bigger agglomerates around 40–60 nm size. Further research has been done by the same group, improving the temporal resolution of the acquisition [30] and the quantification as well as a survey of the crystallinity of NPs during the release in solution [31].
In Figure 10a, a sketch of the experimental set-up for the DP-LAL technique is shown [32,33]. Using the double pulse technique as a diagnostic of the materials inside the cavitation bubble, the first laser pulse is employed for the PLAL, while the second laser pulse is fired collinearly to the first one and focused on the target at different interpulse delays between the two laser shots. By simultaneously acquiring the shadowgraph of the bubble and the images of the plasma generated by the second pulse, it is possible to visualize the second plasma at a different lifetime of the bubble. Depending on the position of the NPs inside the bubble, the second plasma is generated. In part on the target, in part on the materials that occupy the bubble. Figure 10b clearly shows this phenomenon, described in detail in Ref. [10], where it is possible to discriminate between both the NPs inside the bubble, located immediately below the expansion bubble front, and the materials ejected in solution after the bubble collapse.
Figure 11a shows the sketch of the experimental set-up for the laser scattering technique. The continuum laser employed for scattering is perpendicular to the bubble axis propagation, and the images of the scattering are acquired during the cavitation bubble evolution. Of course, the scattering can easily come from the bubble surface instead of penetrating the bubble itself. To overcome this drawback, usually more than one technique can be used, to retrieve some useful information. Spectroscopy, shadowgraph and laser scattering measurements with high temporal resolution can be applied simultaneously to analyze respectively the laser-induced plasma, the bubble and the delivered particles.
As a matter of fact, as described in [9], employing the three high temporally resolved techniques, it was seen that the scattering signal suggested that the produced particles, after the bubble collapse, were lying close to the target surface. Figure 11b shows an example of laser scattering coupled with the shadowgraph technique, where the images obtained during the laser scattering were acquired with the same experimental conditions of the shadowgraph images reported in the upper part of Figure 11b. Finally, in Ref. [34], the laser scattering was coupled with simultaneous spectroscopy of the materials inside the bubble.
To probe the materials inside the bubble employing laser scattering without the previously described drawbacks, Ref. [35] proposed a variation of the classical experimental set-up, where the probe laser was introduced into the ablation bubble through a flat and transparent window created by the pump laser, after the ablation of a thin Ag film on a glass substrate. Figure 12a shows a sketch of the experimental set-up where it is clearly visible that the laser probe enters the bubble from the bottom side of the bubble expansion direction, therefore it can persist inside the bubble during its evolution stages (expansion and shrinking). This NP visualization method is based on the different polarization dependences of the NP clouds from the reflection inside the bubble, that allows the distinction between the scattered signal of the NPs and the background reflection. Figure 12b shows the results of this experiment where it is visible that the dim spots, generated on the materials inside the bubble, are all inside the bubble volume and along the probe laser path. More details can be found in Ref. [35].
7. Conclusions
Several optical techniques for the diagnostics of the PLAL process have been presented and discussed. A summary of the advantages and shortcomings is reported in Table 1.
The use of OES allows the determination of the plasma parameters that may be extremely useful for investigating the source of matter of the all PLAL processes. Moreover, OES can be coupled with imaging in order to obtain a temporally and spatially resolved map of the plasma parameters.
On the other hand, shadowgraph imaging permits the investigation of the cavitation bubble dynamics. The cavitation stage has focused the attention of many researchers because it is related with the production of the final NP form and with the releasing of the nanoparticle in solution. Shadowgraph imaging enables the determination of the bubble shape and radius. These are crucial pieces of information for investigating the cavitation thermodynamics and the rate of the expansion and compression, as the radius and in turn the volume can be related with the thermodynamic parameters with different real gas-state equations.
Finally, the visualization of the produced nanostructure during the PLAL process can be investigated with scattering techniques or double pulse techniques. Among the scattering techniques, SAXS provides the best information, as light scattering has poor efficacy with scatters smaller than the employed wavelength. The double pulse technique can be a good option for a qualitative investigation of the position of the material in the bubble as well as for visualizing the released NPs.
Author Contributions
M.D. and A.D.G. have equally contributed to conceptualization, methodology, formal analysis, writing—original draft preparation and writing—review and editing of the paper. All authors have read and agreed to the published version of the manuscript.
Funding
This research received no external funding.
Institutional Review Board Statement
Not applicable.
Informed Consent Statement
Not applicable.
Acknowledgments
The authors would like to thank Vincent Motto-Ros (University of Lyon 1) for the collaboration in the measurements of temperature maps of LIP.
Conflicts of Interest
The authors declare no conflict of interest.
References
- Zhang, D.; Gökce, B.; Barcikowski, S. Laser Synthesis and Processing of Colloids: Fundamentals and Applications. Chem. Rev. 2017, 117, 3990–4103. [Google Scholar] [CrossRef]
- Fazio, E.; Gökce, B.; De Giacomo, A.; Meneghetti, M.; Compagnini, G.; Tommasini, M.; Waag, F.; Lucotti, A.; Zanchi, C.G.; Ossi, P.M.; et al. Nanoparticles Engineering by Pulsed Laser Ablation in Liquids: Concepts and Applications. Nanomaterials 2020, 10, 2317. [Google Scholar] [CrossRef]
- De Giacomo, A.; De Bonis, A.; Dell’Aglio, M.; De Pascale, O.; Gaudiuso, R.; Orlando, S.; Santagata, A.; Senesi, G.S.; Taccogna, F.; Teghil, R. Laser ablation of graphite in water in a range of pressure from 1 to 146 atm using single and double pulse techniques for the production of carbon nanostructures. J. Phys. Chem. C 2011, 115, 5123–5130. [Google Scholar] [CrossRef]
- Kamp, M.; Tymoczko, A.; Popescu, R.; Schürmann, U.; Nadarajah, R.; Gökce, B.; Rehbock, C.; Gerthsen, D.; Barcikowski, S.; Kienle, L. Composition and structure of magnetic high-temperature-phase, stable Fe–Au core–shell nanoparticles with zero-valent bcc Fe core. Nanoscale Adv. 2020, 2, 3912. [Google Scholar] [CrossRef]
- Taccogna, F.; Dell’Aglio, M.; Rutigliano, M.; Valenza, G.; De Giacomo, A. On the growth mechanism of nanoparticles in plasma during pulsed laser ablation in liquids. Plasma Sources Sci. Technol. 2017, 26, 045002. [Google Scholar] [CrossRef]
- Rethfeld, B.; Ivanov, D.S.; Garcia, M.E.; Anisimov, S.I. Modelling ultrafast laser ablation. J. Phys. D Appl. Phys. 2017, 50, 193001. [Google Scholar] [CrossRef]
- Dell’Aglio, M.; Motto-Ros, V.; Pelascini, F.; Gornushkin, I.B.; De Giacomo, A. Investigation on the material in the plasma phase by high temporally and spectrally resolved emission imaging during Pulsed Laser Ablation (PLAL) in Liquid for NPs production and consequent considerations on NPs formation. Plasma Sources Sci. Technol. 2019, 28, 8. [Google Scholar] [CrossRef]
- Dell’Aglio, M.; De Giacomo, A. Plasma charging effect on the nanoparticles releasing from the cavitation bubble to the solution during nanosecond Pulsed Laser Ablation in Liquid. Appl. Surf. Sci. 2020, 515, 146031. [Google Scholar] [CrossRef]
- De Giacomo, A.; Dell’Aglio, M.; Santagata, A.; Gaudiuso, R.; De Pascale, O.; Wagener, P.; Messina, G.C.; Compagnini, G.; Barcikowski, S. Cavitation dynamics of laser ablation of bulk and wire-shaped metals in water during nanoparticles production. Phys. Chem. Chem. Phys. 2013, 15, 3083–3092. [Google Scholar] [CrossRef]
- Dell’Aglio, M.; Gaudiuso, R.; De Pascale, O.; De Giacomo, A. Mechanisms and processes of pulsed laser ablation in liquids during nanoparticle production. Appl. Surf. Sci. 2015, 348, 4–9. [Google Scholar] [CrossRef]
- Dell’Aglio, M.; Santagata, A.; Valenza, G.; De Stradis, A.; De Giacomo, A. Study of the effect of water pressure on plasma and cavitation bubble induced by pulsed laser ablation in liquid of silver and missed variations of observable nanoparticle features. ChemPhysChem 2017, 18, 1165–1174. [Google Scholar] [CrossRef]
- Kanitz, A.; Kalus, M.-R.; Gurevich, E.L.; Ostendorf, A.; Barcikowski, S.; Amans, D. Review on experimental and theoretical investigations of the early stage, femtoseconds to microseconds processes during laser ablation in liquid-phase for the synthesis of colloidal nanoparticles. Plasma Sources Sci. Technol. 2019, 28, 103001. [Google Scholar] [CrossRef]
- Dell’Aglio, M.; Gardette, V.; Jantzi, S.C.; De Giacomo, A. Comparison between laser induced plasmas in gas and in liquid. J. Appl. Phys. 2021, 129, 233303. [Google Scholar] [CrossRef]
- Capitelli, M.; Colonna, G.; D’Angola, A. Fundamental Aspects of Plasma Chemical Physics; Springer: New York, NY, USA, 2012. [Google Scholar]
- De Giacomo, A.; Gaudiuso, R.; Dell’Aglio, M.; Santagata, A. The role of continuum radiation in laser induced plasma spectroscopy. Spectrochim. Acta—Part B At. Spectrosc. 2010, 65, 385–394. [Google Scholar]
- Dell’Aglio, M.; De Giacomo, A.; Kohsakowski, S.; Barcikowski, S.; Wagener, P.; Santagata, A. Pulsed laser ablation of wire-shaped target in a thin water jet: Effects of plasma features and bubble dynamics on the PLAL process. J. Phys. D Appl. Phys. 2017, 50, 185204. [Google Scholar] [CrossRef]
- Merten, J.; Johnson, B. Massing a laser-induced plasma with atomic absorption spectroscopy. Spectrochim. Acta Part B: At. Spectrosc. 2018, 149, 124–131. [Google Scholar] [CrossRef]
- Griem, H.R. Principles of Plasma Spectroscopy; Cambridge University Press: Cambrige, UK, 1997. [Google Scholar]
- Lauterborn, W.; Vogel, A. Bubble Dynamics & Shock Waves; Delale, C.F., Ed.; Springer: Berlin/Heidelberg, Germany, 2013; Part I; pp. 67–103. [Google Scholar]
- Long, J.; Eliceiri, M.; Vangelatos, Z.; Rho, Y.; Wang, L.; Su, Z.; Xie, X.; Zhang, Y.; Grigoropoulos, C.P. Early dynamics of cavitation bubbles generated during ns laser ablation of submerged targets. Opt. Express 2020, 28, 1430. [Google Scholar] [CrossRef]
- Hupfeld, T.; Laurens, G.; Merabia, S.; Barcikowski, S.; Gökce, B.; Amans, D. Dynamics of laser-induced cavitation bubbles at a solid–liquid interface in high viscosity and high capillary number regimes. J. Appl. Phys. 2020, 127, 044306. [Google Scholar] [CrossRef]
- Lam, J.; Lombard, J.; Dujardin, C.; Ledoux, G.; Merabia, S.; Amans, D. Dynamical study of bubble expansion following laser ablation in liquids. Appl. Phys. Lett. 2016, 108, 074104. [Google Scholar] [CrossRef]
- Lazic, V.; Jovicevic, S.; Carpanese, M. Laser induced bubbles inside liquids: Transient optical properties and effects on a beam propagation. Appl. Phys. Lett. 2012, 101, 054101. [Google Scholar]
- Brennen, C.E. Cavitation and Bubble Dynamics; Oxford University Press: Oxford, UK, 1995. [Google Scholar]
- Casavola, A.; De Giacomo, A.; Dell’Aglio, M.; Taccogna, F.; Colonna, G.; De Pascale, O.; Longo, S. Experimental investigation and modelling of double pulse laser induced plasma spectroscopy under water. Spectrochim. Acta B 2005, 60, 975–985. [Google Scholar] [CrossRef]
- Akhatov, I.; Lindau, O.; Topolnikov, A.; Mettin, R.; Vakhitova, N.; Lauterborn, W. Collapse and rebound of a laser-induced cavitation bubble. Phys. Fluids 2001, 13, 2805. [Google Scholar] [CrossRef] [Green Version]
- Ibrahimkutty, S.; Wagener, P.; Menzel, A.; Plech, A.; Barcikowski, S. Nanoparticle formation in a cavitation bubble after pulsed laser ablation in liquid studied with high time resolution small angle x-ray scattering. Appl. Phys. Lett. 2012, 101, 103104. [Google Scholar] [CrossRef] [Green Version]
- Sasaki, K.; Takada, N. Growth Processes of Nanoparticles in Liquid Phase Laser Ablation Studied by Laser-Light Scattering. Appl. Phys. Express 2010, 82, 1317. [Google Scholar]
- Wagener, P.; Ibrahimkutty, S.; Menzel, A.; Plech, A.; Barcikowski, S. Dynamics of silver nanoparticle formation and agglomeration inside the cavitation bubble after pulsed laser ablation in liquid. Phys. Chem. Chem. Phys. 2013, 15, 3068. [Google Scholar] [CrossRef] [Green Version]
- Ibrahimkutty, S.; Wagener, P.; dos Santos Rolo, T.; Karpov, D.; Menzel, A.; Baumbach, T.; Barcikowski, S.; Plech, A. A hierarchical view on material formation during pulsed-laser synthesis of nanoparticles in liquid. Sci. Rep. 2015, 5, 16313. [Google Scholar] [CrossRef] [PubMed] [Green Version]
- Reich, S.; Letzel, A.; Menzel, A.; Kretzschmar, N.; Gökce, B.; Barcikowski, S.; Plech, A. Early appearance of crystalline nanoparticles in pulsed laser ablation in liquids dynamics. Nanoscale 2019, 11, 6962. [Google Scholar] [CrossRef] [Green Version]
- Dell’Aglio, M.; Gaudiuso, R.; ElRashedy, R.; De Pascale, O.; Palazzo, G.; De Giacomo, A. Collinear double pulse laser ablation in water for the production of silver nanoparticles. Phys. Chem. Chem. Phys. 2013, 15, 20868. [Google Scholar] [CrossRef] [PubMed]
- López-Claros, M.; Dell Aglio, M.; Gaudiuso, R.; Santagata, A.; De Giacomo, A.; Fortes, F.J.; Laserna, J.J. Double pulse laser induced breakdown spectroscopy of a solid in water: Effect of hydrostatic pressure on laser induced plasma, cavitation bubble and emission spectra. Spectrochim. Acta—Part B At. Spectrosc. 2017, 133, 63–71. [Google Scholar] [CrossRef]
- Takeuchi, M.; Sasaki, K. Spectrum of laser light scattered by nanoparticles in an ablation-induced cavitation bubble. Appl. Phys. A 2016, 122, 312. [Google Scholar] [CrossRef] [Green Version]
- Ando, K.; Nakajima, T. Clear observation of the formation of nanoparticles inside the ablation bubble through a laser-induced flat transparent window by laser scattering. Nanoscale 2020, 12, 9640. [Google Scholar] [CrossRef] [PubMed]
Figure 1.
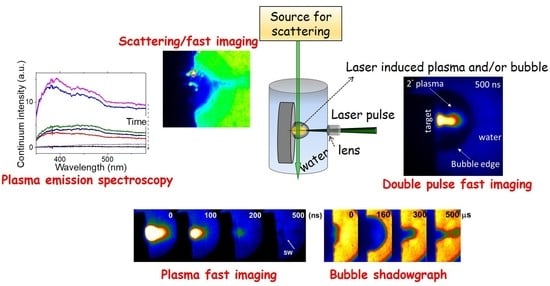
Temporal sequence of PLAL processes with the employed diagnostic techniques. All the images in the sketch have been recorded in the VIS spectral range (400–650 nm).
Figure 1.
Temporal sequence of PLAL processes with the employed diagnostic techniques. All the images in the sketch have been recorded in the VIS spectral range (400–650 nm).

Figure 2.
Sketch of the experimental set-up for optical emission spectroscopy (OES) of laser-induced plasma in liquid.
Figure 2.
Sketch of the experimental set-up for optical emission spectroscopy (OES) of laser-induced plasma in liquid.

Figure 3.
A typical example of (a) temporal evolution of the continuum radiation spectra of LIP induced on target underwater at various delay times. In Figure 3a, the dotted lines represent the interval where the spectra hold the Planck distribution; (b) an example of the corresponding Plank plot analysis during PLAL. Note that the fitting red line corresponds to the linearized Planck spectrum according to Equation (2) at the given T; (c) corresponding temporal temperature evolution. The PLAL was performed on Ag target immersed in a flowing water layer with thickness of 2.5 mm (laser pulse width = 6 ns, laser energy = 90 mJ, laser wavelength = 1064 nm, laser frequency = 10 Hz, crater size = 1 ± 0.2 mm, ICCD gate width = 10 ns, delay times ranging between 10 ns and 80 ns, as reported for each spectrum in (a)). The experimental set-up is described in detail in Ref. [16].

Figure 4.
Experimental set-up for spectrally resolved imaging technique for the simultaneous acquisition of two plasma images at different wavelengths (515 and 410 nm).
Figure 4.
Experimental set-up for spectrally resolved imaging technique for the simultaneous acquisition of two plasma images at different wavelengths (515 and 410 nm).

Figure 5.
Temperature maps of LIP induced on Ti target immersed in water (left) and the corresponding axial temperature profiles at radial distance = 0 μm along the expansion axis of the plasma (right) at delay times from the laser pulse (a) 60 ns, (b) 240 ns and (c) 900 ns, respectively. (Laser pulse width = 6 ns, laser energy = 270 mJ, laser wavelength = 532 nm, laser frequency = 10 Hz, crater size = 1 ± 0.2 mm, ICCD gate width = 20 μs, 100 accumulations for each image).

Figure 6.
(a) Sketch of the experimental set-up for temporally resolved shadowgraph images. (b) Sketch of cavitation bubble where Ry is employed to determine the bubble radius, Rx is employed to determine the bubble front expansion. (The z and x axes are the shadowgraph and laser direction, respectively).

Figure 7.
Time-resolved shadowgraph images of the laser-induced bubble on Ag target immersed in water. (Laser pulse width = 6 ns, laser energy = 50 mJ, laser wavelength = 532 nm, laser frequency = 2 Hz, crater sizes = 1 ± 0.2 mm, ICCD gate width = 20 μs, 5 accumulations for each image).
Figure 7.
Time-resolved shadowgraph images of the laser-induced bubble on Ag target immersed in water. (Laser pulse width = 6 ns, laser energy = 50 mJ, laser wavelength = 532 nm, laser frequency = 2 Hz, crater sizes = 1 ± 0.2 mm, ICCD gate width = 20 μs, 5 accumulations for each image).

Figure 8.
Percentages of ejected AgNPs as a function of time after laser pulse and the corresponding bubble radius evolution. (Laser pulse width = 6 ns, laser energy = 50 mJ, laser wavelength = 532 nm, laser frequency = 2 Hz, crater sizes = 1 ± 0.2 mm, ICCD gate width = 20 μs, estimated initial AgNPs number = 2e10).

Figure 9.
(a) Sketch of the experimental set-up for small-angle X-ray scattering technique. (b) Upper: distribution of the mass of the agglomerates and primary particles as a function of bubble lifetime (40 μs gate). Lower: a sketch of the particle distribution inside the bubble volume for several characteristic delays. (Ag target, laser pulse width = 6 ns, laser energy = 10 mJ, laser wavelength = 1064 nm, laser frequency = 200 Hz) (Reproduced from Ref. [29] with permission from the PCCP Owner Societies).

Figure 10.
(a) Sketch of the experimental set-up for the double pulse fast imaging technique. (b) (Reprinted from Ref. [10] with permission from Elsevier) shadowgraph images of bubble and plasma induced by DP-PLAL on an Ag target in water at different interpulse delays (and with different camera gate width). The images of (b) show the plasma induced by the second laser pulse inside the bubble induced by the first laser pulse, at different moments during the bubble lifetime. The temporal evolution of the laser-induced bubble radius as measured from shadowgraph images during a single-pulse LAL experiment is reported by comparison. (Laser wavelength = 532 nm, irradiance = 17.5 GW cm−2, ICCD gate width is reported on each frame).

Figure 11.
(a) Sketch of the experimental set-up for laser-scattering technique, (b) upper: temporal resolved shadowgraph images; lower: laser scattering images of laser-induced bubble on a Pt wire in water. (Laser pulse width = 6 ns, laser wavelength = 532 nm, laser frequency = 10 Hz, fluence = 203 J cm−2, ICCD gate width = 20 μs, 5 accumulations for each image).

Figure 12.
(a) Sketch of the experimental set-up for laser-scattering technique. (b) Laser-scattering images superposed on the shadowgraph images at different delays after the pump pulse. The probe laser is (upper) horizontally and (lower) vertically to-paper polarized, as indicated by the arrow and cross mark. (Target = Ag film, pump laser pulse width = 5 ns, pump laser energy = 3.7 mJ, pump laser wavelength = 532 nm, probe laser pulse width = 0.8 ns, probe laser energy = 0.1 mJ, probe laser wavelength = 1064 nm,) (Reproduced from Ref. [35] with permission from the Royal Society of Chemistry).


Table 1.
Summary of the advantages and shortcomings of the various techniques applied in the different stages of the PLAL process.
Table 1.
Summary of the advantages and shortcomings of the various techniques applied in the different stages of the PLAL process.
| LASER-INDUCED PLASMA | ||
|---|---|---|
| Technique | Advantages | Shortcomings |
| OES | Determination of plasma parameters (T, Ne) with relatively high accuracy | No spatial resolution, no information on plasma composition |
| Imaging | Investigation of plasma expansion features and shockwave velocity | Not possible to determine plasma parameters (T, Ne) |
| Spectrally resolved imaging | Maps of plasma parameters | Low accuracy from the quantitative point of view |
| CAVITATION BUBBLE | ||
| Technique | Advantages | Disadvantages |
| Shadowgraphy | Determination of bubble radius and in turn of cavitation temporal evolution | No linear relation with the density of the crossed medium |
| NANOPARTICLE VISUALIZATION | ||
| Technique | Advantages | Disadvantages |
| Laser scattering | Easy and cheap to set-up | Low sensitivity and selectivity |
| SAXS | Excellent selectivity and sensitivity | Need for synchrotron radiation. Limited spatial and temporal resolution |
| Double pulse | Good spatial resolution | Low selectivity |
Publisher’s Note: MDPI stays neutral with regard to jurisdictional claims in published maps and institutional affiliations. |
© 2021 by the authors. Licensee MDPI, Basel, Switzerland. This article is an open access article distributed under the terms and conditions of the Creative Commons Attribution (CC BY) license (https://creativecommons.org/licenses/by/4.0/).
Share and Cite
MDPI and ACS Style
Dell’Aglio, M.; De Giacomo, A. Optical Diagnostics during Pulsed Laser Ablation in Liquid (PLAL) for the Production of Metallic Nanoparticles. Appl. Sci. 2021, 11, 10344. https://doi.org/10.3390/app112110344
AMA Style
Dell’Aglio M, De Giacomo A. Optical Diagnostics during Pulsed Laser Ablation in Liquid (PLAL) for the Production of Metallic Nanoparticles. Applied Sciences. 2021; 11(21):10344. https://doi.org/10.3390/app112110344
Chicago/Turabian StyleDell’Aglio, Marcella, and Alessandro De Giacomo. 2021. "Optical Diagnostics during Pulsed Laser Ablation in Liquid (PLAL) for the Production of Metallic Nanoparticles" Applied Sciences 11, no. 21: 10344. https://doi.org/10.3390/app112110344
Note that from the first issue of 2016, this journal uses article numbers instead of page numbers. See further details here.