
Visual Attention Software: A New Tool for Understanding the “Subliminal” Experience of the Built Environment


1
Eurac Research, Institute for Biomedicine, Affiliated Institute of the University of Lübeck, Via Galvani 31, 39100 Bolzano, Italy
2
Department of Mathematics and Architecture, The University of Texas, San Antonio, TX 78249, USA
3
The Human Architecture & Planning Institute, Inc., 43 Bradford St., Concord, MA 01742, USA
*
Author to whom correspondence should be addressed.
Appl. Sci. 2021, 11(13), 6197; https://doi.org/10.3390/app11136197
Submission received: 30 May 2021
/
Revised: 28 June 2021
/
Accepted: 2 July 2021
/
Published: 4 July 2021
(This article belongs to the Special Issue Advanced Machine Learning Algorithms for Biometrics and Its Applications)
Abstract
:Eye-tracking technology is a biometric tool that has found many commercial and research applications. The recent advent of affordable wearable sensors has considerably expanded the range of these possibilities to fields such as computer gaming, education, entertainment, health, neuromarketing, psychology, etc. The Visual Attention Software by 3M (3M-VAS) is an artificial intelligence application that was formulated using experimental data from eye-tracking. It can be used to predict viewer reactions to images, generating fixation point probability maps and fixation point sequence estimations, thus revealing pre-attentive processing of visual stimuli with a very high degree of accuracy. We have used 3M-VAS software in an innovative implementation to analyze images of different buildings, either in their original state or photographically manipulated, as well as various geometric patterns. The software not only reveals non-obvious fixation points, but also overall relative design coherence, a key element of Christopher Alexander’s theory of geometrical order. A more evenly distributed field of attention seen in some structures contrasts with other buildings being ignored, those showing instead unconnected points of splintered attention. Our findings are non-intuitive and surprising. We link these results to both Alexander’s theory and Neuroscience, identify potential pitfalls in the software’s use, and also suggest ways to avoid them.
1. Introduction
Visual Attention Software by 3M Company (3M-VAS) is an artificial intelligence application that was formulated using a large quantity of eye-tracking experimental data, and it can be used to predict initial viewer reactions to images. Scans generate fixation-point probability maps and fixation-point sequence estimations, and thus reveal pre-attentive, or “unconscious” processing of visual stimuli with a very high degree of accuracy [1]. The software’s originally conceived applications were related to product design, advertisements, signage, unconscious user attraction, etc. We envision that this could soon become a very popular tool to evaluate and improve the design of the built environment.
Here, we expand on the findings of a recent pilot study using 3M-VAS by two of the authors [2], by analyzing many images of different buildings, either in their original state or photographically manipulated, as well as geometric patterns and sketches. We find that the software reveals significant differences between buildings that are compared side-to-side using scans: their façade immediately fixated upon, with the eye drawn by overall design coherence, versus others that are avoided, with the eye drawn beyond the façade’s edges.
The visual mechanisms apparently at play here are fundamentally related to the mathematical coherence (organized complexity) of the design. This quality is a key element of Christopher Alexander’s theory of geometrical order, in structures that possess it [3]. We present and discuss these findings, giving sufficient background for readers who are not familiar with Alexander’s work. We also identify potential pitfalls in the use of the software and ways to avoid them. Our goal is to help establish unconscious viewer engagement as a new paradigm for adaptive design. This can be achieved in practice using direct eye-tracking sensors, virtual reality eye-tracking, or any of several eye-tracking software simulations available on the market. Those developments come from commercial design, not from architecture. Here, we used 3M-VAS and would like to optimize its usefulness for architectural design applications, and to encourage its universal adoption as a practical tool to promote healthful, human-centric design.
The ability to predict a user’s engagement with a building’s design (as experienced first of all in its façade) is a key factor to its everyday use. We can predict attachment based on unconscious eye fixations. Although this technique does not detect anything that has to do with emotion directly, adding preference testing such as facial expression analysis and other similar metrics combined with visual attention can indicate if attachment was negative or positive. The detection framework of eye-tracking or visual attention software estimates the immediate, “at-first-glance,” real-world impact of architectural design, something that has to date eluded architectural analysis. As the world becomes more concerned with sustainability of the built environment, the ability of software to anticipate human behavior becomes increasingly important for the building and design industries.
Eye-tracking also reveals the mathematical property of nested symmetries (or relative coherence, explained below) in an effortless manner. This quality is a key element of Alexander’s theory, and although visual attention can certainly be analyzed without reference to it, linking the results coming from actual eye tracking or simulation software to a deeper theoretical rubric strengthens the analysis. In moving towards a greater degree of “life” (as defined by Alexander in reference [3]), a design or structure acquires increasing coherence. Simple eye-tracking simulation experiments using 3M-VAS software reveal that a region focuses a viewer’s attention in a more unified—more evenly distributed manner. Unconnected attention-seeking “hotspots” tend to disappear as the geometrical coherence increases.
This experimental result supports a recent understanding of fractally based human cognition (ordered geometrical structure on a hierarchy of scales) [4,5,6,7,8]. Evolution has prepared us to input information on distinct linked scales, as for example in the nested symmetries of a fern leaf. The 3M-VAS software shows the desired result of coherence as a uniform “blue glow”: every square millimeter of a visual draws attention. This response is characteristic of most natural forms, and certainly of living forms; yet the emotional experience that follows it could either be positive or negative and fearful (for example, seeing a Lion’s face). In both cases, the presence of coherence promotes easy computation. Whether the result of this computation will be a fear response, or subsequent attraction, depends on the specific stimulus.
It would appear that this coherent state of unconscious human interest satisfies a deep neurological need. However, an almost evenly distributed visual interest should not be confused with a uniform but empty design, where no point draws the eye’s attention, and the scan instead deflects to the corners or periphery of the image. These two distinct situations represent two opposite states of the subliminal reality of a viewer’s engagement: empty and dead (showing a sizable hole in the 3M-VAS scan, which the gaze avoids), versus intense and full interest (showing an extended and uniform coverage, with no holes and few if any red hot-spots in the 3M-VAS scan).
The apparent uniformization of unconscious visual interest in an intensely coherent structure is remarkable, because the designs exhibiting this property are anything other than uniform. Organic designs are highly complex, full of contrast and details. What Alexander labels as the “field of centers” is the result of a high degree of organized complexity. A visual’s overall coherence leads to intense yet uniform visual interest. This result is both important and unexpected. It is also a new discovery. Furthermore, this understanding establishes the link that now permits us to use visual attention software to test for coherence in a design.
Starting today, designers have at their disposal a technique of unprecedented power to design environments good for human health. Through advanced machine learning and vision science, we have finally realized Alexander’s dream of connecting the material world to the subliminal world, and thus to be able to consciously shape the latter. This paper works with essentially two complementary ideas that reinforce each other. Our experiments and interpretation could be read as a practical guide on using 3M-VAS software to analyze architectural and urban environments. We show how knowledge of the neuroscience of our visual perception system can be used to reveal some of the ways that architecture affects the user. This extremely powerful tool reveals how people have an innate form bias that directs us subliminally, and which we cannot control. Actual eye tracking and simulation software distill the neuroscience that today’s architects and planners do not yet know.
The other component of this paper describes how Christopher Alexander predicted how the brain responds to buildings and design 40 years ago, but no one at that time cared to listen. While this part of the discussion could have been left to a separate paper, we are convinced of the importance of anchoring the present revolutionary method of design diagnosis on a deeper theoretical ground. The software is sensitive to the same parameters that our visual system is sensitive to, when performing pre-attentive processing. Yet we would not want readers to imagine an invented explanation of what a piece of software developed through machine learning is doing, and whose scientific basis they do not need to comprehend. As with all such powerful tools, it is important to attach an explanatory basis to the tool itself, to prevent it from being misunderstood and misused, and here we have sought to do this from two different perspectives.
2. Using the 3M-VAS Software
A brief explanation of how to use the 3M-VAS software is included here for interested readers. The software is accessed through the 3M-VAS webpage [1]. One uploads an image, then selects one of nine modalities of analysis, among, for example, “Packaging”, “Signage”, “Webpage”, etc. We chose to use the category “Other” as the most general and unbiased mode for analyzing our images. Scan analysis is performed fully automatically in a few seconds, then the results can be downloaded. There are no parameters to adjust. The complete report shows the Heatmap, Hotspots, Gaze Sequence, and Visual Elements (see Figure 1 below). Section 7 of this paper lists tips for optimizing the images before scanning so as to avoid unwanted artifacts.
The authors are convinced that no human bias is involved in the visual attention scans. VAS is based on more than thirty years of research by 3M vision scientists. The artificial intelligence (AI) component of this analysis was built in by 3M corporation when creating the software, and is not observable in use. The software was trained using a very large number of actual eye-scan recordings, and 3M corporation claims a high degree of correlation between real eye-tracking studies and the in silico simulation. One of us has previously carried out direct eye-tracking experiments and found strong consistency of the present results with those obtained with optical eye-tracking [9,10,11]; we therefore feel very confident in using the 3M-VAS software as a valid tool for this type of work. (We point to possible artifacts that could arise from “casual” use, and describe conditions that have to be optimized for the predictive software to perform in an optimal manner. We do not claim that AI-based simulation completely replaces eye-tracking, but do claim that, used correctly, it can provide valuable information about our pre-attentive gaze and the factors that influence it).
Direct eye-tracking sensors and eye-tracking simulation software are independent and extremely valuable tools for analyzing the unconscious human response to visual images. This paper focuses exclusively on the software method for the simple reason that architects and designers will find it much more convenient to use. 3M-VAS is already incorporated as a plugin for computer design programs (e.g., in Adobe Photoshop software). Not every research group has access to eye-tracking apparatus, even though this is now an easy option with many lightweight and practical sensors available for use [12].
A second reason for confidence in the 3M-VAS software lies with its stated theoretical basis, which coincides with a co-author’s previous model of design complexity [13,14]. The 3M Company bases its algorithm on four visual elements verified by experiments in cognitive psychology and neuroscience. Human visual attention depends to a large extent upon elements that trigger unconscious viewing: edges—density of differentiations, or greyscale contrast; intensity of color hue; contrast among color hues—red/green and yellow/blue; similarity to a face—bilateral symmetry with fixation points roughly corresponding to eyes, nose, and mouth. The fourth element, abstract facial similarity, has been investigated at length by another co-author [15]. The face factor is a complex quality that incorporates more basic geometrical measures such as specific nested bilateral symmetries about a vertical axis. Abstract facial similarity can be codified using components of mathematical symmetry in what is defined elsewhere as the Biophilic Healing Index [8,16,17,18].
Competing eye-tracking simulation software now available for commercial use includes EyeQuant [19] and Expoze [20], two artificial intelligence eye-tracking companies. Very much like 3M-VAS, these programs predict how users will perceive a design in the first three to five seconds of unconscious viewing. An artificial intelligence approach generates eye-tracking data and heatmaps for different images and visual stimuli. We have used neither EyeQuant nor Expoze hence can make no comparisons between them and 3M-VAS. As scientists on a research mission, we welcome the availability of similar but distinct tools that different groups may use in their analysis. It is not the aim of this paper to dig into how these tools work, but to apply one of them in obtaining results that are of major interest to architects and urban designers.
At the same time, there are parallel laboratory-based research investigations into how humans perceive and interpret architecture. Some of those use virtual reality and body sensors [21,22,23]. Those studies go beyond the present limitation of purely visual engagement, since they incorporate emotional responses such as skin conductance, brain activity, and heart rate. We believe that those results are very important in interpreting the health aspects of the environment, by adding crucial physiological, emotional, and cognitive responses. One difference between those studies and ours is that we focus here on the exterior experience rather than on interior settings. Both research directions (plus other closely related efforts) are important and mutually supportive.
3. Neurological Background
Natural surroundings have been shown to exert positive effects on human health and well-being on many levels, including a reduction in stress, sometimes by the simple viewing of images [24]. These effects are to be attributed to features of their geometry, and such features are not only found in nature, but also in artificial environments, especially in pre-modern architecture of different countries, cultures, and styles. Exposure to this type of visual organization (organized complexity) may have the same positive effects, regardless of whether it is found in natural or artificial structures [6,7,8,14,15,16,17,18].
Pioneering eye-tracking work [9,10,11] has investigated pre-attentive focusing of attention in volunteers’ gazes when first confronted with different types of images, resulting in a number of interesting findings. Eye-tracking analyses immediately reveal that attention is consistently drawn to the presence of people, and to the human face in particular, with every human presence in an image of, say, a building or street scene detected fast. Another discovery is that our gaze is drawn by details, contrasts, and structures that make overall geometrical sense.
These findings have important consequences for how we experience architecture. Contemporary buildings, especially when they have plain glass facades, are explored in passing, with no clear fixation points on the building itself. This avoidance pattern contrasts with that seen in pre-modern buildings, which seem to attract attention in their entirety and also in a manner that facilitates understanding the relationship between the design’s details with the whole building. For example, viewers facing more traditional buildings can swiftly spot an entrance. Pre-attentive processing seems to attract people to focus attention on some structures, whereas it drives them away from others, or at least it makes people ignore them.
The remainder of this section reviews the neurological basis for eye-tracking, and why it is crucial for determining unconscious human actions. (Readers may skip this discussion and go directly to the 3M-VAS scans). Information transmission through the human optic nerve takes place at a very high rate, estimated as between 107 and 108 bits per second [25]. Processing all of this information fast enough to ensure timely responses that can be crucial for survival would be an impossible task without some form of selection. Indeed, our visual system has developed ways to select relevant or salient information so as to determine appropriate and adequate action and control its execution. As early as the level when an image reaches the retina (which is, embryologically and functionally, part of the central nervous system), computation οf low-level visual features is initiated, and it continues in the lateral geniculate nucleus (LGN) of the thalamus and the early visual cortical areas.
The retina itself is more than just a photoreceptor array: horizontal interconnectivity between retinal cells allows for that first level of processing, which is reflected in the relay station of the LGN, while further steps of spatial processing are taking place in the early visual cortical areas. About 10% of the retinal output takes another pathway, leading to the phylogenetically more primitive system of the superior colliculus and the pulvinar nucleus of the thalamus, responsible for early responses to motion in the peripheral visual field [26], as well as fear responses by direct input from the pulvinar to the amygdala, for example when sighting predators [27].
Neurons at these early levels of perception are tuned to respond to simple visual properties such as intensity contrast, color opponency, and, in the visual cortex, also orientation, direction, and velocity of motion, etc., (for a review see [25]). These visual features are computed pre-attentively in a parallel manner, creating an early “saliency map” [28]. These are not just feedforward processes, but are also influenced by feedback in the most advanced stages. We are describing the instinctive, unconscious mechanisms that drive immediate human responses.
As survival is so dependent on fast and appropriate response to environmental stimuli, it is to be expected that a failure of this early registration mechanism would lead to an apprehension of potential danger and stress. In general terms, environments that depart visually from our “safe” reference imprinted through human evolution will trigger anxiety. Stress has indeed already been connected to visual surroundings that are deprived of a certain level of organized complexity [29] through the mechanism of sensory input deprivation [30].
The above discussion is preparatory to presenting results on how visuals affect us. Before analyzing images in the following sections, we describe the software that we chose to use and the procedure we followed (including certain selections that have to be made). The software is easy and straightforward to use; nevertheless, after processing many images, we discovered some tricks that helped us to get a more accurate reading on the points of architectural interest. We have included those findings as tips for other researchers who might wish to try this method of analysis.
4. Materials and Methods
Twenty-nine photographic images (photographs by A.A. Lavdas, processing performed using Adobe Photoshop software), six geometrical patterns, and four pattern drawings and one Lion drawing (sketches by N.A. Salingaros) were processed using the 3M-VAS. In general, the software provides five different results of visualizations of each image as follows [1]:
- Areas of Interest. These can be specified by the user, and each of them has a numeric score which is the probability that a person will look somewhere within that area during the pre-attentive period. We did not use this feature.
- Heatmap. This is a color-coded probability map that a certain part of the image will attract the gaze during the pre-attentive period. We used this feature in all the scans, adopting it as the most direct and useful diagnostic tool for our analysis.
- Hotspots. A simplified version of the heatmap results shows only the areas that are most likely to be seen during the pre-attentive scan, with a numeric score indicating the probability that a person will look somewhere in that region during the pre-attentive period.
- Gaze Sequence. This indicates the four most likely gaze locations, in their most probable viewing order.
- Visual Features. This visualization gives an insight to how the algorithm works, by extracting those same features that drive pre-attentive processing in our visual system [25]; namely edges, intensity, red/green color contrast, blue/yellow color contrast, and faces. We used this feature only in the first scan, for demonstration purposes.
Buildings and patterns of interest of either the same or of different photographs were used for scanning. Some of the images were cropped parts of the same photograph. Image selection and comparison among the results aimed both to derive general practical results, and to learn how best to use the 3M-VAS software.
We scanned different building types. Following on from the recent pilot study by two of the present authors [2], here we went one step further to examine the contribution of more elements, in addition to window size, shape, and arrangement. We undertook a series of scanning experiments to robustly understand the interaction of image and subject, and how that depends upon various factors. These trials shed light on how to technically optimize the conditions for analysis, as follows.
- i.
- Framing: Adding a surrounding frame, when the building of interest occupies most of the photographic field.
- ii.
- Brightness/contrast/saturation: Adjusting these parameters, either overall or locally, influences the way that the software registers the examined structures.
- iii.
- Distance from the building: Examining whether approaching a structure reveals more details, resulting in sustained coherence, or if the coherence disintegrates.
In the building photographs, cropping was performed only to isolate specific features when needed; in all other cases there was no effort to exclude elements like people or cars, as we wanted to be able to experiment with real-life images. Since what is described here is a novel material, it was equally important to investigate how to avoid pitfalls, which is connected to but distinct from the above points. This is a significant challenge. Failure to optimize some of the image parameters may give scans that could lead to erroneous conclusions. We believe that our results, obtained after interpreting a large number of scans, help attribute scanning behavior to the presence of specific patterns.
5. Results
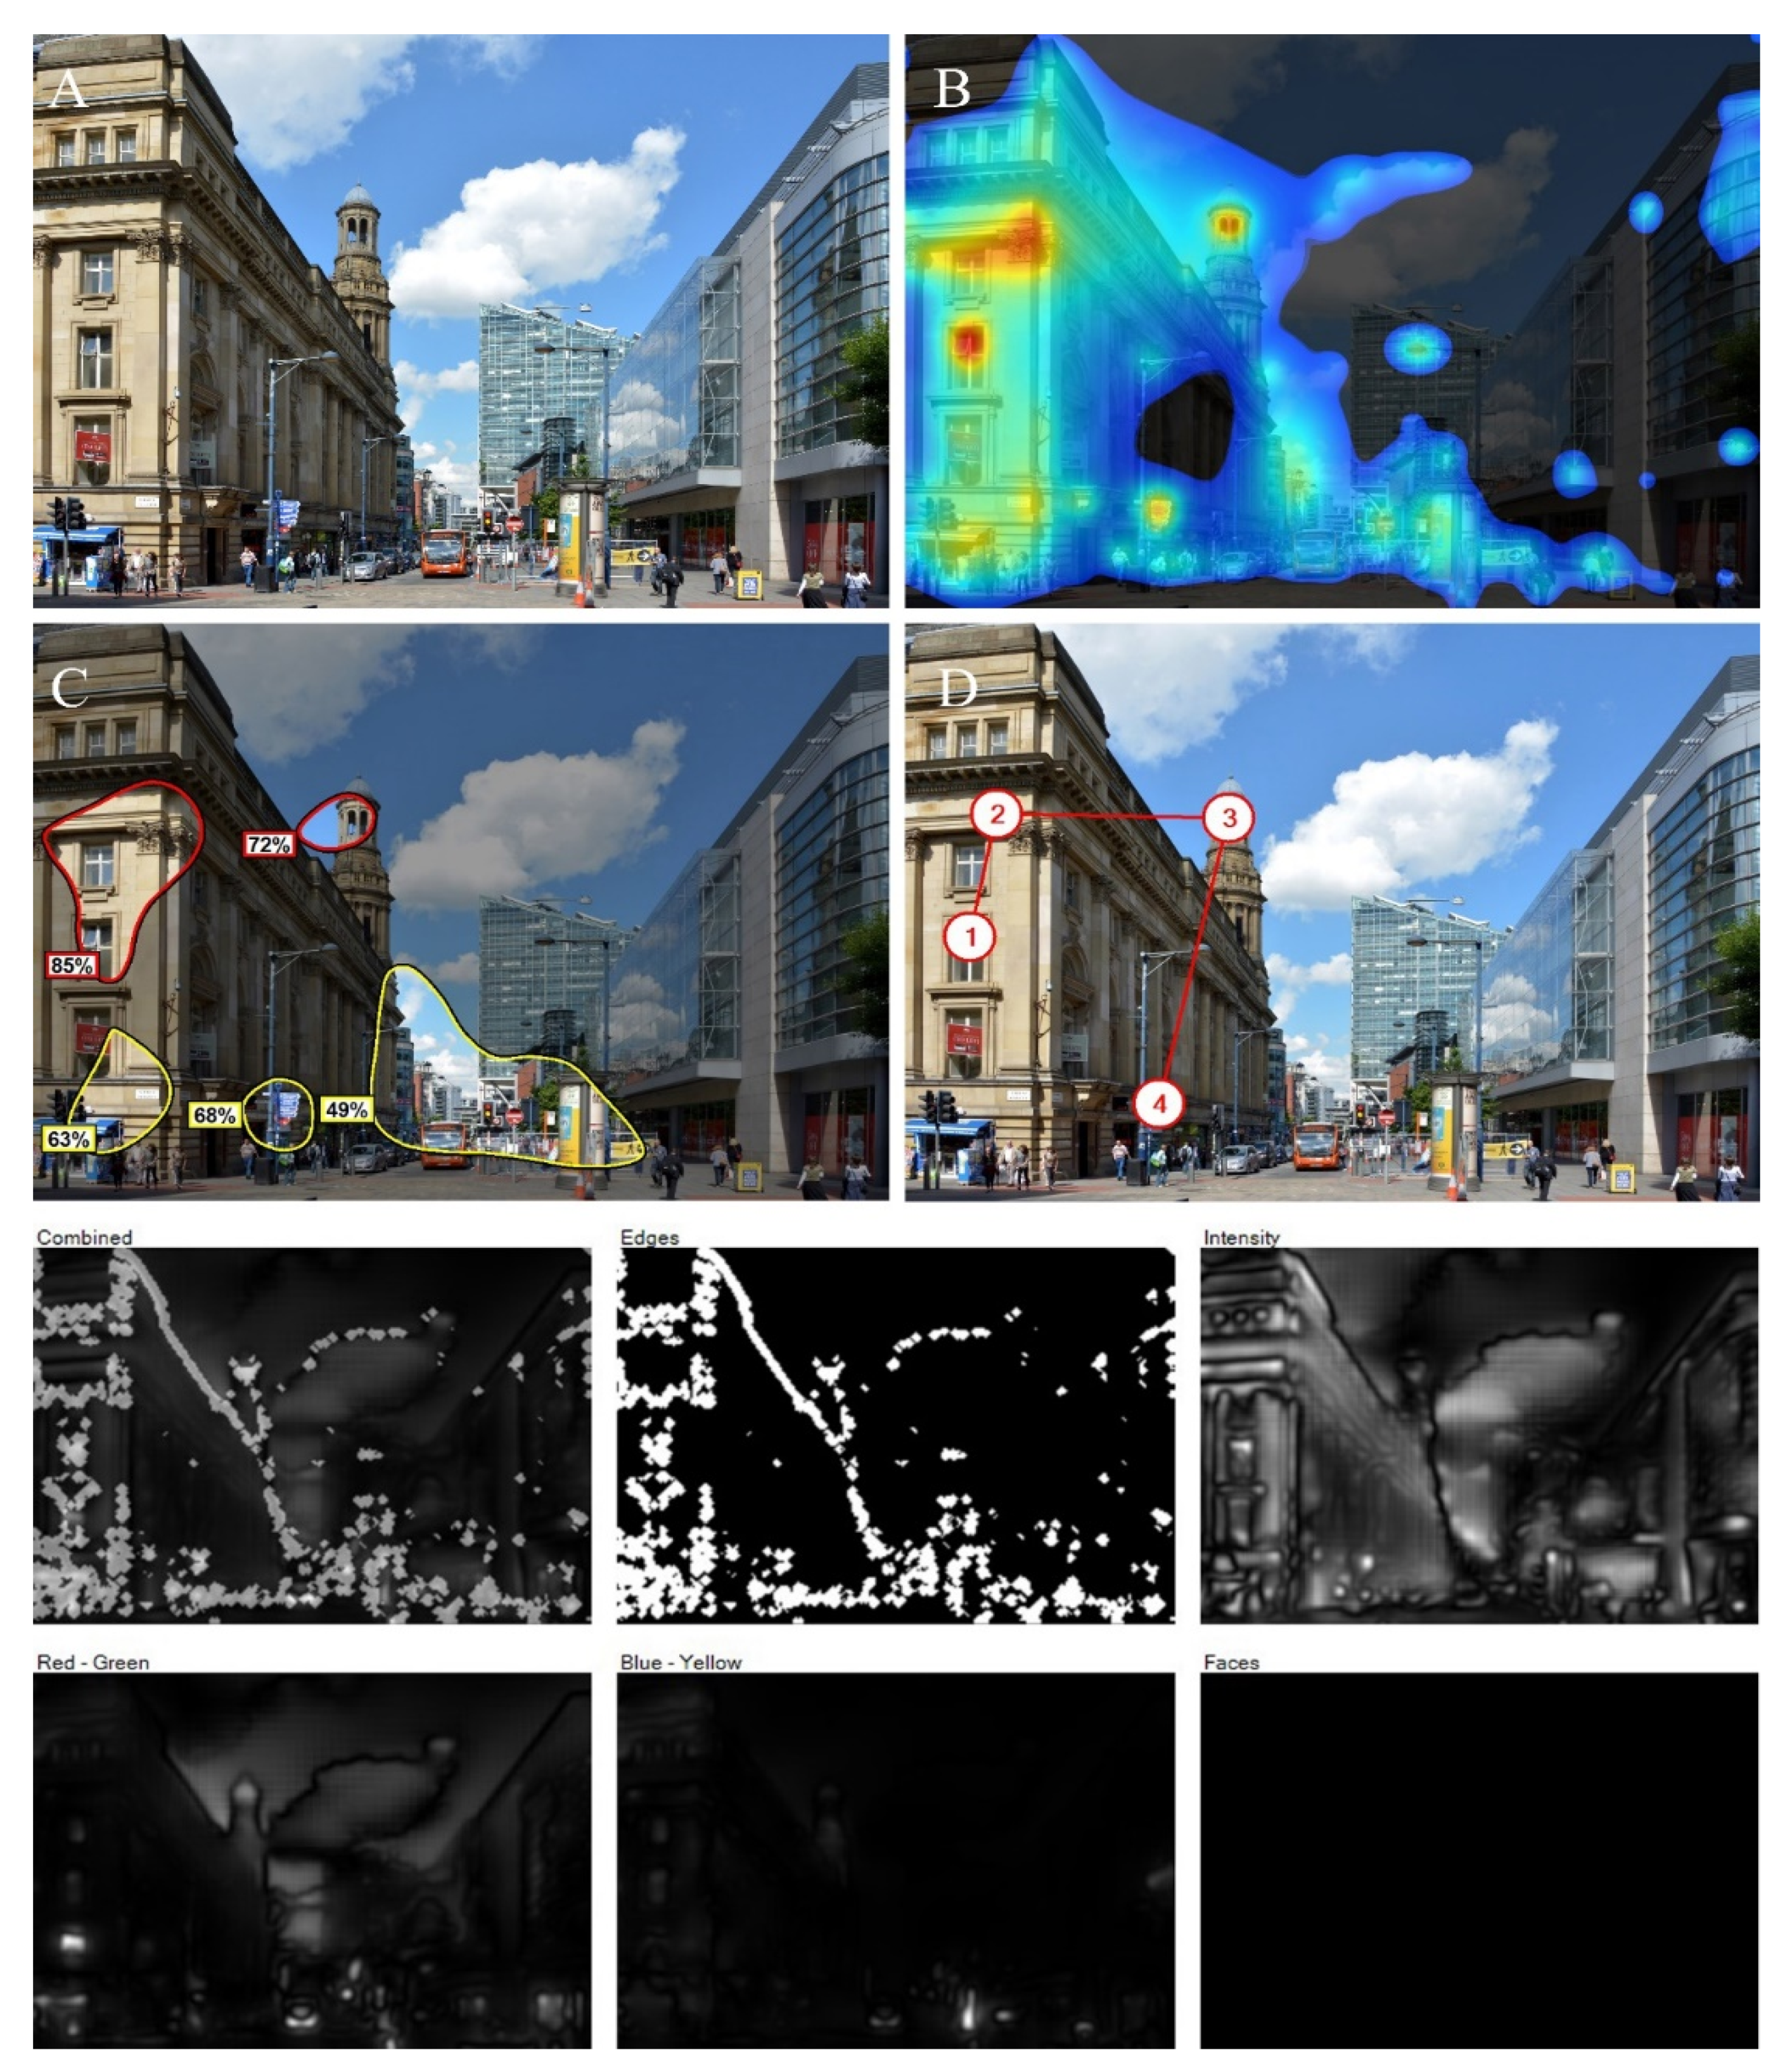
Figure 1, using a photograph from the center of Manchester, UK at the junction of Market and Cross Streets, shows the full analysis output of the 3M-VAS software. In subsequent scans not all data will be shown. Here, we see a typical situation in real street scenes: minimalist glass-façade buildings are more or less ignored, despite their dominant size. The neoclassical building of the Royal Exchange Theatre from the 1860s on the left is practically the sole focus of pre-attentive attraction, with main “hotspots” in areas of rich detail. There is also some attraction to the road level with people and cars, to the edge of a cloud and, to a much lesser degree, to some reflections and other areas of contrast in the modernist-style buildings. As analyzed by the software, the edges, which are represented by sharp intensity contrasts, are the most important parameters in this case. The shaded area of the building does not attract, hence it is not well represented in the heat map (this is an artifact of the software, which privileges better-illuminated portions of a visual).
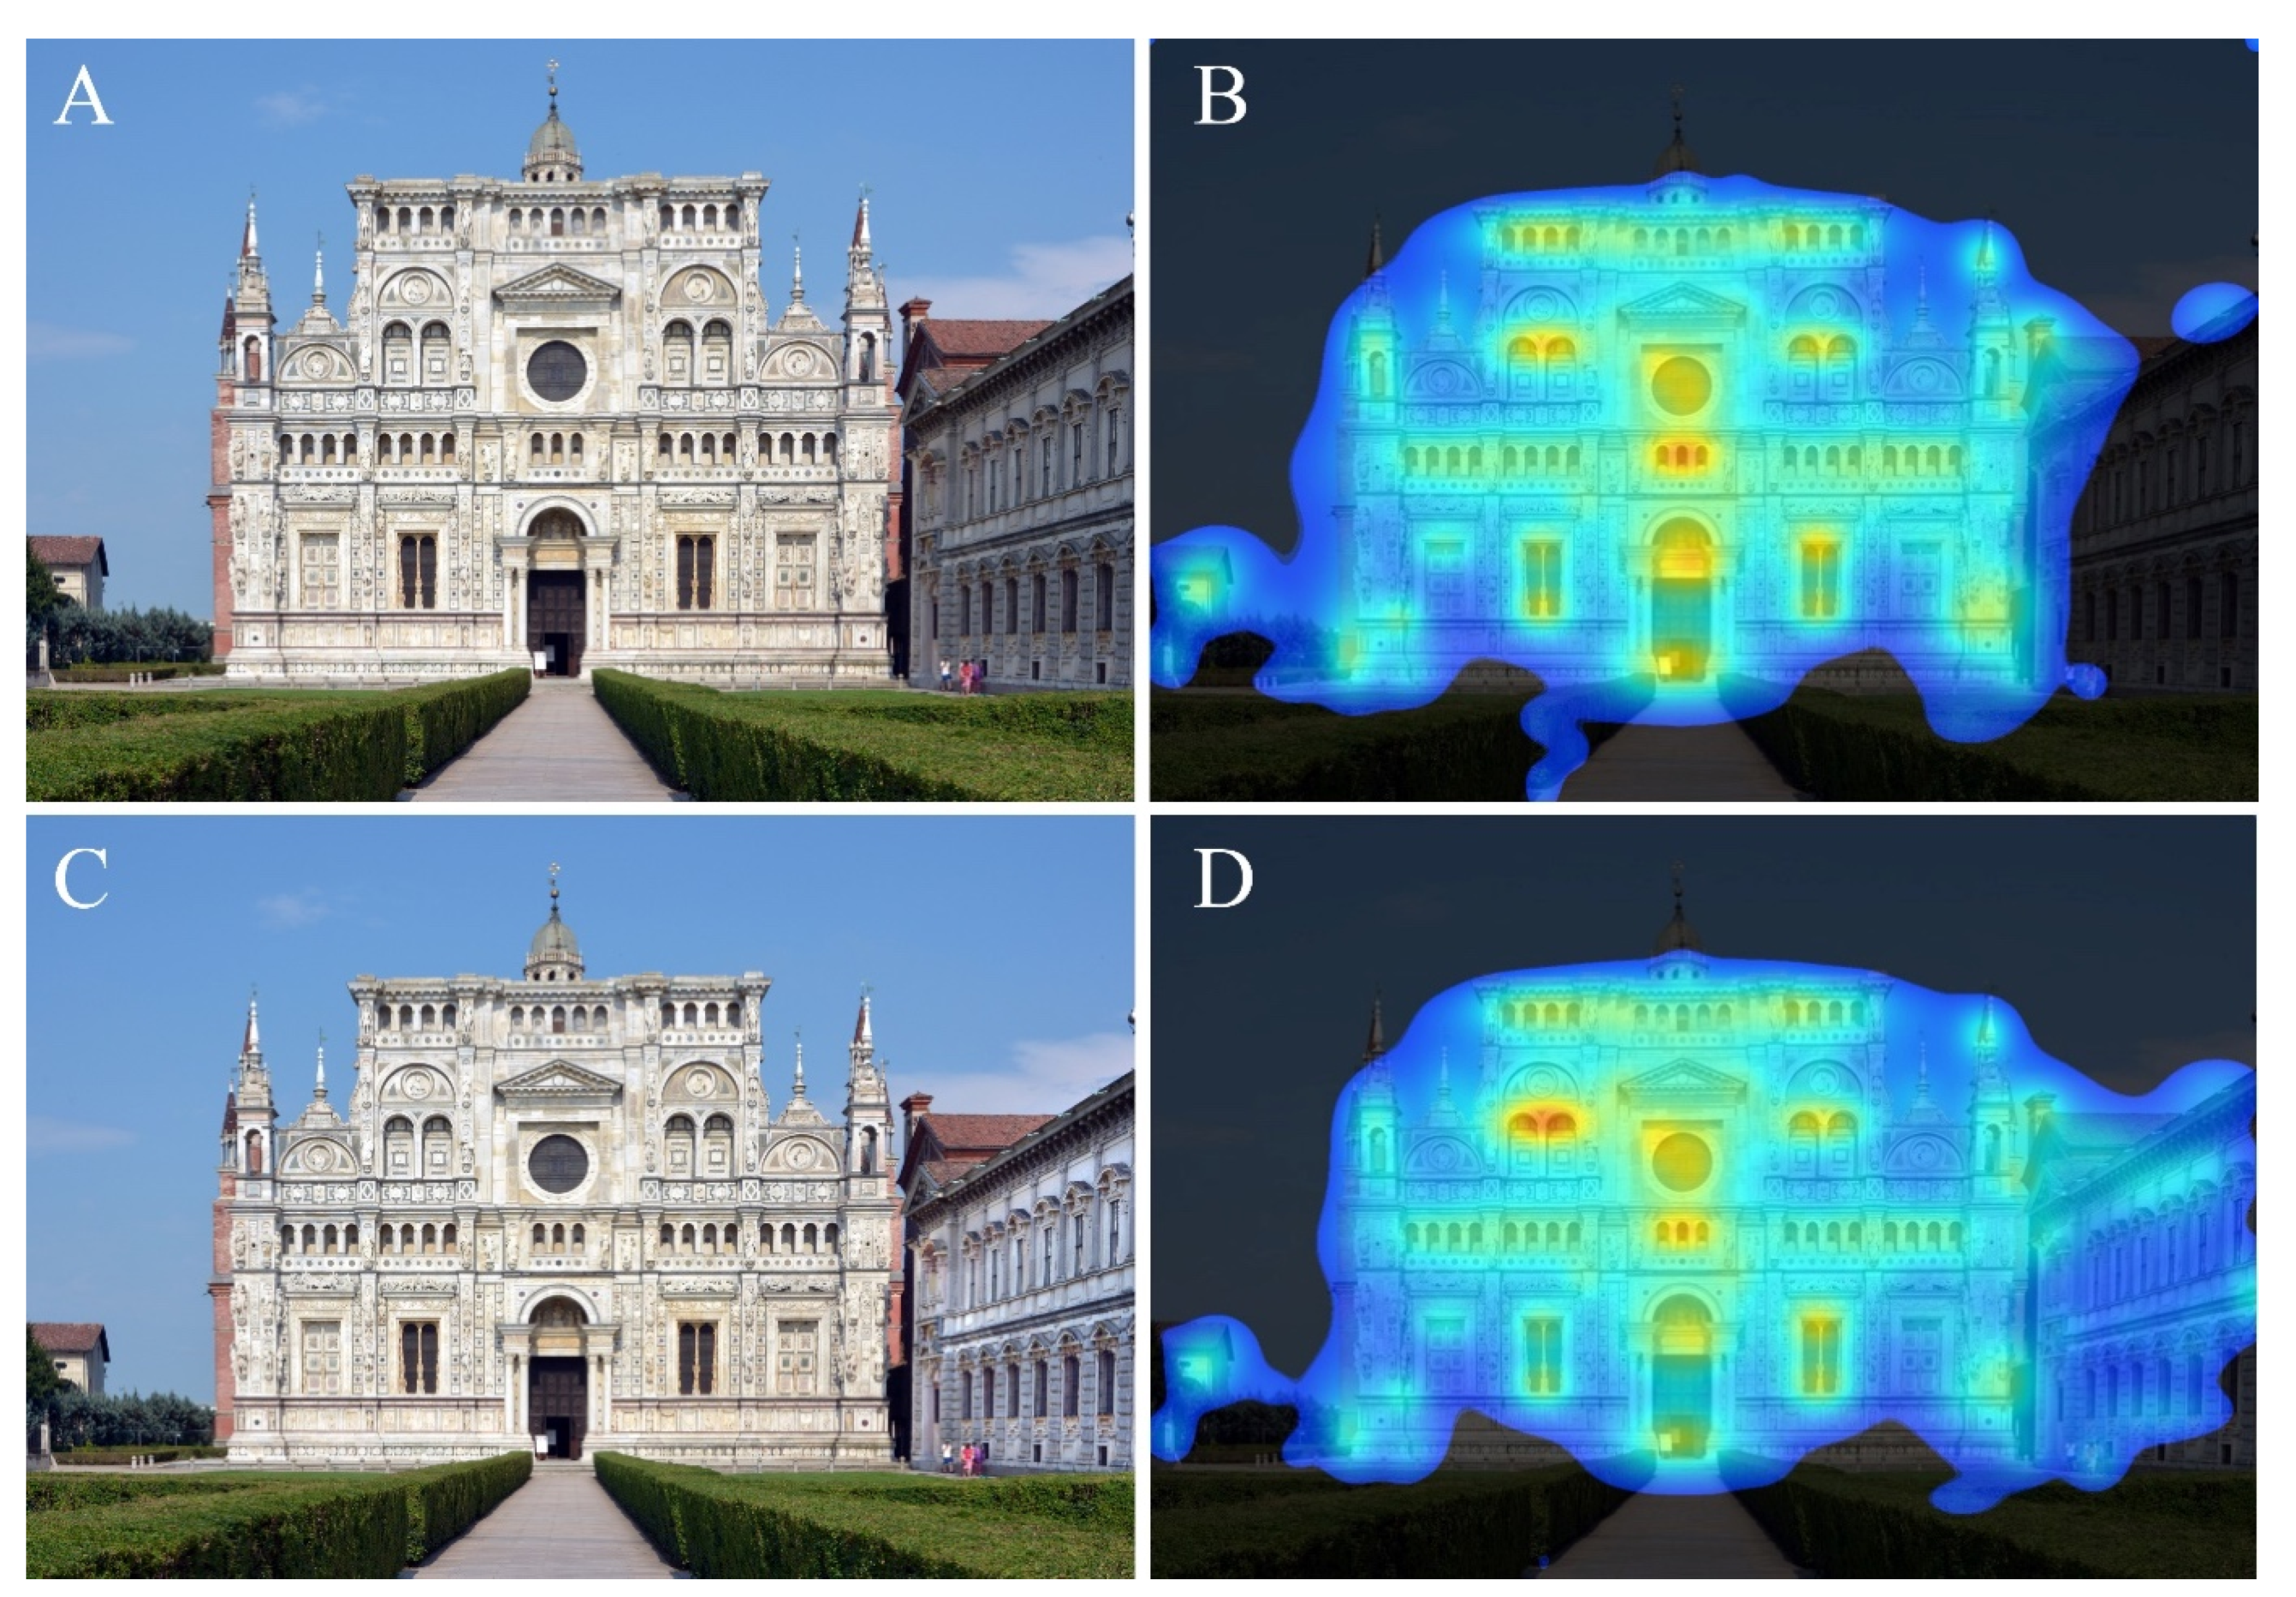
In Figure 2, we used a photograph of the Certosa di Pavia monastery church in Pavia, Italy. The entrance door and windows are logical hotspots, and the heatmap covers all of the building. In the first row (A/B) the software ignores the wing on the right because it is in shadow. But this limitation is easily circumvented. In the second row (C/D), artificially increasing the brightness and contrast of this part in shadow makes its details more visible to the software, and now the wing on the right is also part of the heatmap area. This example establishes one of the key results of these scanning experiments: a high degree of organized complexity achieved through nested symmetries engages the viewer. Our subsequent studies reveal that departures from this mathematical state by losing organization, or complexity, or both, lose the viewer’s unconscious interest.
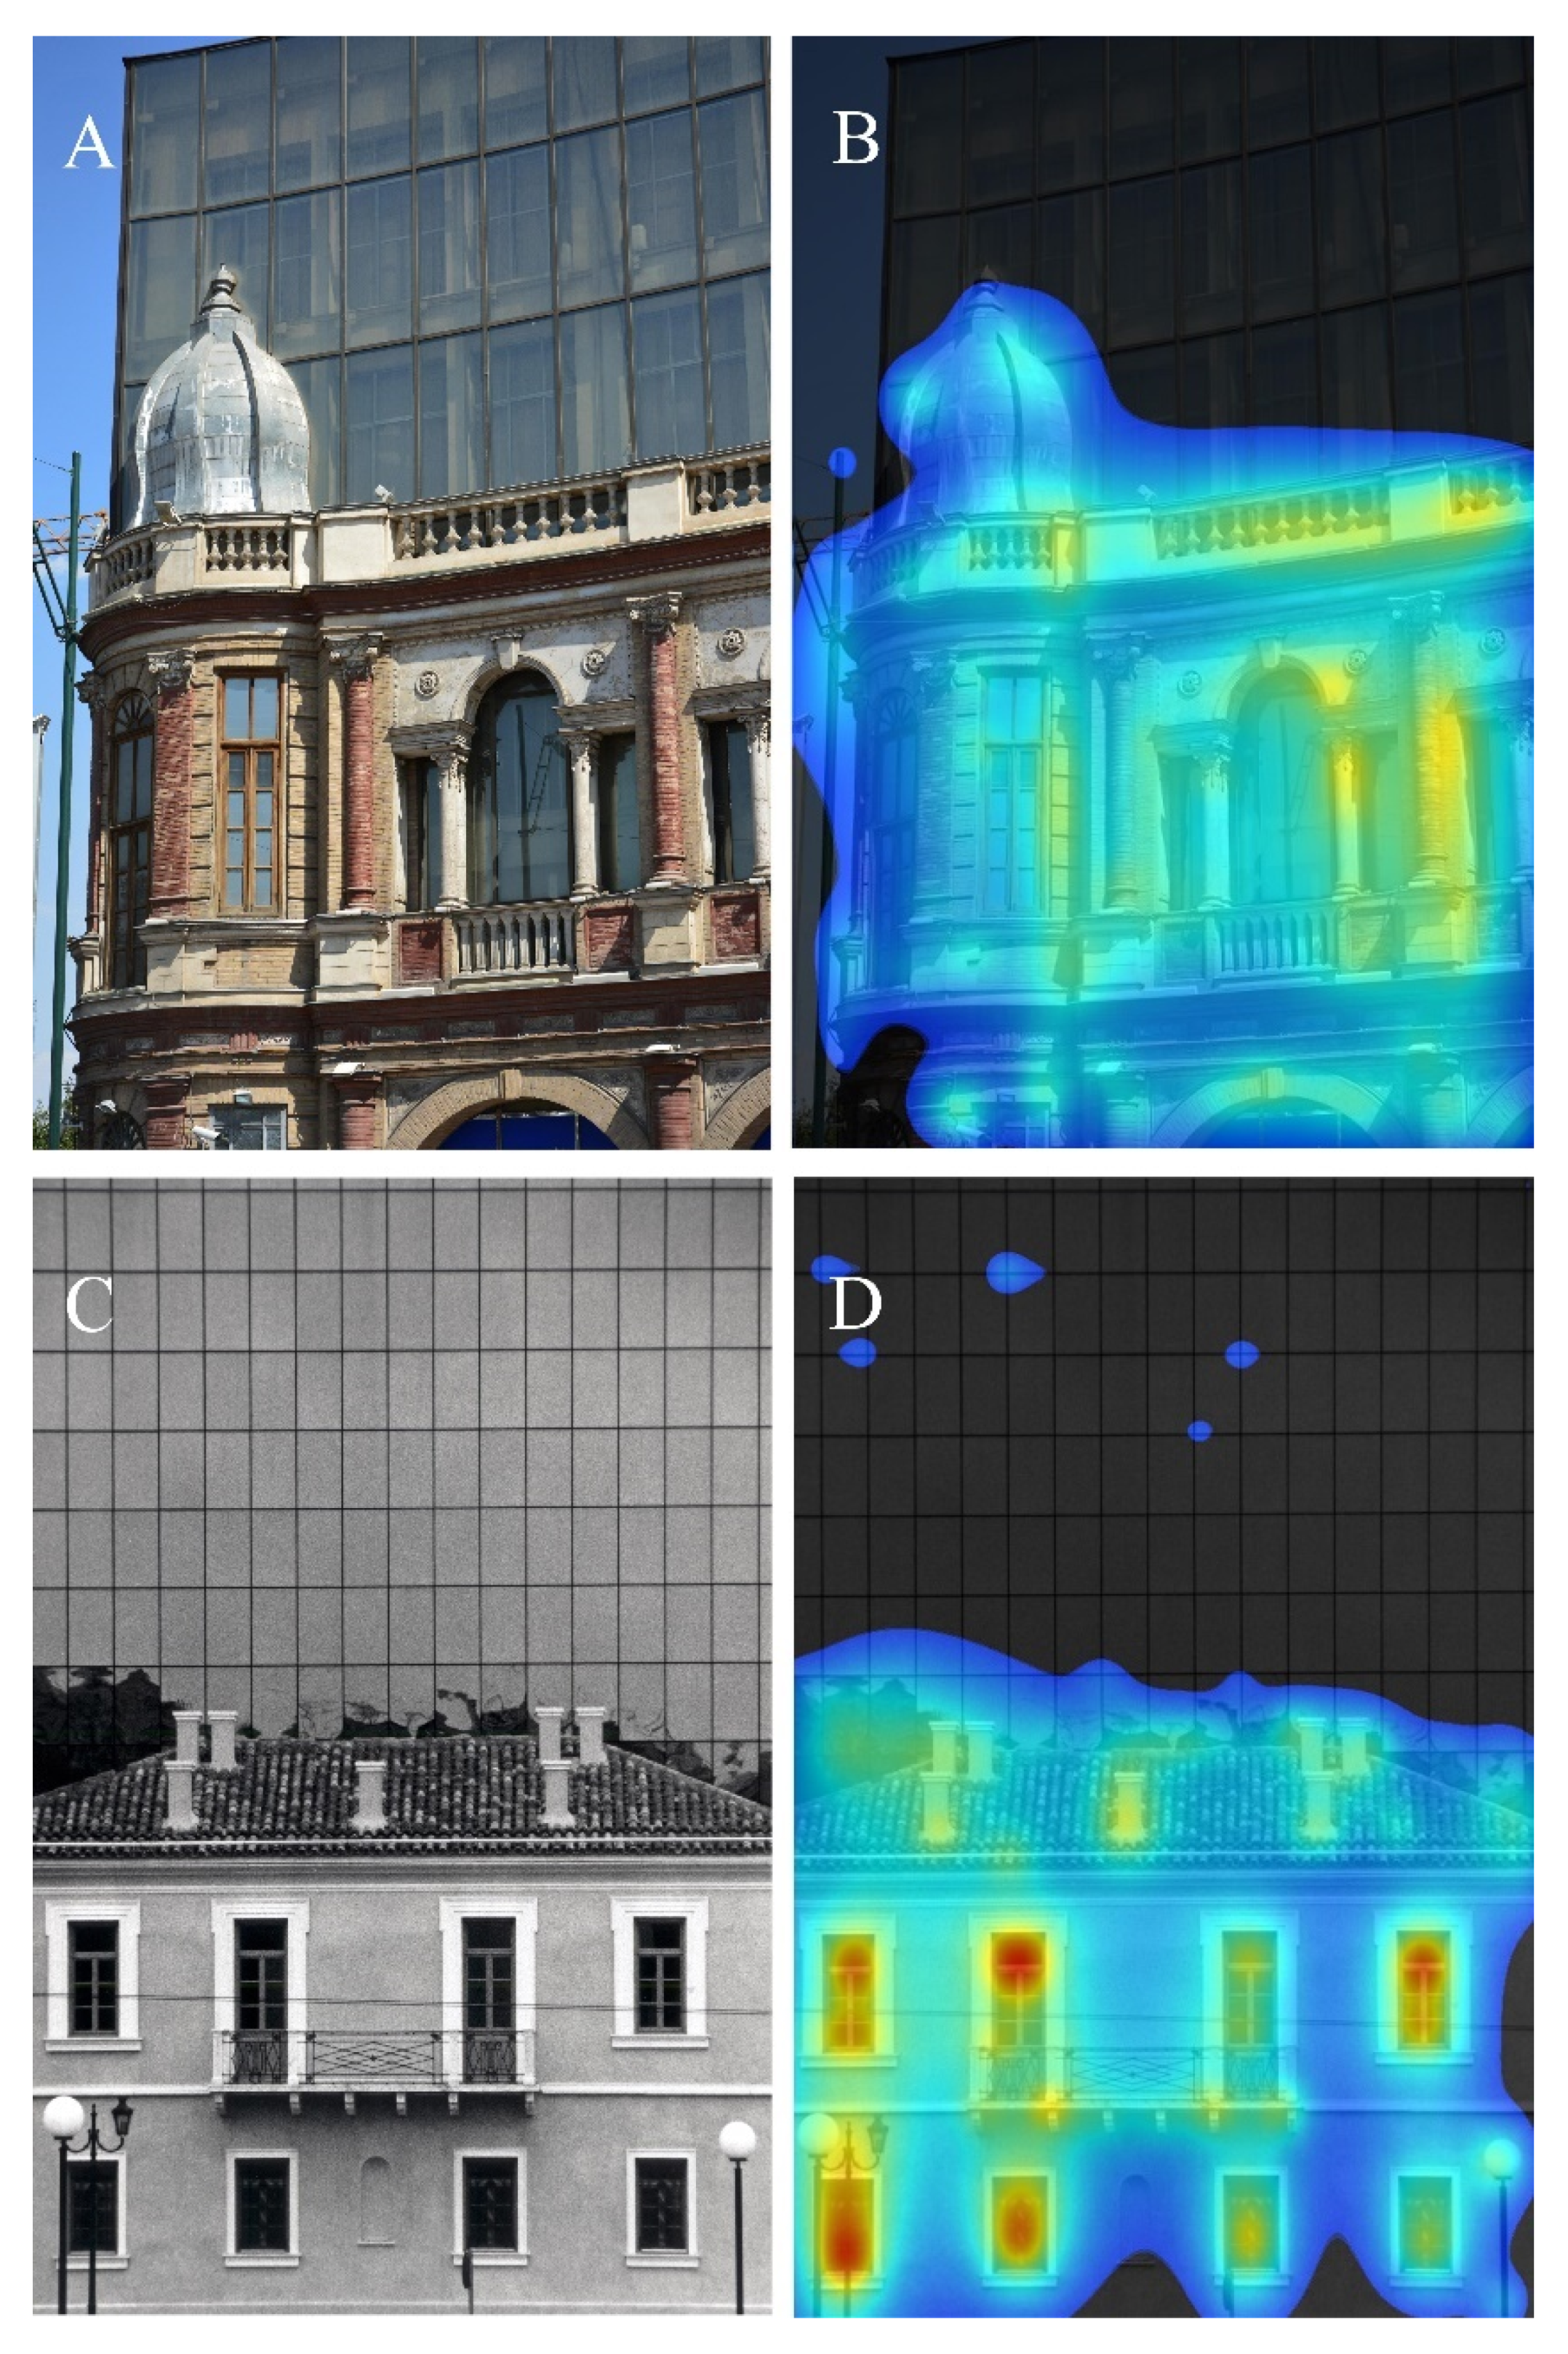
Figure 3 analyzes a color photograph of a 1920s building with a glass façade building directly behind it in Hasanabad square, Tehran, Iran (A/B); and a black and white photograph of an 1830s building with a glass façade directly behind it in Panepistimiou Street in Athens, Greece (C/D). The old buildings are of different styles, and the two photos also differ in that one is in color and the other one in black and white. However, the comparative results are identical, with the glass façade behind completely ignored in each case, while the heatmap distributes practically over the whole pre-modern building, with hotspots at windows or other appropriate structural details.
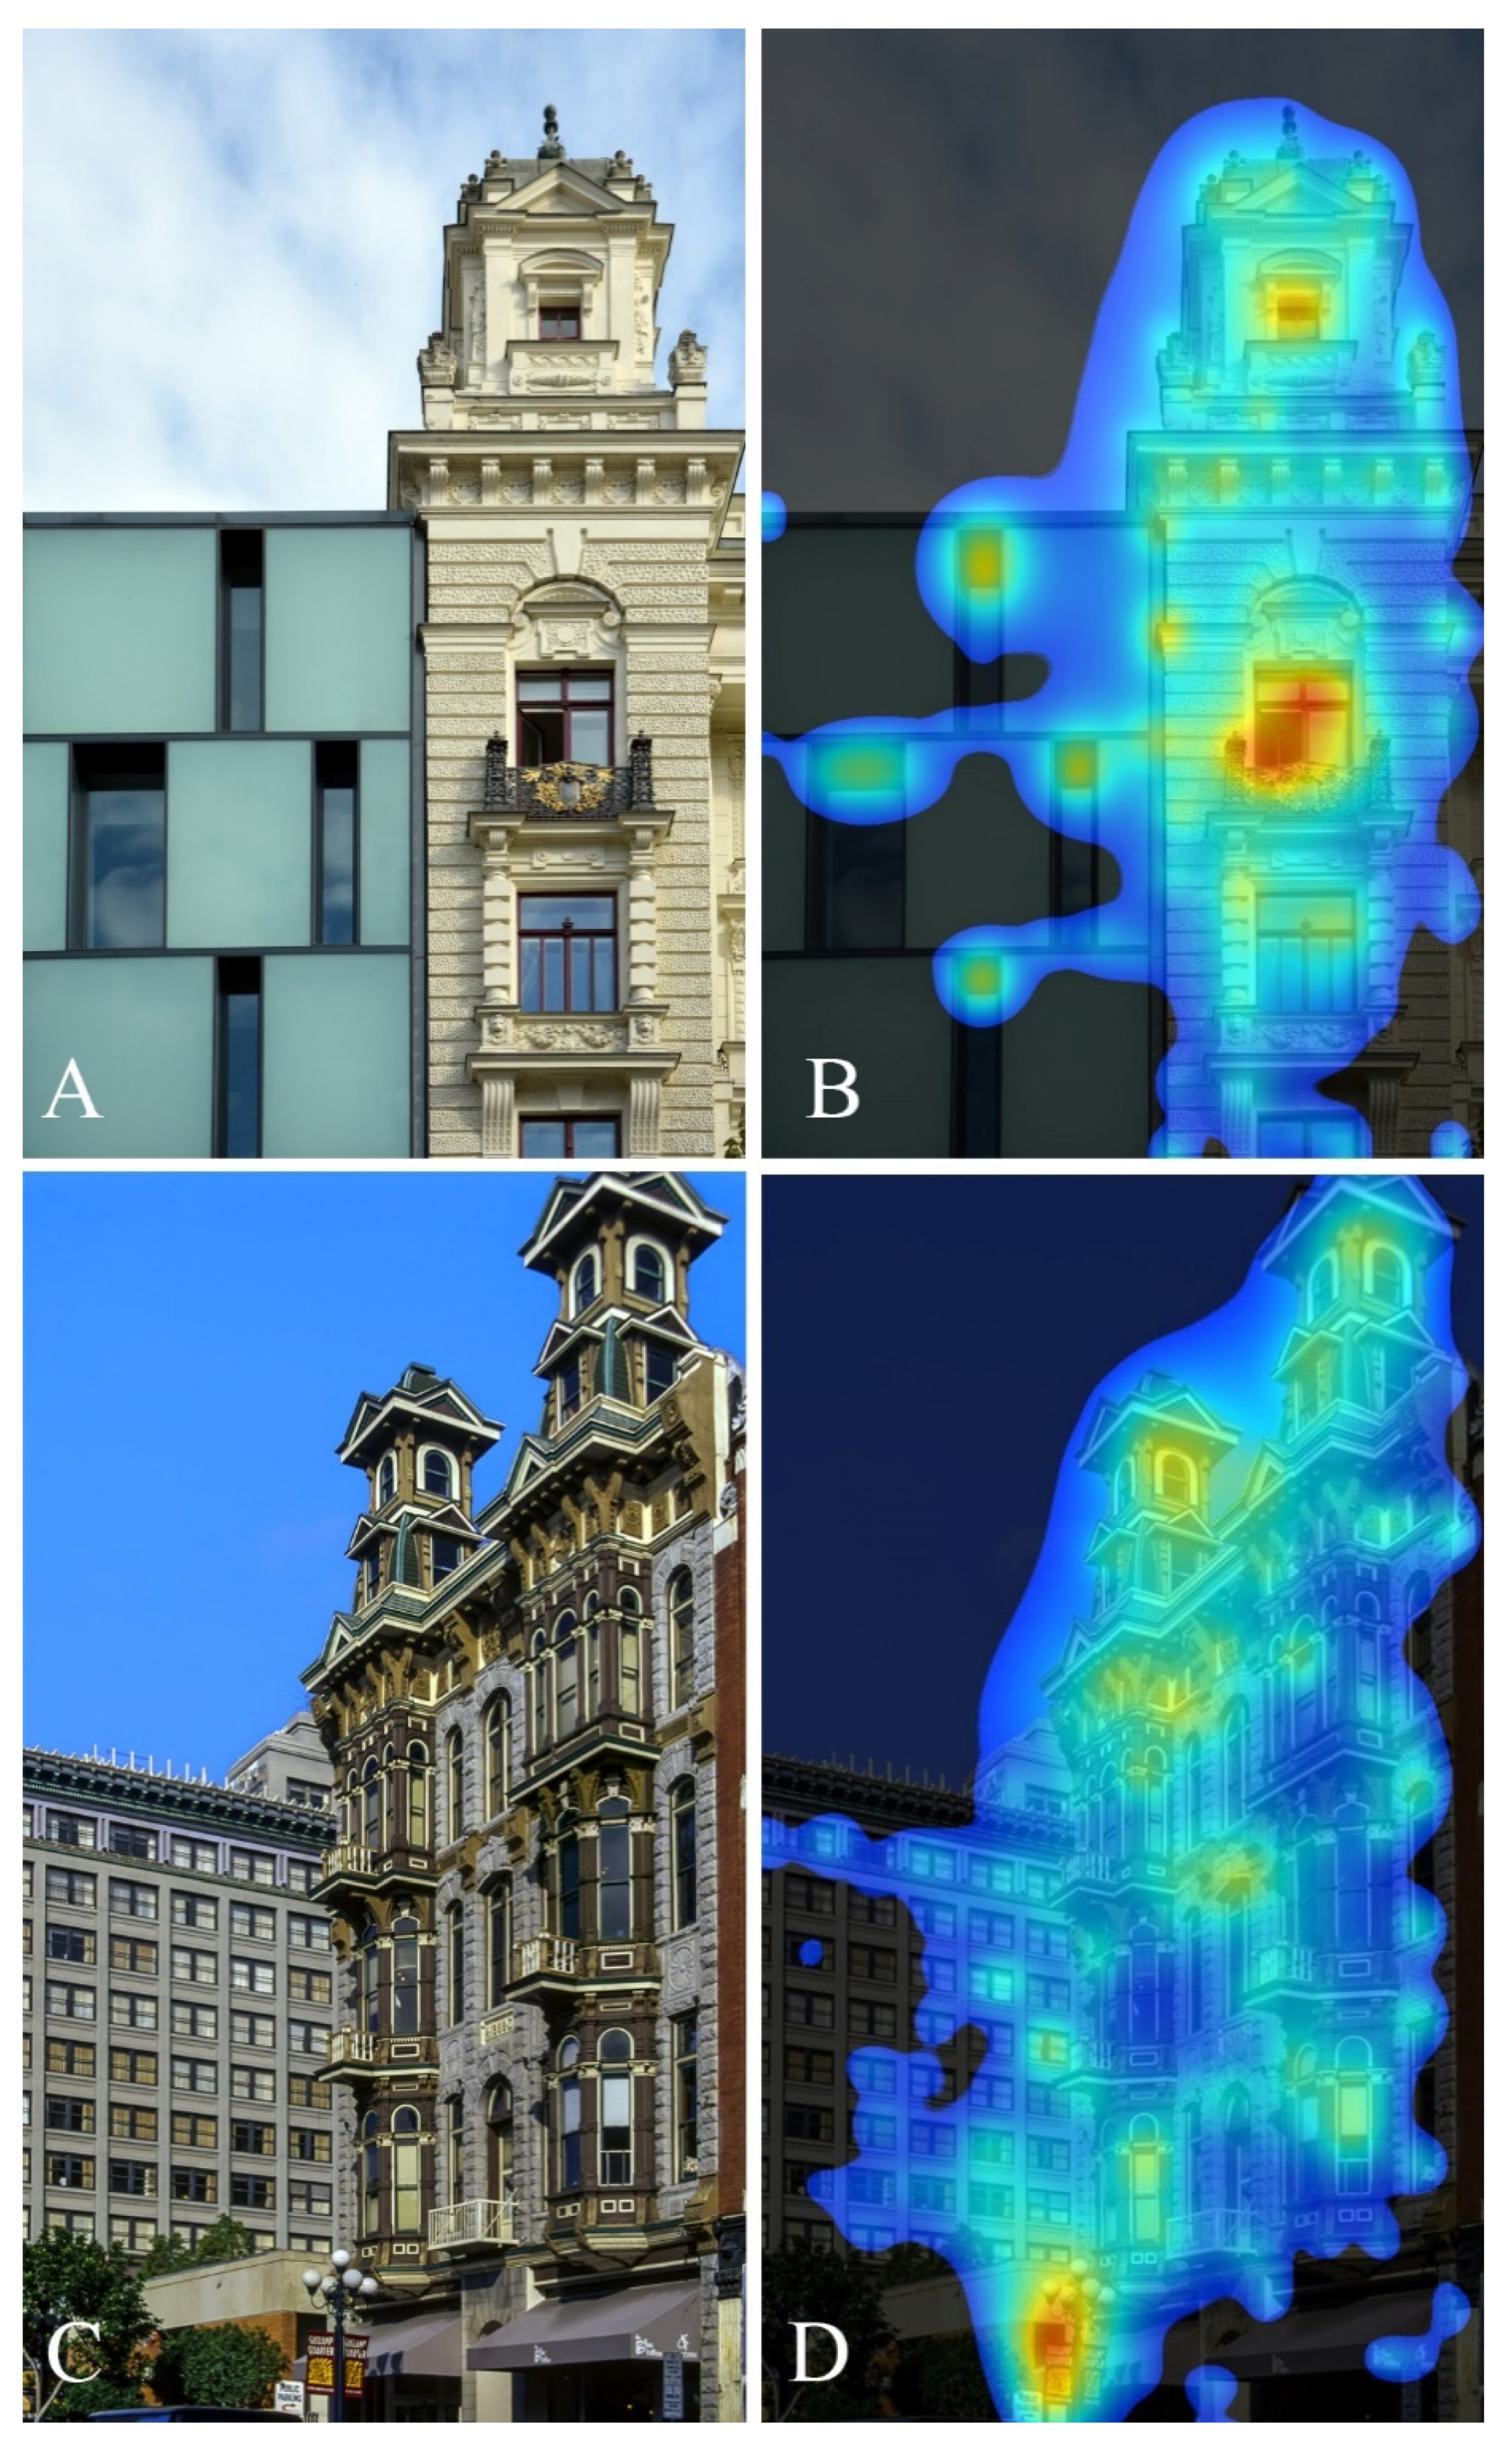
In Figure 4, the Omega Palace department store building from the 2000s connects to the House of Four Giants from the 1900s, in Freedom Square in Brno, Czech Republic (A/B); and the 1880s Louis Bank of Commerce building on 5th Avenue, San Diego, California is in front of a more recent building with symmetric distribution of openings in the background (C/D). In both cases, the gaze is attracted to the pre-modern building, but unlike what we see in Figure 3, a small part of the heatmap also extends to the newer building.
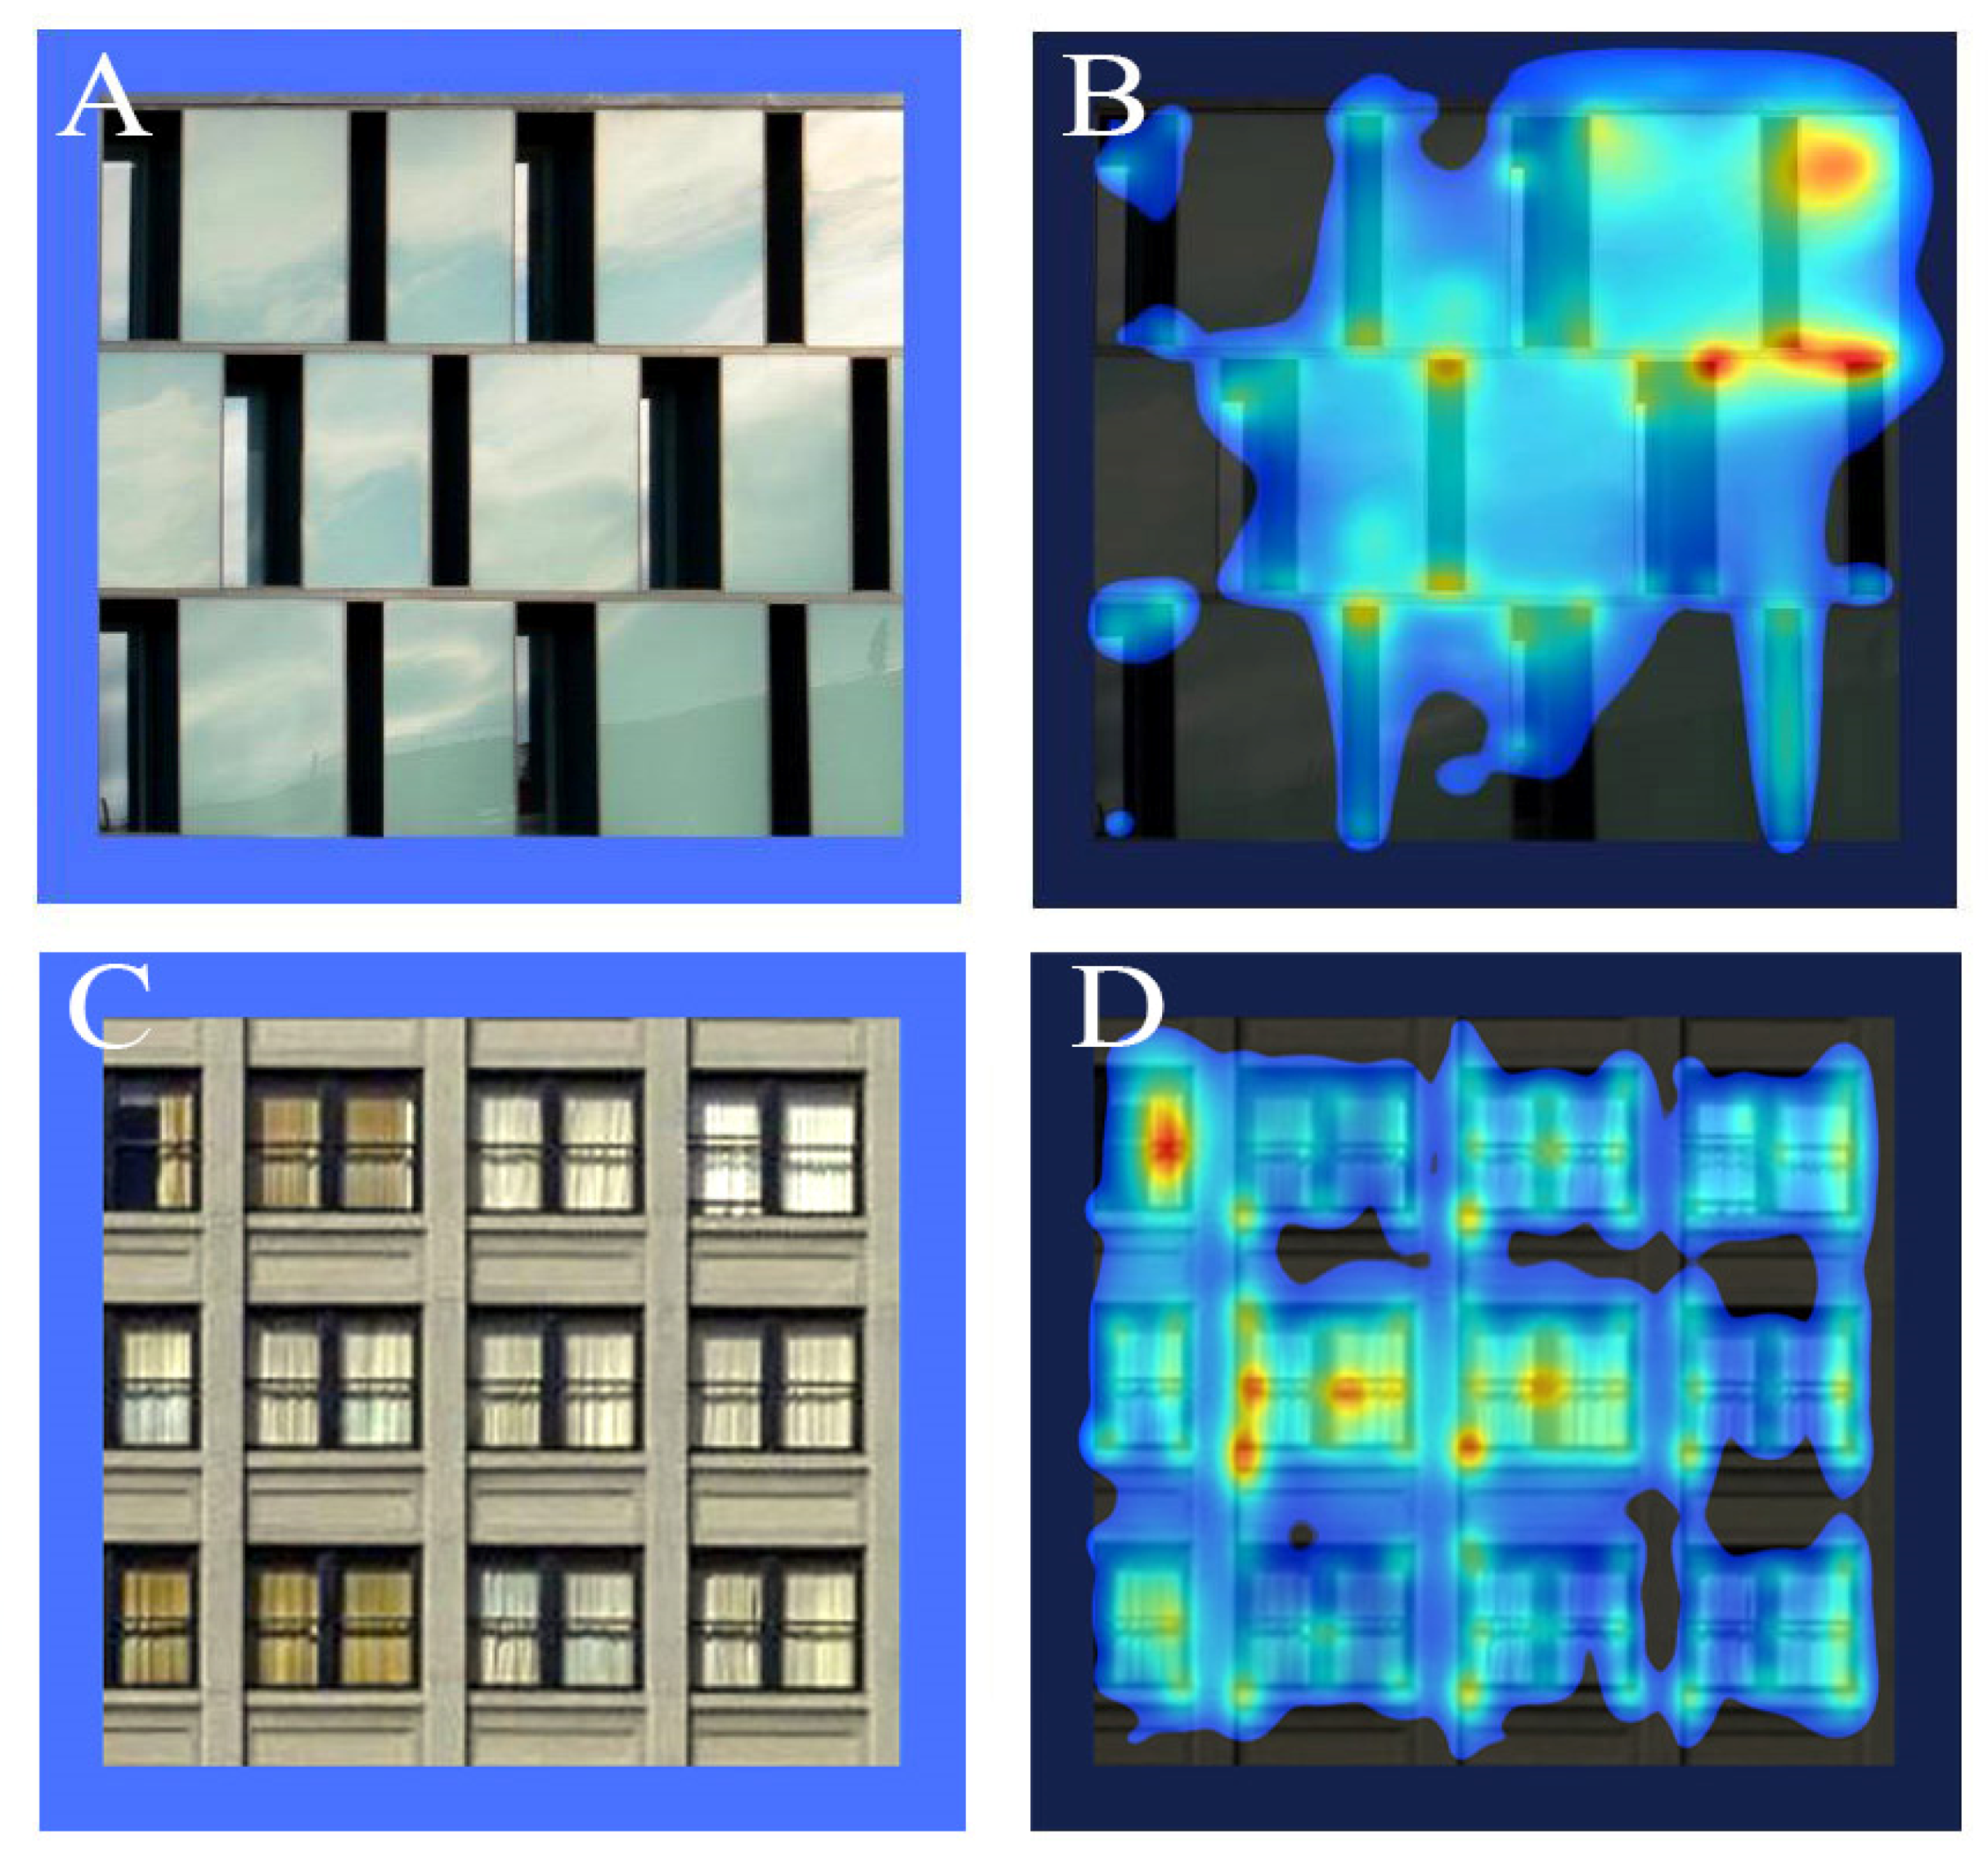
Figure 5 shows partial, equal size views of the modernist-style buildings in Figure 4 isolated from their more traditional neighbors. The glass façade building from Brno (A/B) contains some hotspots where the reflections from the sky are brighter and the contrasts with the shadows are more pronounced, but its heatmap has many gaps. Because this façade’s design pursues a visual style that deliberately eliminates nested symmetries, the gaze interest becomes fragmented [2]. The building from San Diego (C/D), although not ornate, has a regular distribution of windows, and each window is framed in an easily recognizable way. The single railing behind every window, and the shadow it casts on the curtains, create another point of regularly spaced points of contrast. All this tectonic sub-structure results in a more even distribution of the pre-attentive gaze heatmap.
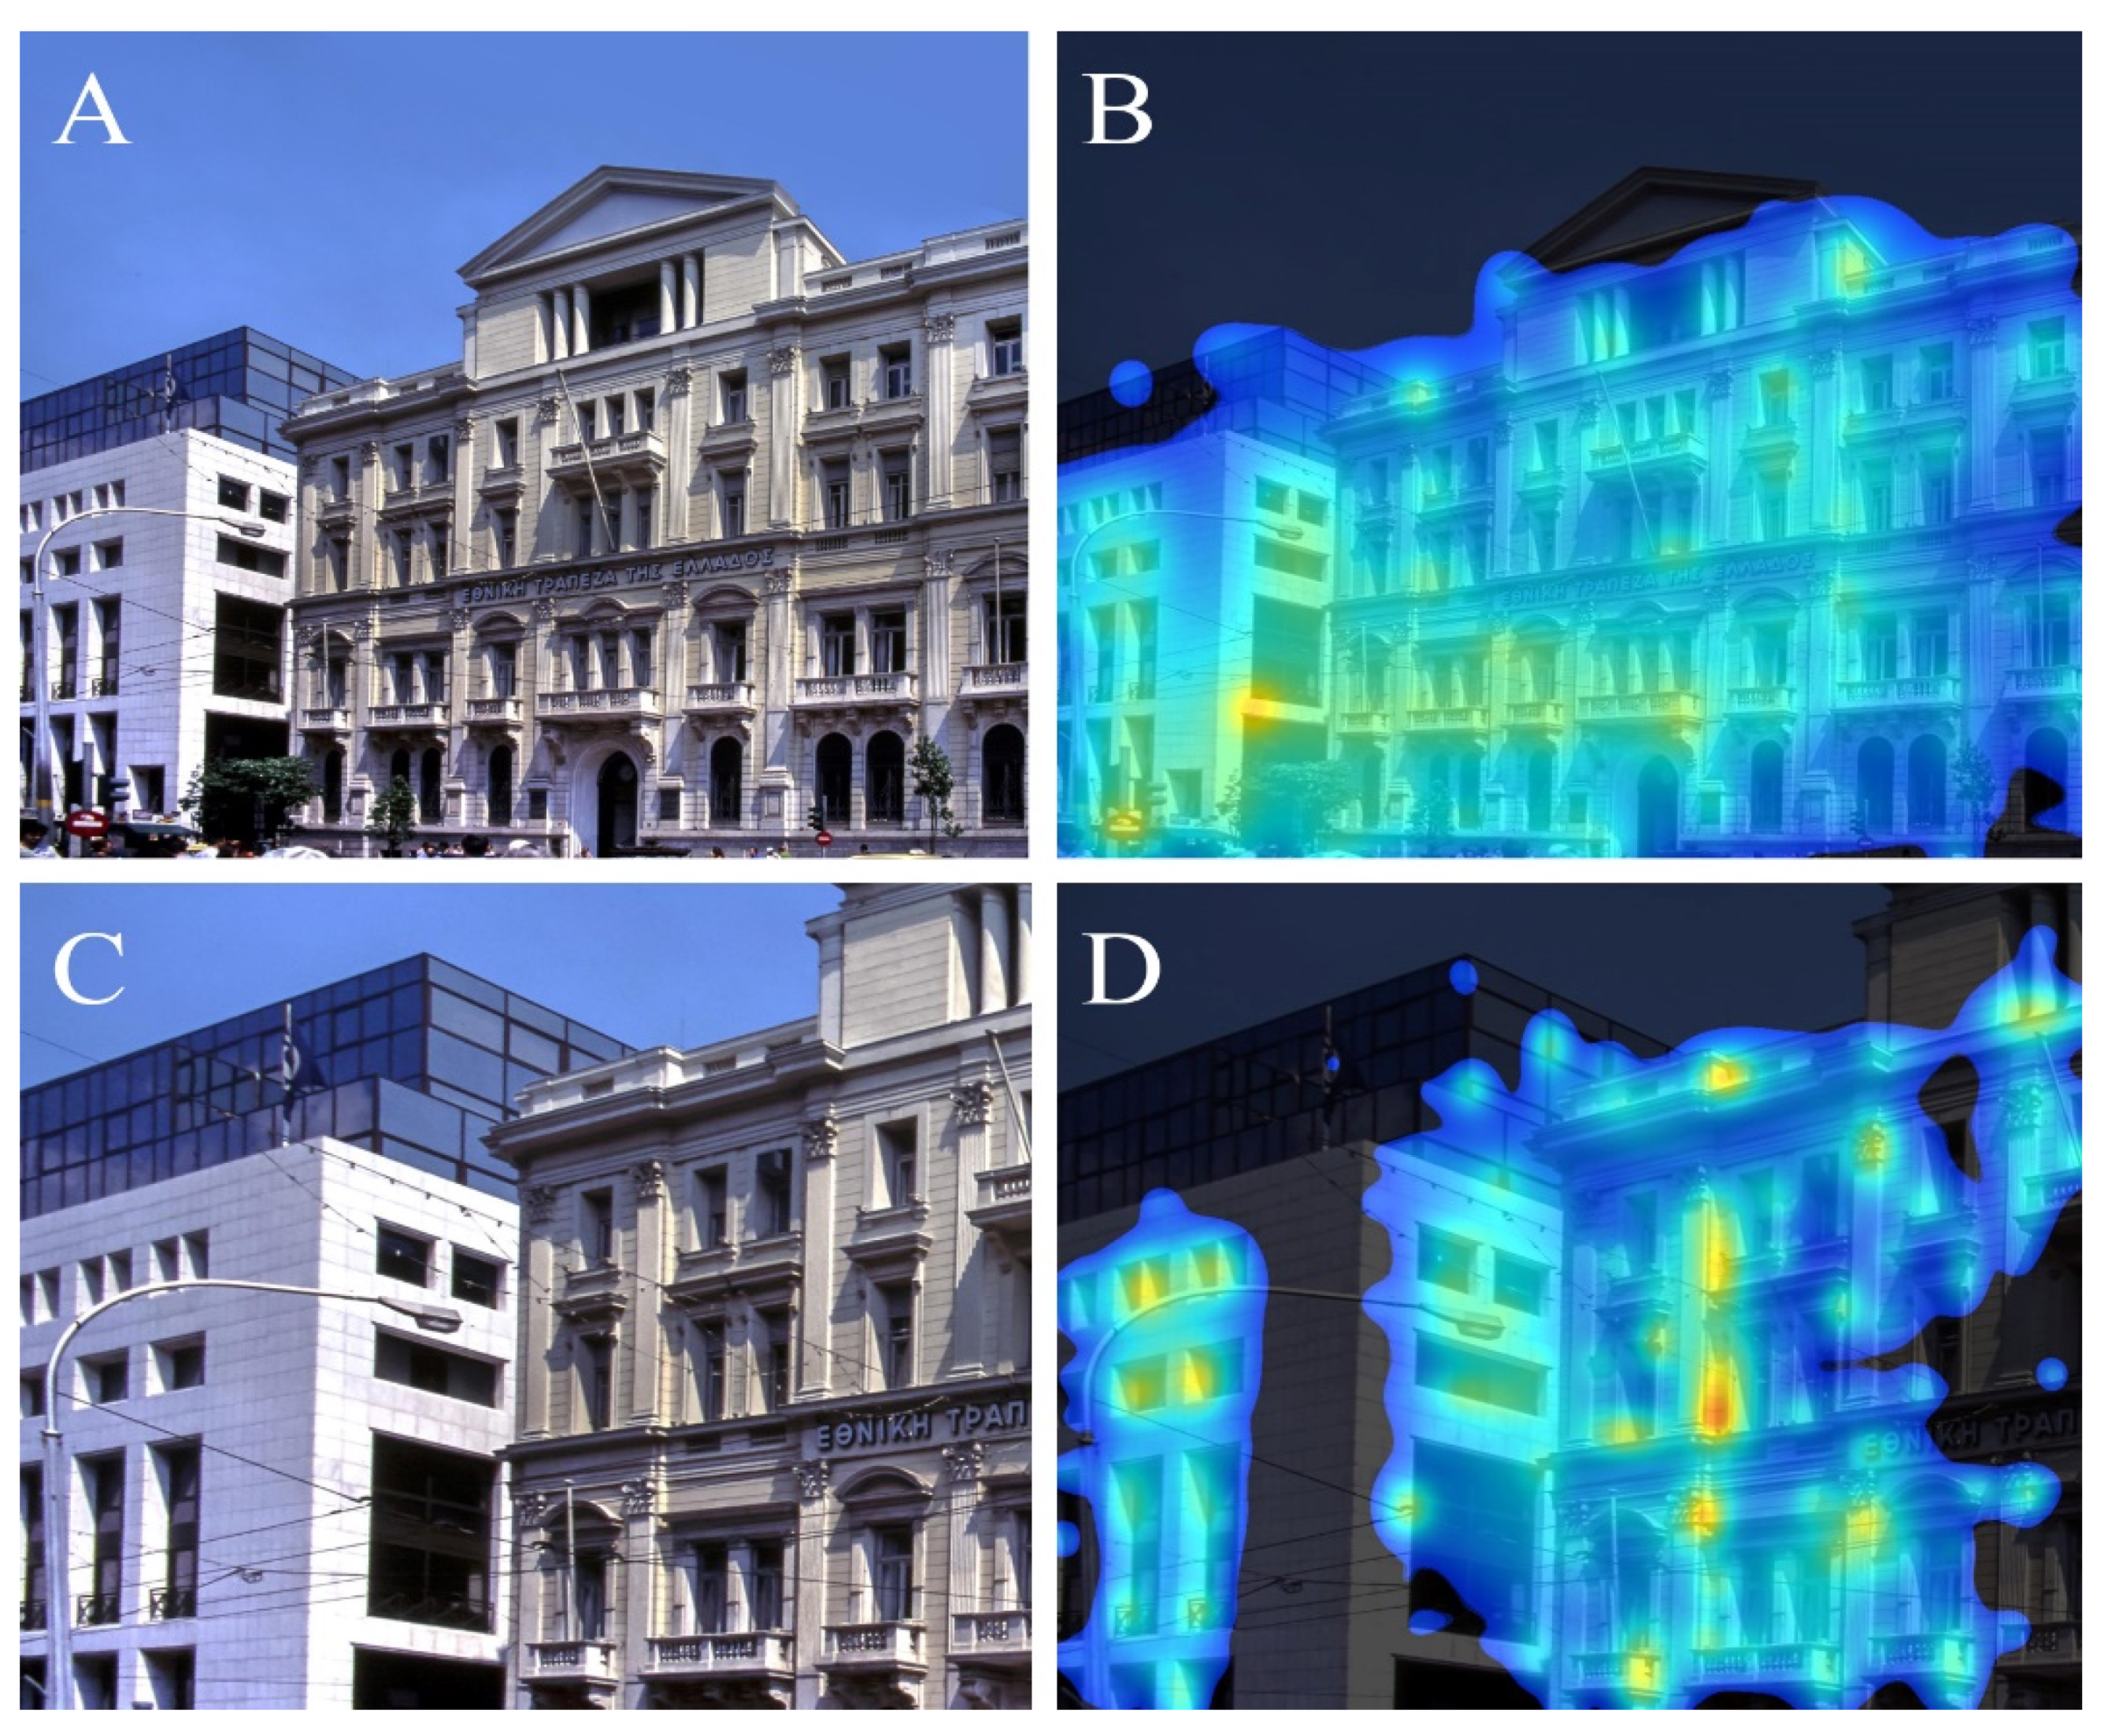
In Figure 6, in an image from Stadiou Street, Athens (A/B), a more recent building is juxtaposed with a traditional building. The neoclassical building of the National Bank of Greece, built in the late 19th and extended in the early 20th century (right) is the main attractant. The modernist-style building of the Alpha Bank from the 1990s, which is not ornate but has a regular window spacing, also attracts the gaze to a lesser degree. The glass curtain-wall top floors on the left are completely ignored, except where there are reflections from the sky. (Notice how the same general findings in images 3 and 4 are repeated here: in each case, the older building draws most of the visual attention.)
In a closer view (C/D), the neoclassical building is still favored (with the exception of areas in shadow, for technical reasons described in Figure 2). The regularly spaced windows of the modernist-style building collectively attract a fair amount of pre-attentive gaze probability, but the blank marble-clad wall does not attract the gaze at all where there are no windows, and neither does the recessed glass wall top. So, while the regular distribution of openings attracts the gaze from a distance, the lack of detail means that approaching the modernist building makes it less noticeable and more fragmented in the heatmap, in contrast to the neoclassical building on the right, where approaching it reveals details of a different scale level.
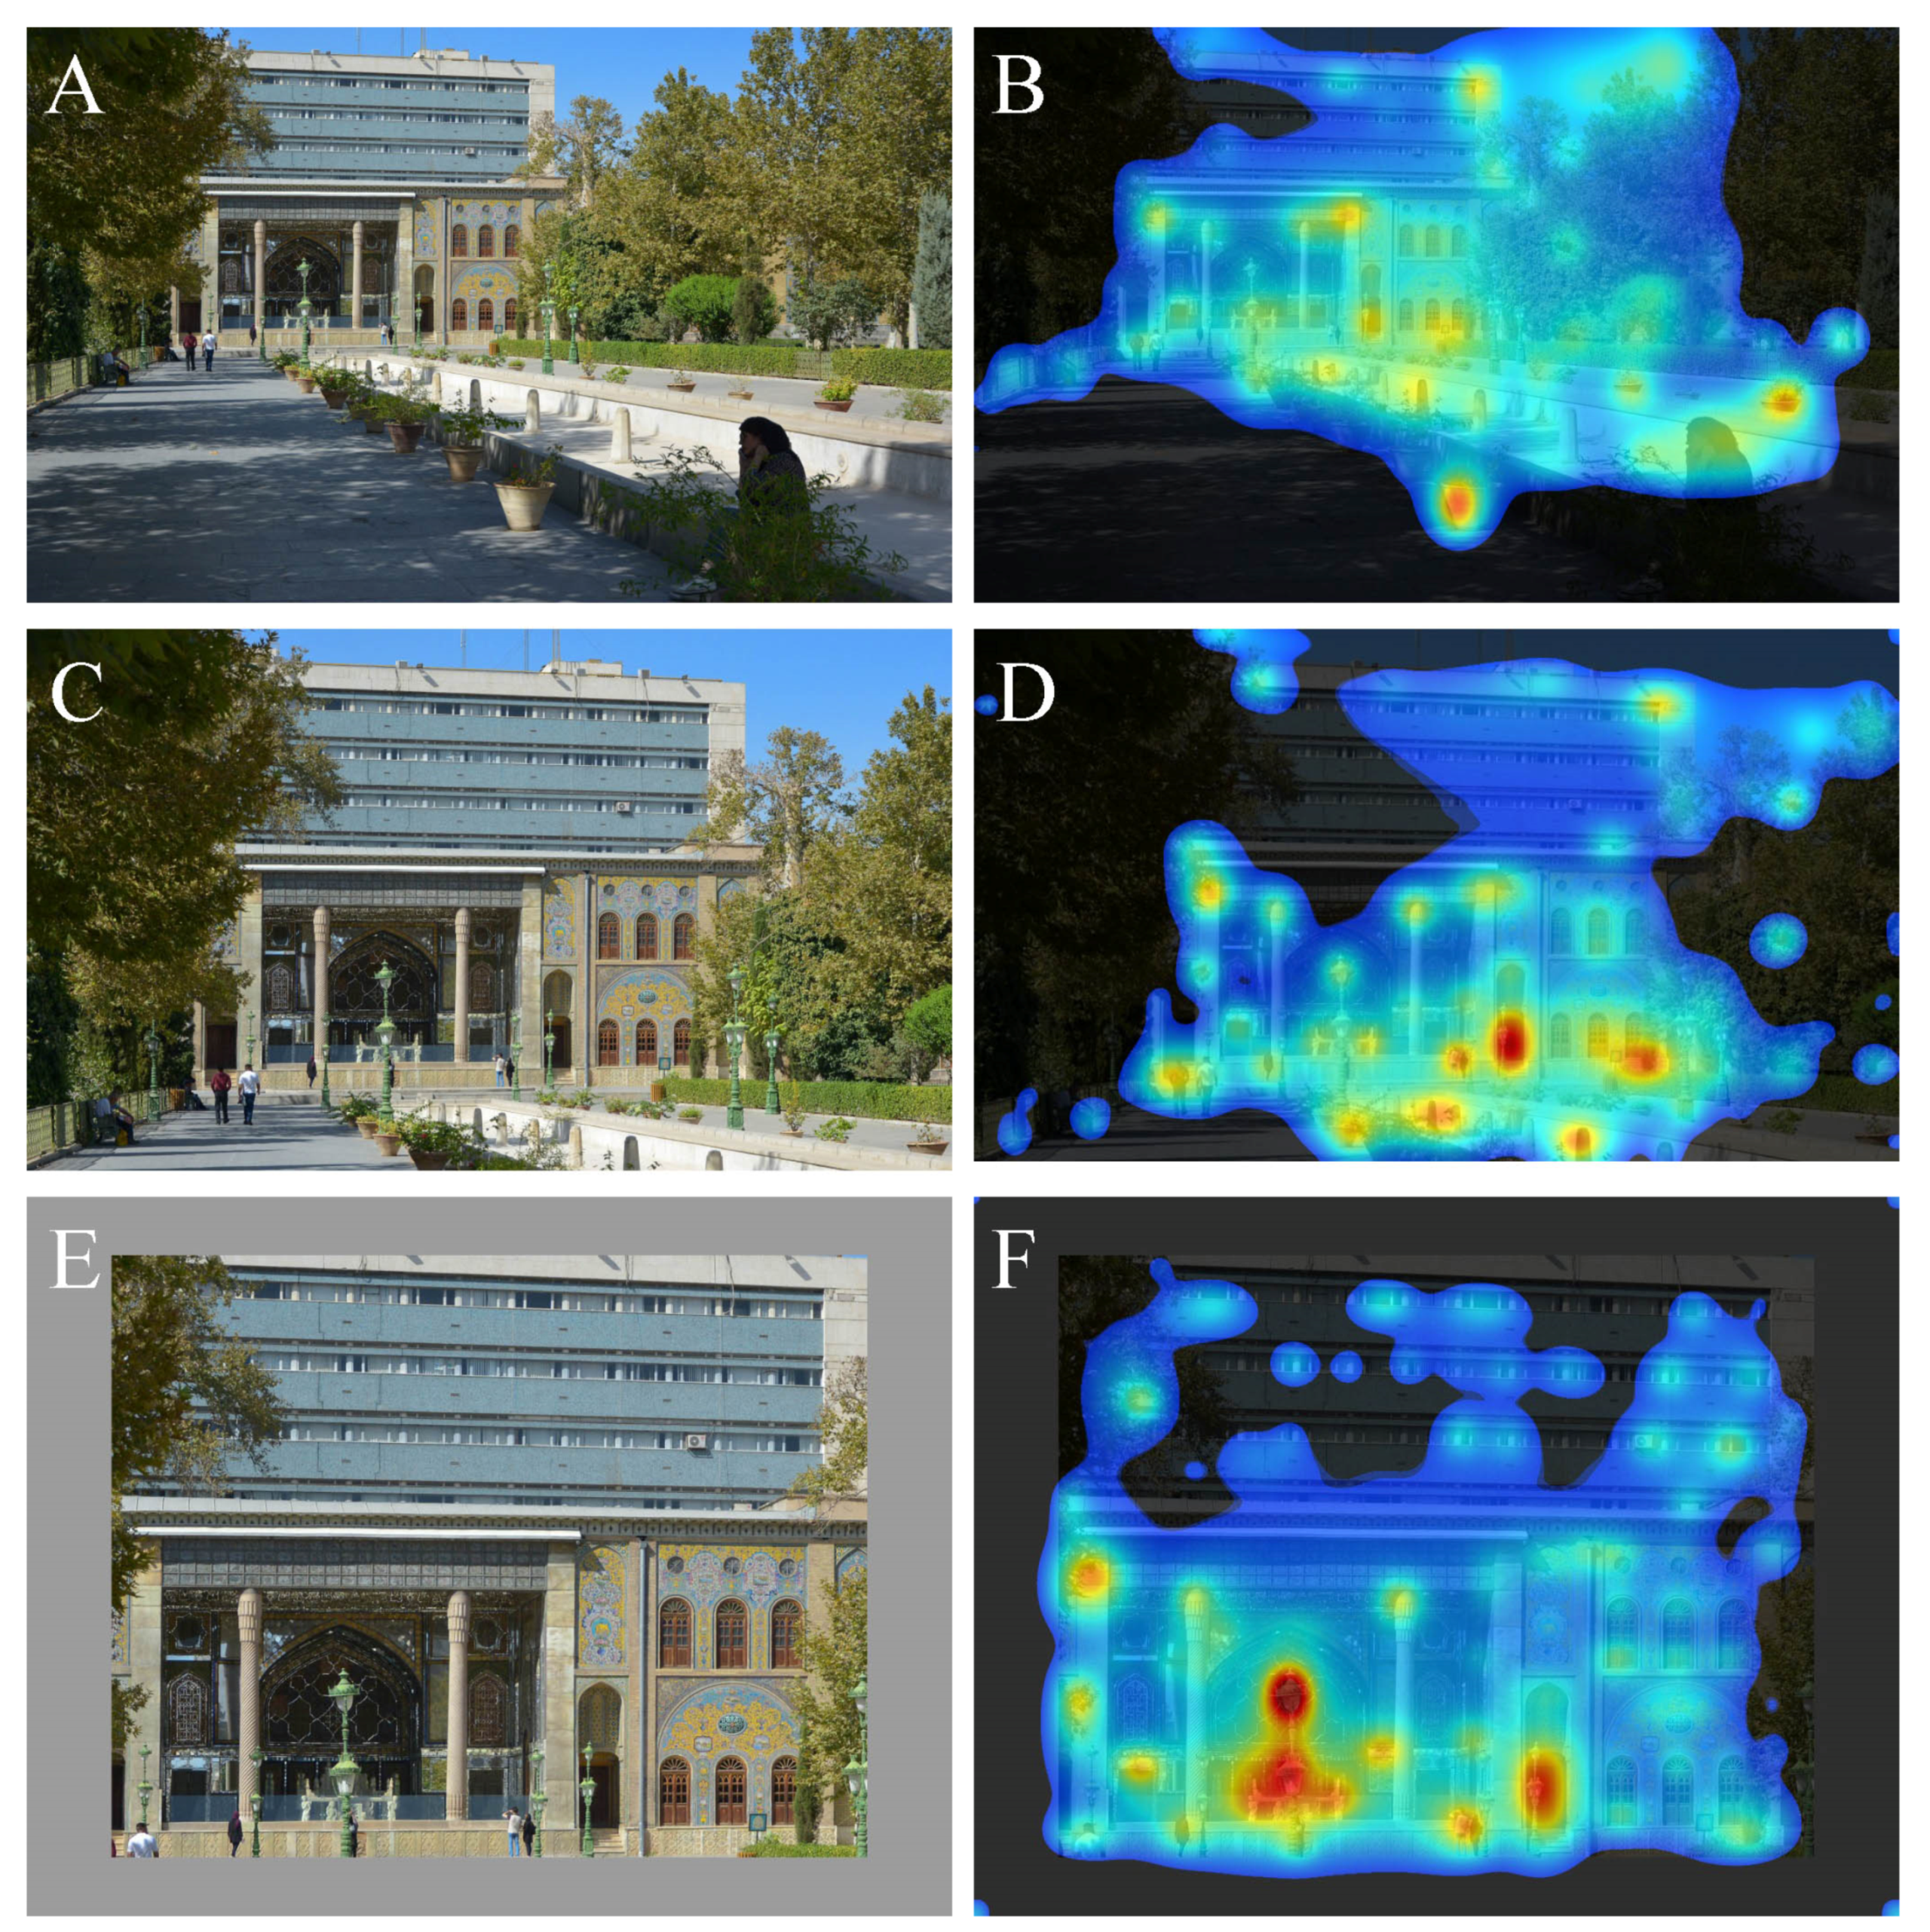
Figure 7 shows a view of the Royal Balcony with the Marble throne, one of the buildings of the Golestan Palace complex in Tehran, Iran dating from the 18th century. This building is near the border of the complex, and a tall modernist-style office building can be seen from across the street behind it, providing a chance juxtaposition. Zooming into the scene, we see that the palace building retains overall interest, whereas the heatmap become more fragmented for the modernist-style building, the closer in we come (C/D, E/F). It is the high degree of organized complexity of the older palace that keeps our attention. People shown in the images are also major attractants, complicating a strict analysis of the architectural geometry, as previously noted [11].
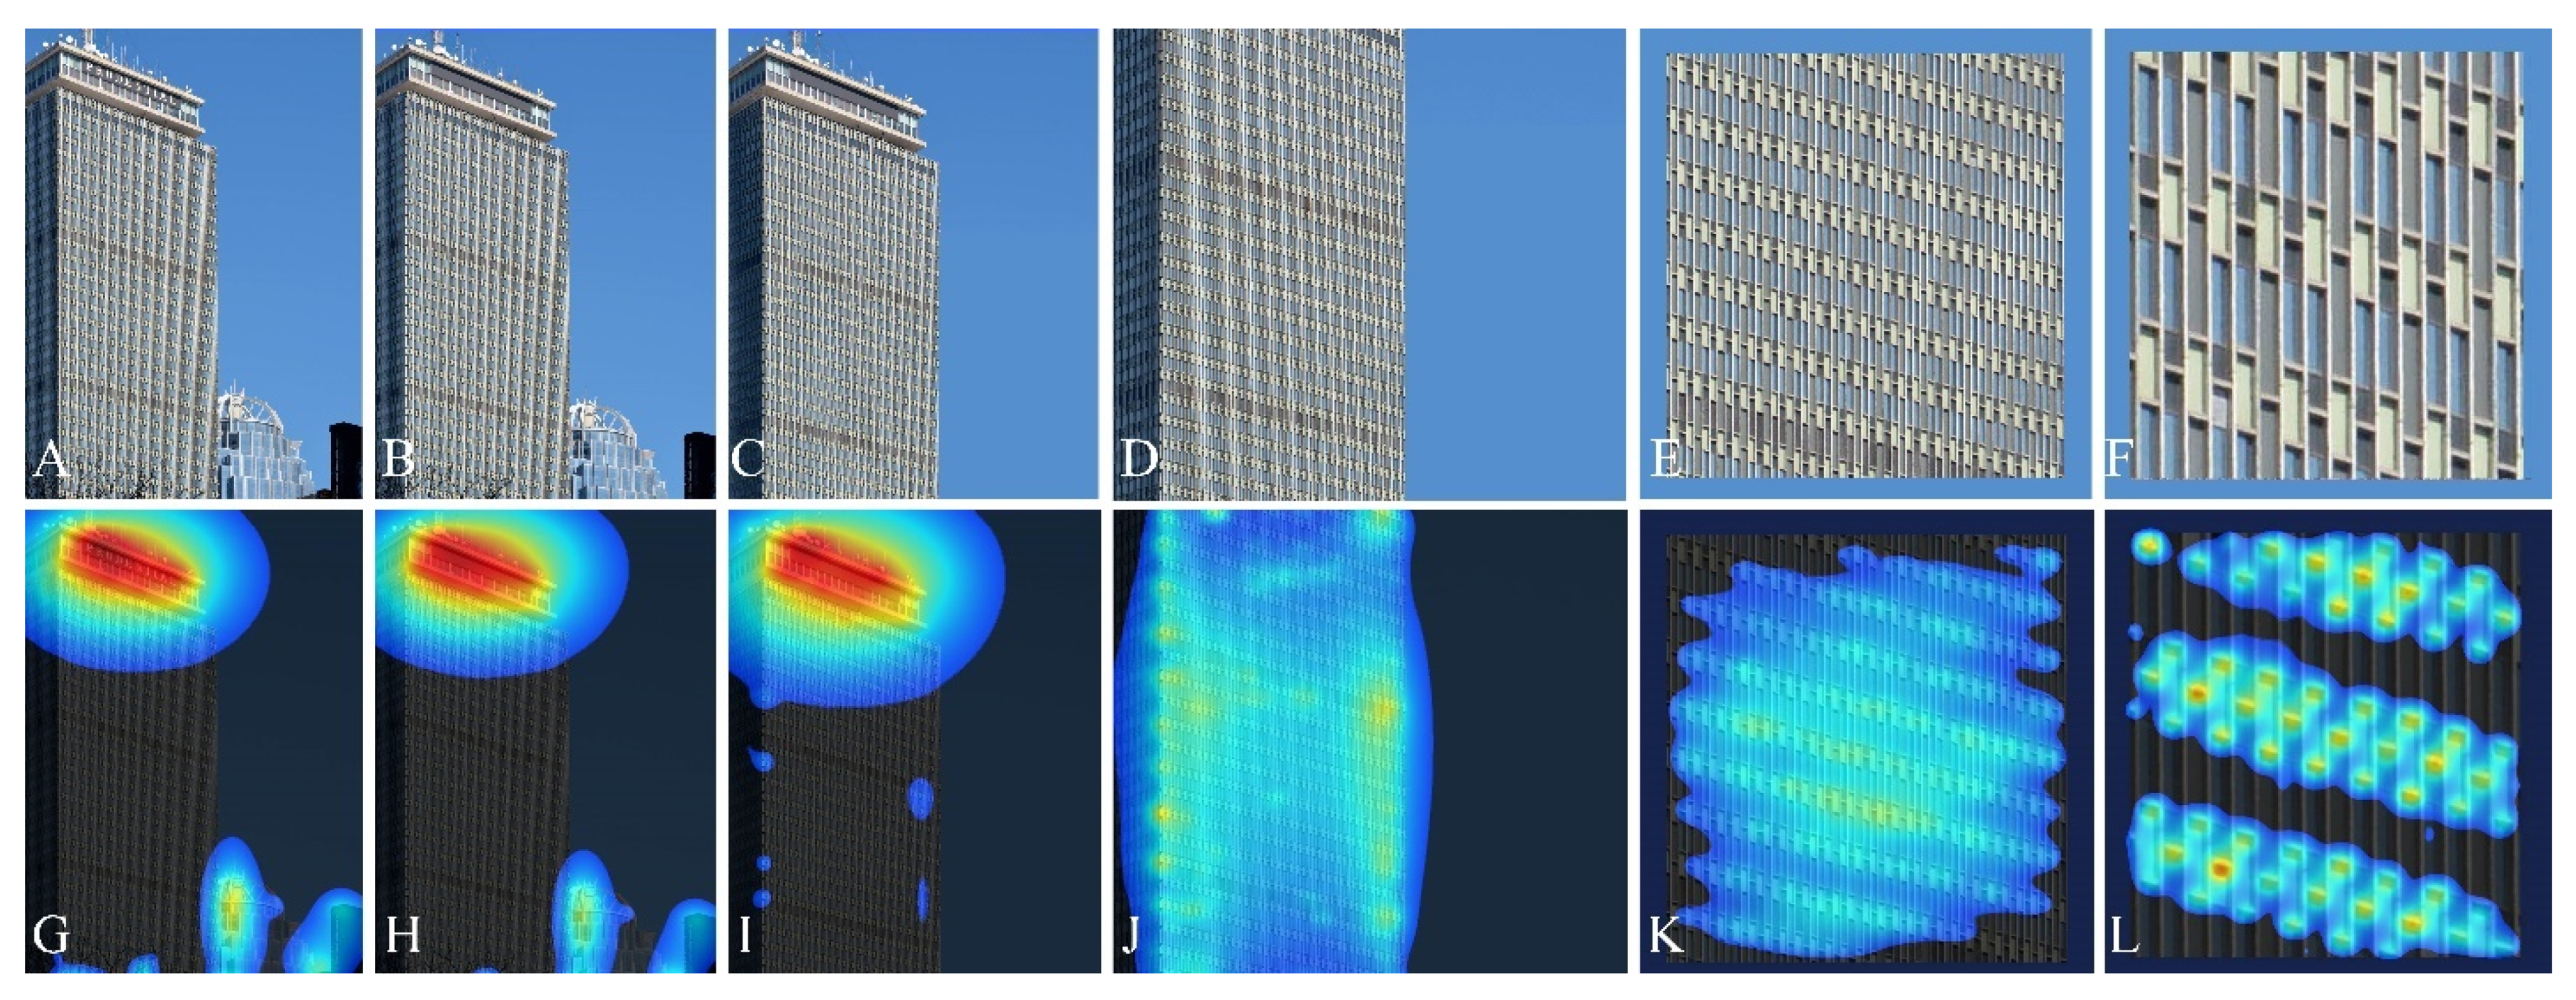
Figure 8 analyzes a photograph of the Prudential Tower in Boston, built in the International Style in the 1960s. This very large building is almost completely ignored, with the exception of the top floors, which are morphologically distinct from the rest, and create visual contrast. The second “hottest” point is a small part of the morphologically more complex 111 Huntington Avenue building, seen on the right at a distance (A/G). Removing the lettering from the top floors of the Prudential Tower does not cause any change (B/H), and neither does cropping the bottom part, which removes the 111 Huntington Avenue building competing for attention (C/I). Zooming in, the Prudential building is more or less uniformly explored (D/J) as its details become more visible and all other points of gaze attraction are excluded, but this uniformity disintegrates as we move further in, and the monotonous repetition is clearly revealed (E/K, F/L).
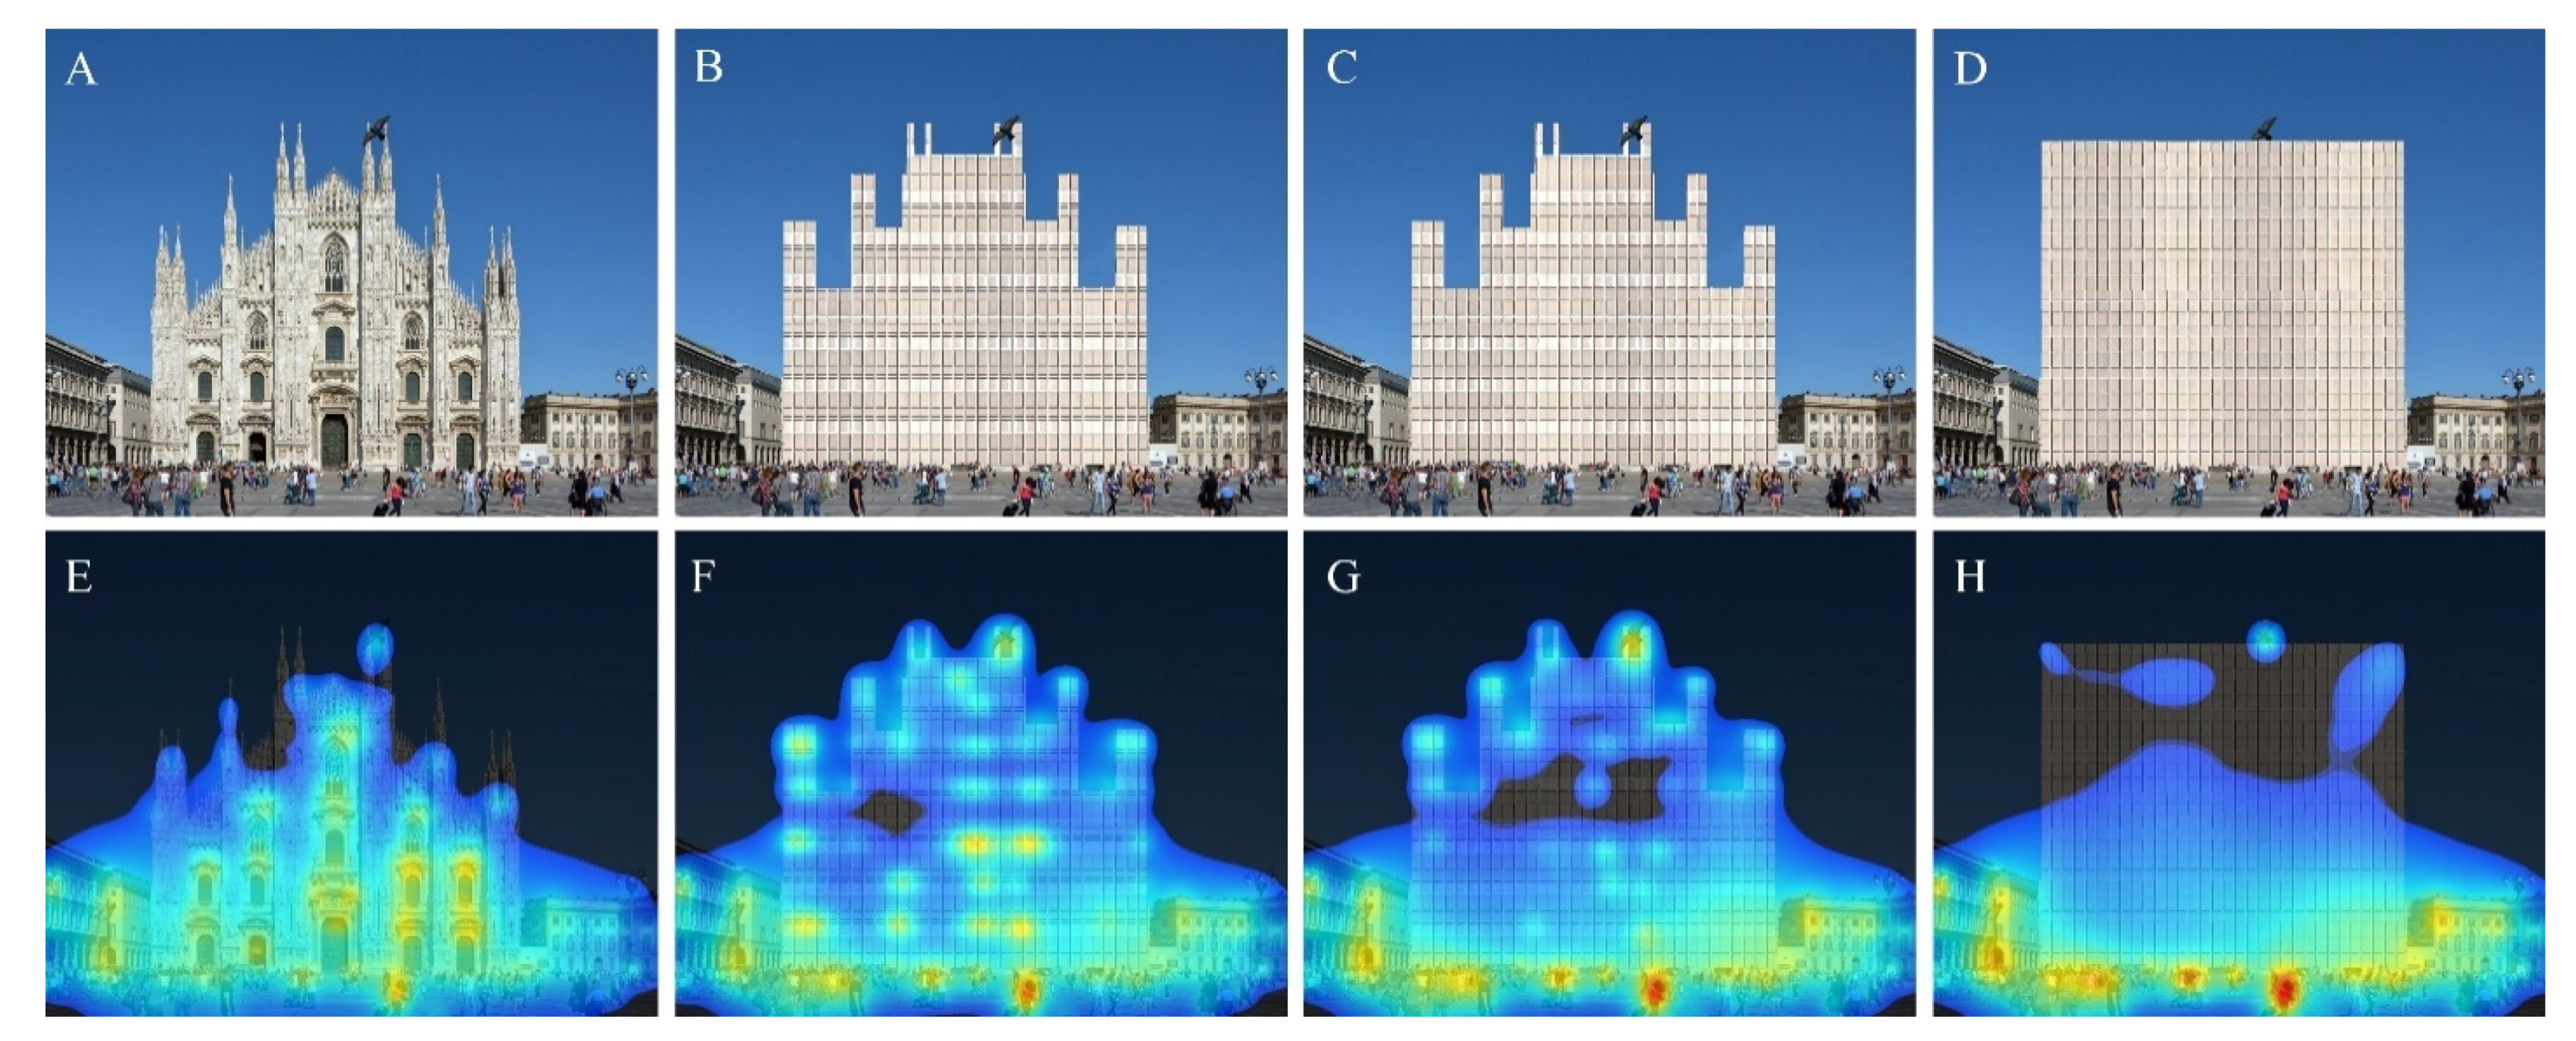
In Figure 9, in a photograph of Piazza Duomo in Milan, Italy (A), the Duomo Cathedral has been replaced by a curtain wall face of similar color (B) that gets progressively simpler, first by losing one set of horizontal lines per floor (C). In the same simplifying sequence, the façades progressively abandon the complex fractal skyline of the original building for a square profile (D). The heatmap coverage diminishes with decreasing complexity. The people, the flying pigeon, and the surrounding buildings are always within the heatmap, but become gradually “hotter” as the central object building attracts less and less coverage.
Figure 9 reveals how interest fades as an iconic building loses detail and fractal scaling; we do not believe that anyone has ever demonstrated this important phenomenon before. These sequences of images are very powerful and really drives home how the architectural experience is controlled subliminally, and not by the conscious brain. We have here an incredible and compact recapitulation of the evolution of architectural design during several centuries.
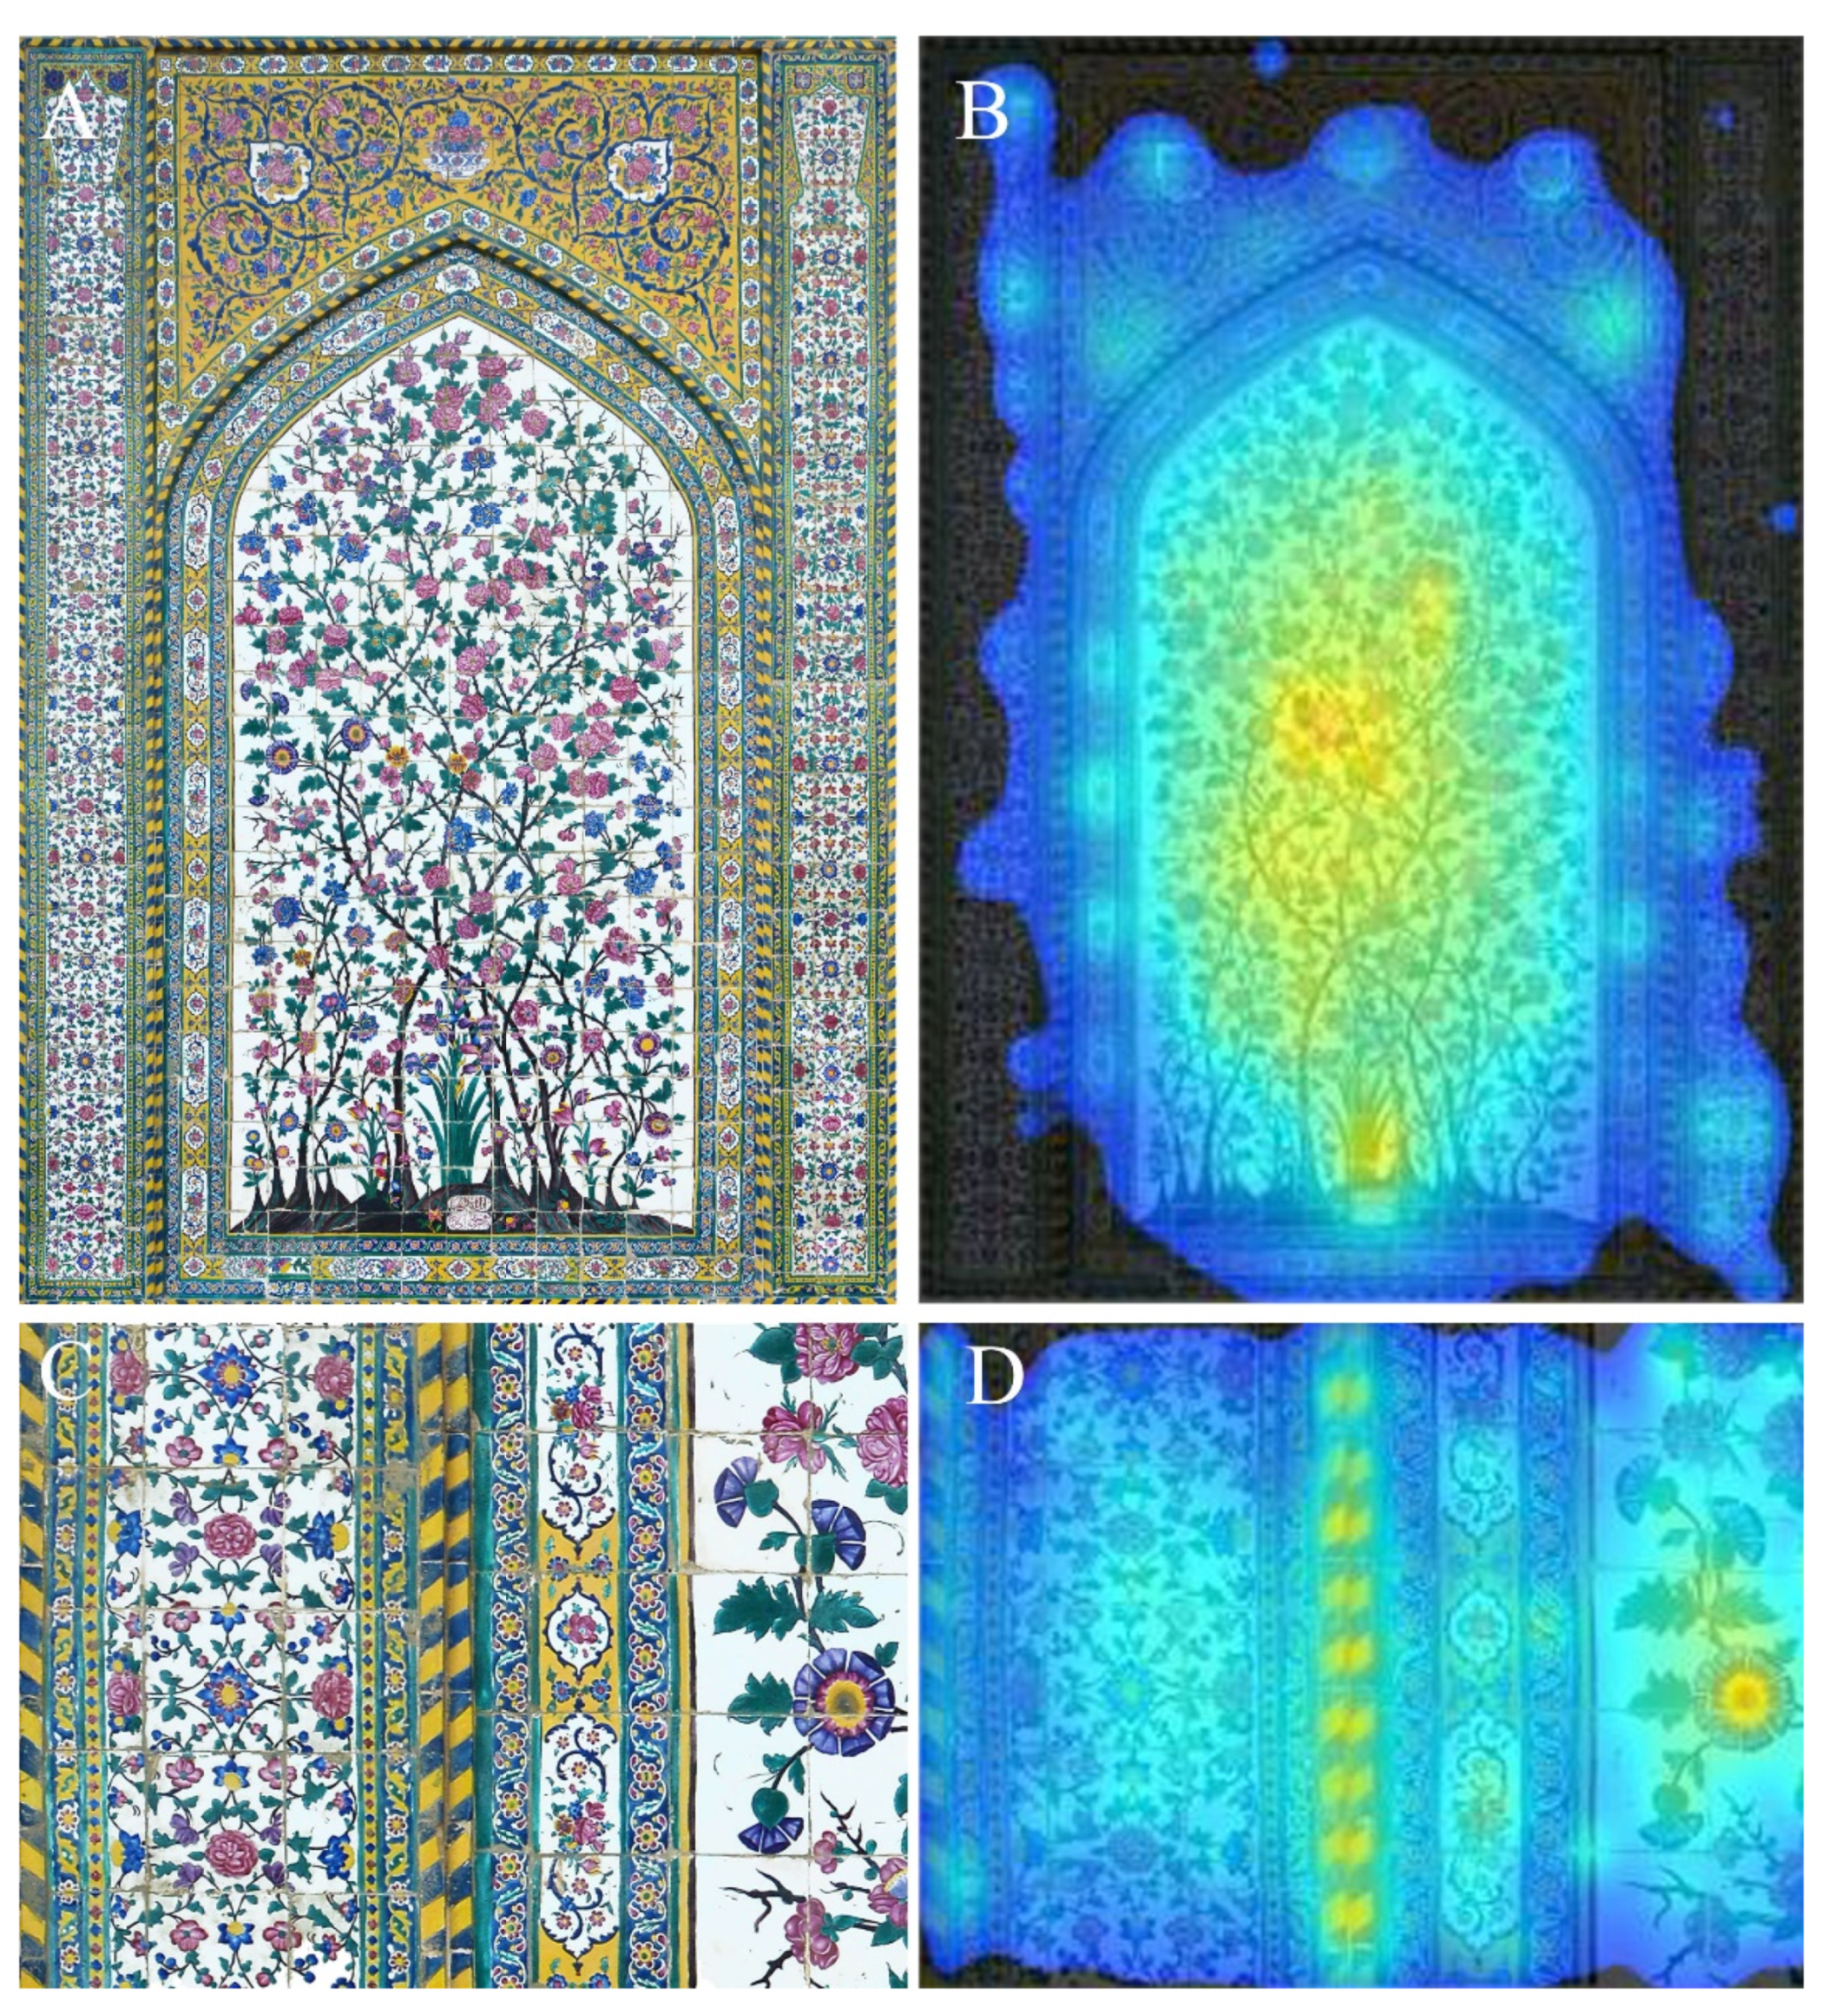
Figure 10 analyzes a tiled ceramic mural from the 18th Century Vakil mosque in Shiraz, Iran. Looking at the whole building from a distance, a mural like this is not a strong visual attractor (see Figure 7E,F for an example from another building where the closer we approach, the more organized complexity we see). Looking closer, however, by zooming in on one mural, the central patterns are now more easily discernible, becoming the hottest areas of the heat map, which fades toward the edges without including the more finely decorated borders (A/B). Zooming further in, this fine detail registers and the whole area is covered by the uniform blue glow (C/D). This sequence represents the visual equivalent of a pedestrian approaching a building with fine detail, with attention being grabbed by more detail instead of less (the opposite of the case with the modernist-style buildings shown in Figure 6 and Figure 7).
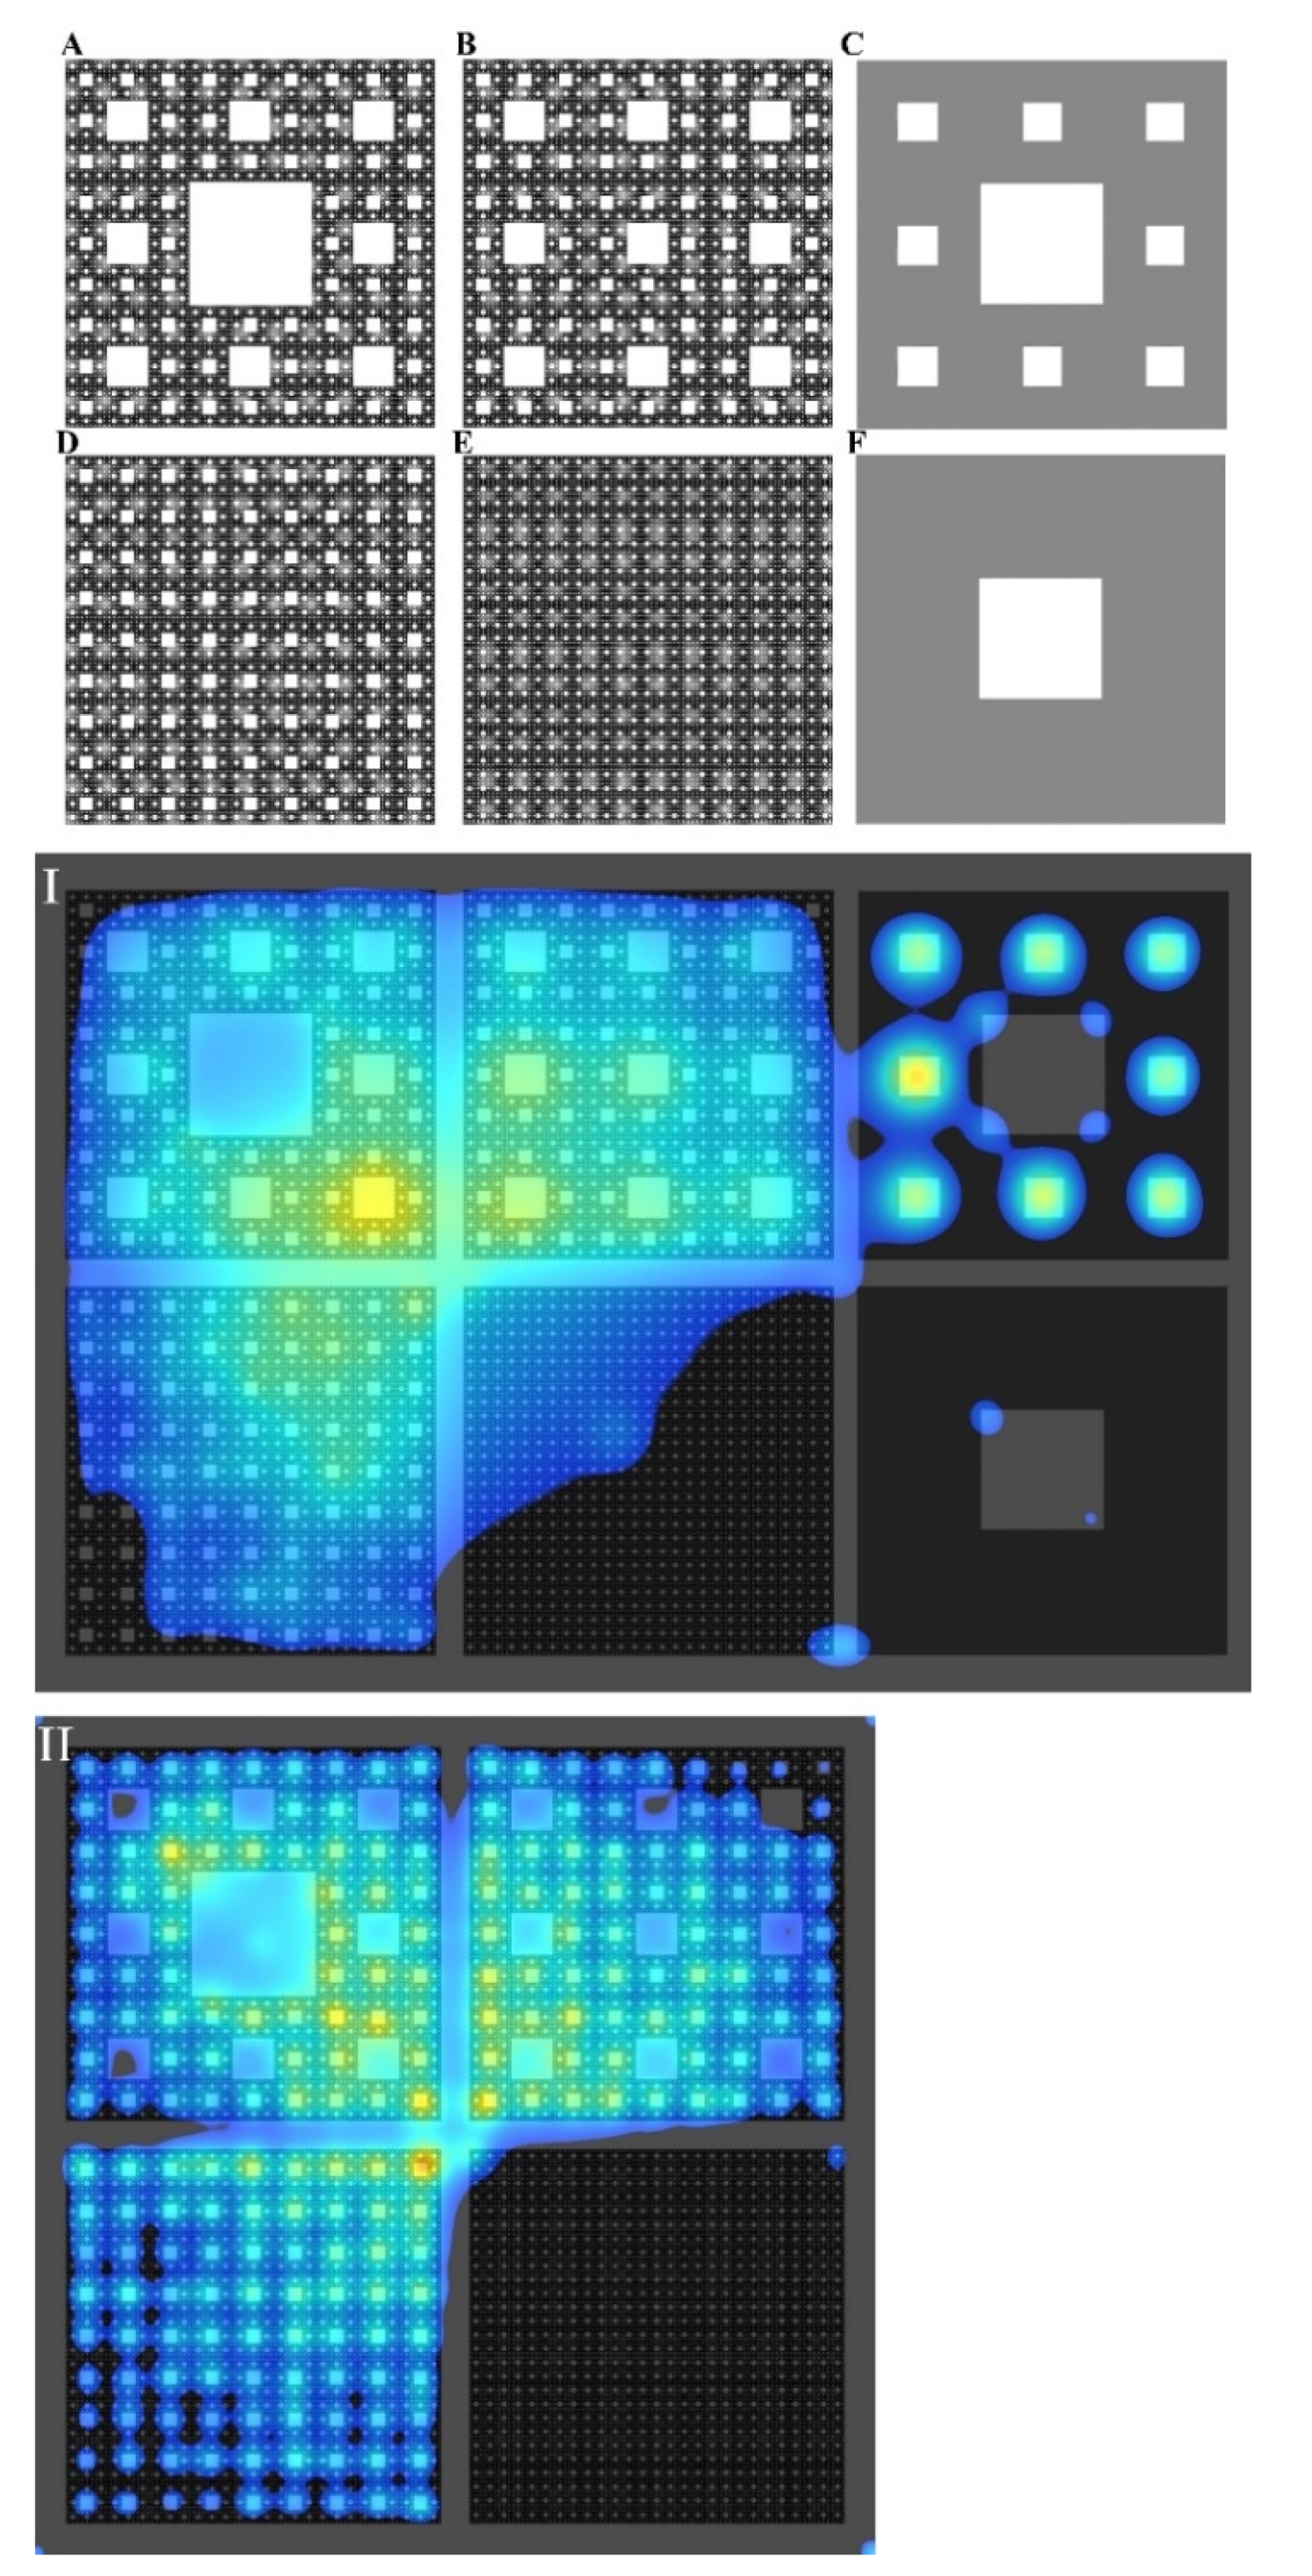
In Figure 11, the Sierpinski Carpet geometrical fractal is analyzed (A), then with missing either large (B, D, E) or small-scale levels (C, F). All versions were tested together, as one image. It was important to compare the relative ranking among versions showing different degrees of fractal scaling. The result is quite instructive. Those versions where levels of scale are missing are covered less by the heat map, with the more simplified versions E and F receiving the least coverage. Interestingly, the diagonal low-level coverage of E seems to be related to the presence of C in the same test. When only A, B, D, E are tested together, the avoidance of the rather monotonous E is more pronounced (II). The eye is engaged by obvious hierarchical scaling.
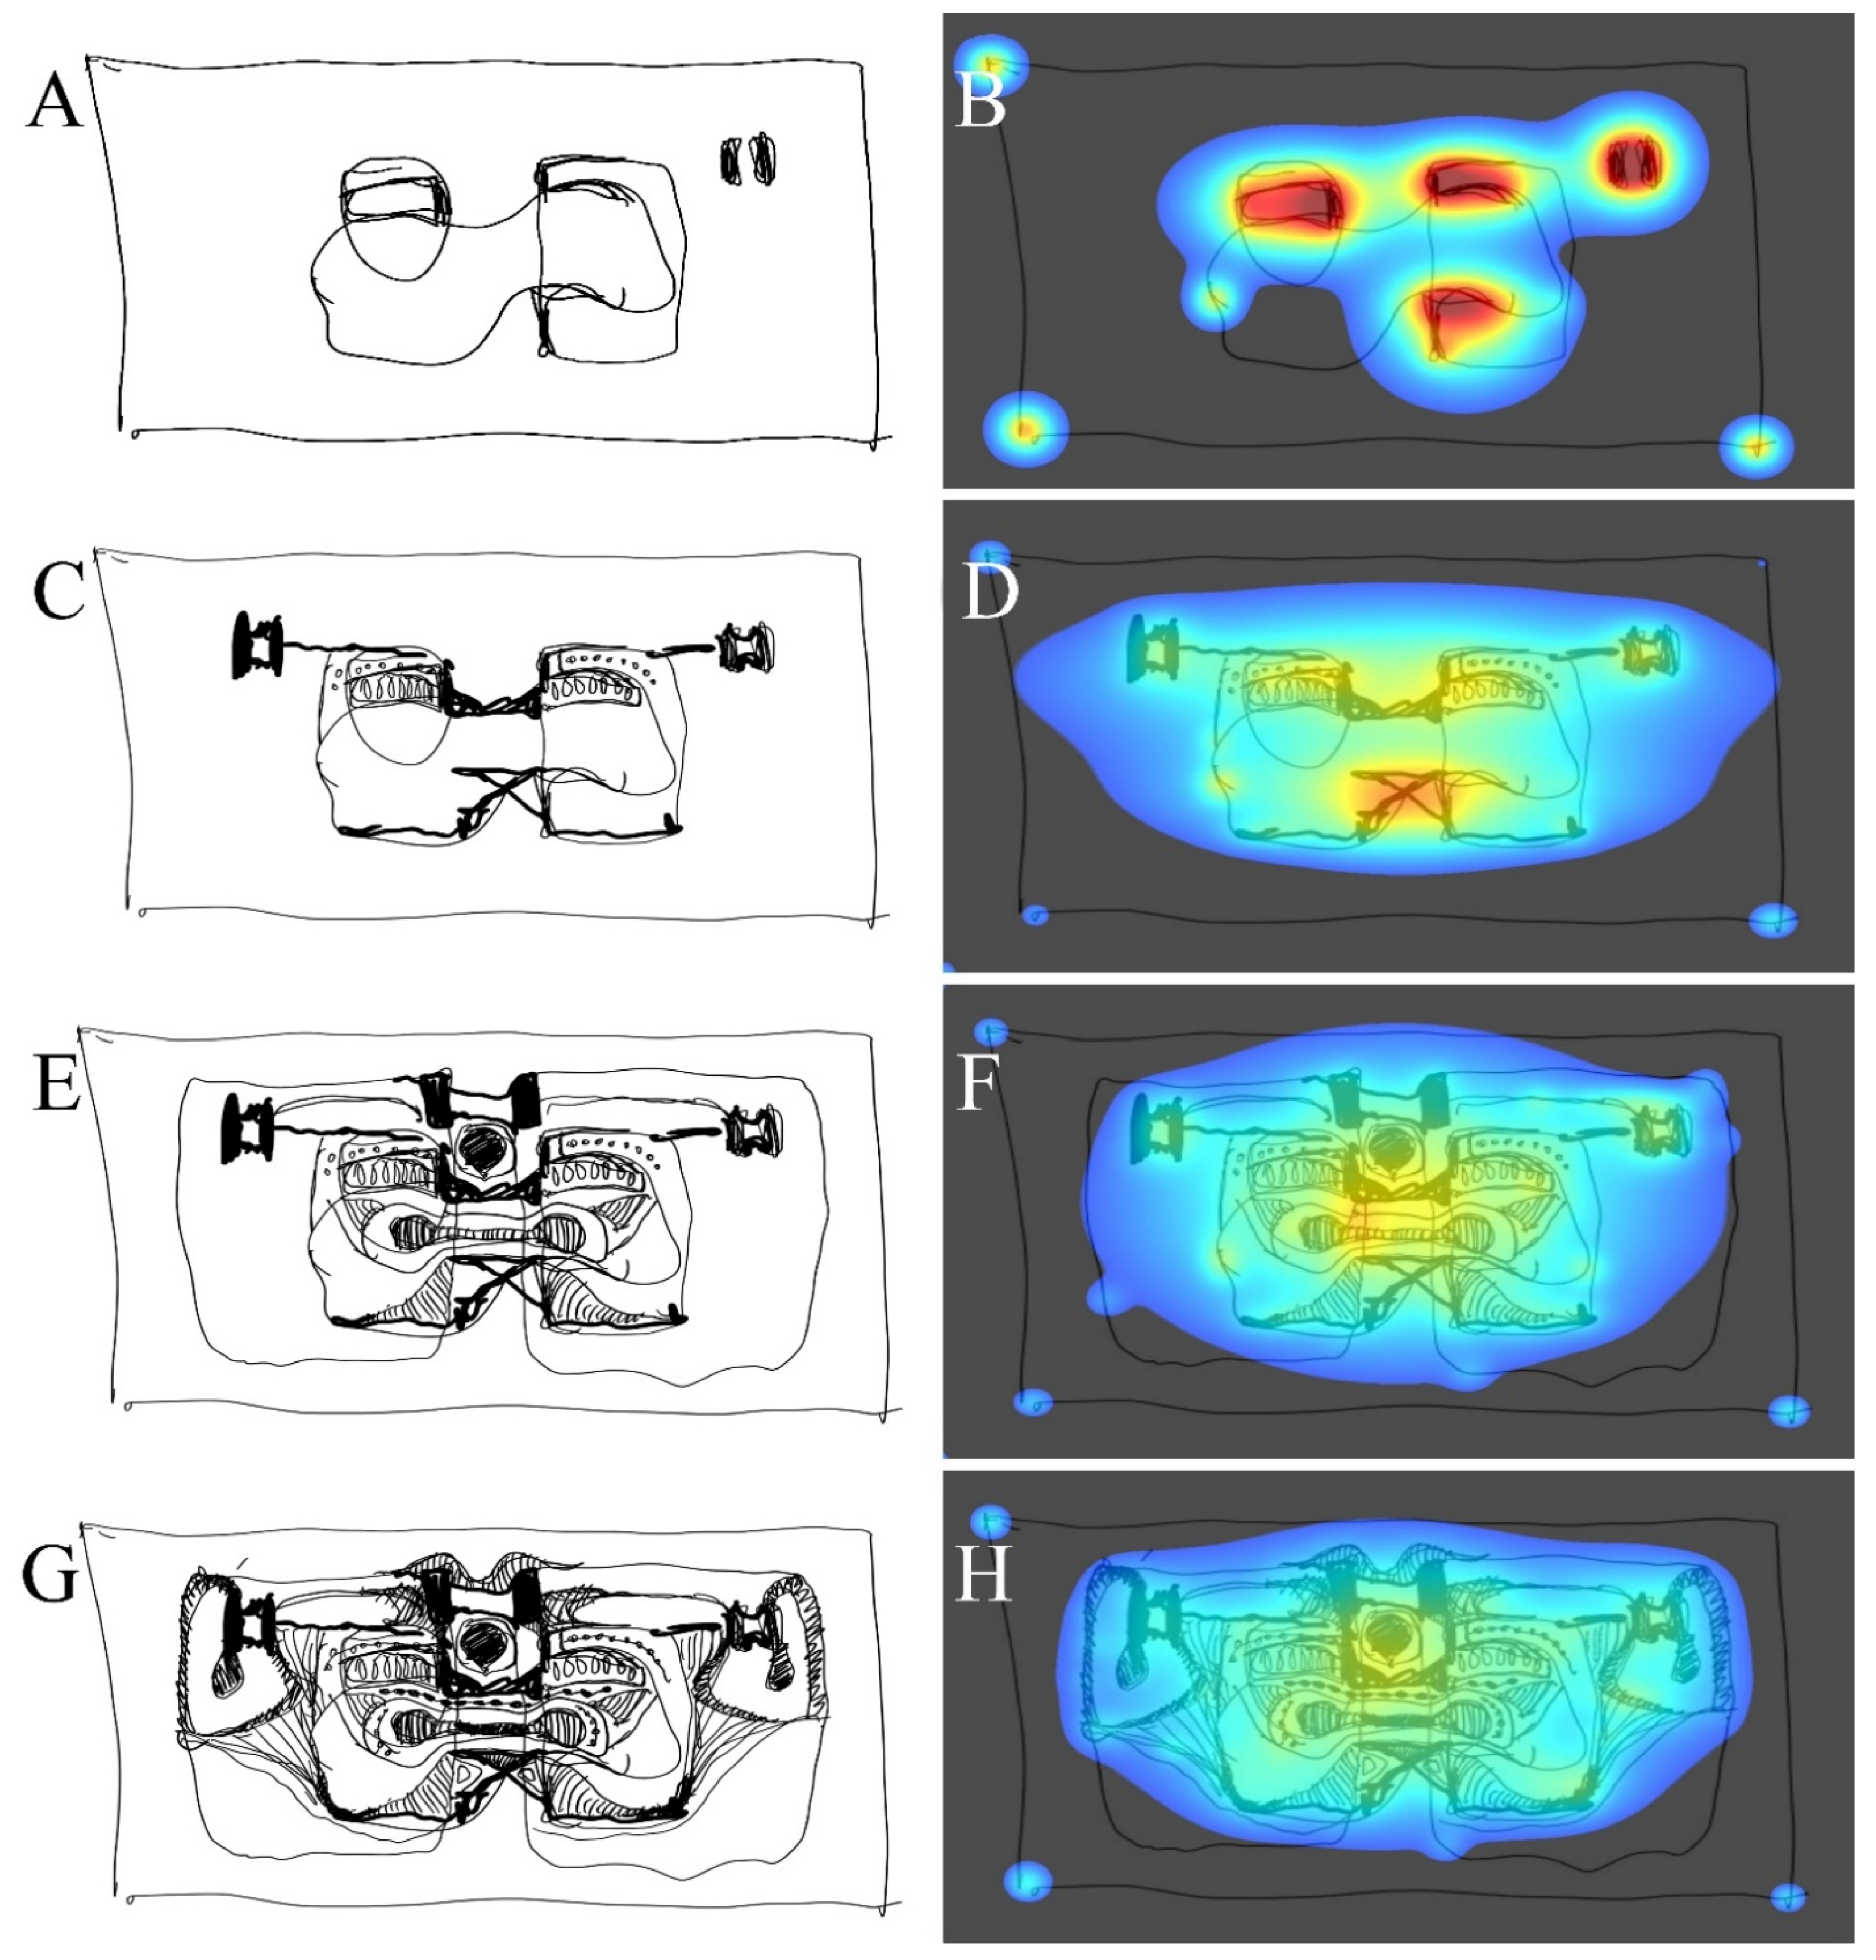
Figure 12 shows how in a sequence of drawings in which contrast, detail, and local symmetries increase dramatically, visual pre-attentive exploration spreads uniformly throughout the field, with no empty areas and no major hotspots. Nested but approximate symmetries hold the eye’s attention. Subliminal visual coherence needs neither precision, nor mechanical, rectilinear forms—only the careful build-up of organized complexity through mutually-reinforcing symmetries. These deliberately “organic” forms fill in the figure, while the visual attention heatmaps reveal a deep contradiction between neuroscience and one century of dominant architectural culture [2,3,6,7,8,9,10,11,13,14,15,16,17,18].
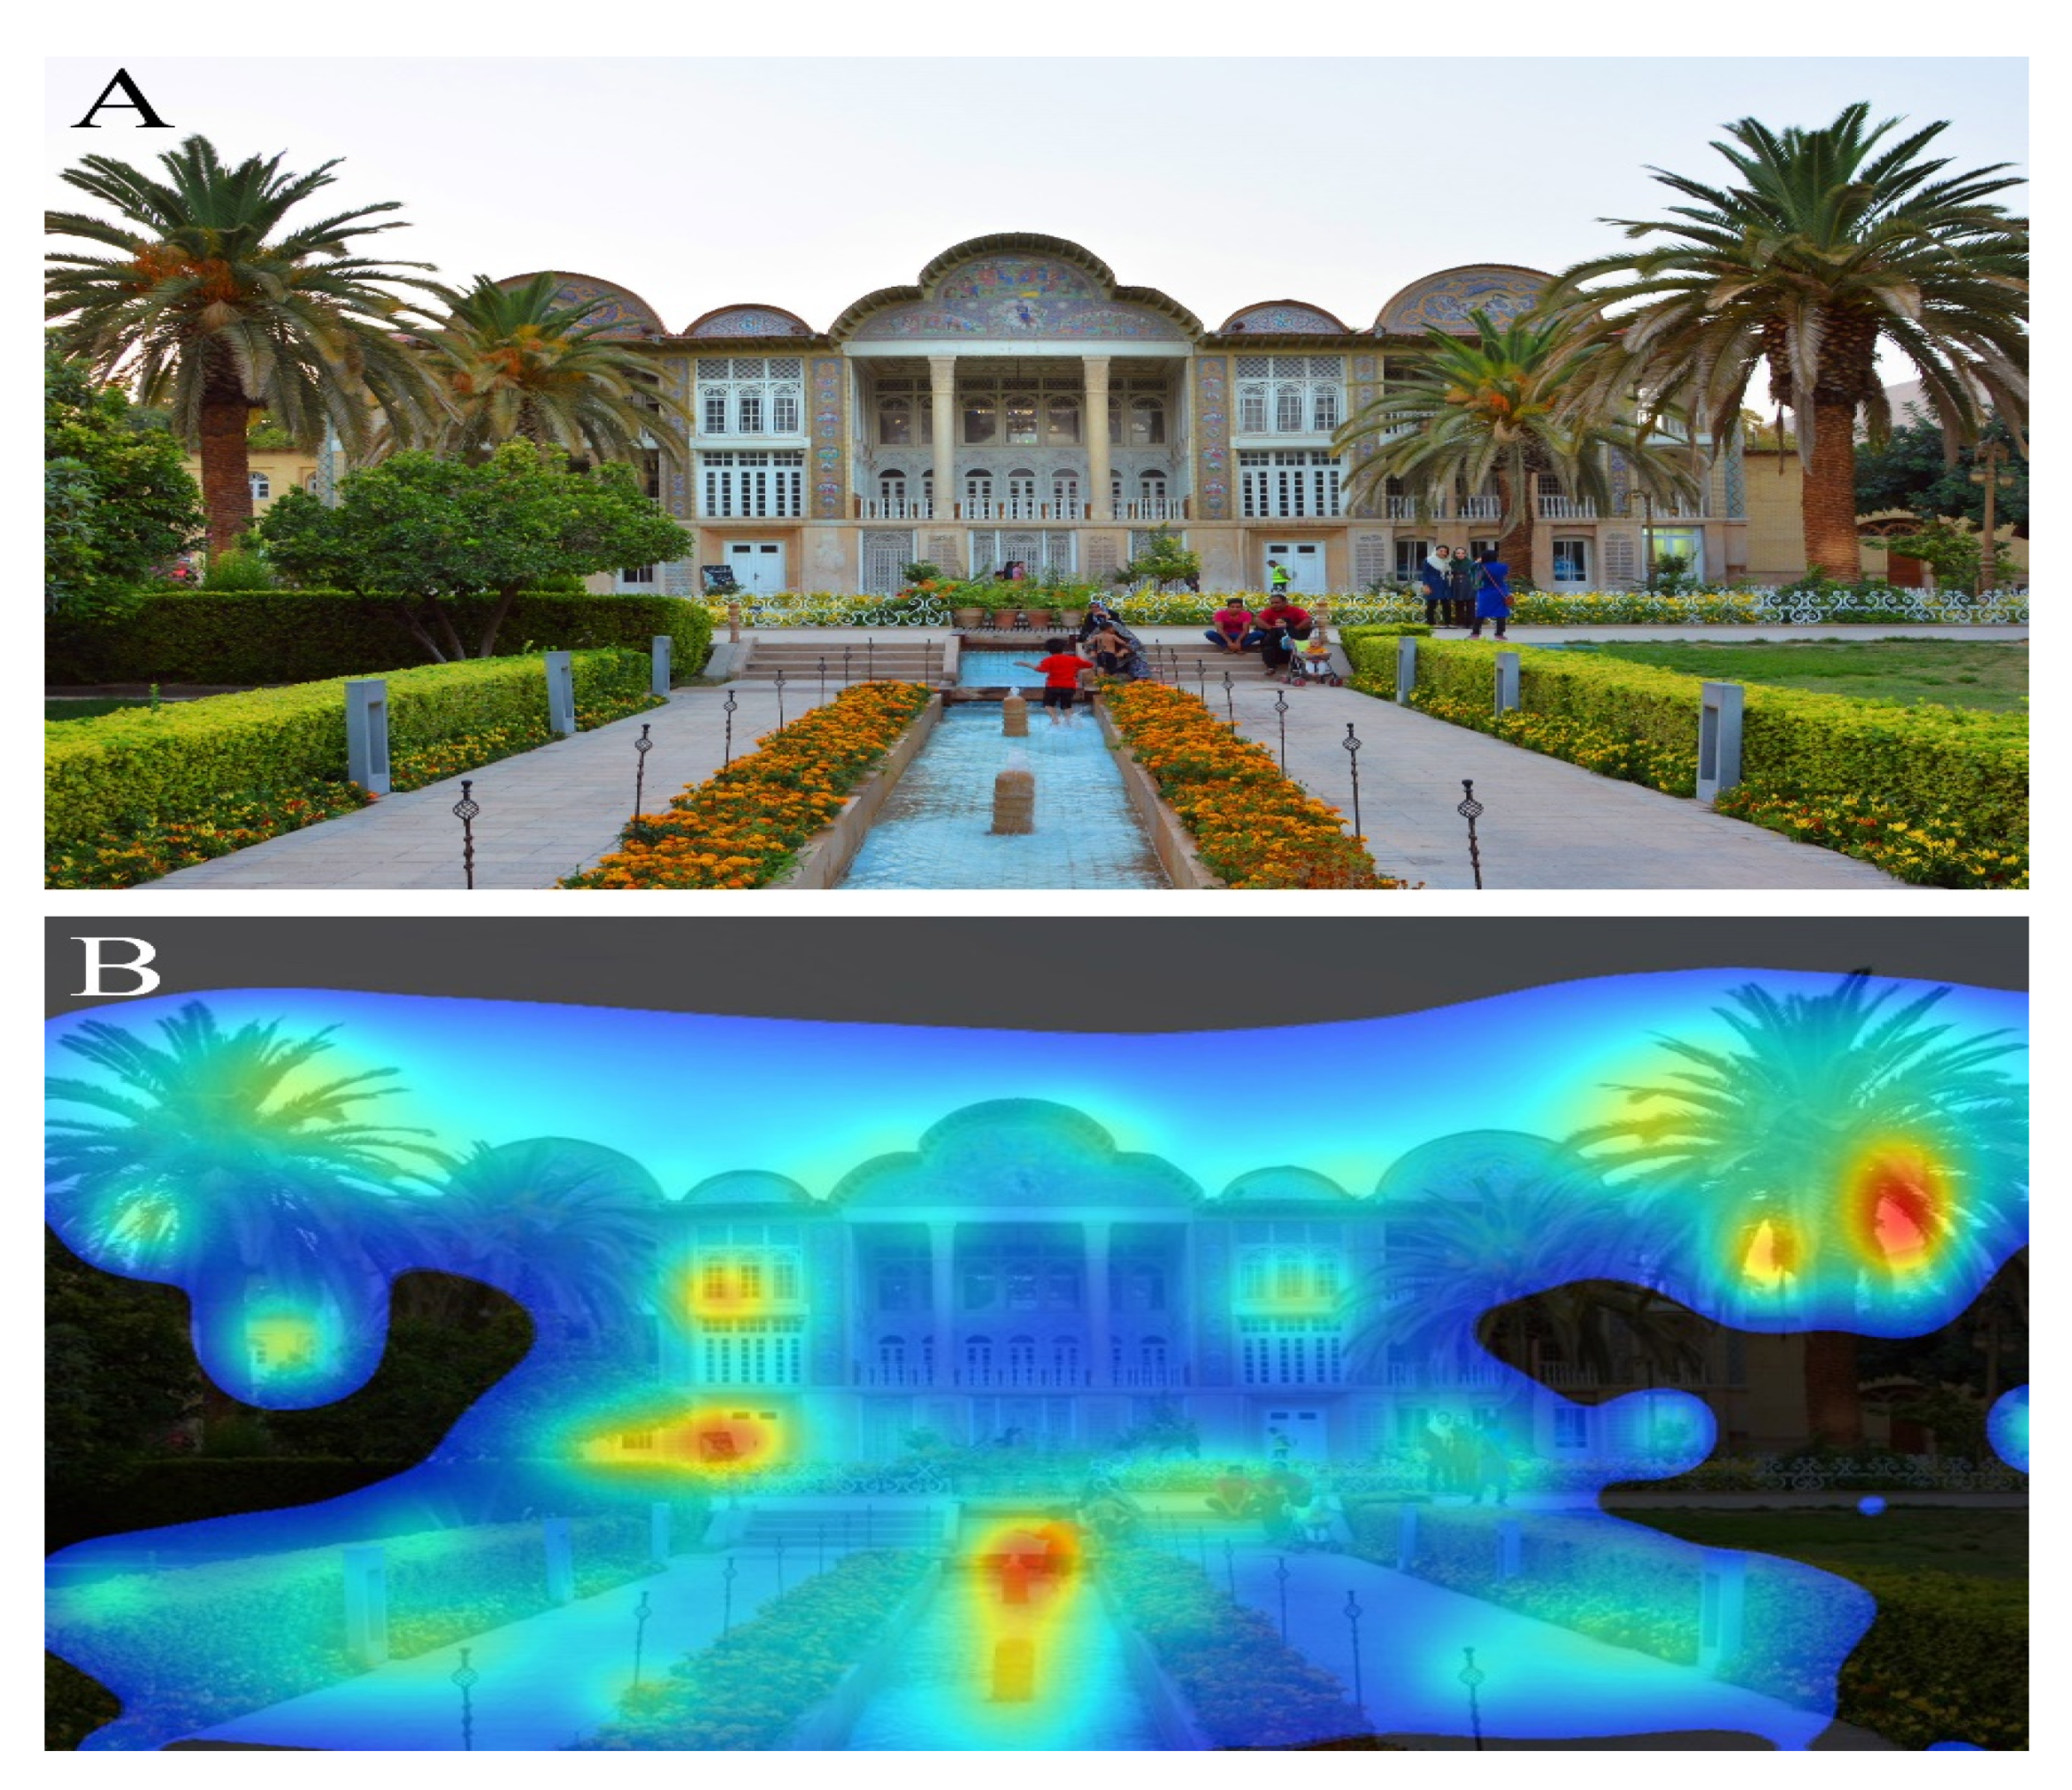
Figure 13 analyzes a photograph of the Qavam House, from the 1870s, in Eram Gardens in Shiraz, Iran. The combination of the architecture, the vegetation, and the archetypal Persian “Paradise Garden” layout of the plan create an overall distributed pre-attentive gaze heatmap, with gaps appearing only under the trees and in the lawn area.
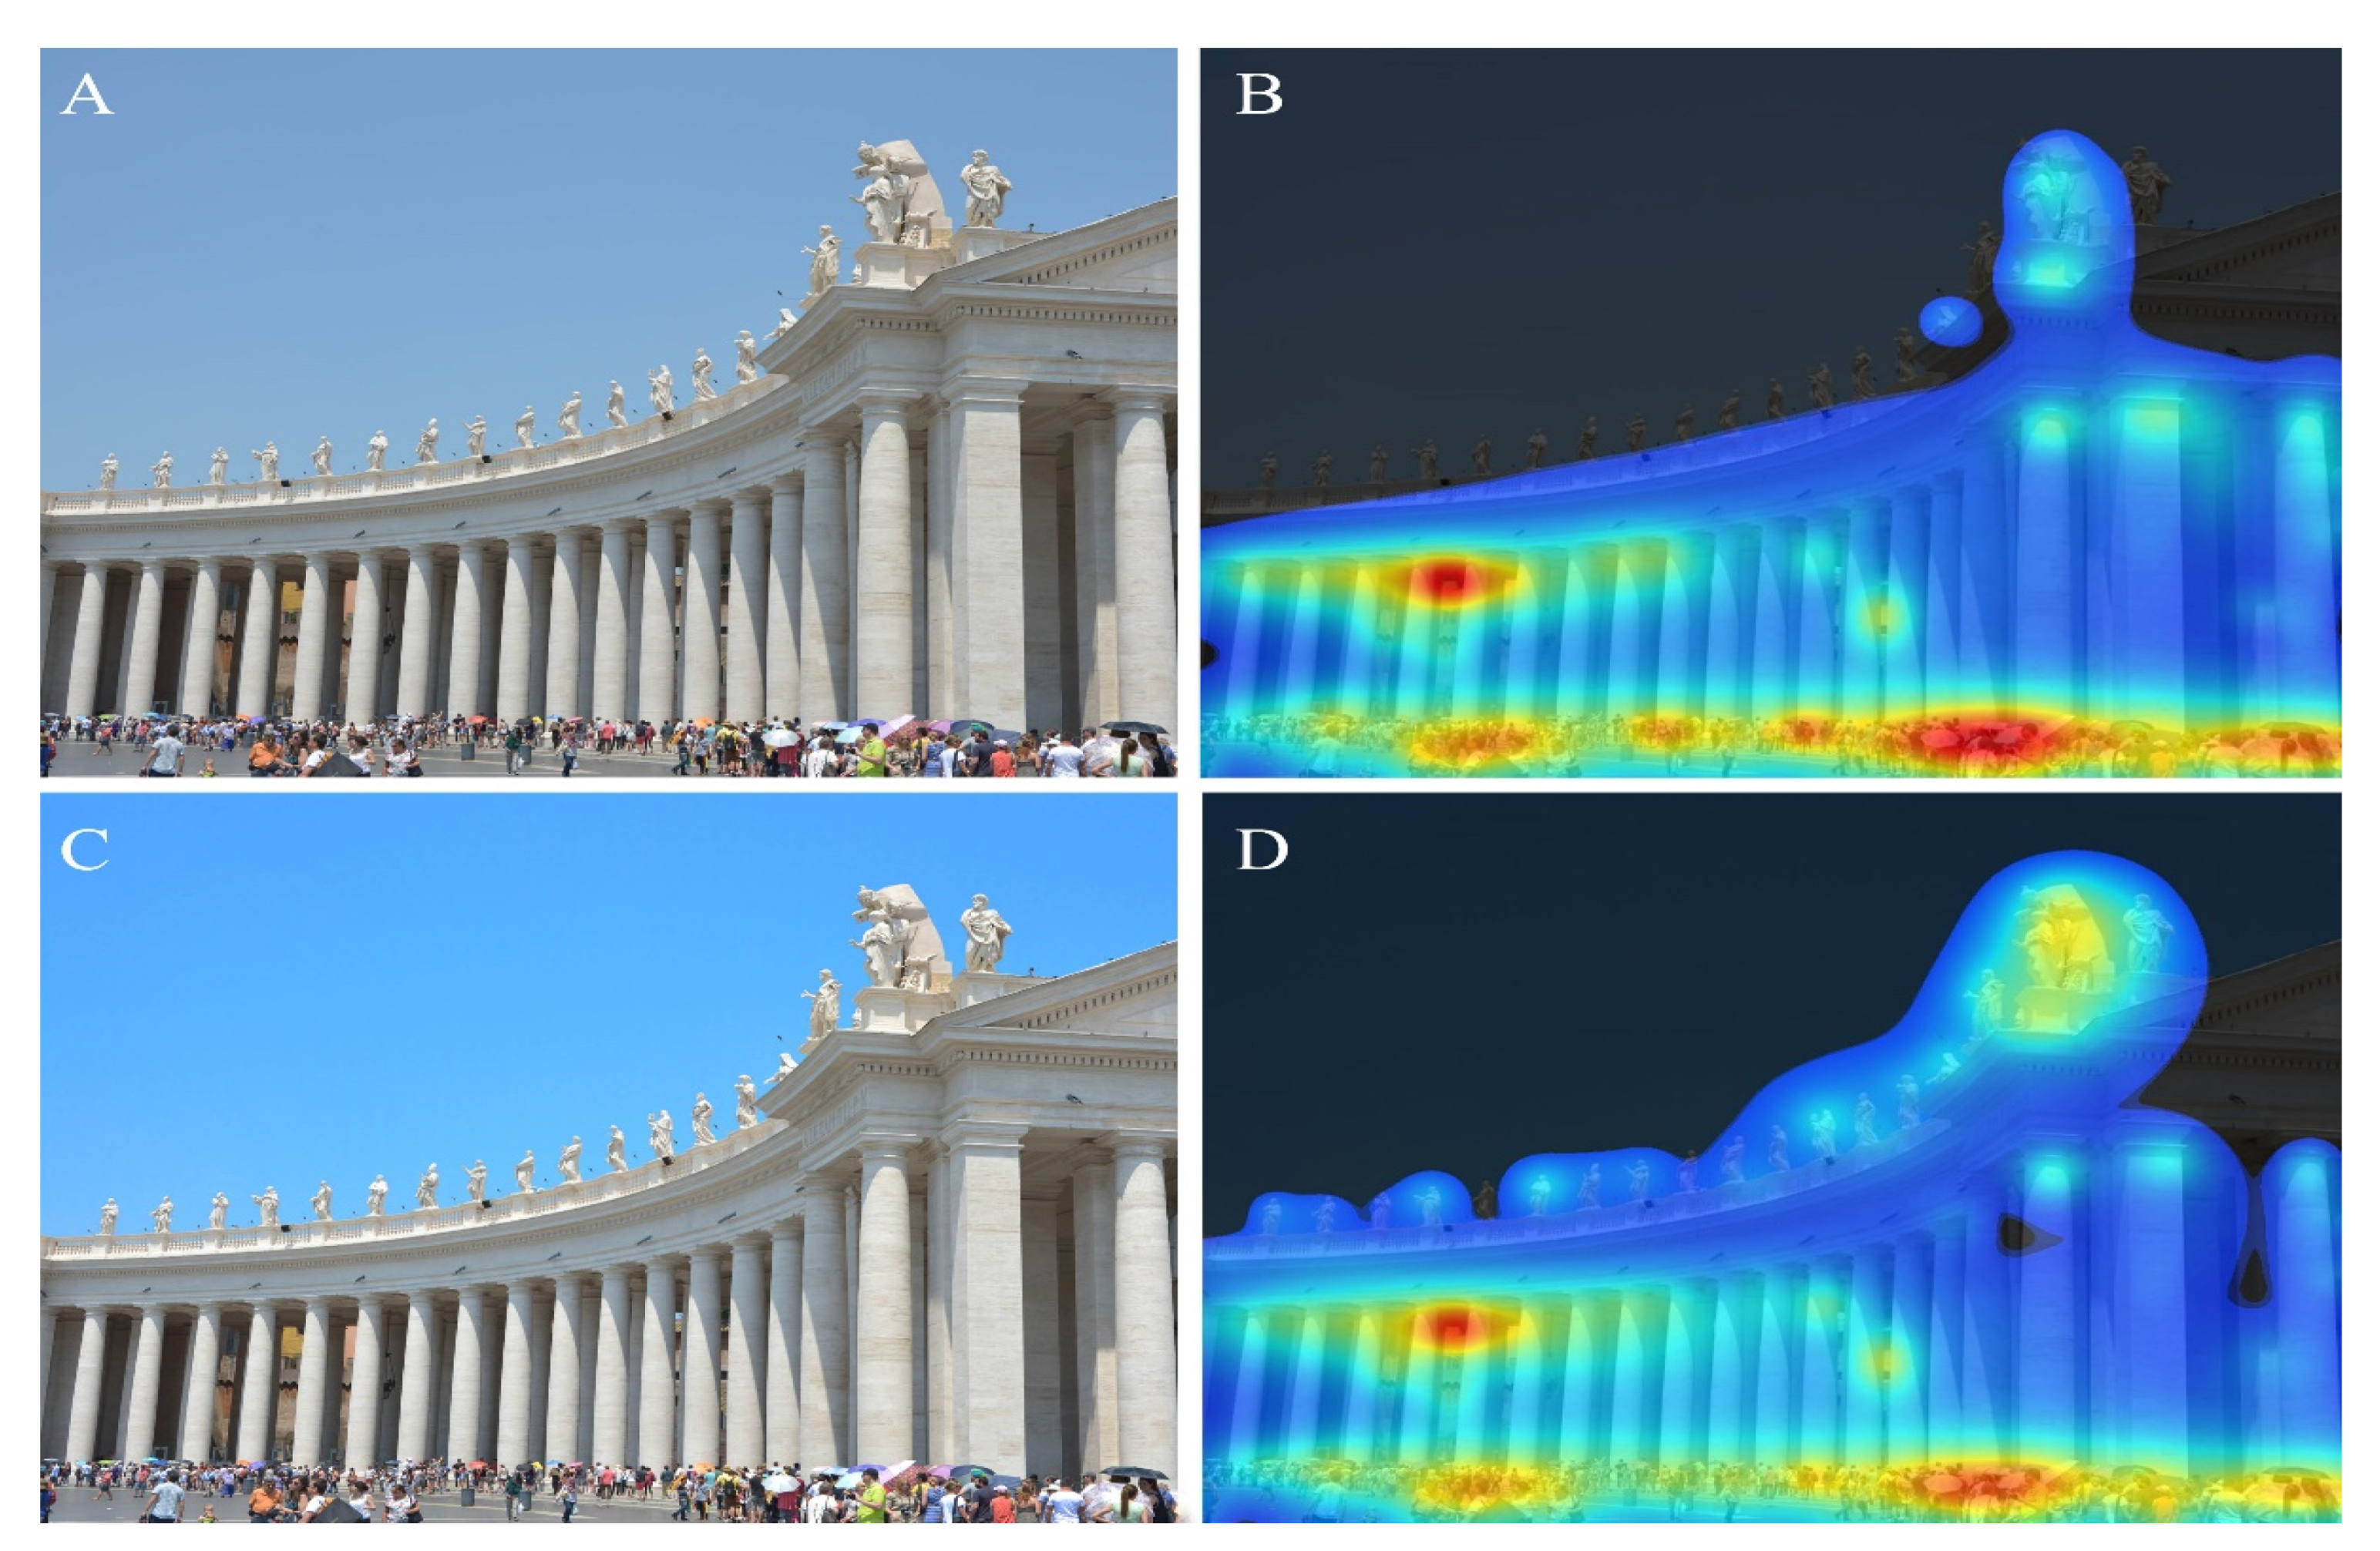
In Figure 14, a partial view of the colonnade in St Peter’s square in the Vatican, Rome, is presented in lower (A) and higher (C) saturation and contrast. In the original photo (A) the contrast between the statues and the sky is not enough for the software to include them in the heatmap (B), whereas after enhancing contrast and saturation (B), parapet statues are included in the uniform field of visual attention (D).
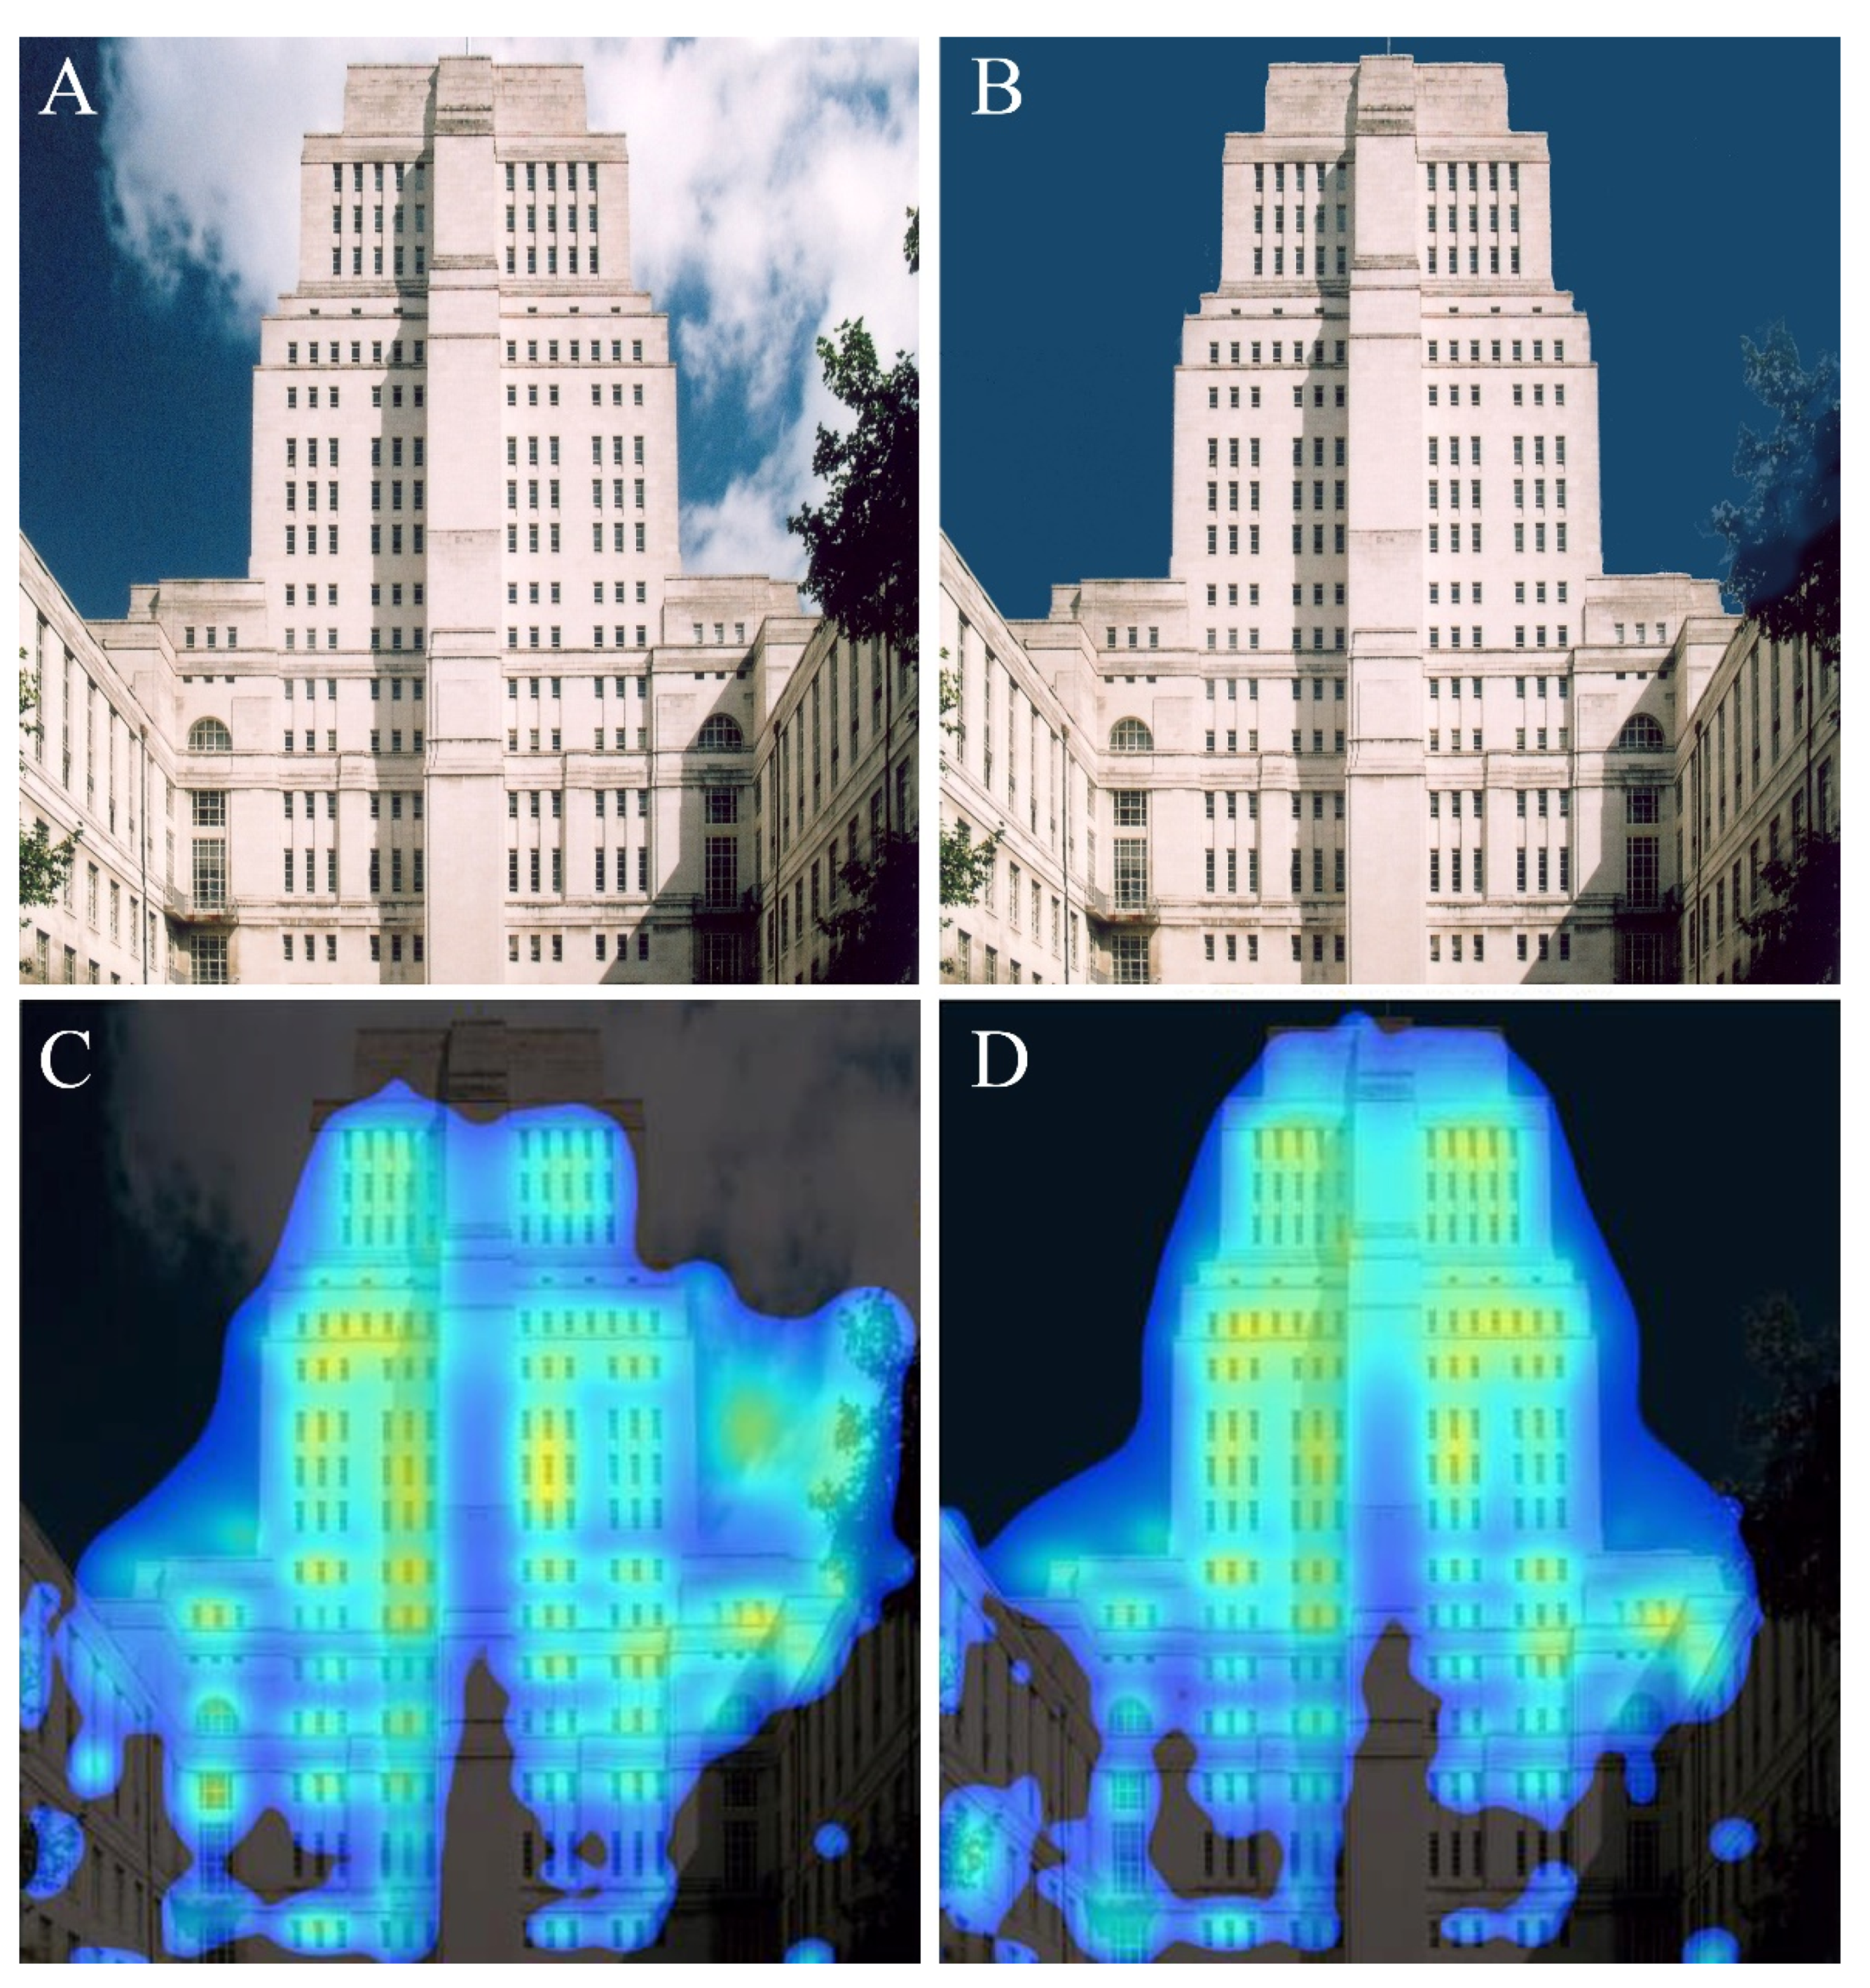
Figure 15 provides another demonstration of how contrast influences a scan, using a photograph of the London University Senate House dating from the 1930s. Here, the white clouds (A) do not contrast with the top part of the white building, consequently leaving it completely outside the 3M-VAS heat map (C). When the clouds are replaced by a solid blue color taken from the sky in the original photo (B), then the top of the building registers (D) much better in the visual attention scan.
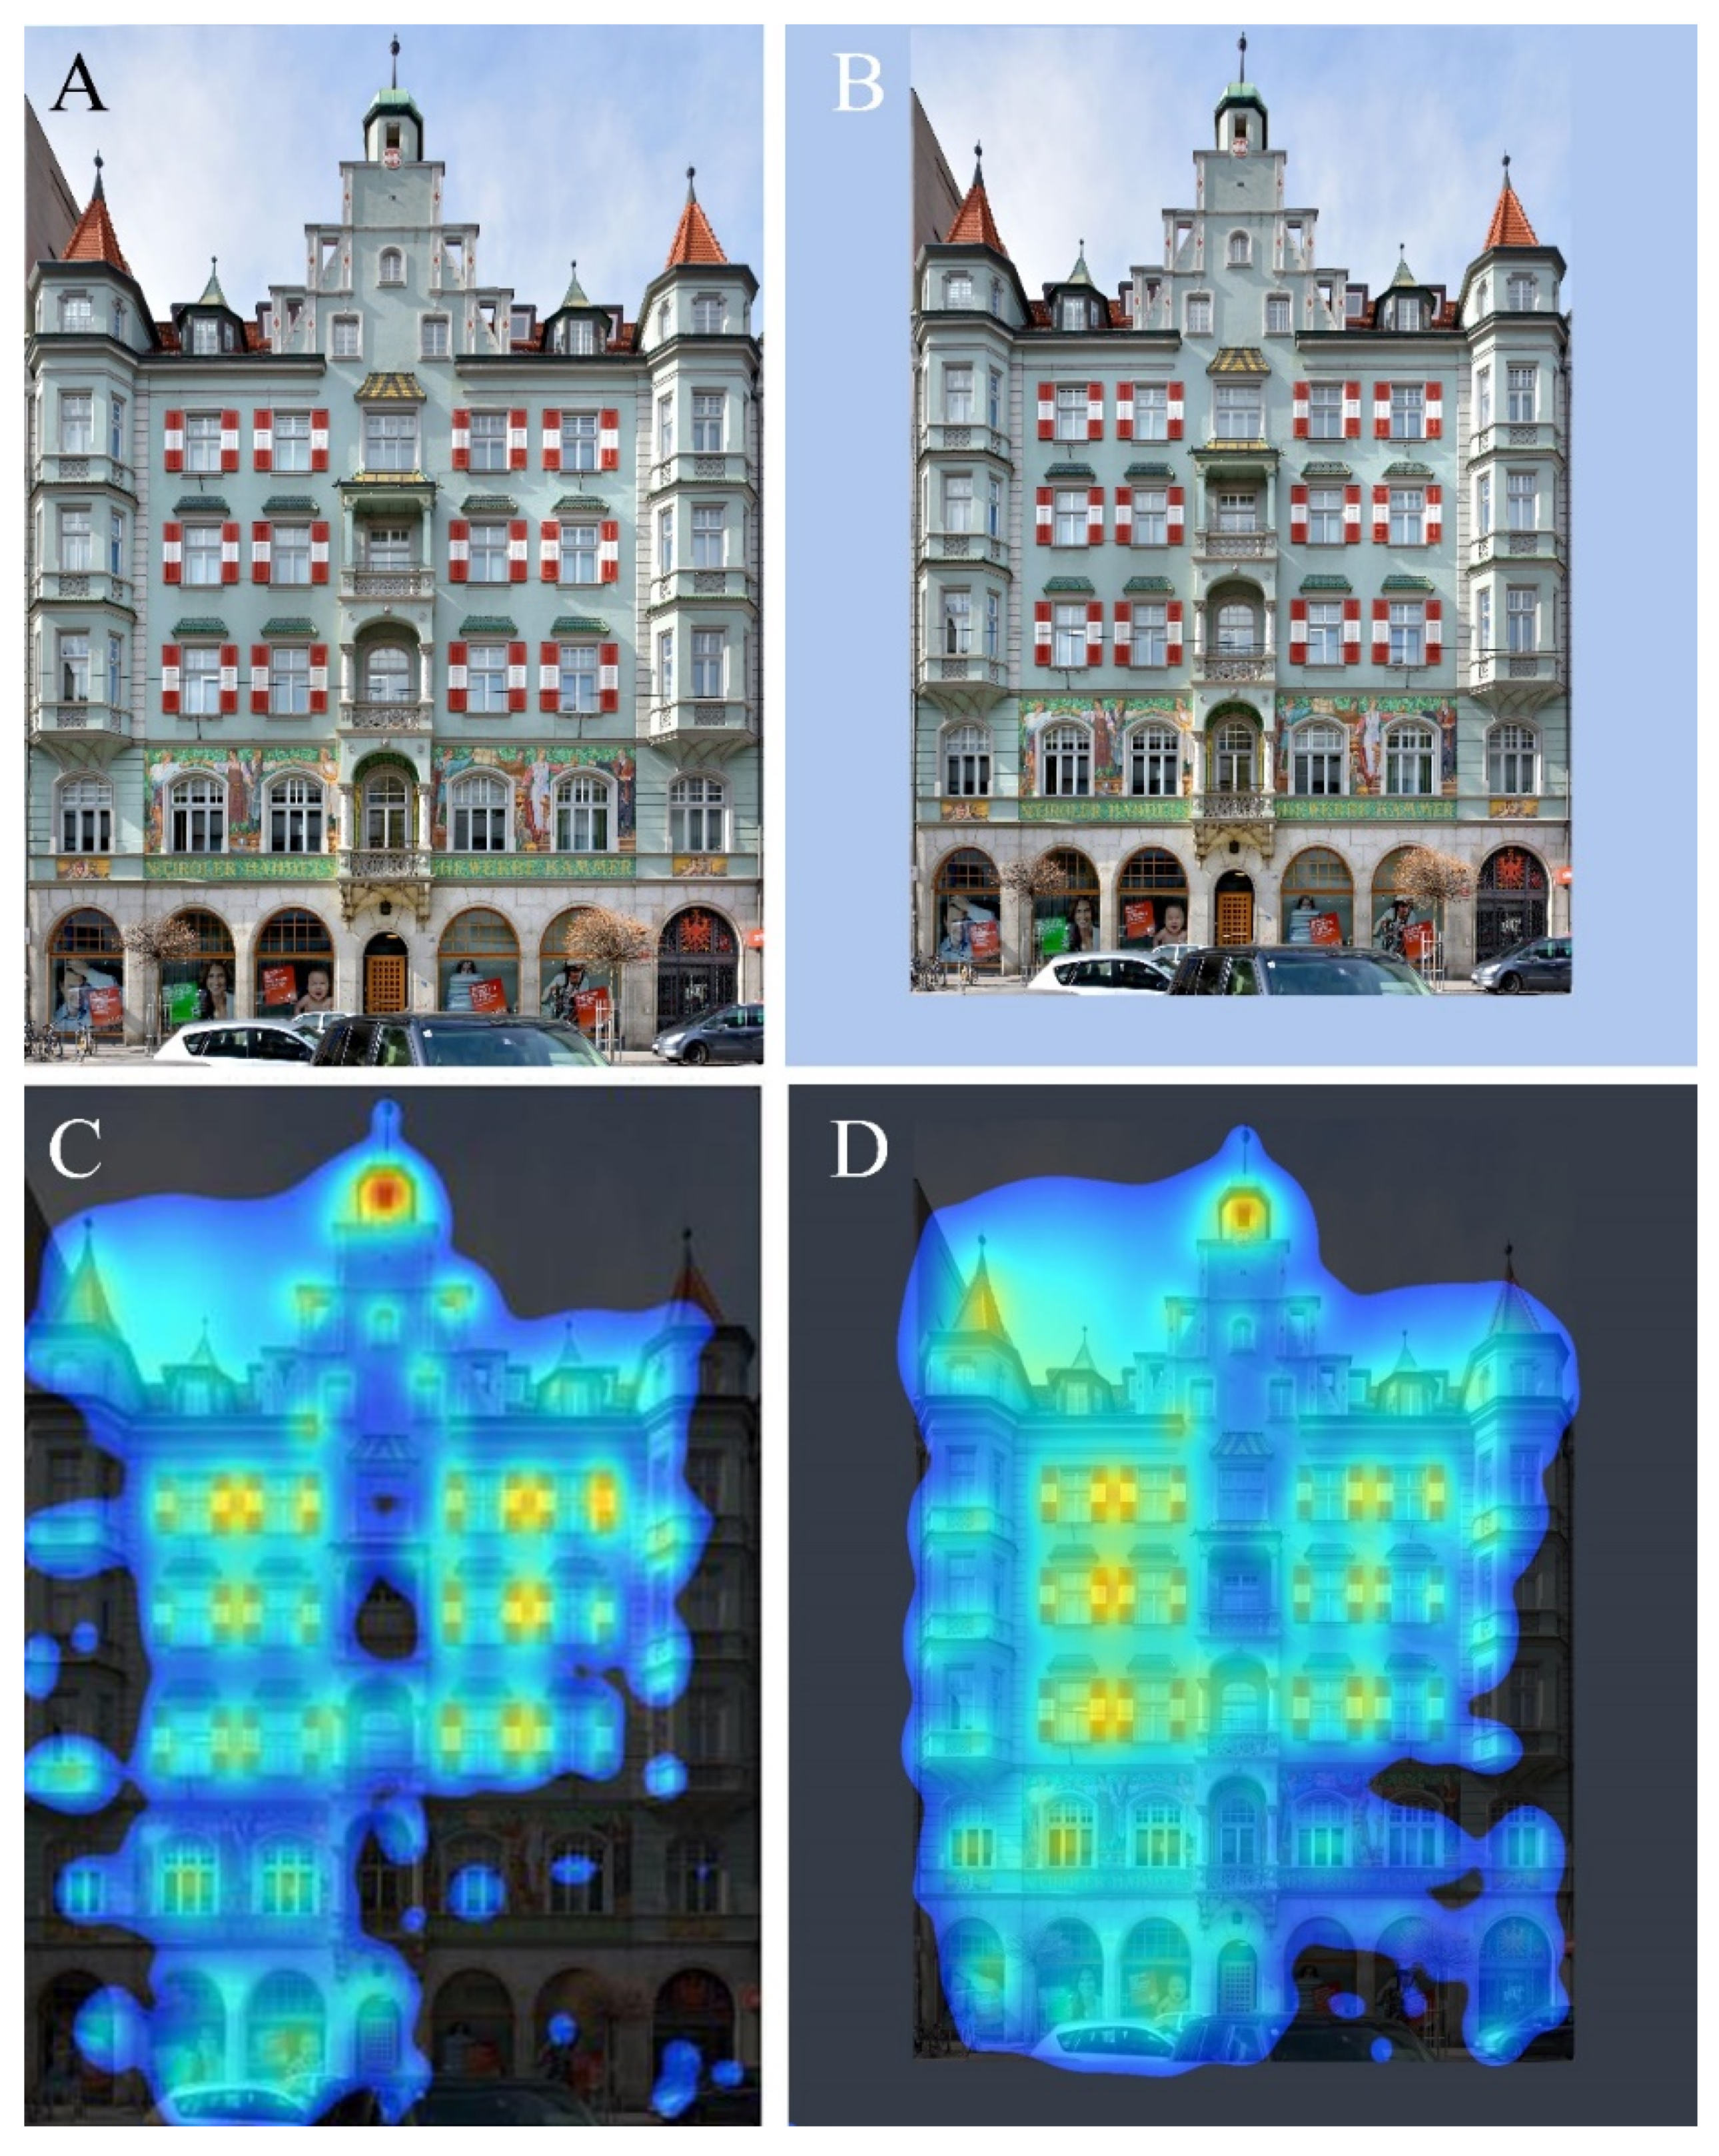
The building of the Tyrolean Chamber of Commerce and Industry in Innsbruck, Austria, built in the 1900s is analyzed in Figure 16. This analysis gives a practical hint for improving the value of a scan by avoiding a common artifact. We have found that adding a plain-colored frame (B) helps the software to concentrate on the image’s interior, in cases when a building is tightly framed in the photograph and we do not have the opportunity to take another more wide angle photograph (A). In the unframed sample, parts of the building are neglected by the heatmap (C), whereas after adding the frame the building is more or less uniformly covered (D). The small gaps remaining in the scan may be related to shadows and the presence of a dark automobile. The image resolution was the same in both cases; in B and D, where the frame was just added, it appears resized here for presentation. This scanning strategy has been used throughout the present study whenever needed.
6. Discussion
Eye tracking identifies the regions of pre-attentive focus on a visual scene in a semi-quantitative manner. It is ideally suited for side-by-side comparisons of different structures, and for estimating their relative coherence. In addition, eye tracking can also give us a good idea of human reactions to single structures, provided the tests are pre-formed in a well-prepared and careful manner. Here is a list of the main findings from the analysis of the images.
- A high degree of organized complexity, defined through nested symmetries, engages the viewer in pre-attentive, unconscious interest.
- Visual engagement distributes uniformly throughout a complex, highly ordered composition, with no gaps and few hotspots in the heatmap.
- Hotspots in a successful composition’s heatmap coincide with points of functional interest such as the main entry, or prominent windows and other central features.
- An unsuccessful (disengaging) composition will show hotspots in irrelevant places such as the building’s corner or edge, or away from the building altogether.
- The way that engagement depends upon the distance of approach is correlated to organized complexity. The most successful examples show fractal scaling, i.e., organized complexity at every magnification, and thus retain engagement in a scale-free manner.
- Plainness and monotonous repetition fail to engage the viewer, resulting in a heatmap with large empty areas.
- A non-trivial structure that lacks fractality results in a fragmented heatmap with gaps, which loses the viewer’s attention.
- The software used here is sensitive to artifacts that might confuse the architectural results. Our suggestions for circumventing those are discussed in the next section.
In all the visuals analyzed in this paper, the presence of organized complexity, with nested hierarchies, draws the computed pre-attentive gaze more and more uniformly (an example is seen in Figure 2). On the other end of the design spectrum, glass-façade buildings with minimal detail are not included at all in the pre-attentive processing stage (glass façade buildings in Figure 1 are such examples). Intermediate situations, where there is some detail but it is based on monotonous repetition, are covered by the heatmap only at specific viewing distances, with the pre-attentive field disintegrating at closer distances, and disappearing altogether at larger distances (Figure 8, for example).
Scanning experiments reveal how engagement strongly depends upon distance of approach. Taking this factor into account underlines the neurological need for fractal scaling—i.e., coherent structure at every magnification—and argues why buildings ought to have nested levels of scale. The reason is that no other geometric arrangement can feed the nervous system smoothly as we move toward a structure. Fractal scaling fits how humans move—specifically their ambulation—and how the brain craves to see more details as we get closer in, facilitating our approach to the architecture. An essential requisite for building humane places is that the geometry tells us we are heading in the right direction. We need to see fractal scaling, organized complexity, and repeating symmetries, otherwise the brain slips back into a default vigilant state. But then we do not feel safe in a place and cannot be social, particularly when outside.
Figure 9 sheds light on the decades-long debate of how the introduction of stylistic minimalism has affected the human psyche. Not all readers might be aware of the central position this question occupies in academic and professional circles, without ever achieving an evidence-based resolution. Results effortlessly obtained here through machine learning and biometric algorithms contribute to settling an important issue that affects all of humankind. The built environment’s progressive loss of fractal qualities serves to disconnect us from the experienced world—the lack of ornament and detail creates the dissociated state that is the hallmark of modernism [15,31,32].
In Figure 10, the result shows powerfully why detail, revealed at different scales, matters so much for the pedestrian; it draws them into the scene pre-attentively by feeding the brain the stimuli it needs to most easily move forward. Walking is best done with automaticity, without having to consciously think about it; the detailed tile work here (Figure 10) enables this behavior effortlessly—otherwise known as positive affordance.
The analysis of Figure 6 raises key questions about materials. Pre-attentive processing data at different distances tell us about the varying impression a building has on us. Some expensive materials, like marble, convey a sense of luxury once we have consciously identified them, even if we do not notice them at first glance. Past a certain proximity of approach we will engage with those details at the pre-attentive level. Yet material texture cannot compensate for the lack of mathematically appealing design features, unless one views the building close enough to discern this texture clearly.
The unconscious attraction of naturalistic ornament in Figure 10, which represents only one component of Biophilia, points the way to a future application of eye-scanning and simulation software to classify different material surfaces. Perceivable biophilic elements, both tactile and visual, will trigger engagement at the closest distance, thus enhancing the positive user experience. This will not occur with textureless (smooth) or randomly textured industrial materials (e.g., brutalist concrete).
The examples shown in Figure 3, Figure 4, Figure 5, Figure 6, Figure 7 and Figure 8 suggest a more in-depth examination of the effects of stylistic juxtaposition (for a future study). Strikingly distinct responses to the renovated portion of a historical building, or to a newer building erected next-door, revealed a marked preference for a high degree of organized complexity. The present findings therefore question the standard practice—now enforced by law—whereby a newer building has to contrast stylistically with the original as much as possible. What we find is that such distinctness is invariably achieved not by permuting the geometrical coherence, but through eliminating nested symmetries altogether, and this has significant consequences for user perception.
In Figure 3, on the ground floor of this very simple and non-ornate old building (C/D), there is a niche where normally a sculpture or decorative object would be placed, but which is now empty. Interestingly, this area receives the least pre-attention coverage on the building, creating a small gap that presumably would not be there if a sculpture were indeed in place as originally intended. The Sierpinski carpet (Figure 11) is used as a way to test the extreme end of the recursive morphology spectrum. This represents a precise geometric fractal [33], unlike those more statistical fractals found in nature or architecture, and has been previously studied in the context of the theory of centers [34]. Here, we see that the predicted pre-attentive visual scan behaves exactly as expected, confirming that it is not familiar with known forms, but an innate reaction to their geometry, that drives our pre-attentive response to them.
In Figure 12, the successive addition of complexity in a design, as long as the whole remains highly organized, adds instead of detracting from unconscious visual interest. The frame is of no consequence, and is included only to reveal whether the eye would avoid the design’s interior and jump instead of the outside (as happens in many of our other scans). This sequence of sketches illustrates Alexander’s argument for our visceral attachment to coherent complex structure. Researchers using eye tracking do not refer to geometrical coherence, nor do any of the companies that provide visual attention software. Yet this is a key finding of the scanning analysis.
The software does not give us an absolute measure of the coherence of a design or structure, but it can inform us about it in a semi-quantitative way. It is especially useful to compare images of two different structures side-to-side in one larger image (either by chance juxtaposition, or artificial editing). Eye-tracking then distinguishes which one of the two halves is most likely to draw attention, as has recently been shown by one of the authors [31]. This result goes back to link to Alexander’s “Mirror-of-the-self” test [3], as preferences in the side-to-side 3M-VAS pre-attentive scan were shown to be correlated to eventual preferences in this test, which reflects conscious choices. For Alexander, the more intense the field of centers becomes because of overlap and mutual reinforcement, the higher the degree of life. So, with 3M-VAS we do not measure in an absolute way the “degree of life”, which is so important in Alexander’s theory; there has been research dedicated exclusively to this measurement [35].
7. Methodological Considerations for Optimizing the Results from 3M-VAS Scans
Based on our experience learned from scanning experiments, we offer some hints below meant to aid researchers wishing to extend our own results. These are simple techniques for avoiding artifacts produced by the software, which could complicate the architectural interpretation of the resulting heatmaps. These suggestions do not speak against the 3M-VAS software, but are simply helpful aids to applying it in its current implementation. Perhaps some of these artifacts will be easier to control in future releases. Such complications do not appear in real eye-tracking studies.
- (i)
- Clouds: In Figure 1 and Figure 15, clouds attract a certain amount of pre-attentive gaze because of their fractal outline. The cloud outline in an image is likely to divert pre-attentive gaze from the building of interest; this is in addition to reducing the contrast of the outline of a white or very light-colored building. Replacing the clouds with a homogeneous blue background sampled from nearby clear sky areas is the best way to avoid both of these issues (Figure 15B). Dispelling that this is in any way a limitation of the software, the photographer could wait until the clouds have cleared. Our suggestion is meant to facilitate scanning experiments with an existing picture.
- (ii)
- Regions in shadow: The shaded area of the building in Figure 1 does not attract much attention, not because the building is lacking in detail, but because of the low contrasts created by those details, as visualized in the image under these lighting conditions. Shadows on any part of a building cause that area to be incorrectly scanned. This point is also illustrated in Figure 2: increasing the brightness and contrast of a wing that is in the shade makes its details more visible to the software, resulting in its inclusion in the heat map. (Or one could seek a picture taken at a different time of day when the region in question is not in shadow). These two images (Figure 1 and Figure 2) illustrate an important point that should be kept in mind by an investigator using the software: the dynamic range of digital sensors, and also the dynamic range of film, in case of scanned film images, is lower than that of the human visual system, and only images acquired using the high dynamic range (HDR) method approach the eye’s dynamic range [36]. In a real-life scene, the observer will have no difficulty looking at either shaded or illuminated parts of a building, perceptually counterbalancing the luminosity difference and perceiving the form as a whole. The software, on the other hand, sees an area of considerably lower intensity, and registers it as a dark area. Therefore, there should ideally be a bright, even illumination on an examined building, and when two or more buildings are compared in a scene, that they are all equally well illuminated.
- (iii)
- Contrast: Contrast, either in intensity or color, is important for the software to correctly register the building’s forms. This point partially overlaps with the shading issue, discussed above. Color saturation is another factor, which promotes clear distinction of forms of different colors. In Figure 14, increasing the saturation of a sharp but low-contrast image makes the statues readily discernible. In Figure 15, removing the clouds and replacing them with a uniform blue background color, sampled from areas of blue sky, better reveals the outline of the white University of London tower.
- (iv)
- Framing: If the building or structure of interest is tightly framed in the image, a new, monochrome frame could be added, preferably using a color sampled from the sky, to avoid peripheral parts of the building receiving less “attention” by the software (Figure 16). This intervention actually resembles the real-life situation in which we are viewing a building more faithfully, where it normally does not occupy all of our visual field.
- (v)
- People: People are always looking for people, and this is illustrated in Figure 1, Figure 2, Figure 7, Figure 8, Figure 9 and Figure 14. This attention bias prioritizes persons in a scan. While possibly interesting for some analyses, it is worth keeping in mind if one is interested in recording pre-attentive reactions to a building without any hotspots specifically related to human presence.
- (vi)
- Distance: This paper drew attention to the effect of distance, and how, when there is enough complexity, moving closer just reveals more of that complexity. A comprehensive analysis of a single building should ideally use a sequence of image scans taken at different approaches. In buildings that do not have enough organized complexity, then the closer you are, the less coherently they will register. The corollary is: the more organized complexity the building possesses, the more difficult it is to see it break down at close distances.
A comparative study works best when images are taken from the same angle. Moreover, it makes sense to contrast the relative coherence of two buildings using photos taken from the same apparent distance. A meaningful study should use photos with high enough resolution to display that complexity, otherwise the software will miss the finer textures of the buildings being compared—for example, individual bricks and tiles should be easy to discern. The image should be sharp, not an upscaled low-resolution image, as lost information cannot be retrieved. If the image blurs textures on a very basic building, there is nothing much left. Of course, since color plays a role, it should be clearly shown. You do not want the software to effectively see only a simplified version of the building.
Altogether, eye-tracking apparatus and visual attention simulation software provide us with a highly useful tool for evaluating design, and for understanding the world. There are two aspects to this development. Eye-tracking simulation software acquires a deep theoretical foundation from the “field of centers”. This paper concentrates on its practical applications, but in fact those give the motivation for other researchers to develop the theoretical implications in greater detail. Conversely, Alexander’s original theory, which led him to develop a very powerful design approach, is supported by a practical tool that is easily understood and can be implemented by everybody. The next section explains Alexander’s theory in more detail.
8. Christopher Alexander’s “Field of Centers”
A revolution is occurring in how we understand and do architecture. Four decades ago architect Christopher Alexander developed the “field of centers” to explain how physical space attains coherence through structure in overlapping regions. He called geometrical components or elements “centers” instead of “objects” because he wished to emphasize their connectedness and interrelatedness to every other region [3]. He especially wanted to break out of the mechanistic thinking in terms of isolated entities, despite a long tradition in our visual culture, because that is not an accurate description of the real world. Each “center” focuses attention into itself, but never detaches from its surrounding centers. Strong centers result from many overlapping centers—again, emphasizing the phenomenon of interaction and not isolation.
Alexander’s theory, dating from the 1980s and published in The Nature of Order [3] never caught on because of its abstractness—and also because architecture was isolated in its own stylistic pursuits. The profession has for decades been largely unconcerned with the immediate and evidence-based physiological response of users to a building’s geometry. The formulations of complexity proposed in Alexander’s The Nature of Order instead found fertile ground in computer science [37]. This neglect now changes, as eye-tracking has re-entered the field of design through portable apparatus and simulation software. We claim that eye-tracking reveals a representation of the “field of centers”.
These concepts can be used for architectural education and practice because Alexander’s work outlines a method for generating the “field of centers” in a design or structure [3,31,38]. This well-developed design toolkit is independent of pre-attentive processing, and both physical eye-tracking and eye-tracking simulation software can serve to check a successful result. The mechanism for achieving geometrical coherence is an algorithm for quickly selecting an adaptive design from among an infinite number of possibilities. Visual attention scans complement this search of solution space by providing feedback on each step in the process—whether it is approaching a solution. Even though the 3M-VAS results are only partial, and do not convey the whole process, the availability of easily performed heatmaps is a significant advance in the design field.
Alexander did not anticipate 35 years ago the remarkable development that is the availability of this type of software. He did not have the tools we have today, but he intuited the results nevertheless. This is arguably the first major revolution of design theory since Alexander first formulated his ideas on how geometrical coherence engages our attention without conscious analysis. The eye is attracted unconsciously to evaluate a design, during the first three to five seconds of pre-attentive gaze that processes visual details, configurations, and symmetries.
Those visual qualities contributing to a uniformly distributed heatmap correspond precisely to elements of Alexander’s “centers”. Superimposed onto the overlapping centers are additional preferences for specific bilateral symmetries about a vertical axis (the “face” attraction). This vertical axis bias is due to our evolution and adaptation to gravity for our locomotion and balance. Moreover, as a result of our evolution, as reading facial expression confers a survival advantage, we have groups of specific face-recognition cells, and those respond more intensely to faces than to other non-face-like or non-symmetric patterns [15,32,39].
While Alexander does not explicitly mention face-like symmetry privileging the vertical axis, all of his exposition of the field of centers includes bilaterally symmetric components with a vertical axis of symmetry. Therefore, Alexander was definitely aware of those extra selection mechanisms, even if he did not document them. We can now show through science and technological tools that what Alexander predicted was entirely accurate.
The field of centers is essential in determining how the environment is perceived and actually used. We are attracted to experience “centers” that are complex combinations of structures, and not just the isolated structures themselves. This occurs in two stages simultaneously, but is separated here for the purpose of discussion. First, the design and structural details merge and overlap to produce a “field” property of organized complexity, which is how the eye–brain system perceives a visual. It is only afterwards that an observer begins to analyze specific details of a complex composition.
Second, the design itself overlaps with the observer to establish a strong yet unconscious connection between user and environment. The human brain is a potent “social engagement system” with more of our neural hardware devoted to face perception than the perception of any other visual object [40]. Effectively, this means that perception is relational; people are hardwired for one-to-one interaction. The world’s most nourishing places make one feel connected to them, with the same intensity we connect to other human beings and pet animals [3,31]. We believe that this is what Alexander was getting at; and to which we are now able to lead with the Neuroscience.
For example, we are drawn instinctively to a room corner with light and color on the wall, and not to an individual chair just because it is made for sitting [3]. The way we actually react to environmental geometry is very different from what is commonly assumed. A strictly mechanical interpretation of the world, and of humans as machines using what they are supposed to use—other objects designed for them—denies the complexity of the perception that is the essential quality of human nature. Eye-tracking experiments or software simulations reveal subliminal reality and explain our unconscious interactions with the environment.
9. Coherence, Disconnection, and Threat
This section touches briefly upon questions that many people, particularly architects, might ask. We summarize some results and conjectures that will be treated in more detail in separate publications. These remarks should underline the power of eye tracking to change how we analyze and teach architecture. Since most designers do not understand exactly how people’s innate responses work from the neurological point of view, we need to show them parts of an explanation. This topic depends upon the time intervals for perception, which are not examined in this paper.
Visual coherence promotes easy computation. Whether the result of this computation will be a fear response, or whether it will lead to attraction, depends upon the specific stimulus. If the stimulus is a Lion, it promotes an unconscious fear response first, which is followed by consciously realized fear, when the stimulus is further processed. A building with a coherent design promotes gaze attraction, which will also be followed by the relevant conscious reactions. This is because of the two separate visual streams discussed earlier in Section 3. Therefore, fast processing is helped by geometrical coherence.
Human response becomes clearer when we realize that it actually depends on these two mechanisms, as well as upon different time scales. Pre-attentive image processing is more efficient if the image is coherent. In the model of this paper, this means that such an image will show a fairly intense and uniform coverage after using the 3M-VAS software. Any deviations from geometrical coherence are revealed either as large holes or as disjointed hotspots in a 3M-VAS scan.
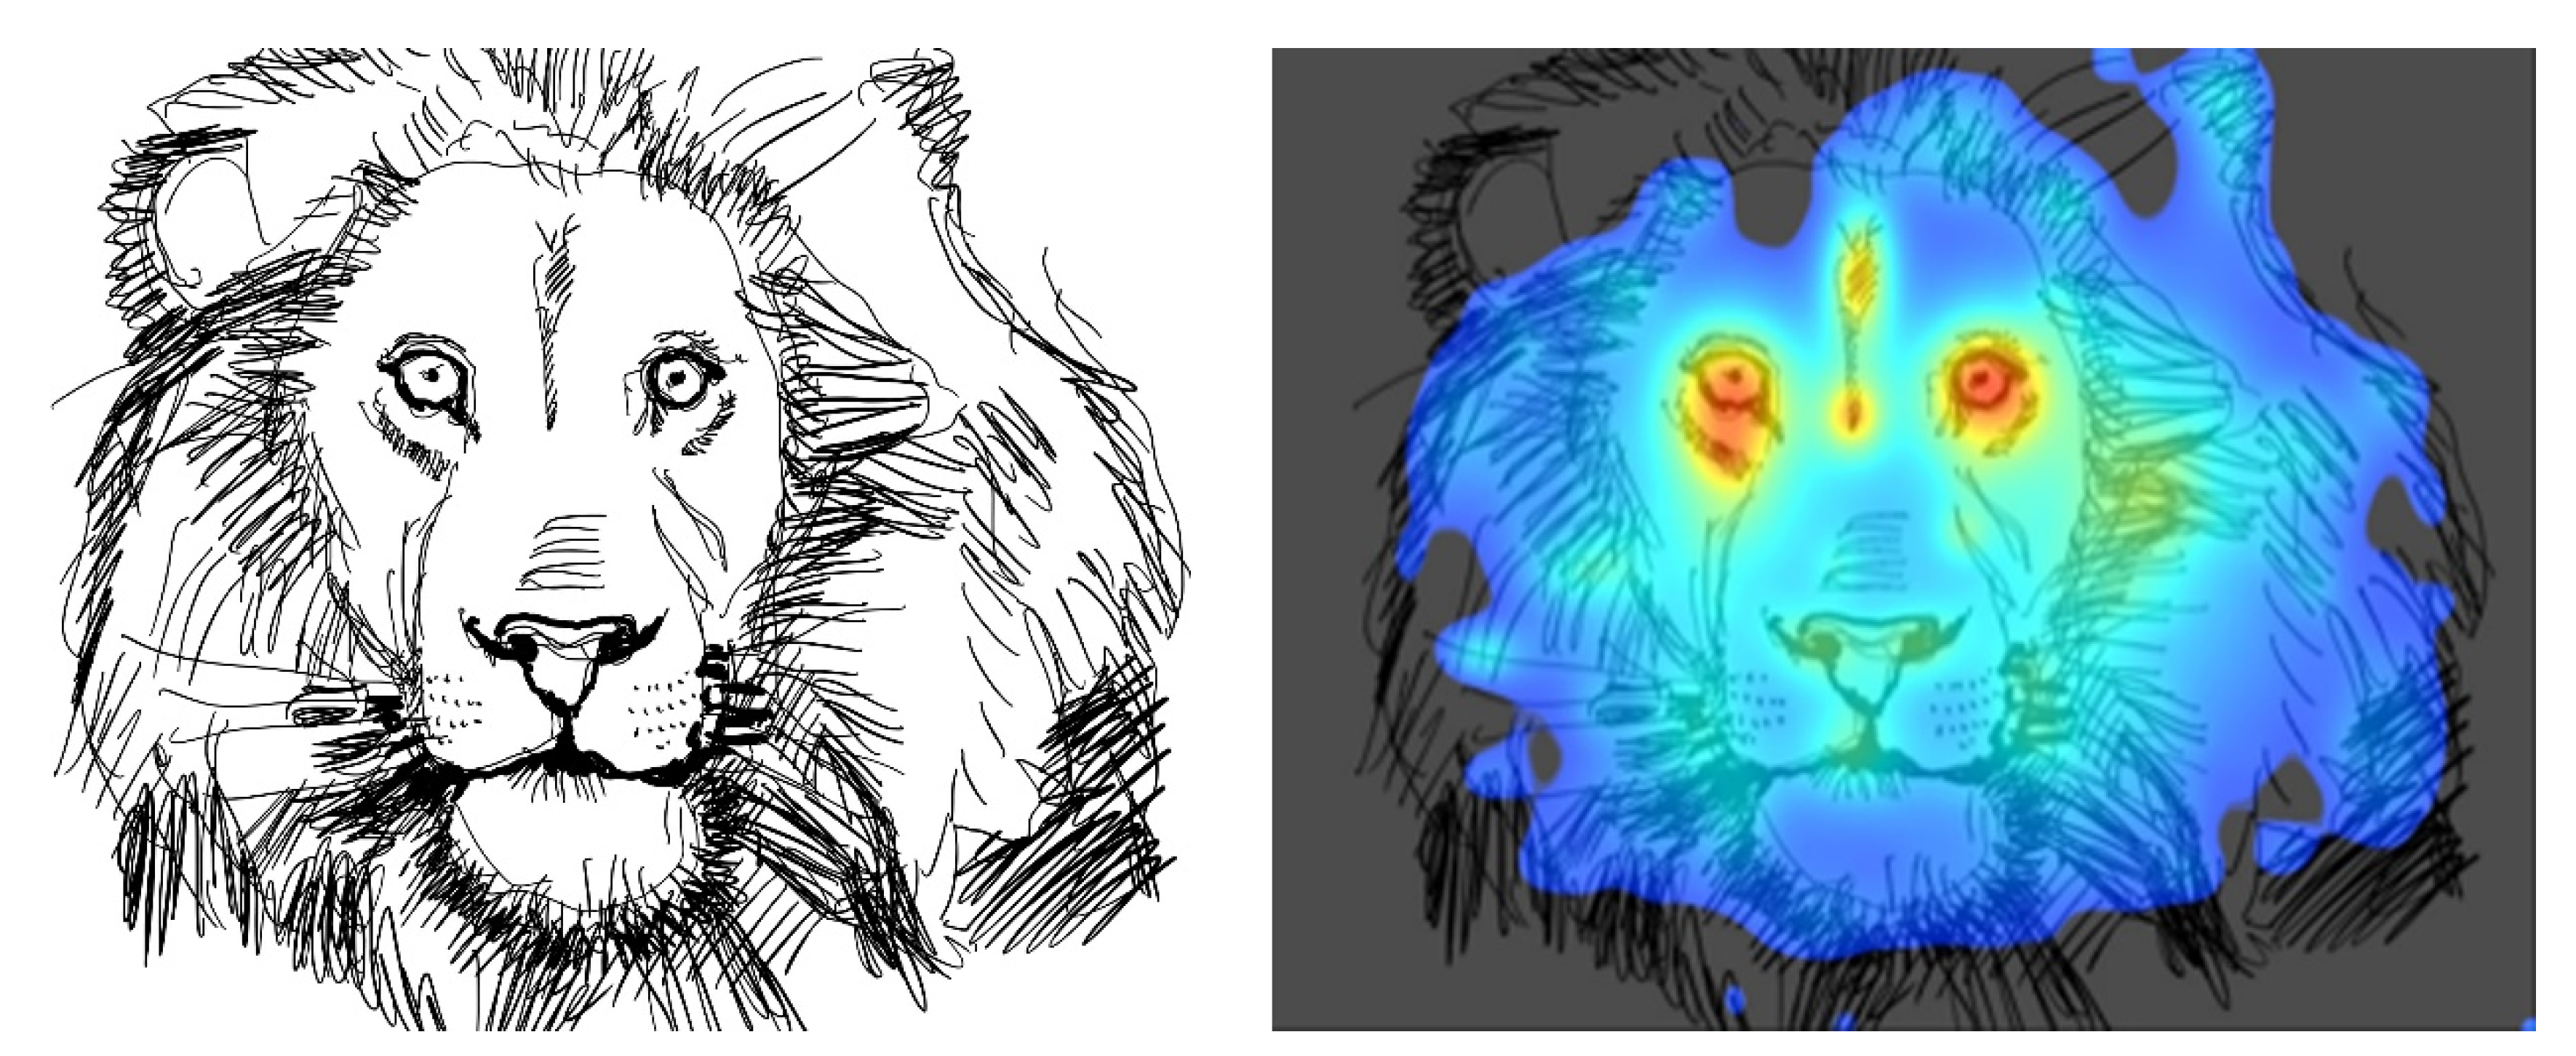
Geometrical coherence can also promote fear, like seeing the Lion’s face (Figure 17). When you perform a 3M-VAS scan of a Lion’s face, you do get a uniform blue glow. There is no contradiction here. We are wired to respond to threat before we know what we are looking at, including fear responses; for example when predators appear in our visual field [27]. After rapidly identifying the visual information, our brain can promote a further, conscious fearful response if appropriate.
If the initial stage of information processing takes longer than the brain is used to from its evolutionary training on natural scenes, then the second evaluation stage will be delayed. Our conjecture is that such delays lead to an unresolved visual environment, which is likely to generate stress in the user. This feeling of “unease” may be superficially similar to but is fundamentally distinct from the “fear” that one experiences from a known danger such as a predator. Informational incoherence promotes anxiety exactly because we cannot easily compute our environment, which means that we cannot easily tell if it is friendly or threatening.
Why does this matter? Because these mechanisms establish our much-needed biological sense of being “situated” in our surroundings. Without the “field of centers” (seen as a uniform “blue glow” in 3M-VAS), we probably get dissociation and disconnection. The disconnection many people always feel around modernist-style architecture and urbanism most probably occurs because those geometries are subliminally incoherent. Furthermore, the human brain and body cannot easily anchor around them, like they can in old, historic urban settings, and this will always remain so, implying that education about the history of architectural design is not going to change our pre-attentive response.
One of the groundbreaking advances for sustainable design promises to be how eye tracking and simulation software can predict the potential walkability in an urban setting. Emphasizing the primacy of initial engagement is critical, because evolution has preset human behavior. Architects that ignore how vision works can cause great problems, which cannot be fixed afterwards. Disengagement occurs with irrelevant hotspots that make us fixate at the sky and on points uncorrelated to the building’s design [2,41,42,43,44]. This, in turn, undermines potential walkability because subliminally, we have nothing to move toward.
10. Conclusions
Eye-tracking experiments have made possible new and powerful artificial intelligence-based software tools, which allow us to perform in silico research of human pre-attentive processing of architectural forms. This paper presented practical and conceptual considerations that a user must become familiar with, to make the most of the analytical method. When implemented correctly, visual attention software gives us access to information of the subliminal processes that govern our early reactions to buildings, and which reflects the visual coherence of forms. This represented subliminal reality corresponds, remarkably, to Christopher Alexander’s “field of centers”; conceptualized decades before such a visualization was possible.
With 3M-VAS (and other algorithmic visual assessment software solutions now on the market) we can today, for the first time, “see” and predict the human subliminal experience of buildings and learn how this initial action directs our behavior around them. We can forecast how memorable a building will be, how likely it will be that people will struggle to find a front door, or even how our visual perceptive system will tell us to ignore a structure completely. Using 3M-VAS we can begin to get the data on how stressful or soothing a new development will be—even before it is built. Unlimited checking of design variations becomes a trivial exercise.
After using 3M-VAS, we grasp much better how human perception is relational, and the way we are hardwired for attachment and a strong relationship with our surroundings. We get to “see” the subliminal world we normally experience unconsciously, much closer to animal perception than we usually like to consider (or even dare to admit). Applied to design, we may compare the present toolkit to a compass that enables us to navigate through the vastness of the design space. The difference with previous practice is that VAS lets us see in which direction our design is going, as far as subliminal adaptivity is concerned.
Further VAS studies, and eye-tracking research more generally, will prove fruitful by looking at where first fixations fall in the built environment: for instance, in the most successful and walkable streetscapes. It is important that this science, now used very successfully by advertisers and retailers of all stripes to encourage consumption, also be used to build better places that all of us can enjoy, and to enhance what we all share—the public realm. Assessing the subliminal experience drives advertising and package design; we need to convince architects of its value for evaluating building façades.
A means of rating the immediate, visceral, subliminal impact is laying the foundation for the next stage of humanly adaptive architecture. The importance of bringing this new understanding to architects, planners, and developers cannot be overstated.
Author Contributions
Conceptualization, A.A.L., N.A.S. and A.S.; methodology, A.A.L., N.A.S. and A.S.; software, A.A.L.; validation, A.A.L., N.A.S. and A.S.; formal analysis, A.A.L., N.A.S. and A.S.; investigation, A.A.L., N.A.S. and A.S.; resources, A.A.L., N.A.S. and A.S.; data curation, A.A.L.; writing—original draft preparation, A.A.L. and N.A.S.; writing—review and editing, A.A.L., N.A.S. and A.S.; visualization, A.A.L. and N.A.S.; supervision, N.A.S.; project administration, A.A.L. and N.A.S.; All authors have read and agreed to the published version of the manuscript.
Funding
This research received no external funding.
Acknowledgments
The authors are very grateful to Kelly Canavan, Global Marketing Development Manager for VAS at 3M Company for allowing the use of 3M-VAS software, which made possible the analysis reported here. This acknowledgment does not in any way imply endorsement of the results of this paper.
Conflicts of Interest
The authors declare no conflict of interest.
References
- 3M. “Visual Attention Software”. 3M Corporation: Saint Paul, MN, USA. 2020. Available online: https://vas.3m.com (accessed on 3 July 2021).
- Salingaros, N.A.; Sussman, A. Biometric Pilot-Studies Reveal the Arrangement and Shape of Windows on a Traditional Façade to Be Implicitly “Engaging”, Whereas Contemporary Façades Are Not. Urban Sci. 2020, 4, 26. [Google Scholar] [CrossRef]
- Alexander, C. The Nature of Order, Book 1: The Phenomenon of Life; Center for Environmental Structure: Berkeley, CA, USA, 2001. [Google Scholar]
- Fischmeister, F.P.; Martins, M.J.D.; Beisteiner, R.; Fitch, W.T. Self-Similarity and Recursion as Default Modes in Human Cognition. Cortex 2017, 97, 183–201. [Google Scholar] [CrossRef] [PubMed]
- Martins, M.J.; Fischmeister, F.P.; Puig-Waldmuller, E.; Oh, J.; Geissler, A.; Robinson, S.; Fitch, W.T.; Beisteiner, R. Fractal Image Perception Provides Novel Insights into Hierarchical Cognition. Neuroimage 2014, 96, 300–308. [Google Scholar] [CrossRef] [PubMed]
- Salingaros, N.A. Fractal Art and Architecture Reduce Physiological Stress. J. Biourbanism 2012, 2, 11–28. Available online: https://journalofbiourbanism.files.wordpress.com/2013/09/jbu-ii-2012-2_nikos-a-salingaros.pdf (accessed on 3 July 2021).
- Taylor, R.P. Reduction of Physiological Stress Using Fractal Art and Architecture. Leonardo 2006, 39, 245–251. [Google Scholar] [CrossRef]
- Taylor, R.P. The Potential of Biophilic Fractal Designs to Promote Health and Performance. Sustainability 2021, 13, 823. [Google Scholar] [CrossRef]
- Sussman, A.; Ward, J.M. Eye-Tracking Boston City Hall to Better Understand Human Perception and the Architectural Experience. New Des. Ideas 2019, 3, 53–59. Available online: http://jomardpublishing.com/UploadFiles/Files/journals/NDI/V3N1/SussmanA%20WardJ.pdf (accessed on 3 July 2021).
- Sussman, A.; Ward, J.M. Planning for the Subconscious. Planning. 2016. Available online: https://www.planning.org/planning/2016/jun/subconscious/ (accessed on 3 July 2021).
- Sussman, A.; Ward, J.M. Game-Changing Eye-Tracking Studies Reveal How We Actually See Architecture. Common Edge 2017. Available online: https://commonedge.org/game-changing-eye-tracking-studies-reveal-how-we-actually-see-architecture/ (accessed on 3 July 2021).
- iMotions, “Eye Tracking”, Copenhagen, Denmark & Boston. MA, USA. 2021. Available online: https://imotions.com (accessed on 3 July 2021).
- Salingaros, N.A. Life and complexity in architecture from a thermodynamic analogy. Phys. Essays 1997, 1, 165–173, reprinted as A Theory of Architecture, 2nd ed.; Sustasis Press: Portland, OR, USA, 2014; Chapter 5. Available online: https://patterns.architexturez.net/doc/az-cf-172617 (accessed on 3 July 2021). [CrossRef]
- Salingaros, N. The Sensory Value of Ornament. Commun. Cogn. 2003, 36, 331–351. Available online: https://philarchive.org/rec/SALTSV-2 (accessed on 3 July 2021).
- Sussman, A.; Hollander, J.B. Cognitive Architecture: Designing for How We Respond to the Built Environment, 2nd ed.; Routledge: New York, NY, USA, 2021. [Google Scholar]
- Salingaros, N.A. The biophilic healing index predicts effects of the built environment on our wellbeing. J. Biourbanism 2020, 8, 13–34. Available online: https://patterns.architexturez.net/node/218834 (accessed on 3 July 2021).
- Salingaros, N.A. Biophilia & Healing Environments. In Off the Common Books; Terrapin Bright Green LLC: New York, NY, USA, 2016; Available online: https://www.terrapinbrightgreen.com/report/biophilia-healing-environments/ (accessed on 3 July 2021).
- Joye, Y. Architectural Lessons from Environmental Psychology: The Case of Biophilic Architecture. Rev. Gen. Psychol. 2007, 11, 305–328. [Google Scholar] [CrossRef] [Green Version]
- EyeQuant. Data Driven Design; EyeQuant: London, UK; Berlin, Germany, 2021; Available online: https://www.eyequant.com (accessed on 3 July 2021).
- Expoze. AI-Based Eye Tracking; Expoze: Rotterdam, Holland, 2021; Available online: https://www.expoze.io (accessed on 3 July 2021).
- Ergan, S.; Radwan, A.; Zou, Z.; Tseng, H.; Han, X. Quantifying Human Experience in Architectural Spaces with Integrated Virtual Reality and Body Sensor Networks. J. Comput. Civ. Eng. 2019, 33, 04018062. [Google Scholar] [CrossRef]
- Zou, Z.; Ergan, S. A Framework towards Quantifying Human Restorativeness in Virtual Built Environments. In Proceedings of the Environmental Design Research Association (EDRA 50) Conference, Sustainable Urban Environments, Brooklyn, NY, USA, 22–26 May 2019; Available online: https://arxiv.org/pdf/1902.05208.pdf (accessed on 3 July 2021).
- Zou, Z.; Ergan, S. Where Do We Look? An Eye-Tracking Study of Architectural Features in Building Design. In Advances in Informatics and Computing in Civil and Construction Engineering, Proceedings of the 35th CIB W78 2018 Conference: IT in Design, Construction, and Management, Chicago, IL, USA, 1–3 October 2018; Mutis, I., Hartmann, T., Eds.; Springer: Cham, Switzerland, 2019; pp. 439–446. Available online: https://www.researchgate.net/publication/328144080 (accessed on 3 July 2021).
- Valtchanov, D.; Barton, K.R.; Ellard, C. Restorative Effects of Virtual Nature Settings. Cyberpsychology Behav. Soc. Netw. 2010, 13, 503–512. [Google Scholar] [CrossRef]
- Itti, L.; Koch, C. Computational Modelling of Visual Attention. Nat. Rev. Neurosci. 2001, 2, 194–203. [Google Scholar] [CrossRef] [Green Version]
- Banich, M.T.; Compton, R.J. Cognitive Neuroscience; Cambridge University Press: Cambridge, UK, 2018. [Google Scholar]
- McFadyen, J. Investigating the Subcortical Route to the Amygdala across Species and in Disordered Fear Responses. J. Exp. Neurosci. 2019, 13. [Google Scholar] [CrossRef]
- Tollner, T.; Zehetleitner, M.; Gramann, K.; Muller, H.J. Stimulus Saliency Modulates Pre-Attentive Processing Speed in Human Visual Cortex. PLoS ONE 2011, 6, e16276. [Google Scholar] [CrossRef] [Green Version]
- Ellard, C. Places of the Heart: The Psychogeography of Everyday Life; Perseus Books: New York, NY, USA, 2015. [Google Scholar]
- Merrifield, C.; Danckert, J. Characterizing the Psychophysiological Signature of Boredom. Exp. Brain Res. 2014, 232, 481–491. [Google Scholar] [CrossRef] [Green Version]
- Salingaros, N.A. Connecting to the World: Christopher Alexander’s Tool for Human-Centered Design. She Ji J. Des. Econ. Innov. 2020, 4, 455–480. [Google Scholar] [CrossRef]
- Ruggles, D.H. Beauty, Neuroscience, and Architecture: Timeless Patterns and Their Impact on Our Well-Being; Fibonacci Press: Denver, CO, USA, 2018. [Google Scholar]
- Mandelbrot, B.B. The Fractal Geometry of Nature; W.H. Freeman: San Francisco, CA, USA, 1982. [Google Scholar]
- Jiang, B. A Complex-Network Perspective on Alexander’s Wholeness. Phys. A 2016, 463, 475–484. [Google Scholar] [CrossRef] [Green Version]
- Jiang, B. Wholeness as a Hierarchical Graph to Capture the Nature of Space. Int. J. Geogr. Inf. Sci. 2015, 29, 1632–1648. [Google Scholar] [CrossRef] [Green Version]
- Höfflinger, B. High-Dynamic-Range (Hdr) Vision: Microelectronics, Image Processing, Computer Graphics; Springer Series in Advanced Microelectronics; Springer: Berlin, Germany, 2007. [Google Scholar]
- Lesser, S. Notes on the Nature of Order. 2021. Available online: http://nature-of-order.stefan-lesser.com/ (accessed on 3 July 2021).
- Salingaros, N.A. Unified Architectural Theory: Form, Language, Complexity; Sustasis Press: Portland, OR, USA, 2013. [Google Scholar]
- Chang, L.; Tsao, D.Y. The Code for Facial Identity in the Primate Brain. Cell 2017, 169, 1013–1028.e14. [Google Scholar] [CrossRef] [PubMed] [Green Version]
- Kandel, E.R. The Age of Insight: The Quest to Understand the Unconscious in Art, Mind, and Brain, from Vienna 1900 to the Present; Random House: New York, NY, USA, 2012. [Google Scholar]
- Hollander, J.B.; Sussman, A.; Levering, A.P.; Foster-Karim, C. Using Eye-Tracking to Understand Human Responses to Traditional Neighborhood Designs. Plan. Pract. Res. 2020, 35, 485–509. [Google Scholar] [CrossRef]
- Hollander, J.B.; Sussman, A.; Lowitt, P.; Angus, N.; Situ, M. Analyzing Walkability Through Biometrics: Insights into Sustainable Transportation Through the Use of Eye-Tracking Emulation Software. J. Phys. Act. Health 2020, 17, 1153–1161. [Google Scholar] [CrossRef] [PubMed]
- Hollander, J.B.; Sussman, A.; Lowitt, P.; Angus, N.; Situ, M. Eye-tracking emulation software: A promising urban design tool. Archit. Sci. Rev. 2021. [Google Scholar] [CrossRef]
- Sussman, A.; Ward, J.M. How Biometric Software Is Changing How We Understand Architecture—And Ourselves. Common Edge 2021. Available online: https://commonedge.org/how-biometric-software-is-changing-how-we-understand-architecture-and-ourselves/ (accessed on 3 July 2021).
Figure 1.
Image from the center of Manchester, UK, at the junction of Market and Cross Streets, with the full analysis output of the 3M-VAS software. (A): Original image. (B): Heatmap. (C): Simplified version of the heatmap results, showing only areas that are most likely to be seen within the 3–5 s first glance time period. (D): Gaze sequence of the four most likely gaze locations, in their most probable viewing order. The bottom six images register the 3M-VAS simulation of human pre-attentive gaze determining factors: edges, intensity, red/green color contrast, blue/yellow color contrast, and faces.

Figure 2.
The church of the Certosa di Pavia monastery in Pavia, Italy. (A), original photograph; (B) visual attention heatmap misses the part of the building in shadow; (C), the same photograph after increasing the brightness and contrast of the wing that is in shadow; (D) the visual attention heatmap of adjusted visual now includes the part of the building originally in shadow.

Figure 3.
A 1920s building with a glass façade building directly behind it, in Hasanabad square, Tehran, Iran in a color image (A,B); and an 1830s building with a glass façade directly behind it in Panepistimiou Street in Athens, Greece in a black and white image (C,D).
Figure 3.
A 1920s building with a glass façade building directly behind it, in Hasanabad square, Tehran, Iran in a color image (A,B); and an 1830s building with a glass façade directly behind it in Panepistimiou Street in Athens, Greece in a black and white image (C,D).

Figure 4.
The Omega Palace department store building from the 2000s (left) and the House of Four Giants from the 1900s (right), in Freedom Square in Brno, Czech Republic (A,B); and the 1880s Louis Bank of Commerce building on 5th Avenue, San Diego, California with a modern building with symmetric distribution of openings in the background (C,D).

Figure 5.
Partial, equal size view of the newer-style buildings from Figure 4, above. (A) Magnified façade of the Omega Palace, with (B) eye-tracking simulation heatmap. (C) Magnified façade of the background San Diego building in Figure 4C, with (D) eye-tracking simulation heatmap.

Figure 6.
(A) The neoclassical building of the National Bank of Greece, built in the late 19th and extended in the early 20th century (right), and part of the modernist-style building of the Alpha Bank, from the 1990s (left) in Stadiou Street, Athens, Greece, with (B) eye-tracking simulation heatmap. (C,D): zoomed-in view leading to a new and distinct heatmap.

Figure 7.
(A) The Royal Balcony with the Marble throne, from the 18th century, one of the buildings of the Golestan Palace complex in Tehran, Iran. This building is near the border of the complex, and a tall modernist-style office building can be seen from across the street behind it. (B) Eye-tracking simulation heatmap of the ensemble. (C,D) and (E,F): Zoomed-in views with their new heatmaps.

Figure 8.
(A) The Prudential Tower in Boston, built in the International Style in the 1960s, with (G) its eye-tracking simulation heatmap. Simplified views with their heatmaps (B,H), (C,I) and zoomed in views (C,I), (D,J), (E,K), (F,L) leading to fragmentation.
Figure 8.
(A) The Prudential Tower in Boston, built in the International Style in the 1960s, with (G) its eye-tracking simulation heatmap. Simplified views with their heatmaps (B,H), (C,I) and zoomed in views (C,I), (D,J), (E,K), (F,L) leading to fragmentation.

Figure 9.
Piazza Duomo with the Duomo Cathedral in Milan, Italy (A) replaced by a curtain wall face of similar color (B) that gets progressively simpler by losing one set of horizontal lines per floor (C) and abandoning the detailed fractal outline of the building for a square profile (D). The sequence of corresponding eye-tracking simulation heatmaps (E–H) progressively focuses attention onto the ground plane, ignoring the building itself.

Figure 10.
A complete tiled ceramic mural from the 18th century Vakil mosque in Shiraz, Iran (A), with its eye-tracking simulation heatmap (B). On closer approach, more details become visible (C), so that the new eye-tracking simulation heatmap remains uniformly coherent (D).
Figure 10.
A complete tiled ceramic mural from the 18th century Vakil mosque in Shiraz, Iran (A), with its eye-tracking simulation heatmap (B). On closer approach, more details become visible (C), so that the new eye-tracking simulation heatmap remains uniformly coherent (D).

Figure 11.
The Sierpinski Carpet geometrical fractal (A) missing either large (B,D,E) or small scale levels (C,F). In figure I, the visual attention heatmap ignores those figures that lack fractal (hierarchical) scaling; whereas figure II shows the same result among only four choices.
Figure 11.
The Sierpinski Carpet geometrical fractal (A) missing either large (B,D,E) or small scale levels (C,F). In figure I, the visual attention heatmap ignores those figures that lack fractal (hierarchical) scaling; whereas figure II shows the same result among only four choices.

Figure 12.
A sequence of drawings with contrast, detail, and local symmetries increasing dramatically. Sequence (A,C,E,G) fills out a drawing with increasing detail and approximate, overlapping symmetries. Sequence (B,D,F,H) represents the corresponding eye-tracking simulation heatmaps, which lose their hotspots as they become more and more uniformly coherent.

Figure 13.
(A) The Qavam House from the 1870s, situated in the Eram Gardens in Shiraz, Iran. (B) Eye-tracking simulation heatmap.
Figure 13.
(A) The Qavam House from the 1870s, situated in the Eram Gardens in Shiraz, Iran. (B) Eye-tracking simulation heatmap.

Figure 14.
(A) Partial view of the colonnade in St Peter’s square, the Vatican, Rome, presented in lower saturation and contrast. (B) Eye-tracking simulation heatmap. (C) The same image, presented in higher saturation and contrast, with (D) improved eye-tracking simulation heatmap.
Figure 14.
(A) Partial view of the colonnade in St Peter’s square, the Vatican, Rome, presented in lower saturation and contrast. (B) Eye-tracking simulation heatmap. (C) The same image, presented in higher saturation and contrast, with (D) improved eye-tracking simulation heatmap.

Figure 15.
A photograph of the London University Senate House from the 1930s in its original form (A), with eye-tracking simulation heatmap (C). After removing the clouds from the photo (B), the new heatmap provides more accurate architectural information (D).
Figure 15.
A photograph of the London University Senate House from the 1930s in its original form (A), with eye-tracking simulation heatmap (C). After removing the clouds from the photo (B), the new heatmap provides more accurate architectural information (D).

Figure 16.
The building of the Tyrolean Chamber of Commerce and Industry in Innsbruck, Austria, built in the 1900s, in a tightly cropped image (A), with its eye-tracking simulation heatmap (C). The same image after a frame has been added (B) provides a more accurate eye-tracking simulation heatmap (D).

Figure 17.
A Lion’s head sketch and the heatmap after 3M-VAS scanning.

Publisher’s Note: MDPI stays neutral with regard to jurisdictional claims in published maps and institutional affiliations. |
© 2021 by the authors. Licensee MDPI, Basel, Switzerland. This article is an open access article distributed under the terms and conditions of the Creative Commons Attribution (CC BY) license (https://creativecommons.org/licenses/by/4.0/).
Share and Cite
MDPI and ACS Style
Lavdas, A.A.; Salingaros, N.A.; Sussman, A. Visual Attention Software: A New Tool for Understanding the “Subliminal” Experience of the Built Environment. Appl. Sci. 2021, 11, 6197. https://doi.org/10.3390/app11136197
AMA Style
Lavdas AA, Salingaros NA, Sussman A. Visual Attention Software: A New Tool for Understanding the “Subliminal” Experience of the Built Environment. Applied Sciences. 2021; 11(13):6197. https://doi.org/10.3390/app11136197
Chicago/Turabian StyleLavdas, Alexandros A., Nikos A. Salingaros, and Ann Sussman. 2021. "Visual Attention Software: A New Tool for Understanding the “Subliminal” Experience of the Built Environment" Applied Sciences 11, no. 13: 6197. https://doi.org/10.3390/app11136197
Note that from the first issue of 2016, this journal uses article numbers instead of page numbers. See further details here.