Article

Influence of Shock Wave on Loss and Breakdown of Tip-Leakage Vortex in Turbine Rotor with Varying Backpressure

1
Department of Mechanics and Aerospace Engineering, Southern University of Science and Technology, Shenzhen 518055, China
2
Turbomachinery Aerodynamics and Acoustics Lab (TAAL), School of Power and Energy, Northwestern Polytechnical University, Xi’an 710072, China
*
Author to whom correspondence should be addressed.
Appl. Sci. 2021, 11(11), 4991; https://doi.org/10.3390/app11114991
Submission received: 9 May 2021 / Revised: 24 May 2021 / Accepted: 25 May 2021 / Published: 28 May 2021
(This article belongs to the Section Mechanical Engineering)

Abstract

:
In modern turbine rotors, tip-leakage flow is a common phenomenon that accounts for about 1/3 of the stage loss. Studies show that as the imposed load increases, a shock wave appears in the tip region, which causes a significant interference on the leakage vortex. In the present study, numerical simulations are carried out to investigate the influence of the shock wave on the loss and breakdown of the tip-leakage vortex. The obtained results indicate that with no effective control on the flow, the loss of the leakage vortex has an approximate exponential growth up to about 10 times as the outlet Mach number increases from 0.67 to 1.15 and the corresponding proportion in the total loss increases sharply to 30.2%. It is found that the stagnation position of the breakdown changes with the backpressure and the amplitude of variation along the axial direction is up to 0.13 Cx. It is inferred that the breakdown of the leakage vortex core may be affected by the periodical passing of downstream blade and the induced pressure fluctuation may result in additional vibration in this rotor blade. The leakage vortex is unstable in supersonic flow with a shock wave and it may transfer to a flow with a low-velocity bubble in its core region. It is concluded that the leakage vortex breakdown mainly originates from interferences of the shock wave, while the internal cause of such breakdown is the centrifugal instability of the vortex.

1. Introduction

Tip-leakage flow is one of the main sources of outlet flow distortions and aerodynamics losses in turbines, which is a common flow phenomenon that can occur in a high-pressure turbine rotor. Studies show that the leakage flow has a significant effect on the turbine aerodynamic loss, heat transfer and unsteadiness of the downstream flow field. Further investigations [1,2,3] revealed that the leakage loss accounts for about 1/3 of the aerodynamics losses of the stage. The tip-leakage loss is inversely proportional to the blade aspect ratio and increases as the flow turning angle increases. The pursuit of high loading and small aspect ratio in the design of modern turbines leads to serious tip-leakage flow and loss [4].
Further investigations on the leakage vortex show that although basic knowledge has been obtained about the structure of the tip-leakage flow/vortex [5], the tip-leakage flow of the turbine rotor is inherently unsteady and the core of the leakage vortex is unstable. Such instability may breakdown the tip-leakage vortex and may cause a strong mixing in the tip region.
Bindon [6] showed that the mixing loss between the tip-leakage vortex and the main flow accounts for 48% of the total loss in the turbine blade tip region and the other two main parts of the tip region loss, including the casing endwall/secondary flow lss and the blade tip clearance shear loss account for 13% and 39% of the total loss, respectively. Meanwhile, it was found that the loss core separation in the positive suction corner pressure gradient may rapidly increase the size of the tip-leakage vortex. However, further investigations are required in this regard. Li et al. [7] used the long-wave instability theory and analyzed the stability of the turbine tip-leakage vortex and found that the leakage vortex is unstable. Moreover, Huang [8,9] and Gao et al. [10] showed that the mixing loss after the vortex breaking is an important source of leakage flow. They revealed that when the leakage vortex breakdown occurs, the mixing loss significantly increases and the scraping effect originating from the relative movement of the casing wall has a great effect on the instability and loss of the tip-leakage vortex [11]. The phenomenon indicates that the unsteady tip-leakage vortex is a very important parameter to control aerodynamic losses in the turbine rotor.
On the other hand, a significant increase in the aerodynamic load of the turbine leads to the application of transonic turbine design. In addition, the shock wave structure near the trailing edge is one of the main flow characteristics of the transonic turbine. This feature is especially more pronounced in the rotor tip region.
The turbine trailing-edge shock wave causes a sharp drop in the aerodynamic efficiency and may cause numerous problems such as blade vibration and flow unsteadiness. Consequently, the interaction between the shock wave and the blade, including the shock wave/boundary layer interaction [12,13] and the shock wave interaction with downstream blade row [14,15], have been comprehensively studied in recent years. However, the majority of these studies are focused on two-dimensional (2D) or quasi-two-dimensional flows and few investigations have been focused on the interaction between the shock wave and three-dimensional (3D) flows, such as the turbine endwall secondary flow, the tip-leakage flow/vortex and other 3D flows.
Shock wave may cause a strong quasi discontinuity with a significant pressure gradient between flows at two sides. When the shock wave appears in the rotor tip region, the tip-leakage flow may be significantly affected.
Since the tip leakage of a compressor is related to the compressor’s operating margin, the interaction of compressor tip leakage vortex and shock wave has been widely studied as far [16,17,18,19]. However, the turbine does not have an operating instability problem. Meanwhile, the influence and internal process of the interaction between the shock wave and the tip leakage vortex may be different.
In the present study, it is intended to simulate the flow in the tip region of a high-pressure turbine rotor with different Mach numbers. The main purpose of this article is to study the influence of the shock wave on the flow and loss of the tip-leakage vortex from the aspect of vortex breakdown and investigate the interaction mechanism. This study is expected to prepare a guideline to control tip-leakage loss in high-load turbines.

2. Numerical Modeling

In this study, the first-stage rotor of the GE-E3 aero-engine high-pressure turbine (HPT) is considered as the research object.
Figure 1 presents the computational domain. The rotor blade is a high-load turbine blade with a small aspect ratio and a large deflection angle. Moreover, there are 76 circumferential blades on the rotor. The axial chord length of the rotor blade Cx is 28.7 mm and the aspect ratio based on the blade height at the trailing edge and the chord length at the mean span is 1.19. The flow turning angle at the mean span of the rotor blade is about 110° and the corresponding blade profile load factor is Zw = 1.02. More details about the geometric and aerodynamic design parameters are discussed in the NASA report [20].

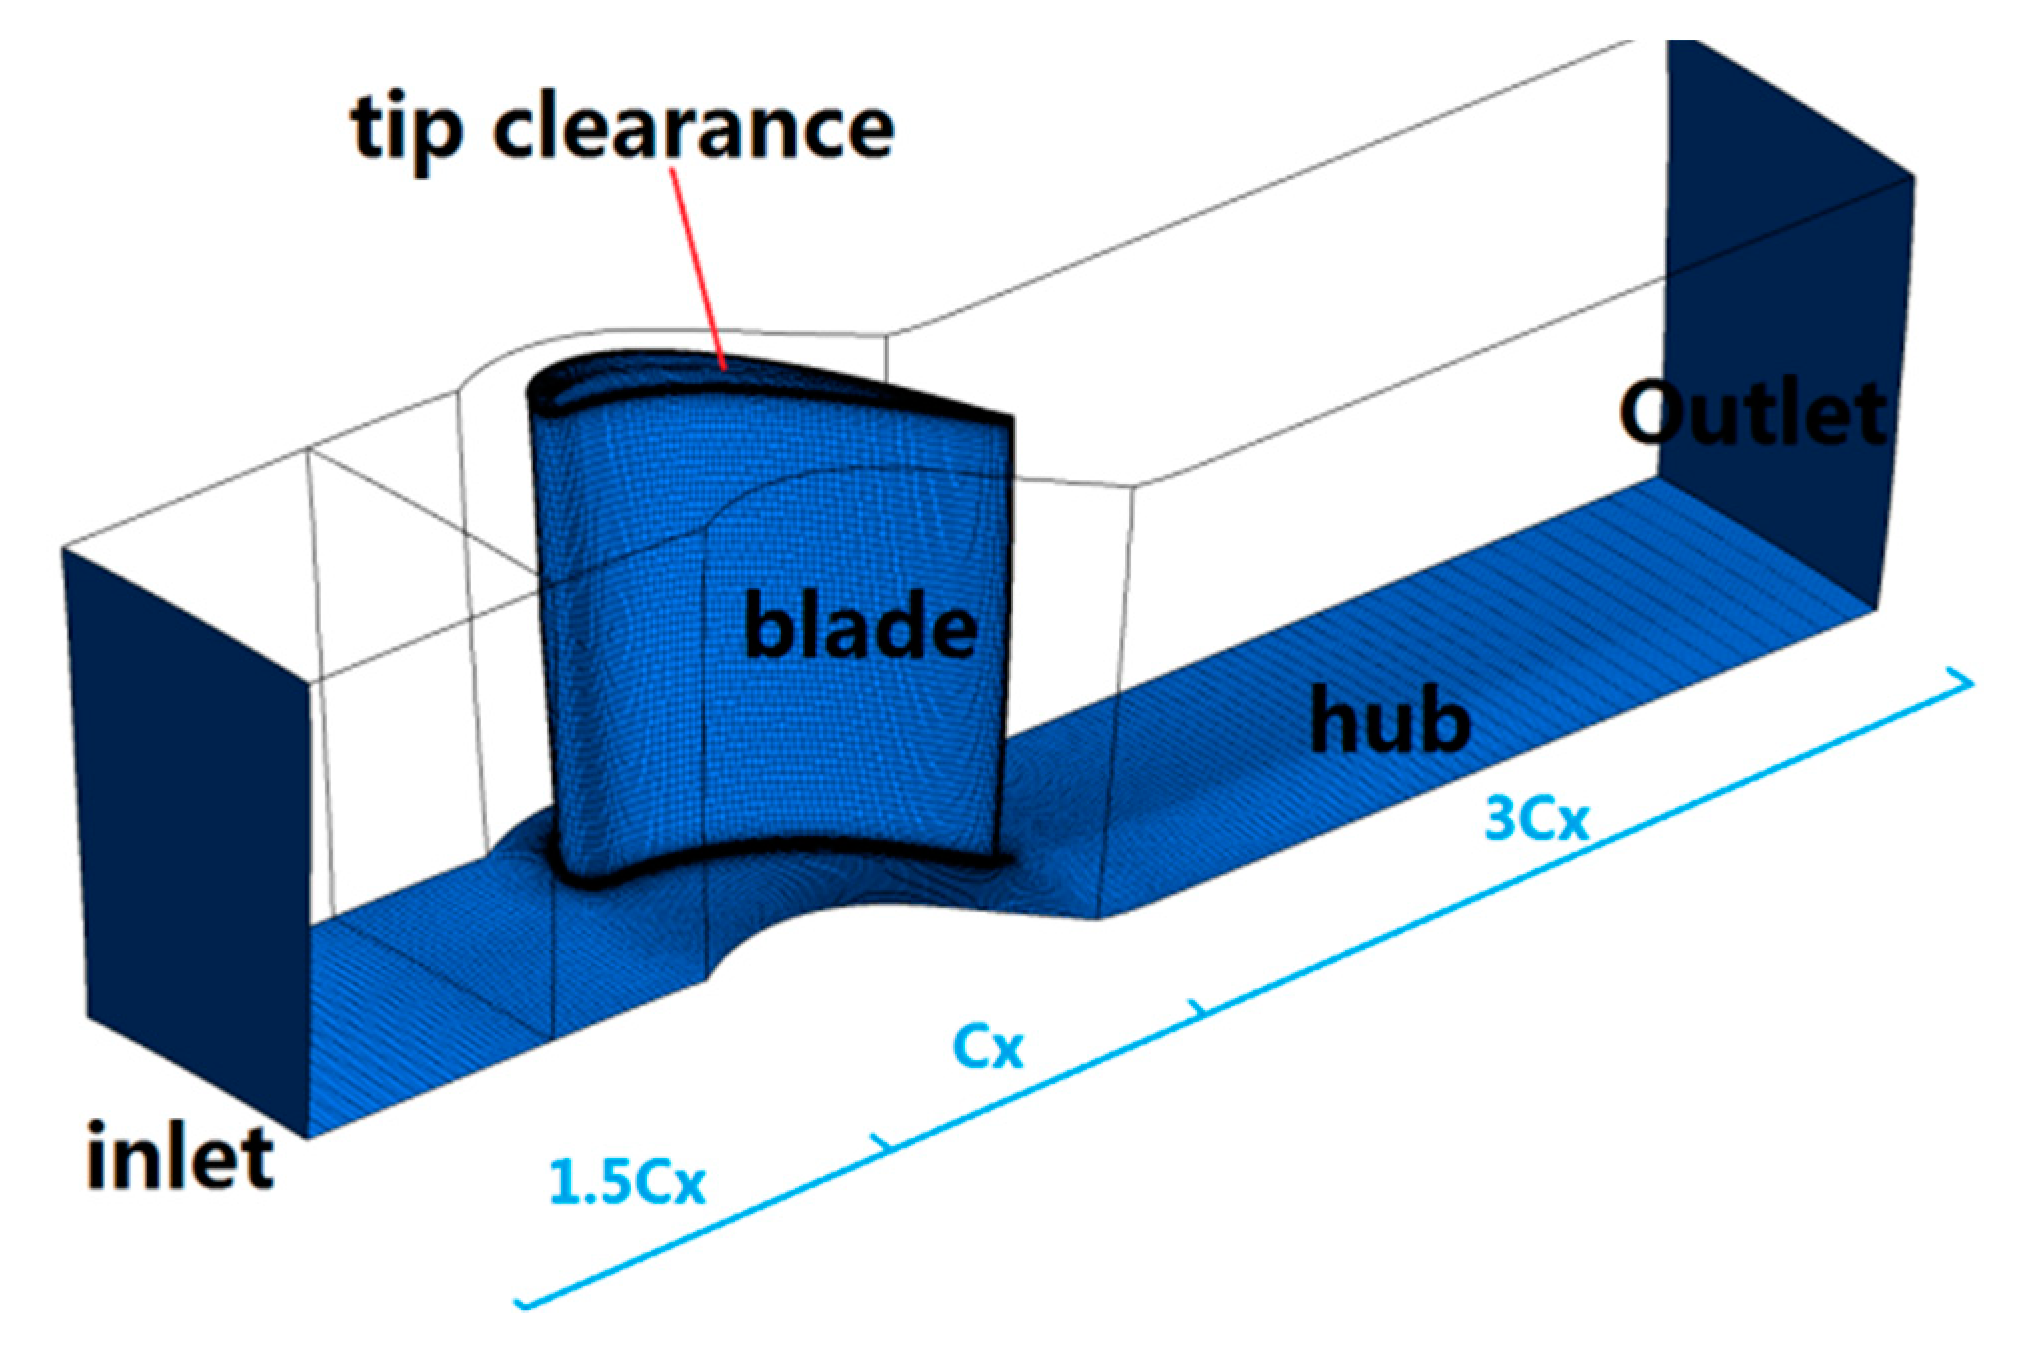
2.1. Computational Domain and Boundary Conditions

The computational domain consists of a single blade passage, where a rotational periodic boundary is applied at the pitch-wise direction of the passage. The inlet boundary of the domain is set to be 1.5 Cx upstream of the blade leading edge (LE) and the outlet boundary is 3.0 Cx downstream of the blade trailing edge (TE). The meridian passage profiles of casing and hub are straight lines. Figure 1 indicates that the rotor blade is twisted and has a flat tip geometry. The tip clearance between the rotor tip and the casing is 1% of the span (0.4146 mm) and has a uniform distribution.
Total pressure, total temperature and flow angles in the absolute frame are imposed at the inflow. Settings of these boundary conditions are presented in Table 1. Pressure outlet condition is set as the outlet boundary condition. No slip adiabatic smooth wall condition is imposed on the blade surface, casing, blade tip and hub wall. The hub wall is connected to the rotor blade and set as rotating wall, while other parts and casing wall are set as static wall. In the calculations, the incoming boundary layer is a uniform free-developing boundary layer at the inlet and the initial turbulence intensity at the inlet is set to 10%. A rotational periodic boundary is applied in the pitch-wise direction of the passage.
To study the effect of the shock wave interference on the stability of the leakage vortex, different outlet static pressure varying from 750 kPa to 250 kPa are considered to cover a wide range of Mach numbers at the turbine outlet. The outlet pressure corresponding to the typical subsonic and supersonic case is 510 kPa and 300 kPa, respectively. It is noted that the former value is the turbine design point, corresponding to the outlet Reynolds number of about 5.7 × 10⁵ based on the mean chord length and the outlet relative velocity. In all simulations, the rotating speed of the rotor is set to 12,630 r/min and steady calculations are carried out.

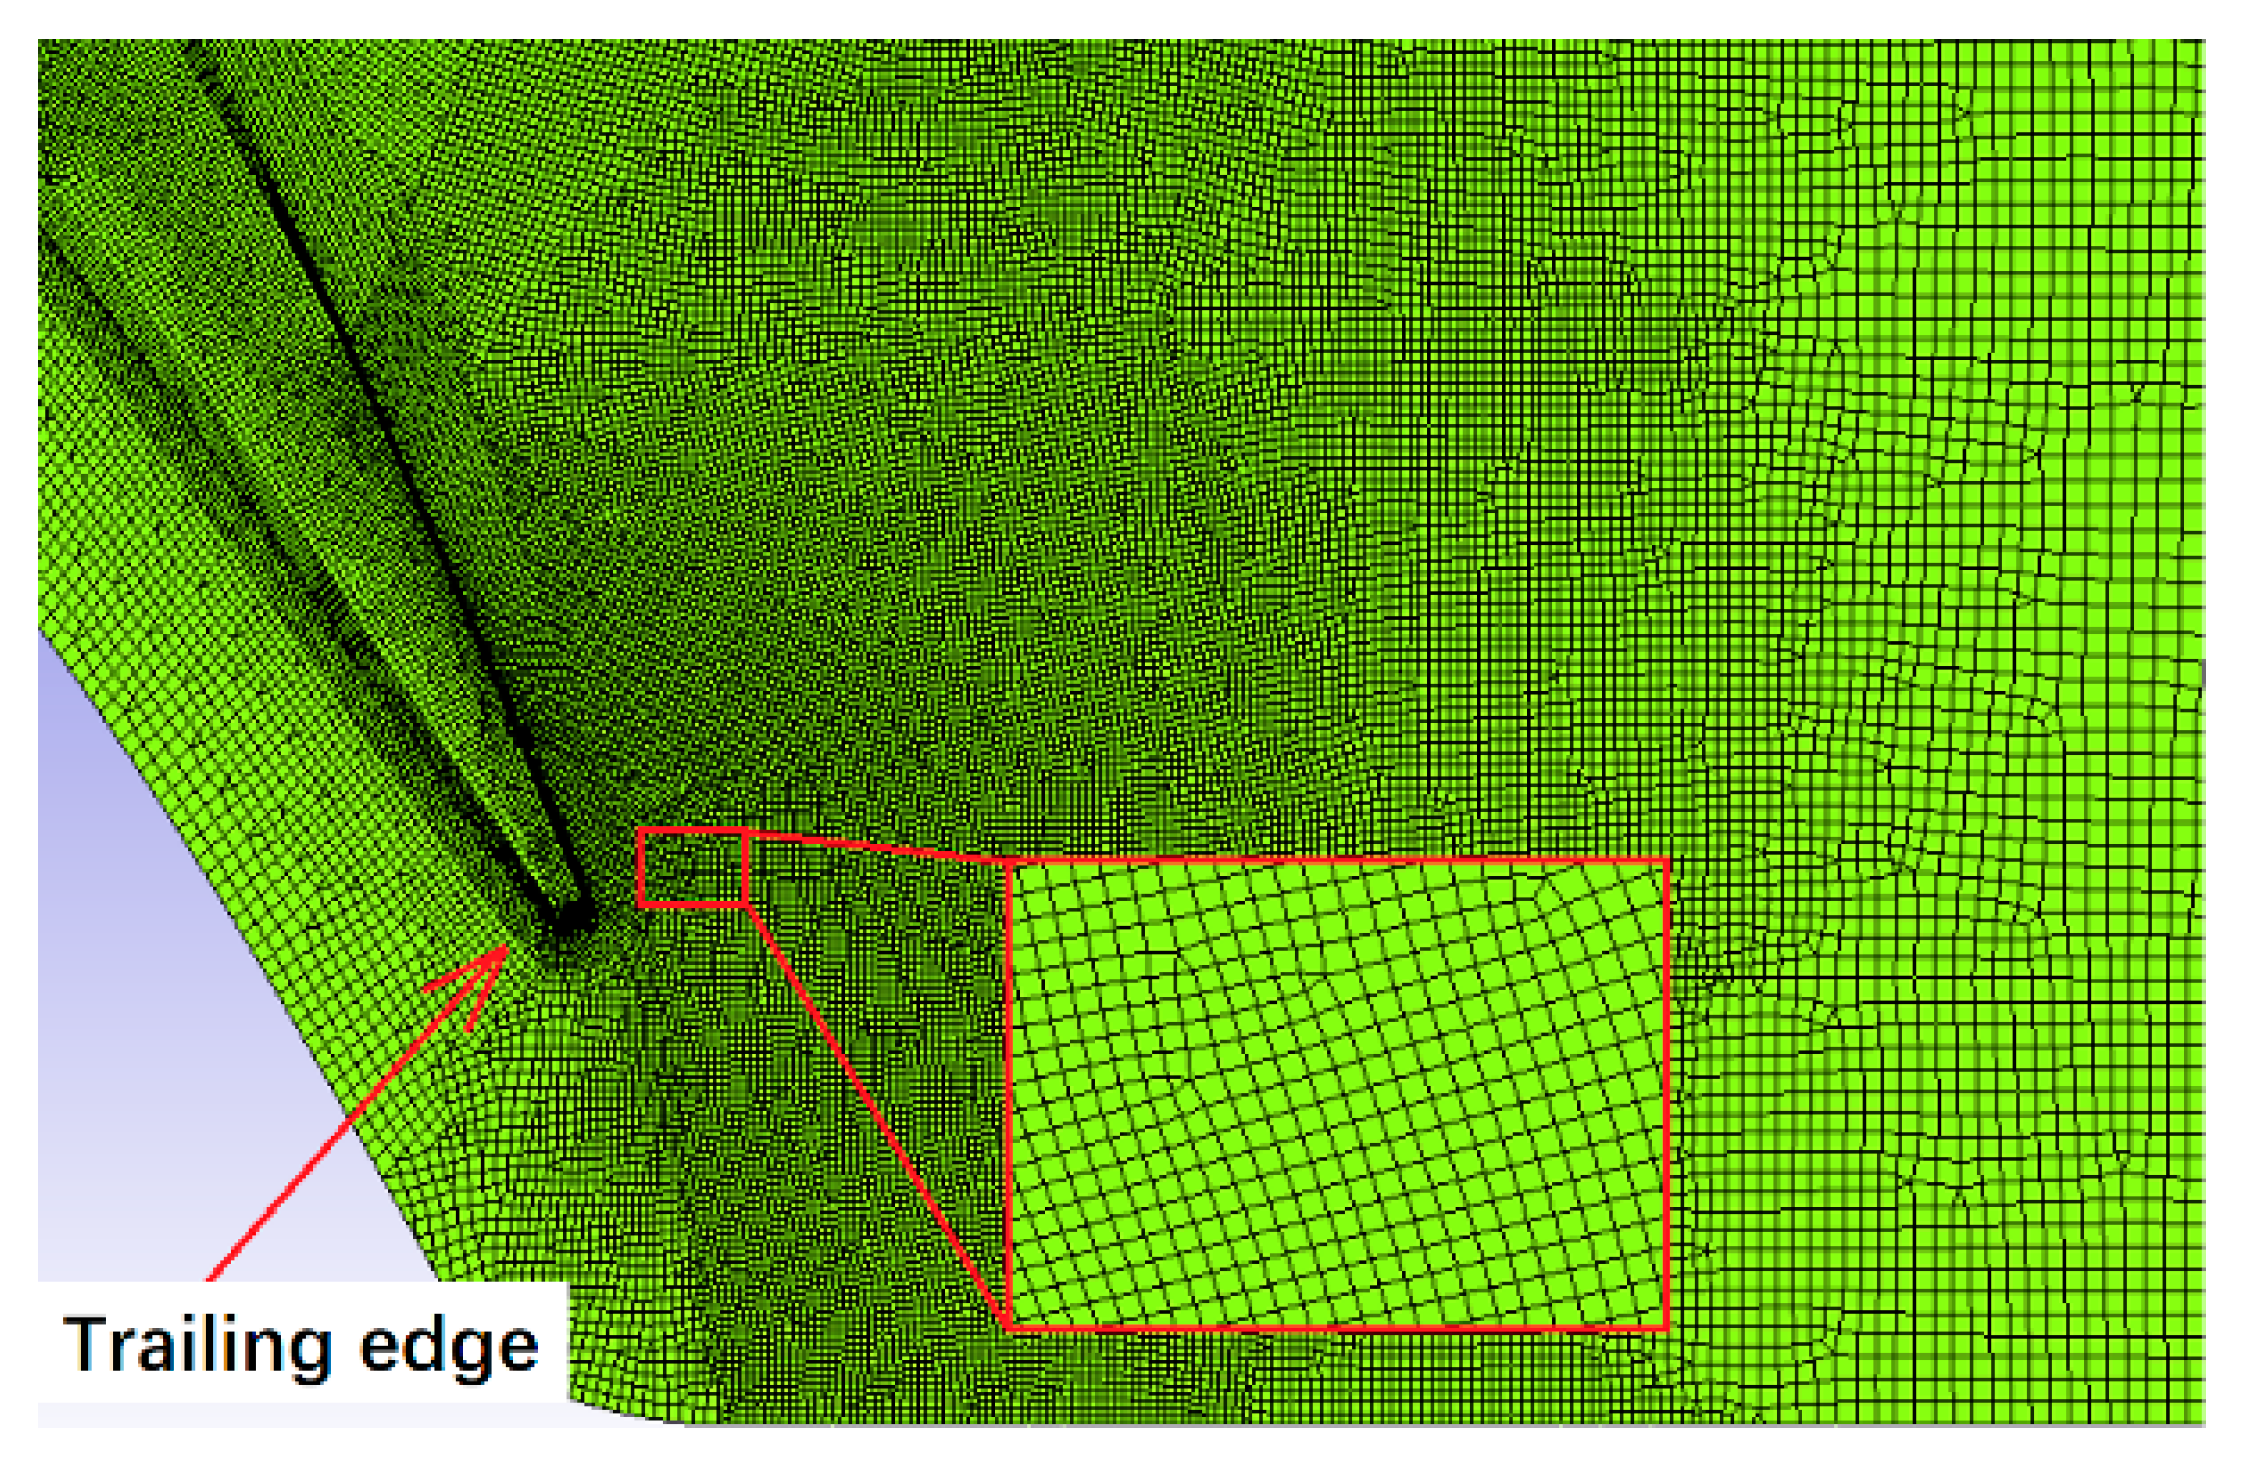
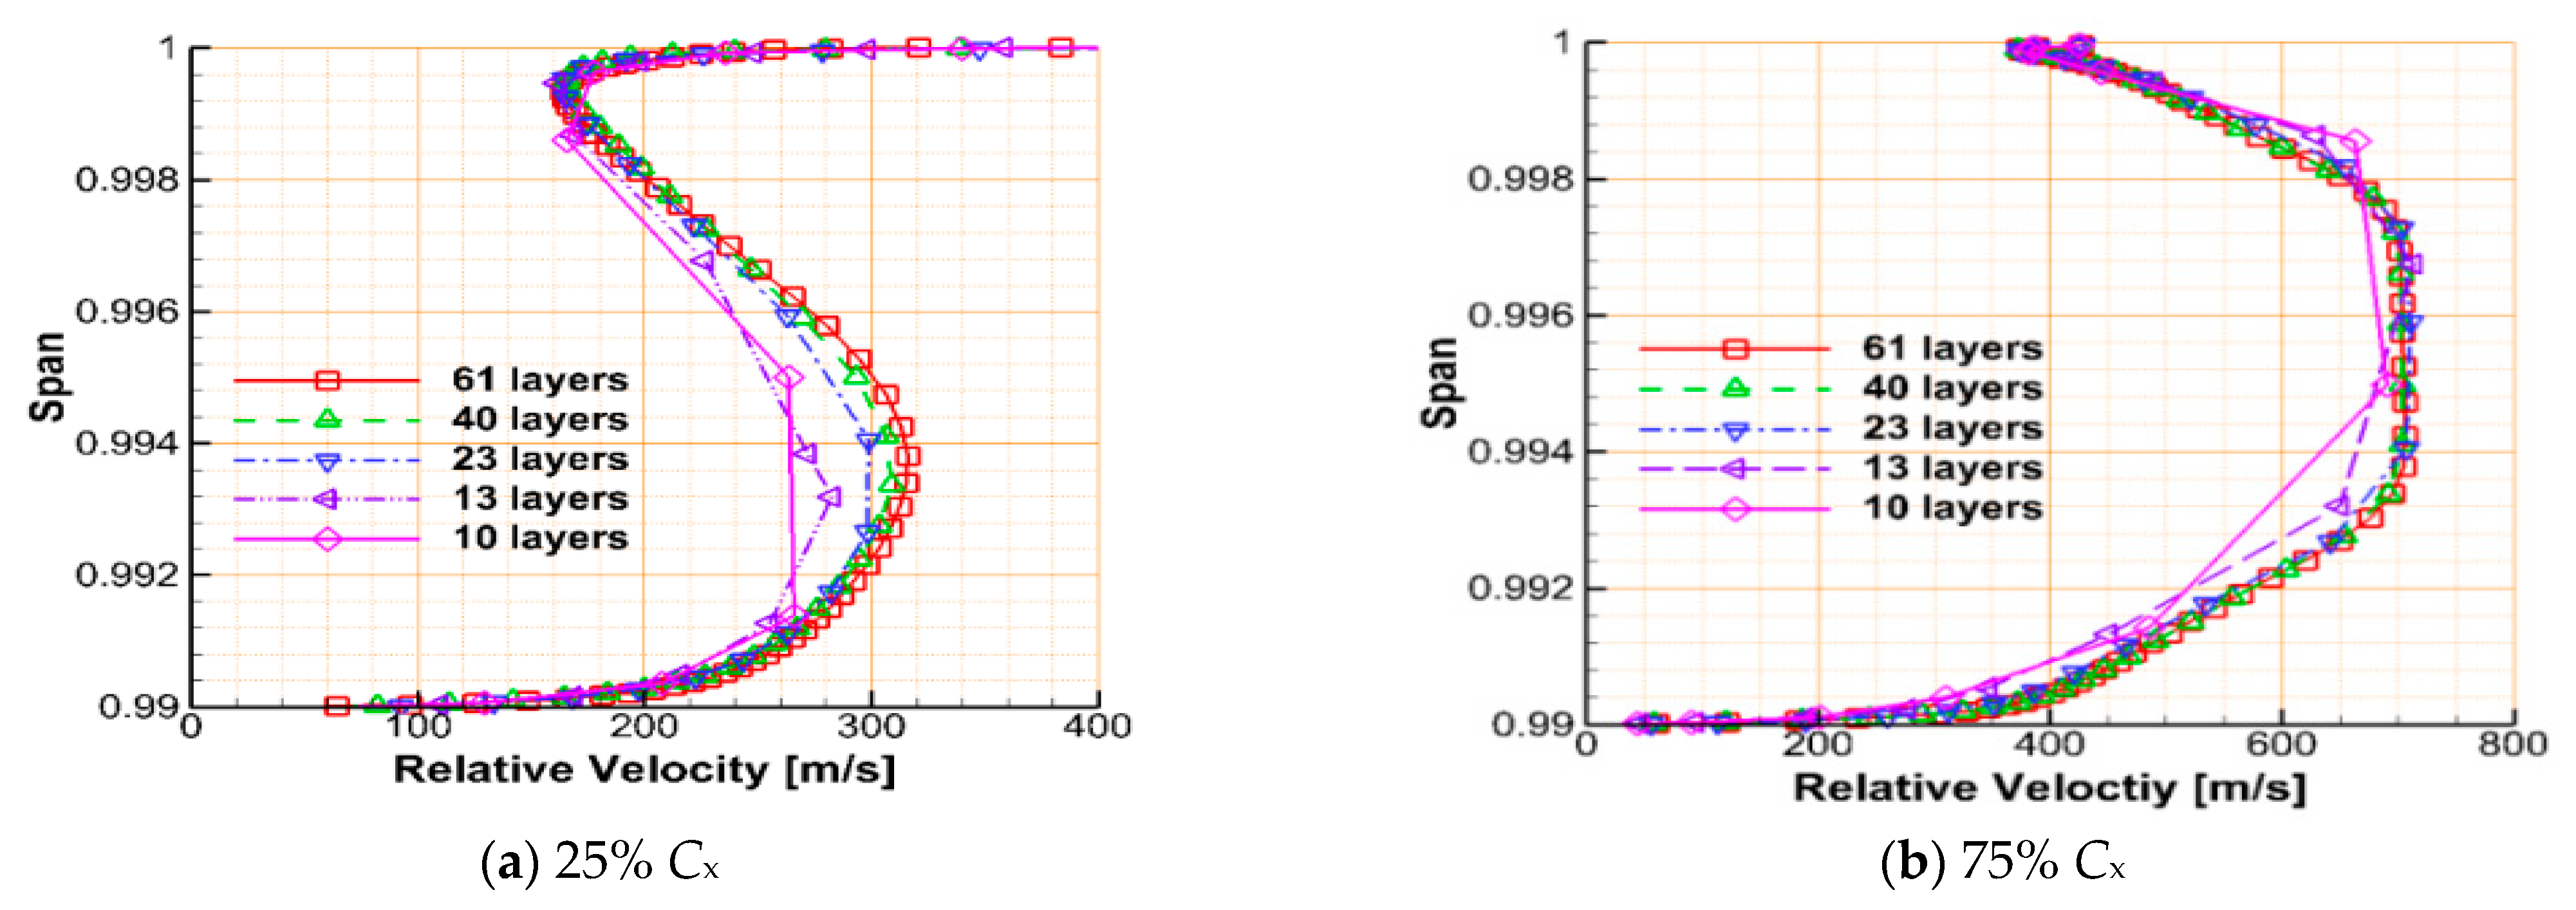
2.2. Solution Method and Computational Grid

In the present study, a commercial computational fluid dynamics solver ANSYS CFX is utilized to carry out numerical simulations. It solves 3D viscous Reynolds-averaged Navier-Stokes (RANS) equations in generalized coordinates through the finite volume method. High-resolution second-order central-difference scheme with implicit method is used for the spatial discretization. Investigations [21,22] revealed the capability of shear-stress transport (SST) k-ω turbulence model in capturing complex flow in the turbomachinery. In addition, the studies by Sell et al. [23] and Gao et al. [10] showed that the steady RANS method can effectively and reliably capture the reserved flow caused by the vortex breakdown in the tip-leakage vortex core. Accordingly, the steady RANS method coupled with the SST k-ω turbulence model is used in the present study for all simulations.
The computational grid is generated with ICEM-CFD, where the topology of the grid is based on O-grid and H-grid. H-grid is adopted in the inlet region, outlet region and cascade passage, while O-grid is used surrounding the blade surface. The non-dimensional distance y+ of the first mesh node near the blade wall, blade tip wall, casing wall and hub wall is set to about 1. In the tip clearance, O-grid is combined with unstructured hexahedral mesh, while unstructured hexahedral meshes with a uniform spread are adopted in the rotor passage outlet at the trailing edge region of the suction surface. Figure 2 illustrates the casing mesh in the trailing edge region of the rotor. It is observed that the mesh has good adaptability to ensure the mesh orthogonality in the tip clearance.
Since the tip-leakage flow is the most concerning phenomenon and the flow has a high local velocity gradient in the blade tip clearance, it is necessary to consider an appropriate grid number in the tip clearance along the span-wise and pitch-wise directions. Figure 3 shows the mesh independence analysis in the tip clearance. The obtained results show that 23 and 40 layers can capture the same relative velocity distributions at 0.75 Cx. Zhao et al. [24] set 20 layers for 2 mm tip clearance height.
According to the performed grid sensitivity analysis, the pressure loss coefficient of the passage varies less as the total grid number reaches 1.18 million [10]. In order to clearly capture the flow details in the tip-leakage vortex, grids of the outlet region of rotor blade (especially the tip-leakage vortex area) should be refined. Accordingly, 25 grid layers are set in the tip clearance within 1% blade height and 174 grid layers are set in the span-wise direction of the blade. The total number of grid nodes is about 9.2 million.

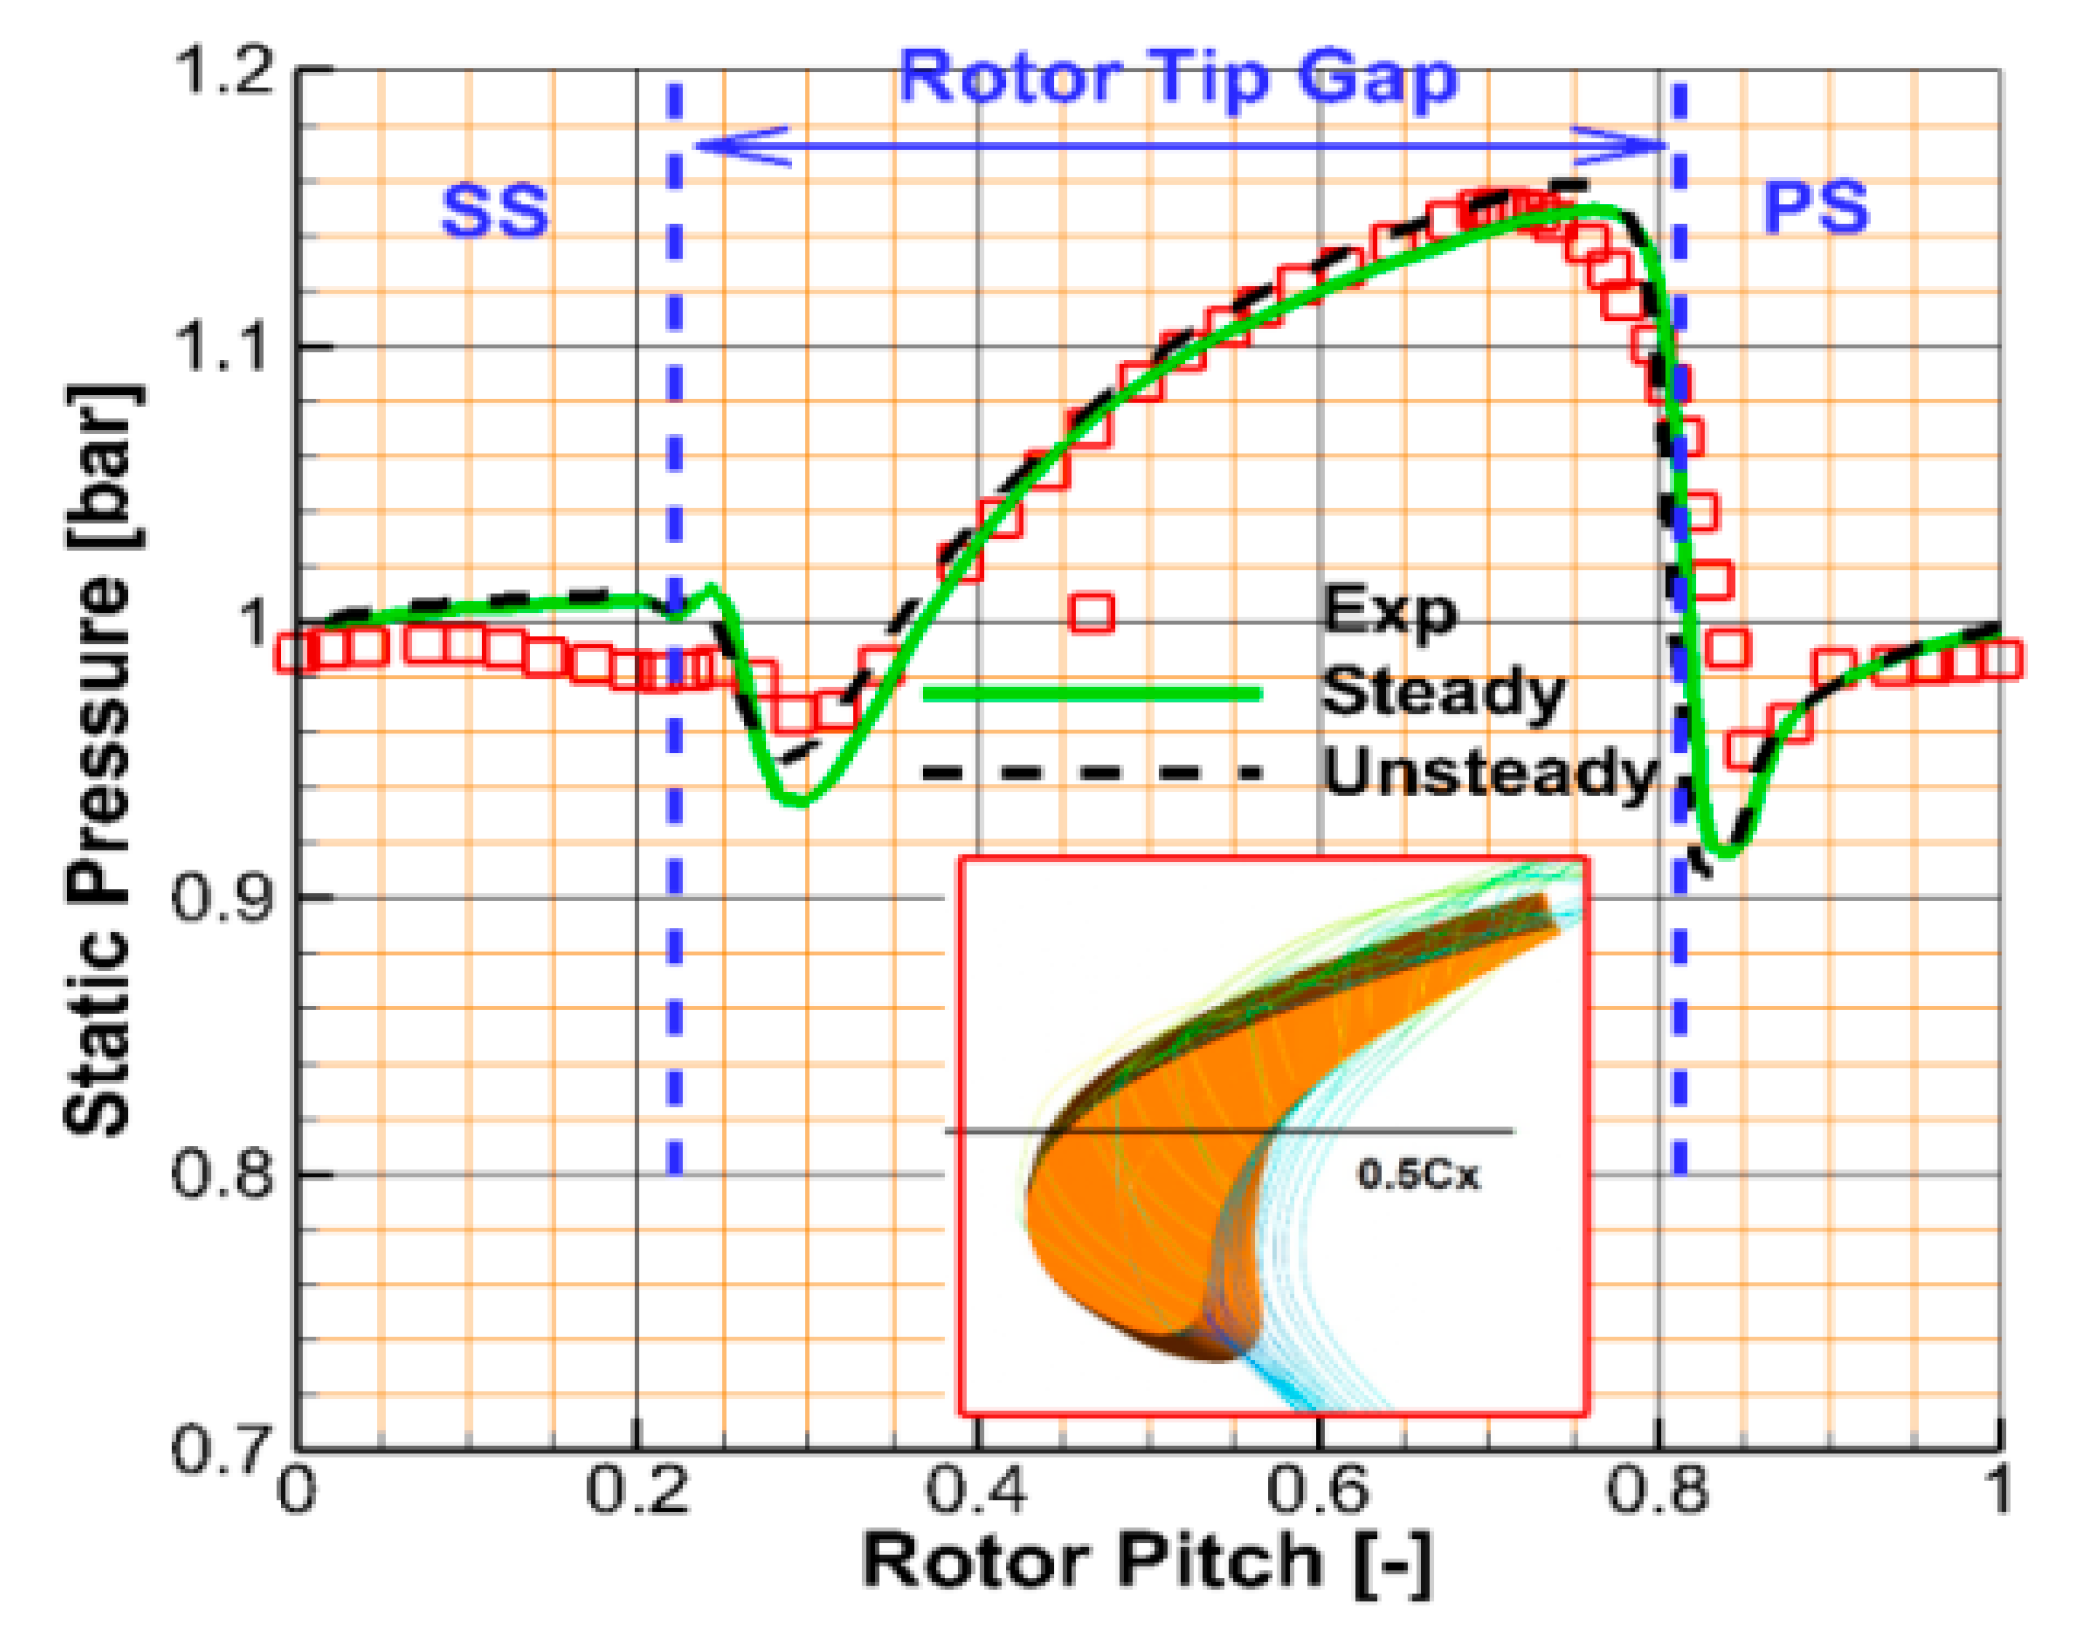
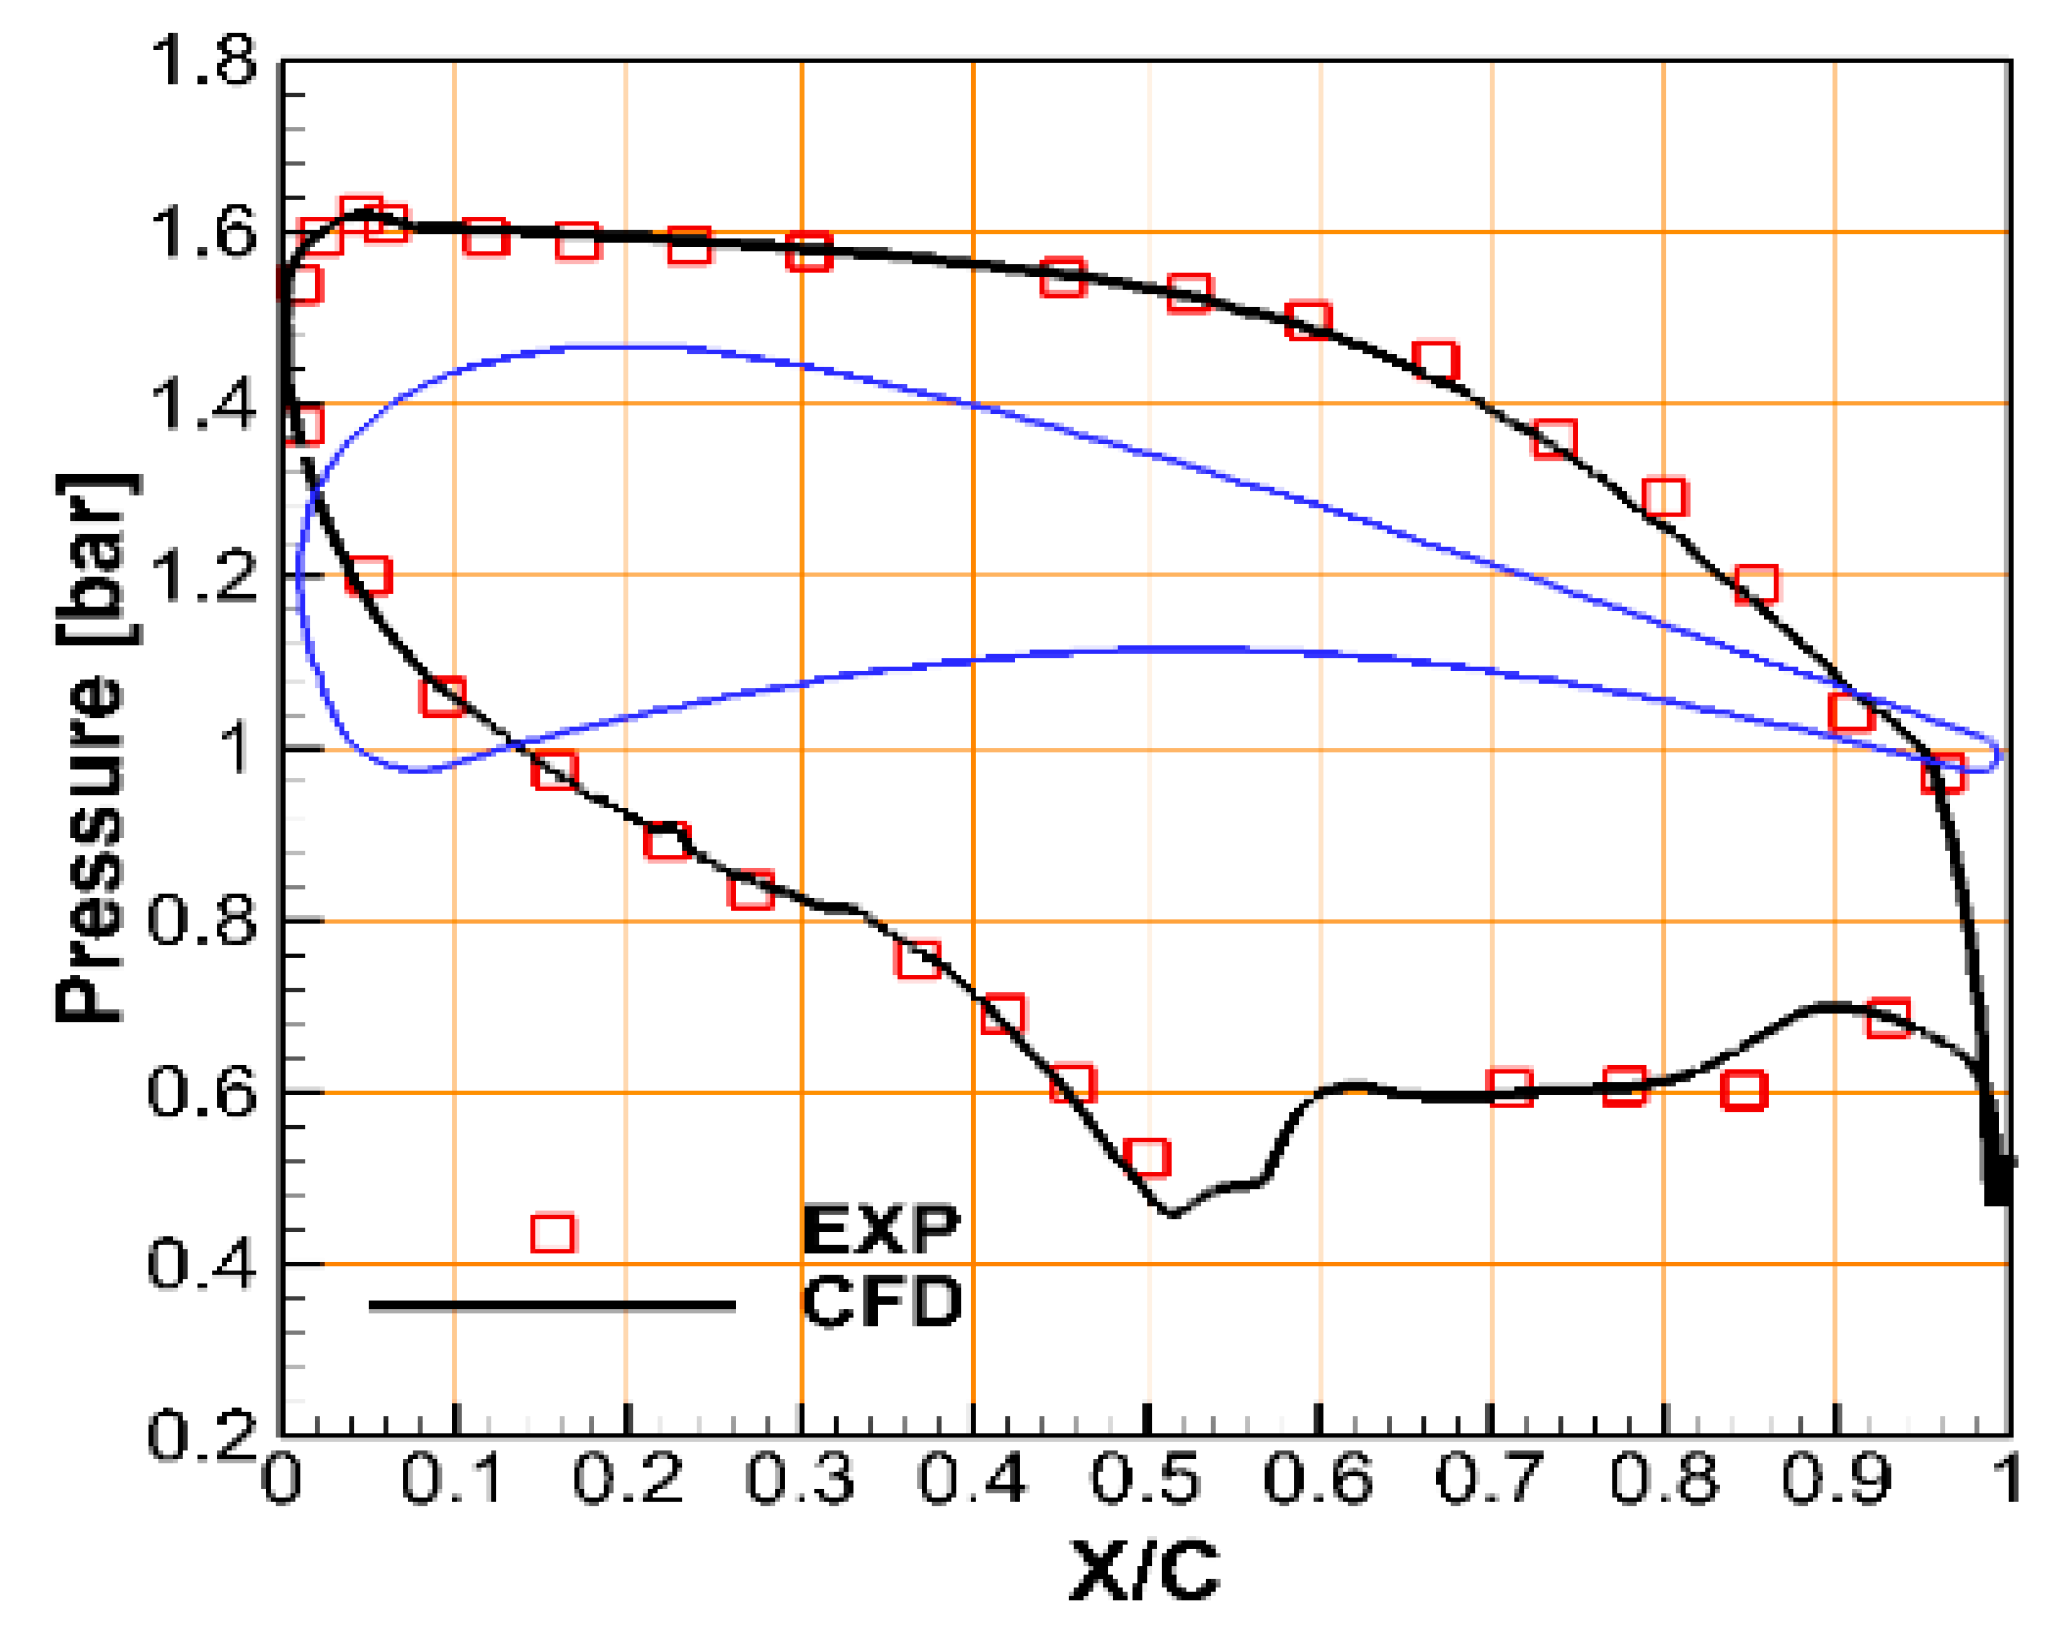
2.3. Validation of the Numerical Method

In this study, the capability to simulate tip-leakage flow/vortex and shock wave structure is of significant importance. Since there is no available experimental data of this turbine to validate the simulation directly, two cases are respectively used to validate these two aspects.
On the one hand, the 1.5 stage turbine LISA (Turbomachinery Laboratory of the Federal Institute of Technology (ETH), Zurich) [25] is used to assess the performance of the numerical methods to capture the tip-leakage flow/vortex. The same conditions as the experimental setup are considered in the simulations [26,27]. Figure 4 shows the span-wise distribution of pressure coefficient at the outlet of the first-stage turbine rotor. The pressure coefficient is defined as follows:
c pt =   p t p s , outlet / p t , inlet p s , outlet
Here, p t is the local mass-averaged total pressure in the circumferential direction, p t , inlet is the mass-averaged total pressure at the inlet and p s , outlet is the mass-averaged static pressure at the outlet.
It is observed that the predicted tip-leakage vortex, casing passage vortex and the peak value of the low pressure are consistent with the experiment. Figure 5 shows the circumferential distribution of static pressure on the casing within the rotor tip gap. Accordingly, it is inferred that the selected numerical method can effectively capture the leakage flow.
On the other hand, the turbine cascade BRITE [12,28] was simulated to validate the capability of the numerical method in predicting the shock wave structure in the transonic flow of turbine. The outlet Mach number is 1.05 and the Reynolds number based on the blade chord length and outlet velocity is about 1.0 × 10⁶. Figure 6 shows the Mach number contour in the blade passage, where the shock waves formed by supersonic flows at the trailing edge and the separated flows originating from the interaction between the shock waves and the boundary layer on the suction surface can be observed. Hou et al. [12] studied the shock wave structure near the trailing edge. Figure 7 indicates that the predicted static pressure on the blade has a good consistency with the experiment. Meanwhile, it is found that the shock wave/boundary interaction is consistent with the experiment.
Accordingly, it is inferred that the applied numerical method can be used to accurately simulate the tip leakage vortex in transonic turbine flows and predict the losses.

3. Result and Discussion

3.1. Analysis of the Leakage Vortex Loss

3.1.1. Analysis Method

The loss caused by the leakage vortex is one of the most concerning issues in the current study and it shows the effect of the shock wave on the leakage vortex loss and instability. The local total-pressure loss is expressed as follows:
Y =   p ¯ t , in p t / p ¯ t , in
where p ¯ t , in is the averaged relative total pressure at the rotor inlet and p t is the local relative total pressure at the study section, 0.2 Cx downstream of the blade trailing edge.
Figure 8 shows the typical span-wise distribution of the total pressure loss at the study section, whose outlet Mach number is 1.10. The distributions for other cases with different Ma2 are similar. It should be indicated that the data on the outlet section is averaged integrally in the circumferential direction.
Figure 8 shows that different flow loss components can be distinguished from the total-pressure loss according to the loss analysis method of Hergt et al. [29] in the compressor cascade. In addition, the tip-leakage vortex loss can be studied directly. Near the mid-span, the loss is mainly 2D lightly influenced by the secondary flow and the tip-leakage flow. Therefore, the loss near the mid-span is approximated as the blade profile loss Yp. Although the rotor blade is 3D, the loss Yp can be considered as the average value along the entire blade. The profile loss is mainly due to the viscous effect in the blade boundary layer, main flow and wakes, including shock wave, expansion wave and their interactions with the boundary layer.
Therefore, the span-wise distribution of the local-pressure loss is presented and divided into several parts. The total-pressure loss Ya of the entire blade is calculated by the integration of Y along the span-wise direction, which is expressed as:
Y a = Yd h
Figure 8 shows that the tip-leakage vortex loss Yt can be approximated as the integration of the green area which results from subtracting the blade profile loss Yp from the local total-pressure loss Y within the tip-leakage vortex region ( h 1 h h 2 ). Therefore, Yt can be expressed as follows:
Y t = h 1 h 2 Y Y P d h
Here, h2 is the spanwise position of the lowest loss point near the casing. The loss above h2 can be regarded as the direct loss related to the boundary layer of the casing wall. Although the tip-leakage flow has a direct effect on the vortex in the casing passage [30], the boundary influenced by the leakage vortex can be set as the lowest loss position h1 between the casing passage vortex and the tip-leakage vortex. The peak loss of the leakage vortex can be remarked as Ypk and the spanwise scale Δ of the leakage vortex can be recognized from Figure 8 and expressed as Δ = h 2 h 1 . Therefore, the peak loss Ypk and spanwise scale Δ can be used to characterize the shape of the tip leakage vortex.

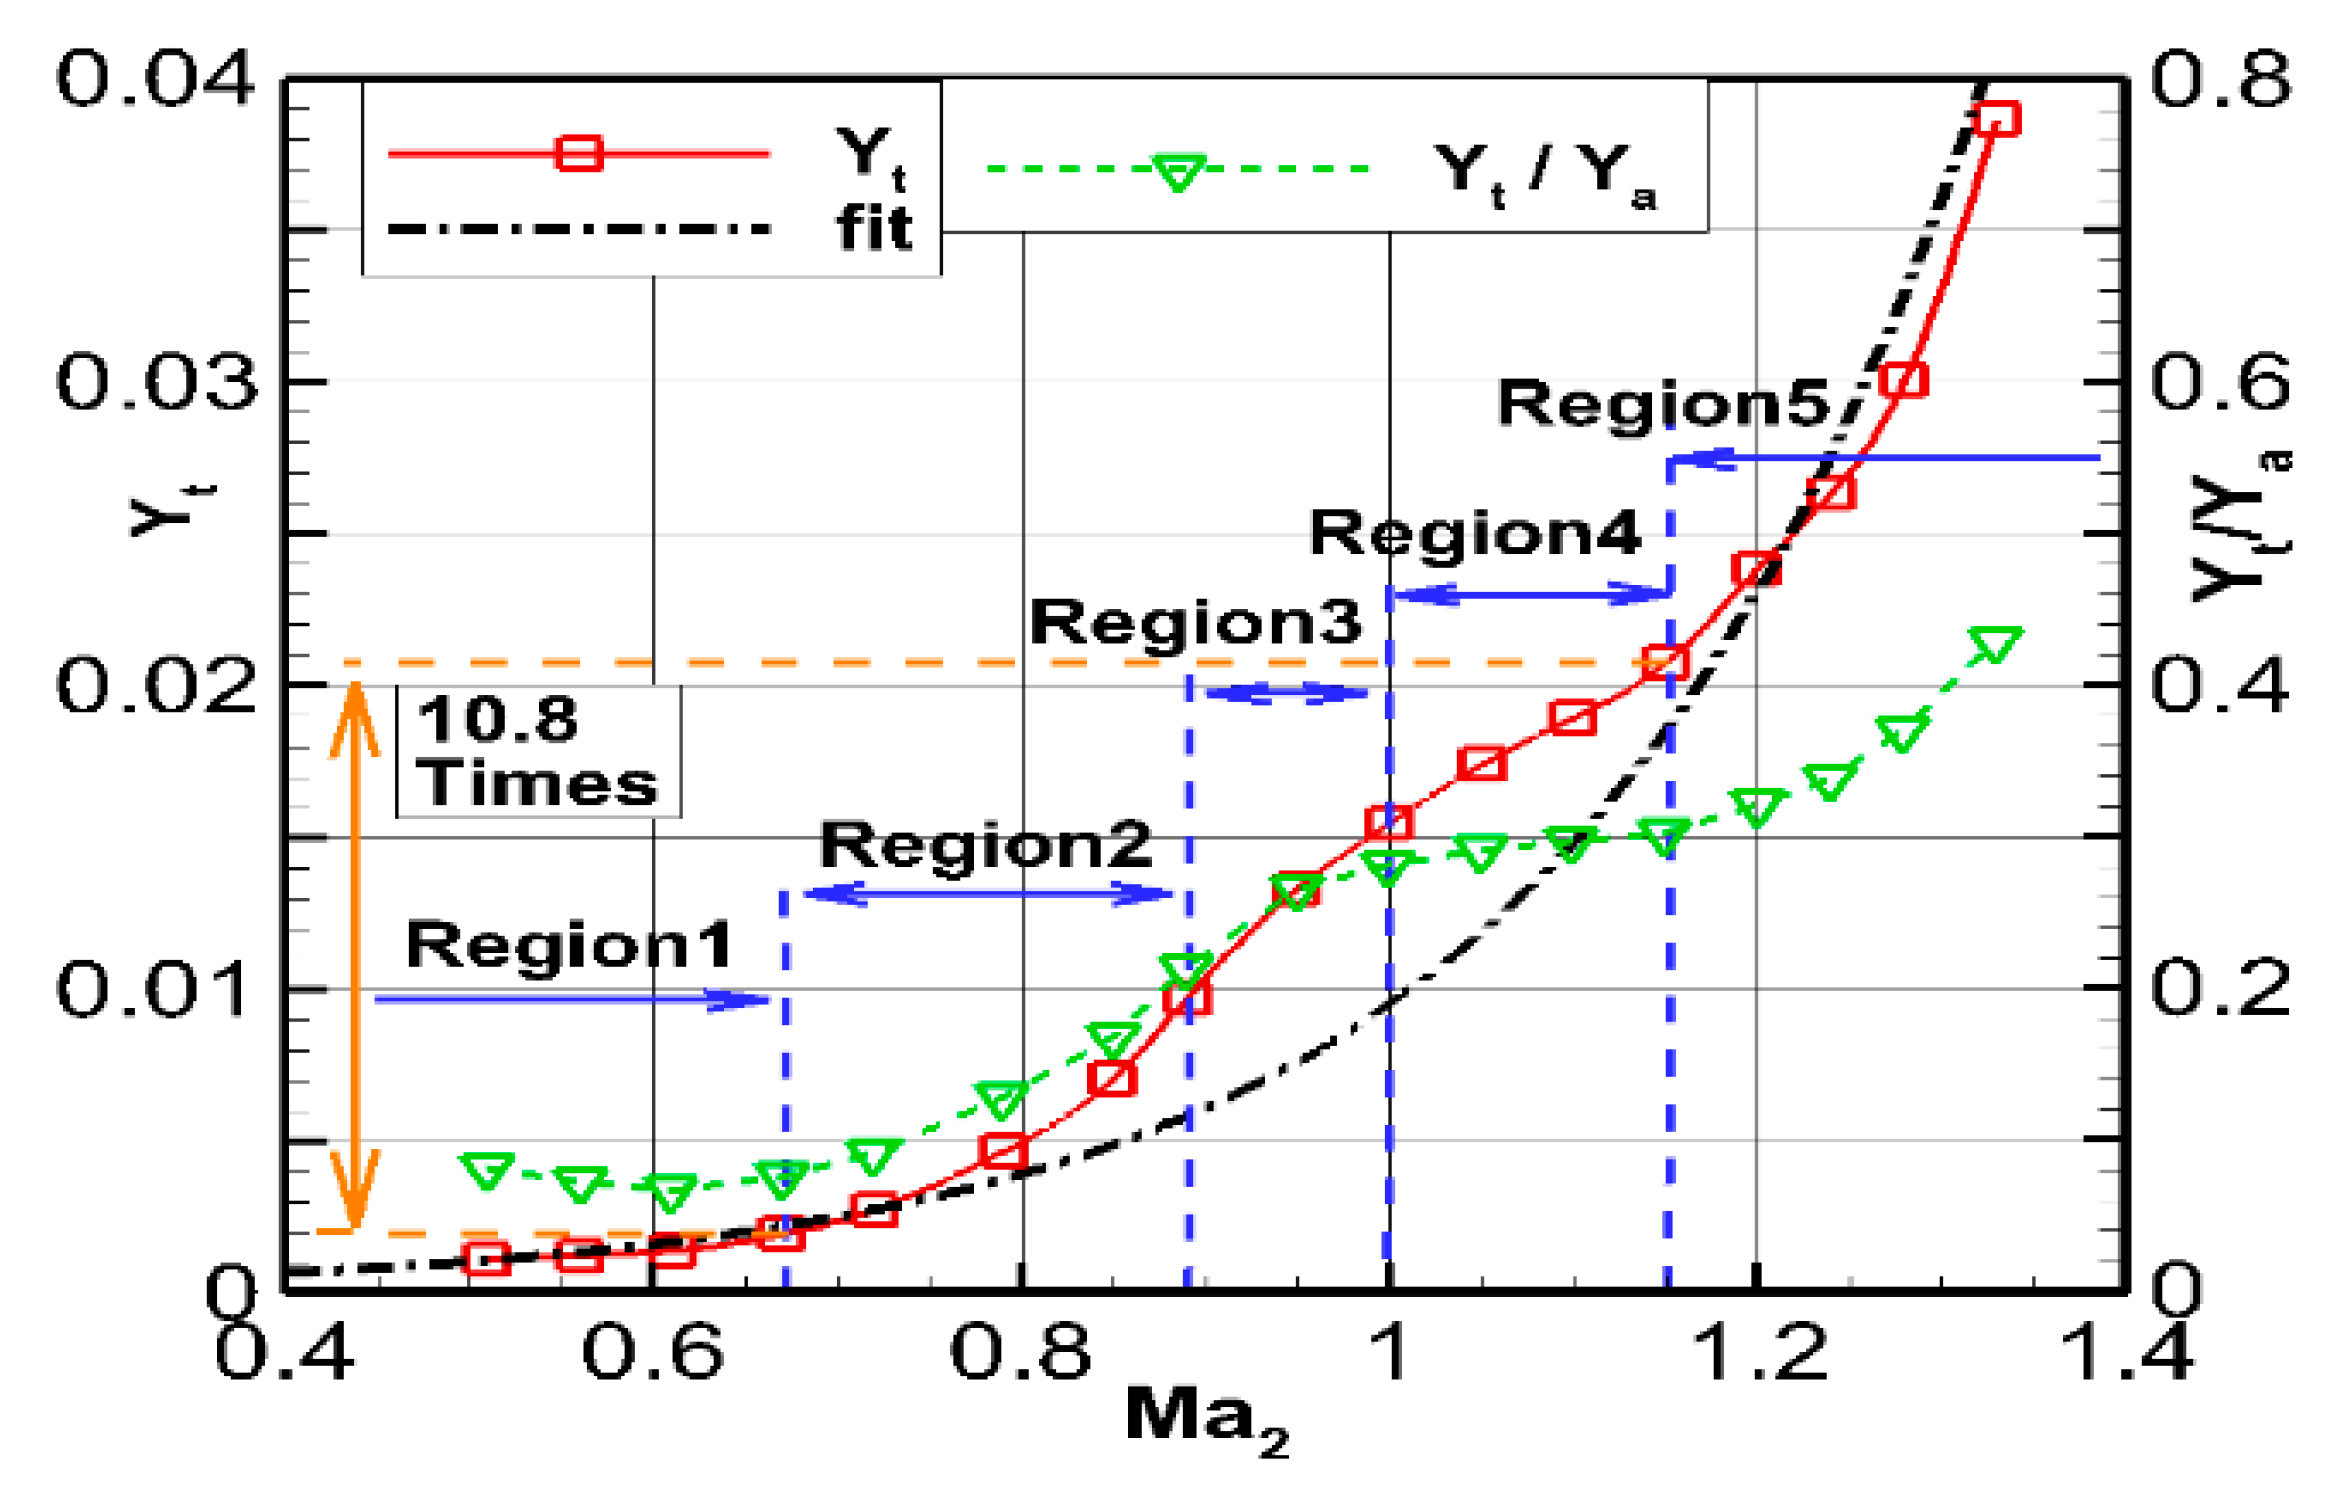
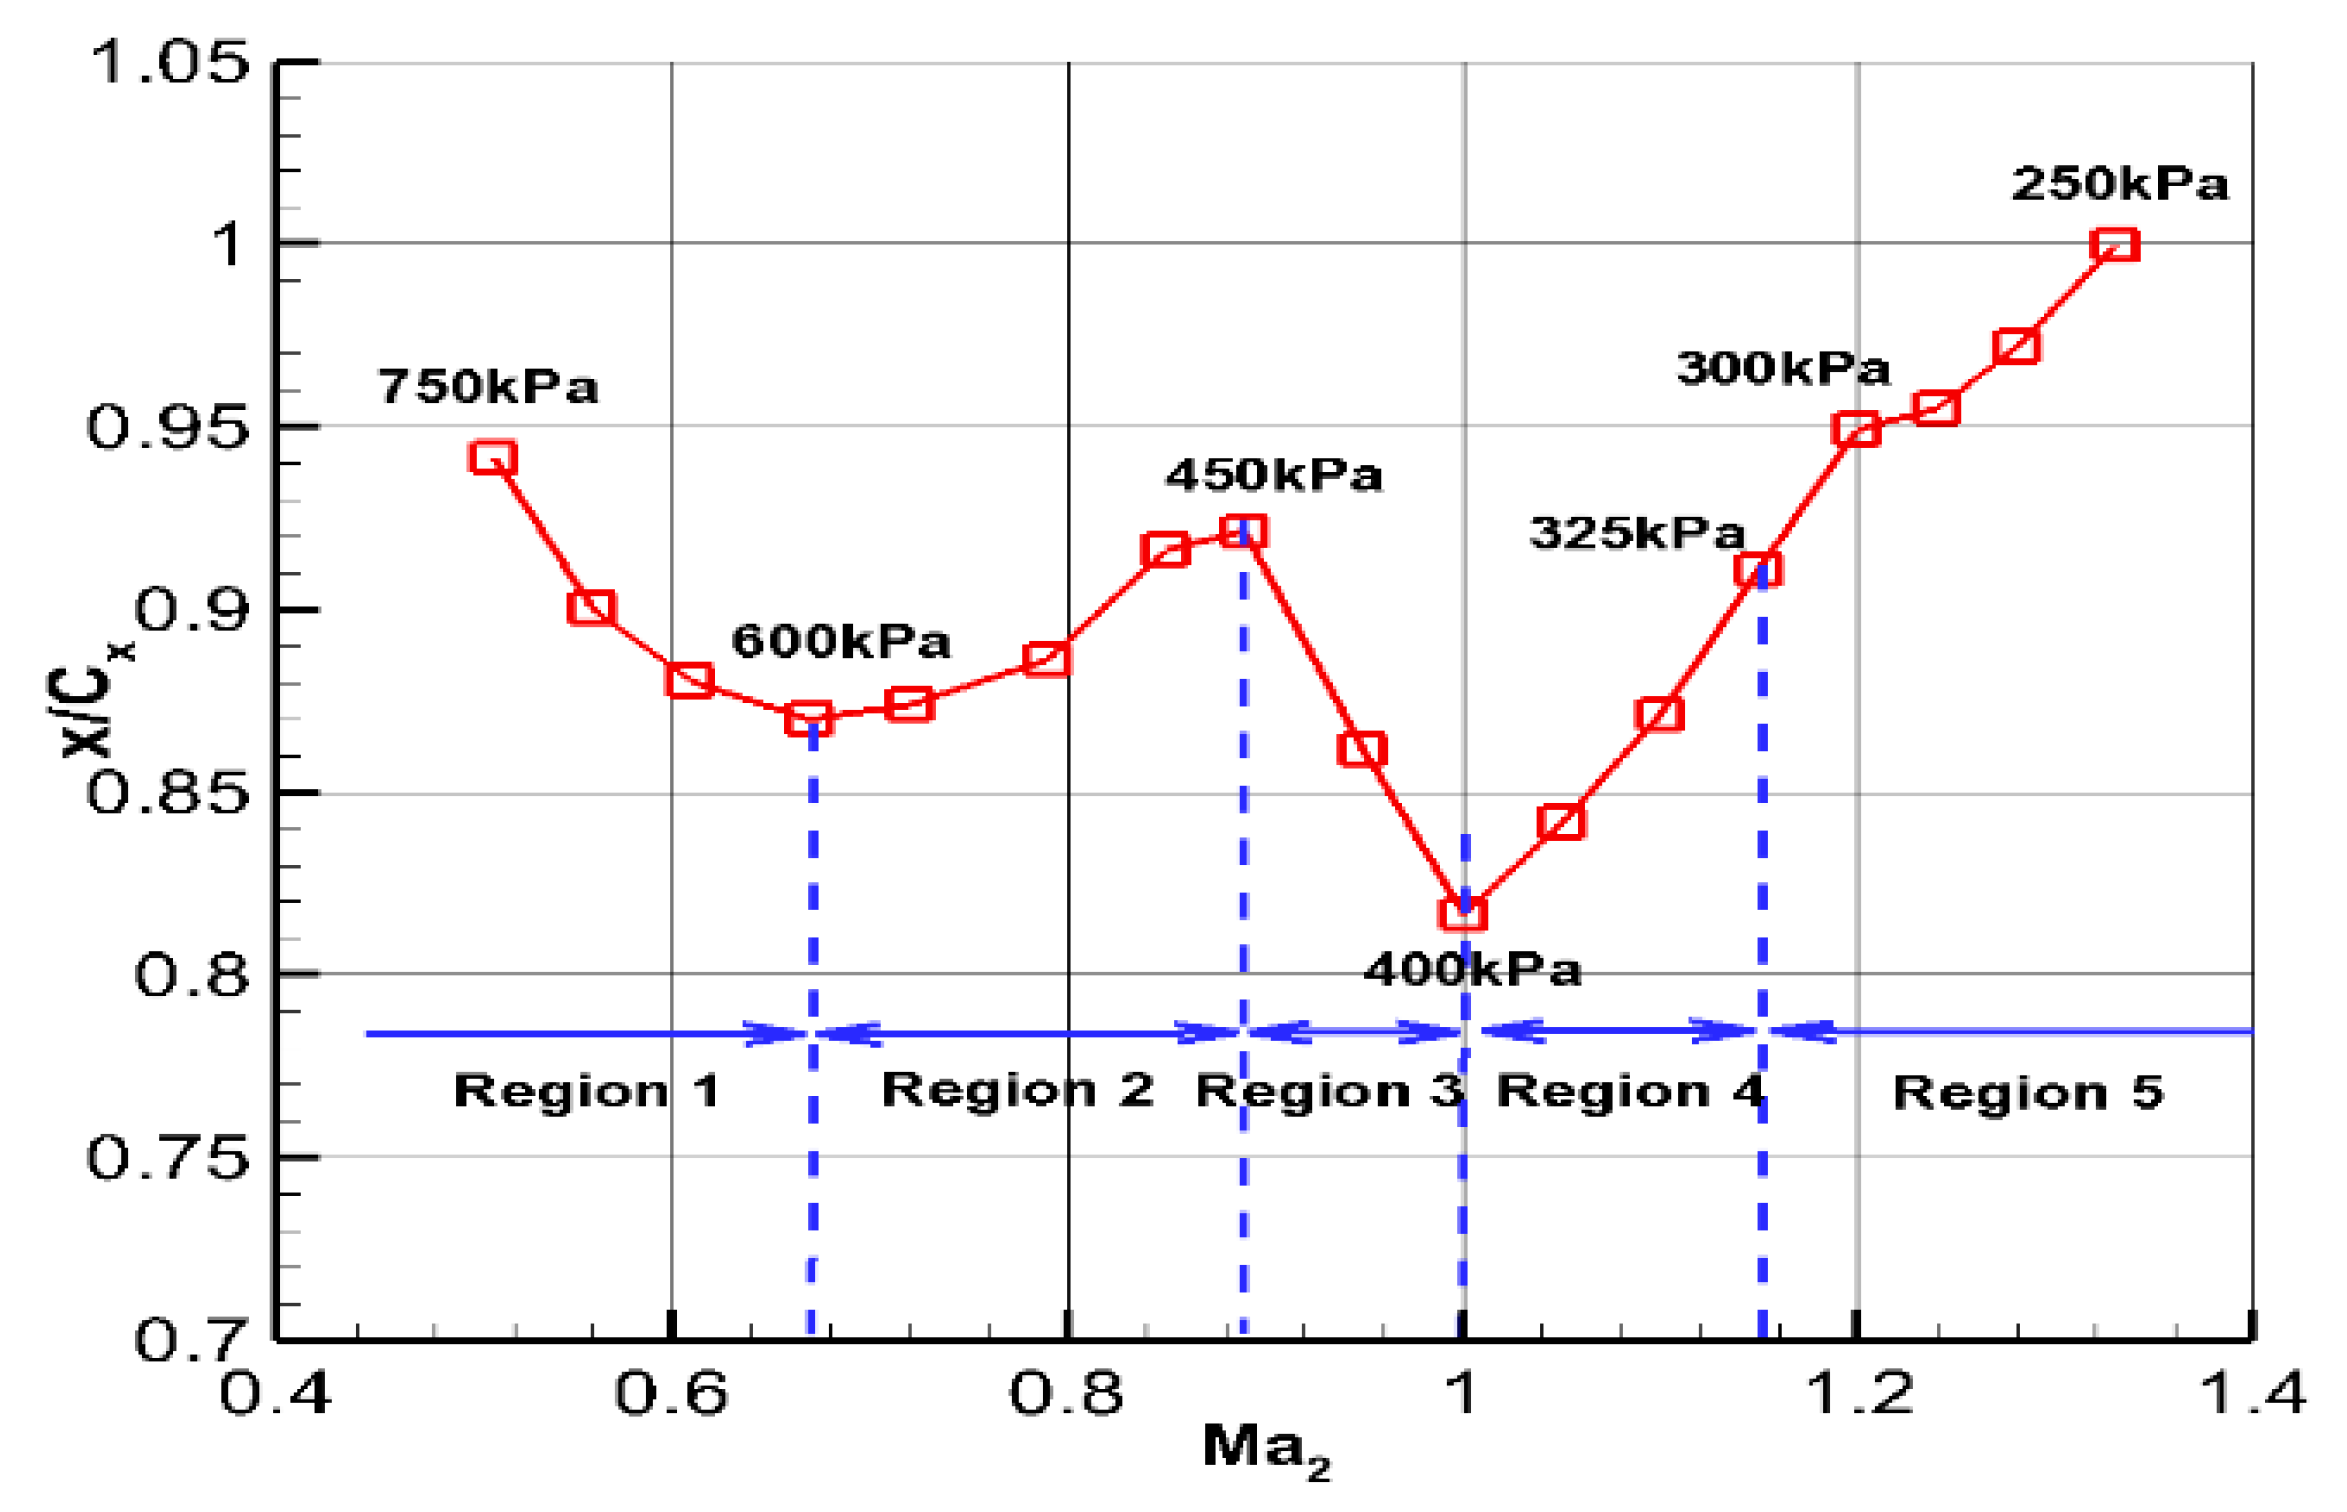
3.1.2. Loss in the Leakage Vortex

In Figure 9, the red line shows the tip-leakage vortex loss by simulations with different outlet Mach numbers. It is worth noting that the exponential curves fitted to the loss are presented with a black dotted line. Moreover, Figure 9 shows the ratio of the leakage vortex loss Y t to the total loss of the blade passage Y a (green dotted line).
It is observed that the overall increment of the leakage vortex loss of the rotor is almost exponential. As the outlet Mach number Ma2 increases from 0.67 (Pb = 600 kPa) to 1.15 (Pb = 325 kPa), the loss in the leakage vortex increases by nearly 10 times, whose proportion to the total loss increases from 6.5% to 30.2%. Moreover, it continually increases as the increase of outlet Mach number increases. Moreover, it is found that the ratio of the profile loss Yp in the total loss in this rotor is almost between 40% and 50%.
Compared with the pure exponential growth, the change curve of the leakage vortex loss Yt is more complicated. Figure 9 illustrates that the growth is divided into five regions according to the change of the leakage vortex loss. The green dotted line shows that when the outlet Mach number is lower than 0.67, the proportion of the leakage vortex loss Yt/Ya decreases as the Mach number increases.
According to the definition of the critical Mach number [5], the critical Mach number can be set as 0.67 and marked as region 1, in which the flow within the turbine passage is subsonic. It should be indicated that the leakage vortex grows slowly in region 1. The growth rates of the leakage loss in regions 2 and 3 are greater than that of the exponential curve. The growth rate in region 2 gradually increases and the growth rate in region 3 gradually decreases. The growth rate in region 4 is smaller than that of the exponential curve. Moreover, the growth rate in region 5 becomes equivalent to that of the exponential curve.
Therefore, the loss within the leakage vortex increases sharply and becomes the main part of the overall loss as the outlet Mach number increases, resulting in a drop of the efficiency by more than 5 percent. Moreover, the leakage loss changes differently in various ranges of the Mach number. Therefore, leakage loss is an important aspect of a transonic turbine.
Figure 10 shows the span-wise scale Δ and loss peak Ypk of the leakage vortex along the outlet Mach number. It also shows that there are five regions corresponding to those in Figure 9. In region 2, 3 and 4, the span-wise scale Δ of the leakage vortex between Mach number 0.67 and 1.10 increases for the first time, while the span-wise scale increases from 0.16 to 0.195 (about 1.2 times). However, in region 5 (Mach number above 1.10), a rapid increment is observed. From region 2 to region 4, the leakage vortex scale only doubles and remains within a certain range, while the peak leakage loss increases rapidly. In region 5, both the scale and the loss peak of the leakage vortex increase significantly, which corresponds to the approximate exponential increment of the leakage loss in region 5. Therefore, it indicates that the influence on loss is correlated to the change of the tip-leakage vortex.

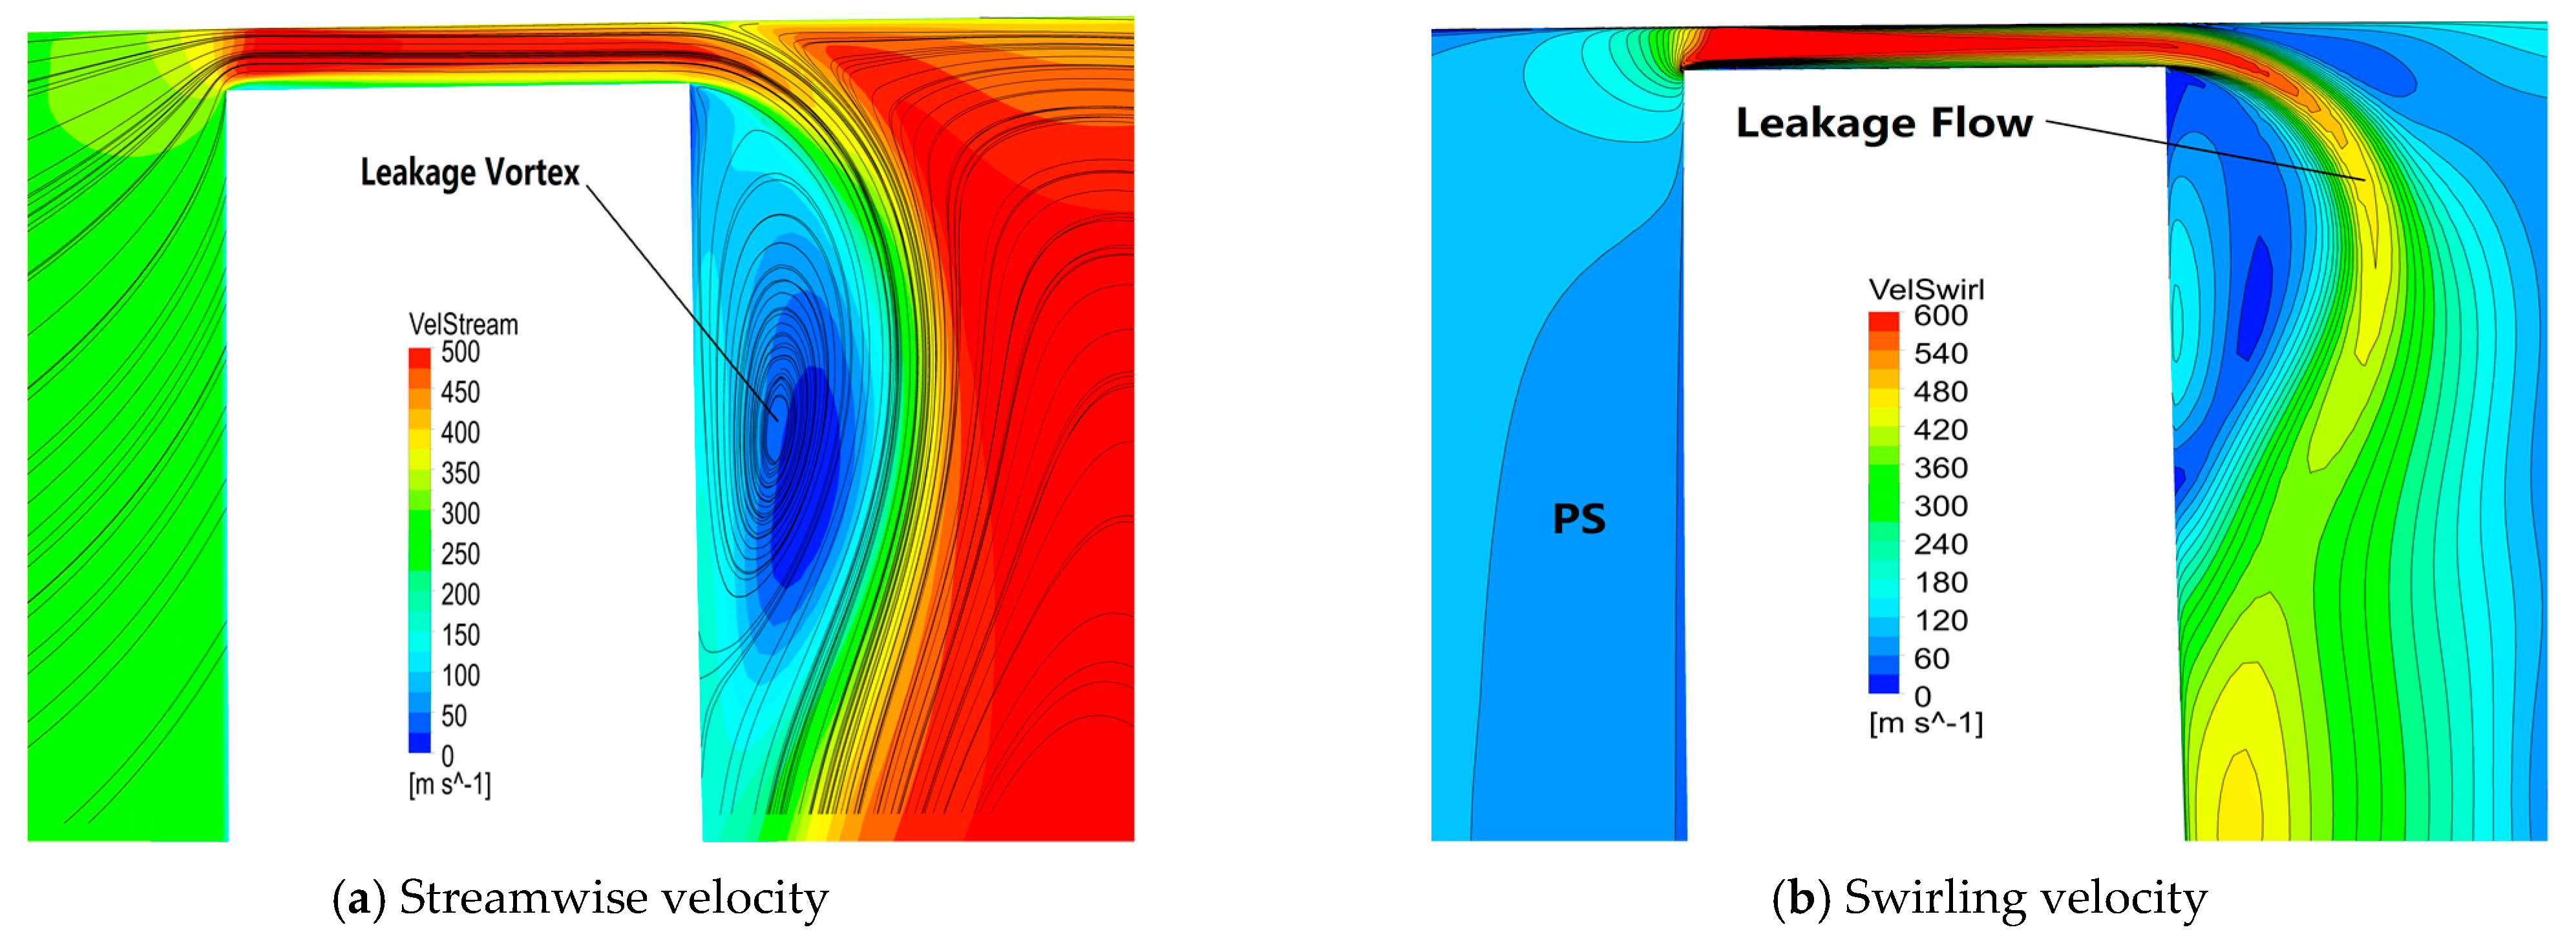
3.2. Flow within the Leakage Vortex

In order to investigate the flow within the leakage vortex, Figure 11 shows the relative Mach number contour on 95% span, which is located near the tip-leakage vortex core. It is observed that the tip-leakage vortex develops downstream along the suction surface and the flow direction of the leakage vortex is different from the main flow. As a result, there is an obvious bound. While the high-speed region appears in the throat regions, an obvious low-speed and a separated flow region appears on the suction side downstream it. Figure 11c shows that the separation that occurred in the leakage vortex core originates from the vortex breakdown [11].
The separation region after breakdown stays near the suction-side corner region instead of flowing towards the pressure side. This is caused by the effect of the transverse pressure gradient, which is different from the tip-leakage vortex in the rotor of the compressor [18,31,32].
Figure 11g presents that as the outlet Mach number increases, there is a shock wave in the passage clearly from the trailing edge of the adjacent blade to the blade suction side, termed as “internal fishtail shock” or “incident shock”. The incident shock interacts with the leakage vortex in the passage and the interaction position moves downstream as the outlet Mach number increases.

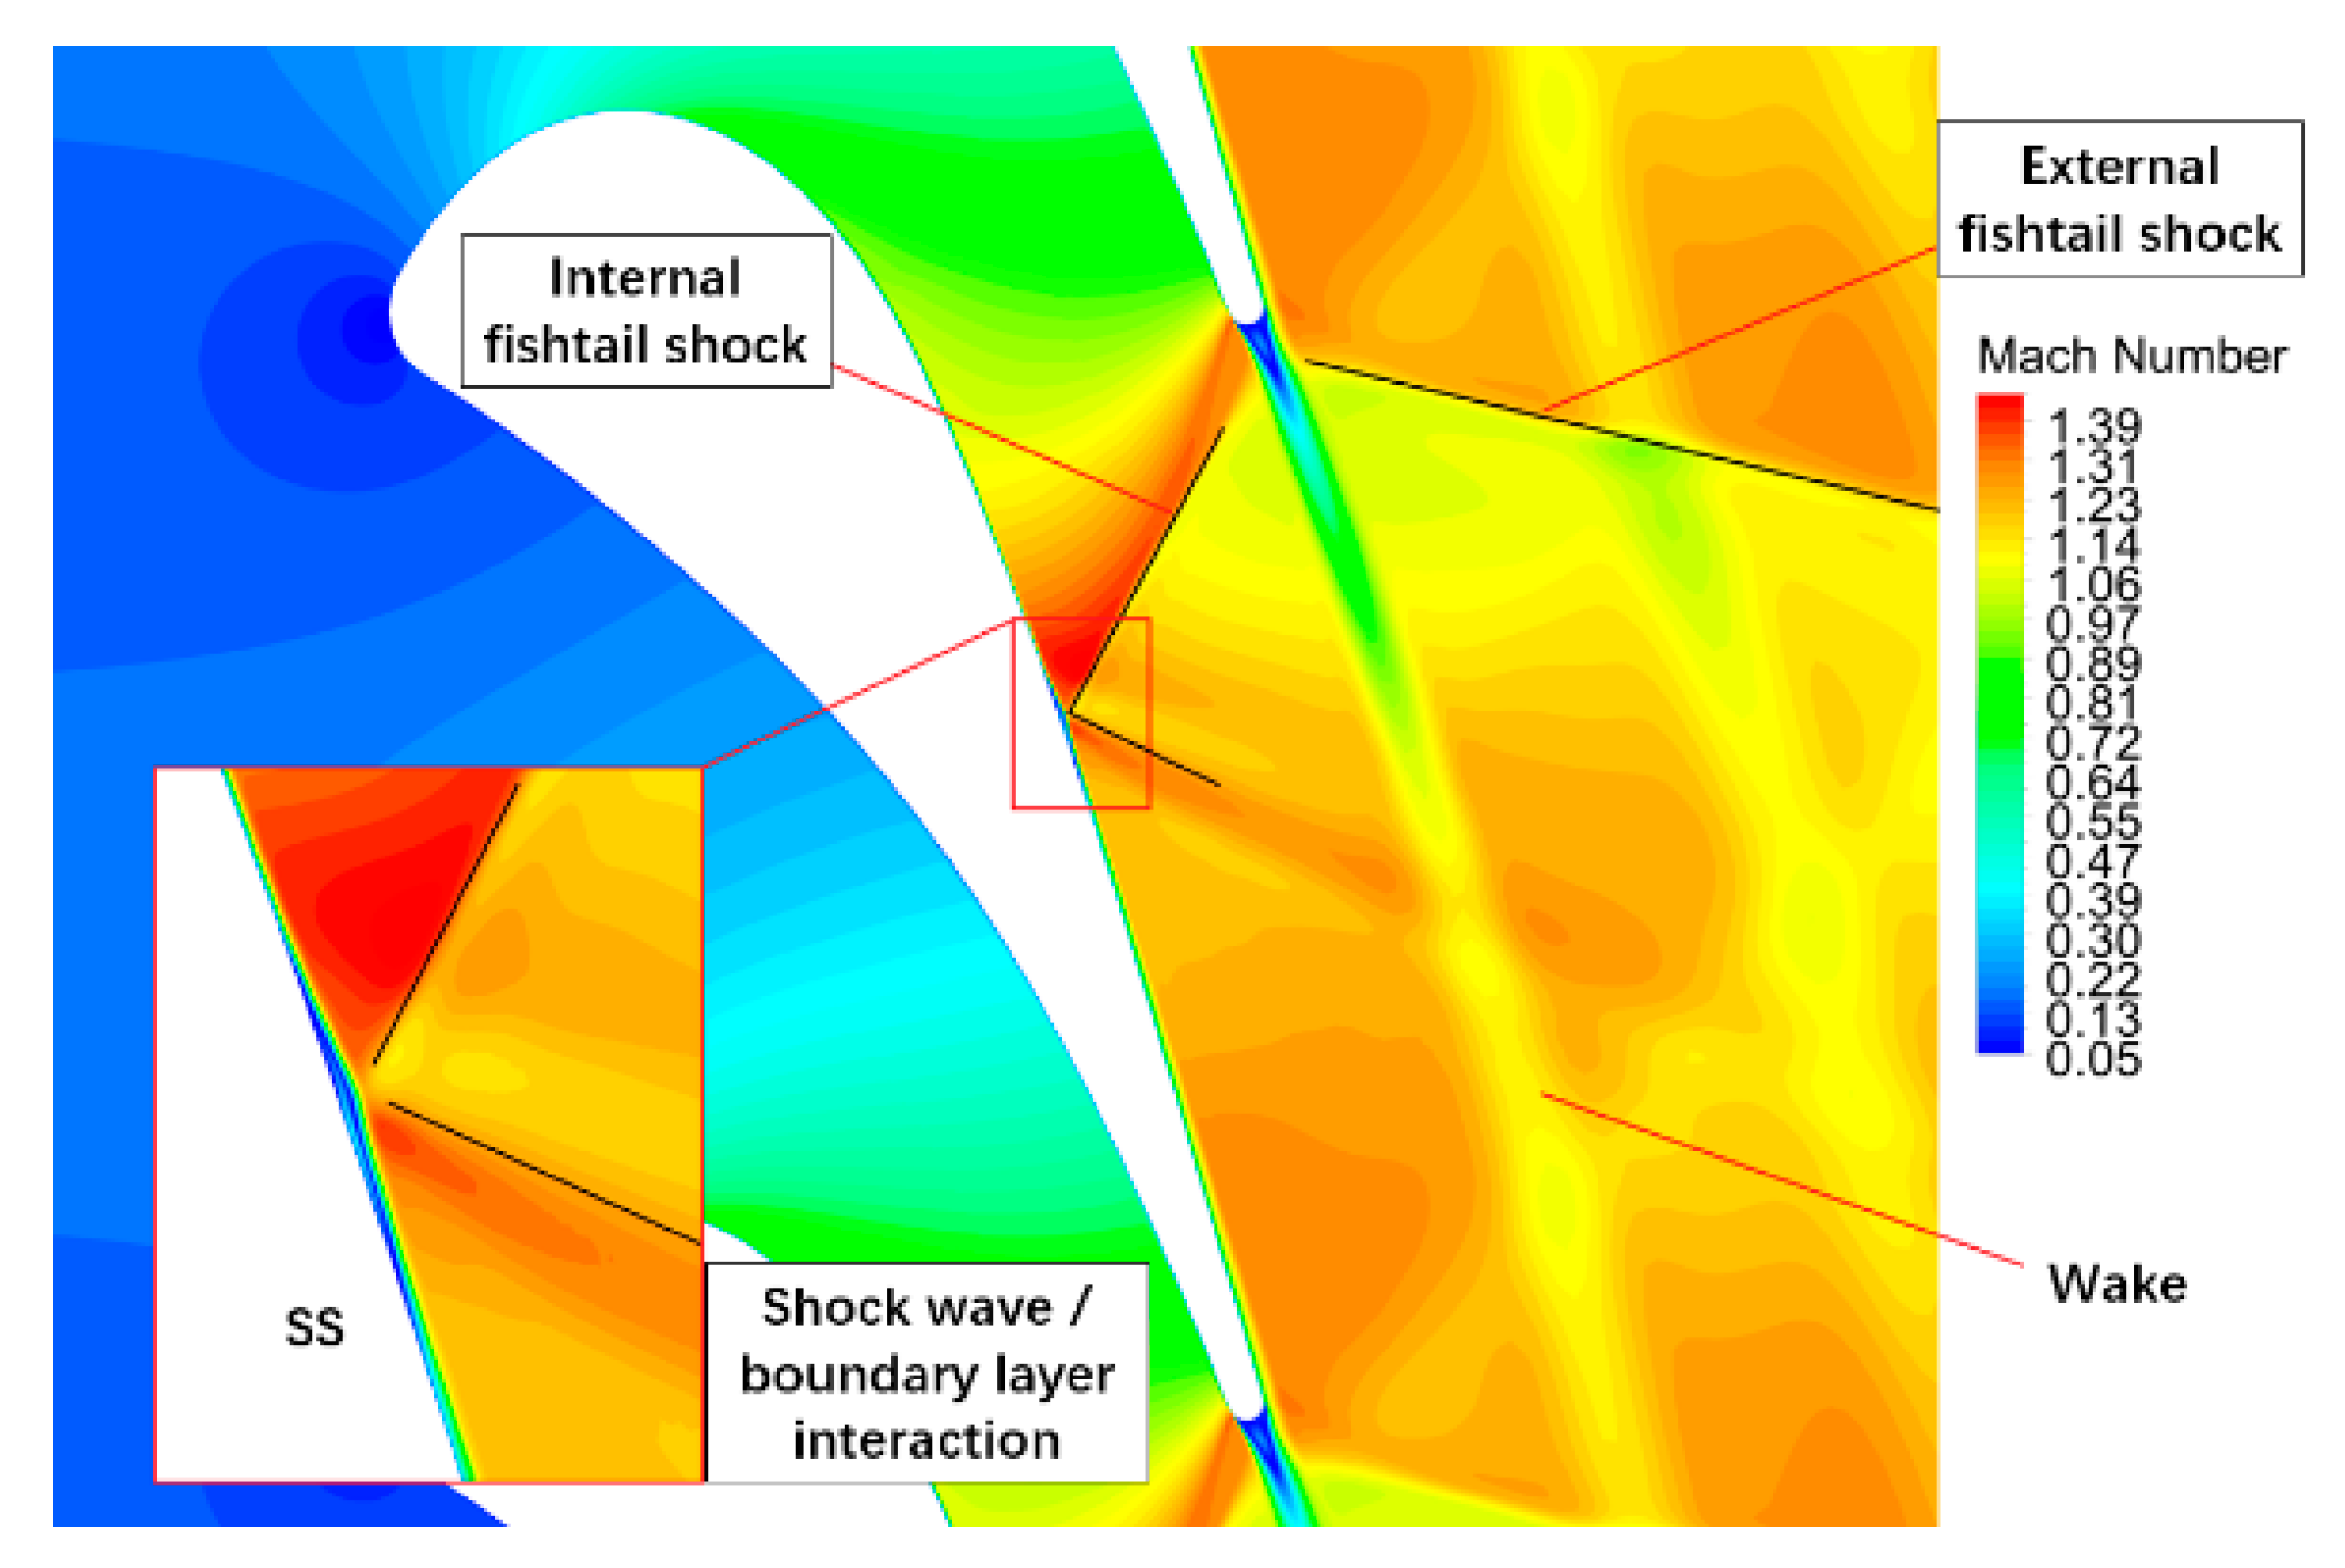
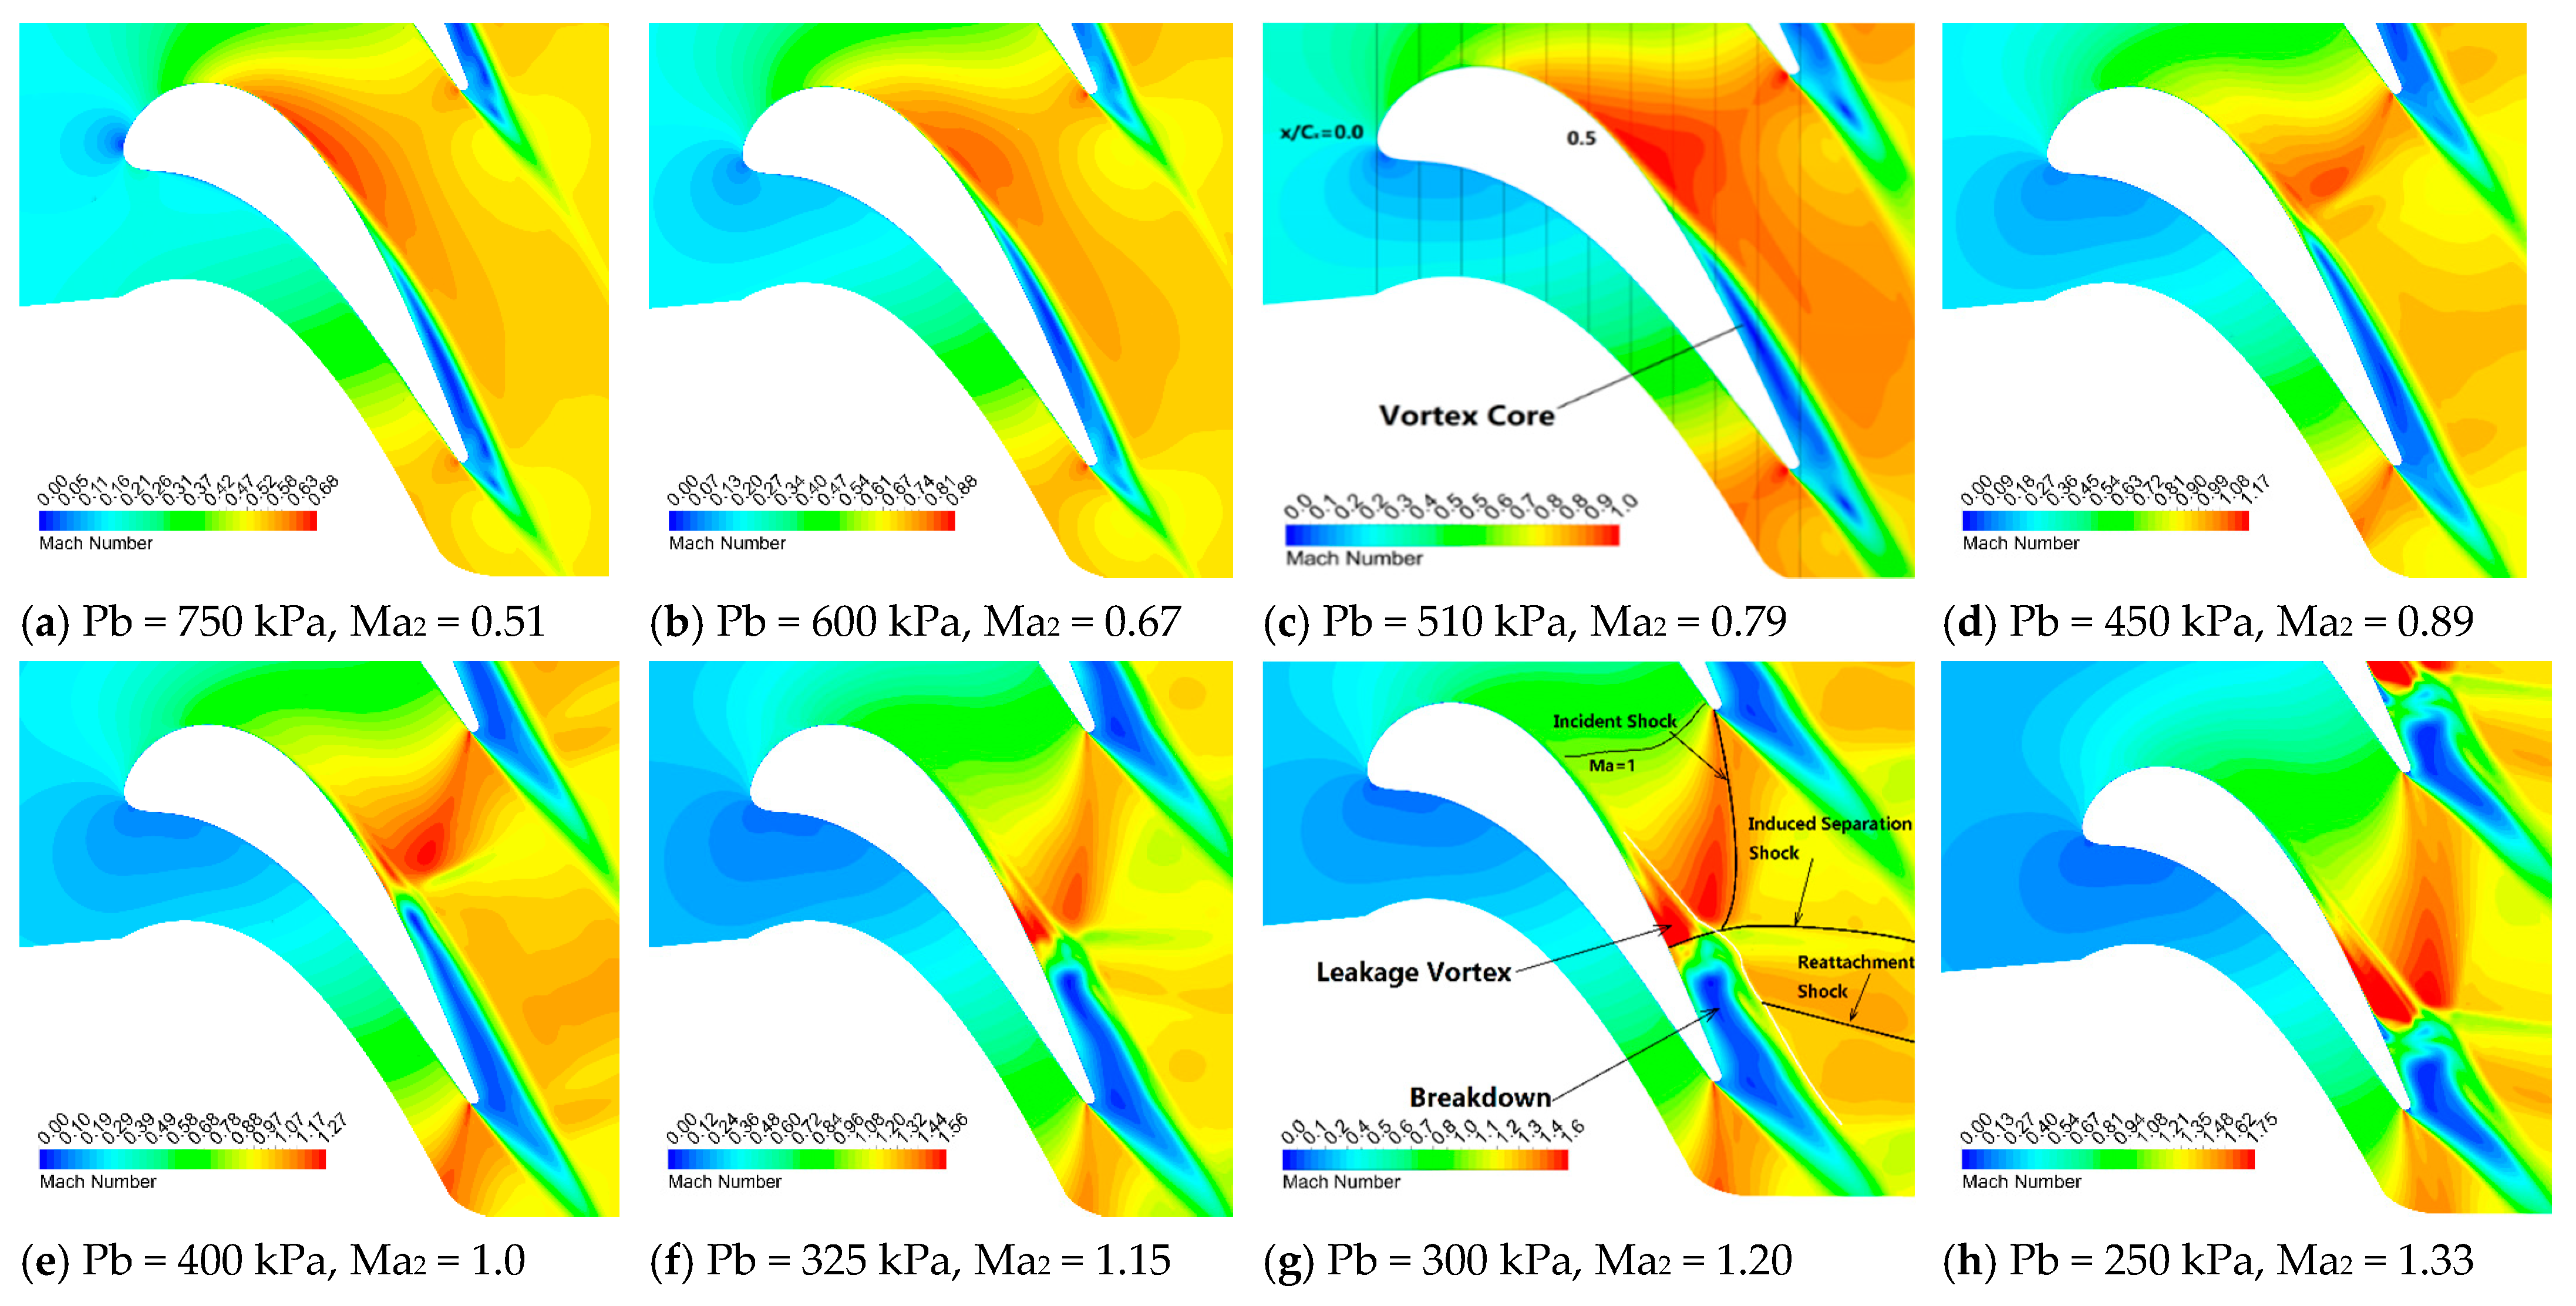
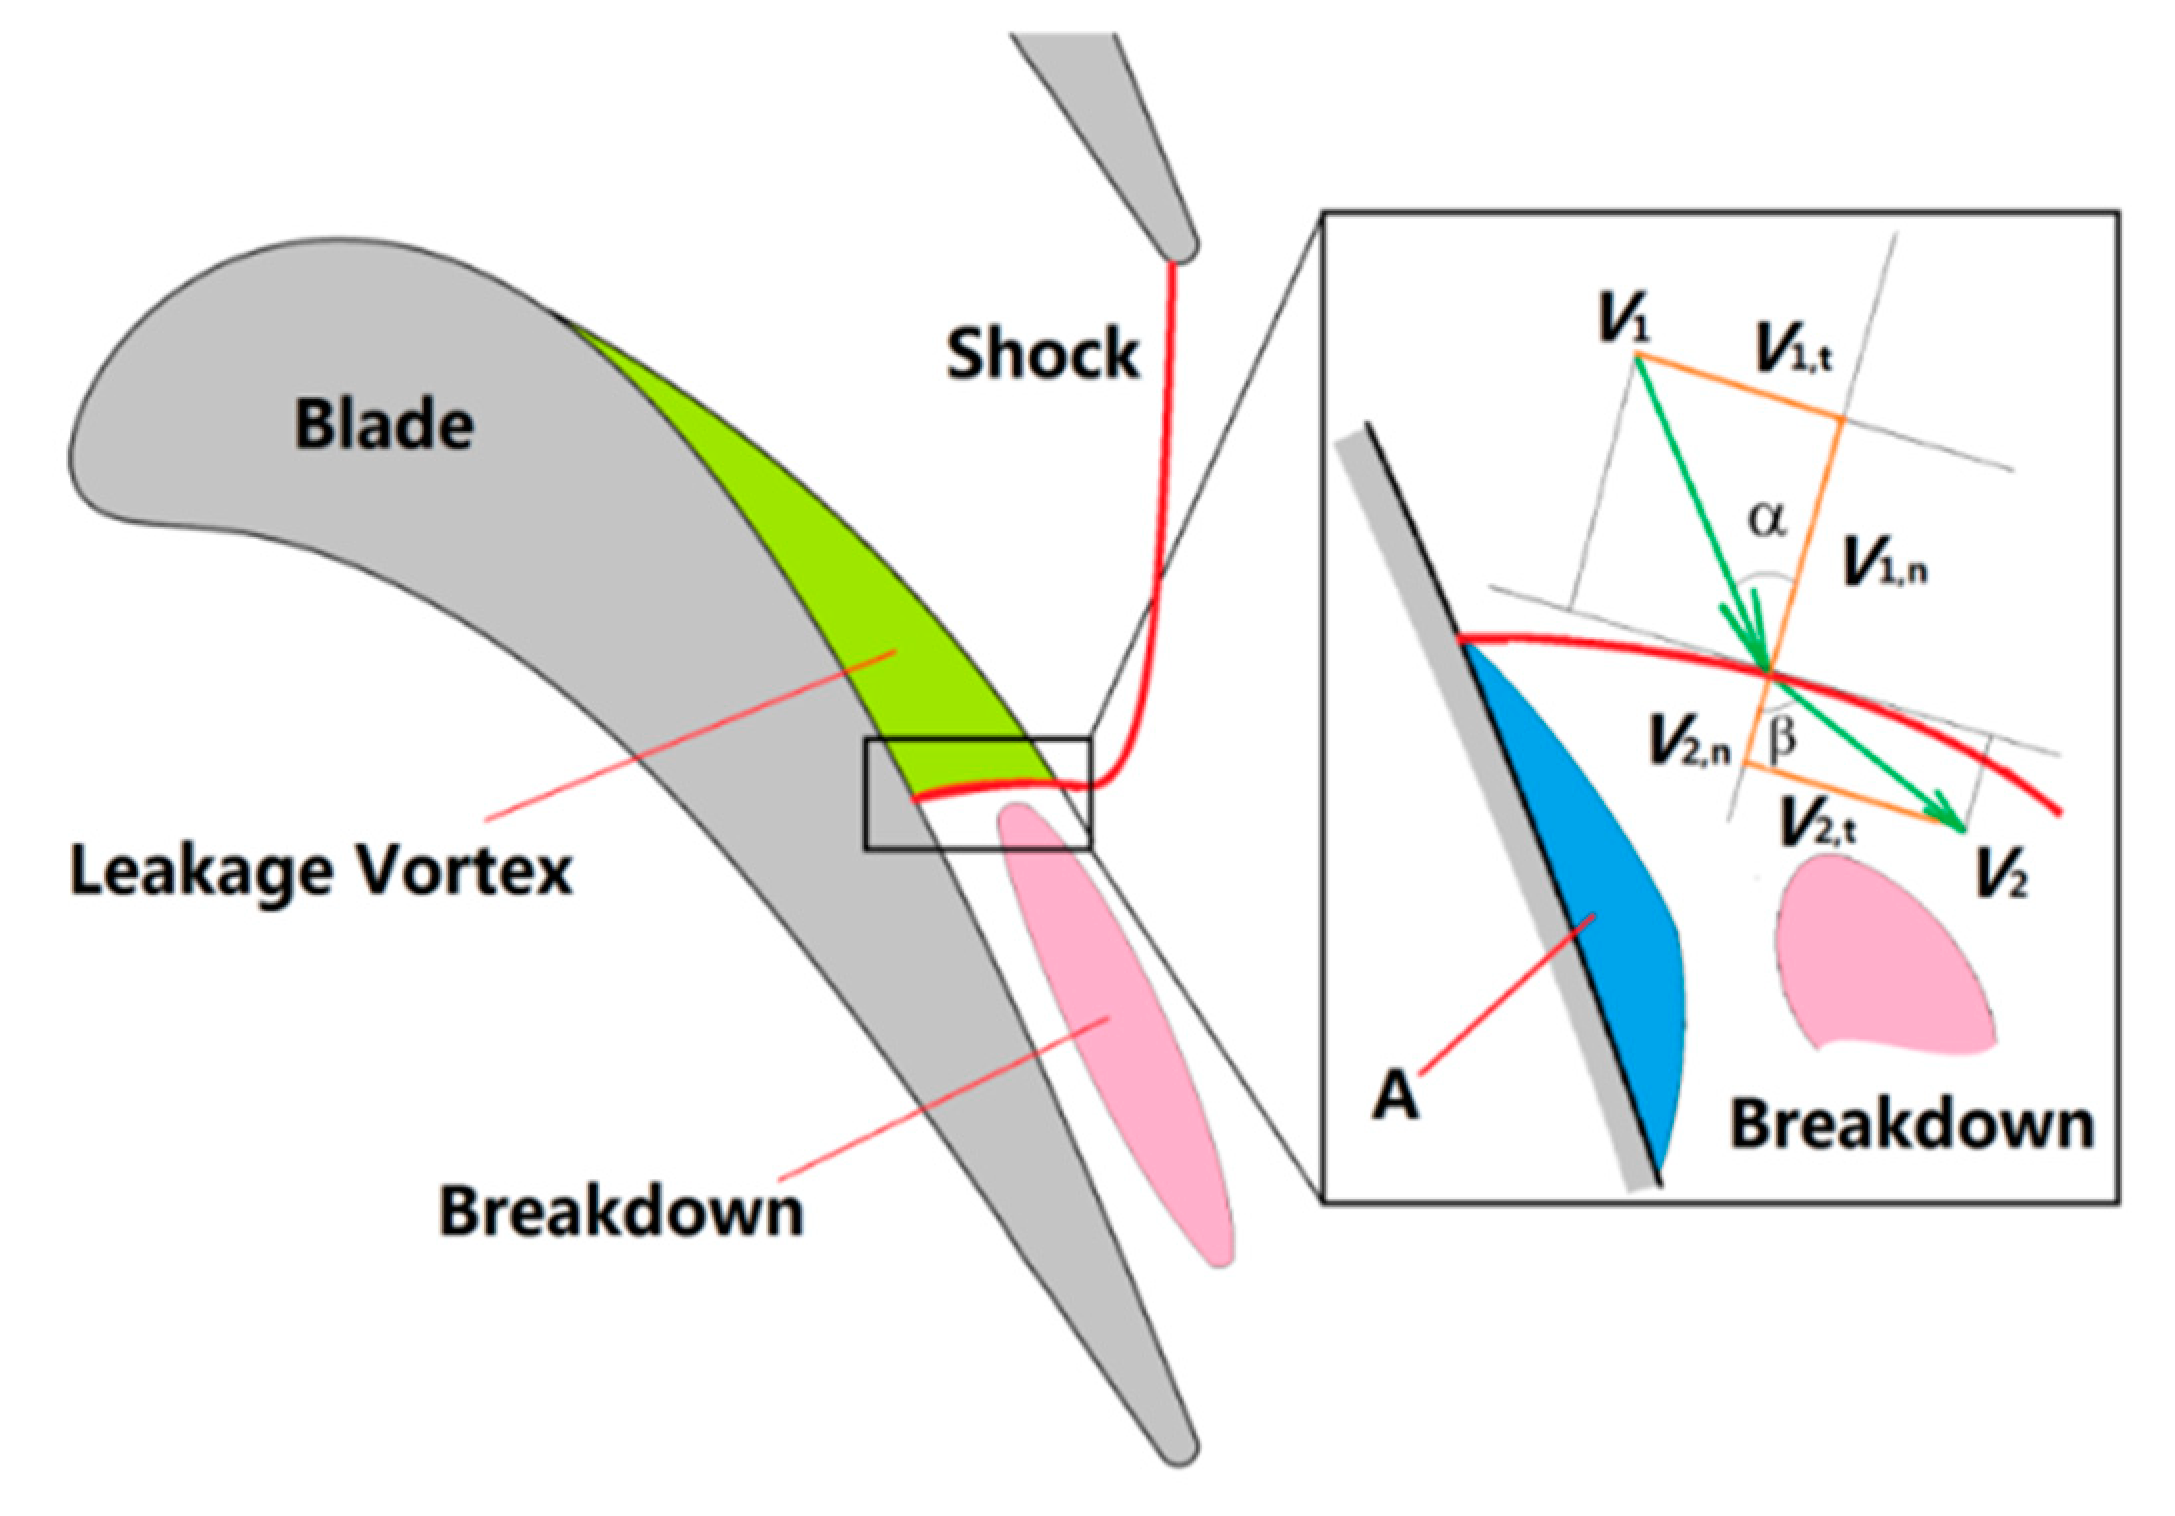
3.2.1. Interaction between Shock Wave and Tip-Leakage Vortex

Figure 11g shows that for the incident shock, because of the sudden expansion of the vortex core, the supersonic mainstream outside the vortex core is disturbed and a compression shock wave is formed, which is called “induced separation shock”. Due to the oblique shock wave, the fluid on the surface of the vortex core flows away from the blade surface and then the tip-leakage vortex turns back to the blade surface because of the transverse pressure gradient of the turbine passage. Since the main flow velocity flows to the leakage vortex surface, a third shock wave is formed, which is called the reattachment shock. The flow between the induced separation shock and the reattachment shock gradually expands and forms a series of expansion waves. This process has a direct impact on the shape of the leakage vortex after its breakdown.
Figure 11g shows that for the leakage vortex in the supersonic flow, there is a series of expansion waves between the throat (Ma = 1) and the incident shock wave and the flow in the leakage vortex core is under a negative pressure gradient. It accelerates the leakage vortex core flow, which suppresses its flow instability. However, the excessive expansion after the expansion wave leads to shock waves (strong oblique shock waves) in the leakage vortex. Due to the rapid rise of the pressure through the shock wave, the axial velocity of the leakage vortex core decreases. However, the rotating velocity parallel to the shock surface is almost unchanged. Therefore, the vortex core becomes unstable and rapidly expands under the rotating motion. Then, the vortex breakdown occurs almost downstream to it. After the breakdown of the leakage vortex, the velocity in the vortex core drops to zero rapidly, forming a stagnation point and a separation flow region. The above is the breakdown process of the tip-leakage vortex after interaction with the shock wave.
Therefore, it can be inferred that the increment of the leakage loss is correlated to the interaction between the leakage vortex and the shock wave.

3.2.2. Effect of the Shock Wave on the Leakage Vortex

Figure 11 shows the breakdown area and process of the leakage vortex change in five regions of the outlet Mach number.
Before Ma2 equals 1.15 (Figure 11e–f), the shape of the leakage vortex is symmetrical in the initial area of breakdown, like a “cone” expansion shape. When the Ma2 is higher than 1.15, the low-velocity region in the vortex core becomes an asymmetrical shape after passing through the shock.
Therefore, it indicates that the effect of the shock wave interference of the latter is stronger than that of the former and the leakage vortex core still breaks up by centrifugal instability after the shock wave. Meanwhile, Figure 11f shows that the expansion of the vortex core at this time causes an obvious strong shock wave in the mainstream.
As the shock wave interference increases, the centrifugal force caused by the rotating motion of the vortex core cannot hold by the pressure gradient of the main flow to the vortex core. Figure 11f,h shows that the breakdown caused by the centrifugal force occurs instantaneously and the influence of the interaction extends to the shear layer flow on the surface of the leakage vortex.
Combined with the research of Hiejima [33], the intensity of the interaction between the shock wave and the stream-wise vortex directly determine the breakdown pattern of the vortex and the flow pattern after breakdown, accordingly the loss behind the shock wave. This can be observed from the change of the leakage vortex pattern in Figure 10. However, the unsteady nature of this process needs further investigation and will not be discussed in the present study.
Figure 11a–d shows that when there is no shock wave in the passage (before Figure 11c), the change of the leakage vortex breakdown position is mainly affected by the leakage vortex intensity and the main flow. Moreover, the vortex instability breakage is the main reason for the loss of the leakage vortex.
When a shock wave appears in the passage, the interaction between the shock wave and the leakage vortex is the main reason for the leakage vortex breakdown. This can be concluded from the change of the breakdown position with the shock wave interference position.
As Figure 11f–h (region 5) shows, as the outlet Mach number increases, the position of the trailing edge incident shock hit on the suction side moves backward, the length of the low-velocity area decreases and the low-velocity area after the vortex breakdown disappears quickly. The reduction of the length indicates the increment of the velocity gradient. Therefore, stronger mixing occurs between the low-velocity flow in the leakage vortex and the supersonic flow of the mainstream.
Moreover, it is found that the flow in the surface shear layer of the leakage vortex with strong interference is unstable and strong mixing loss between the vortex core flow and the main flow occurs after the breakdown.
Therefore, the strong interference caused by the enhancement of the shock wave and the strong mixing loss with the mainstream after a breakdown are the main reasons for the increase of the leakage vortex loss. The intensity and position of the shock wave have a direct impact on the breakdown of the tip-leakage vortex after the shock wave appears. The interaction changes the breakdown position of the leakage vortex and the mixing strength of the leakage vortex with the mainflow.

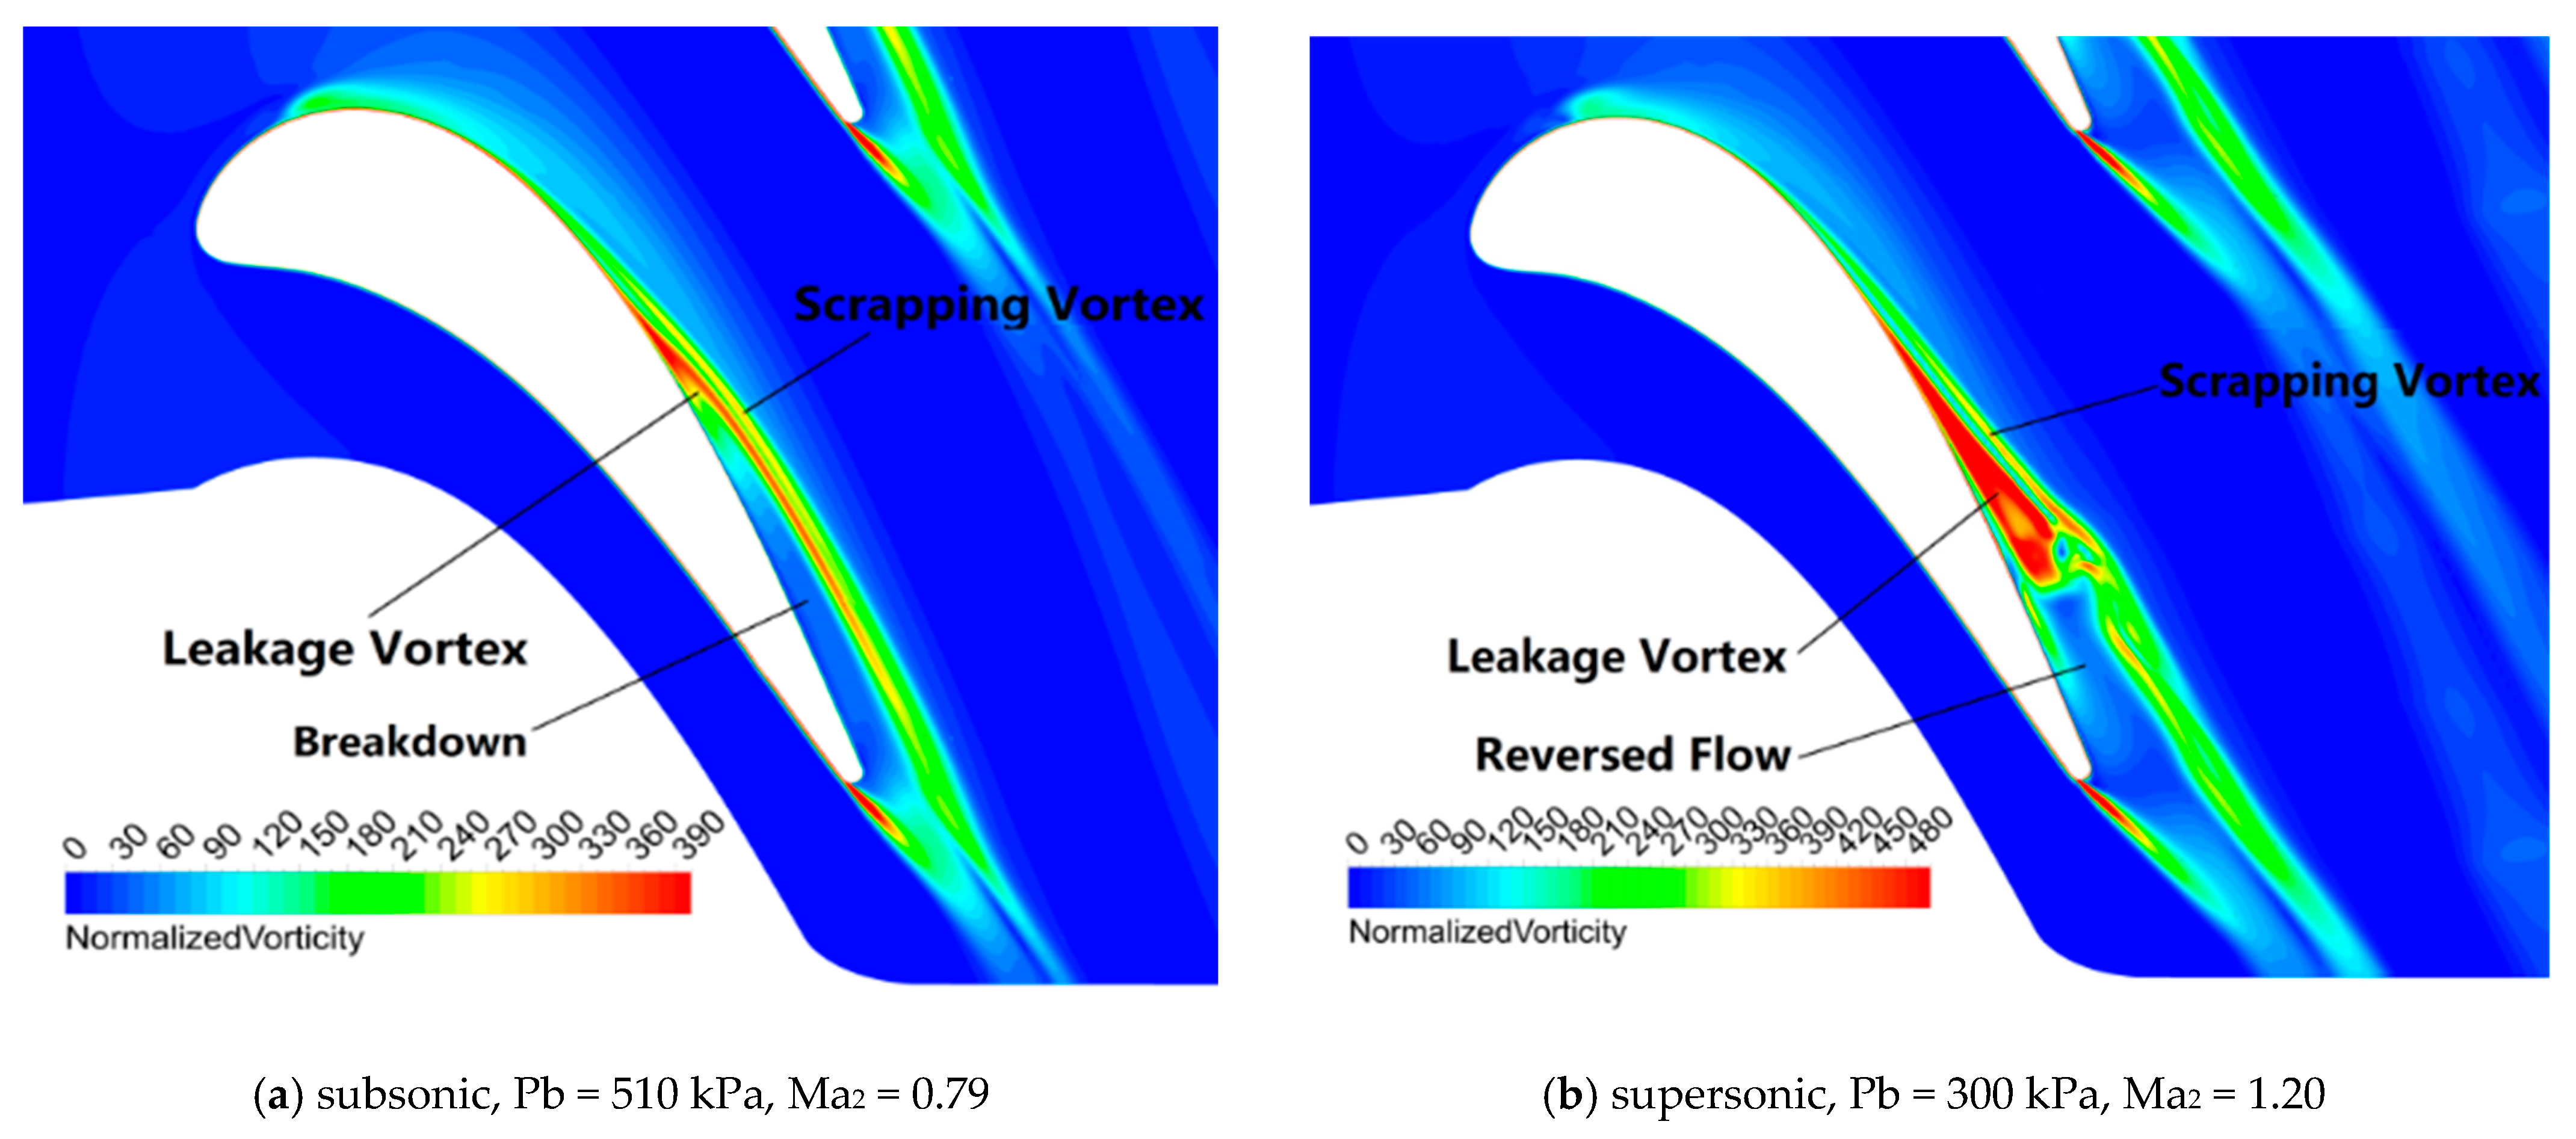
3.3. Breakdown of the Leakage Vortex Core

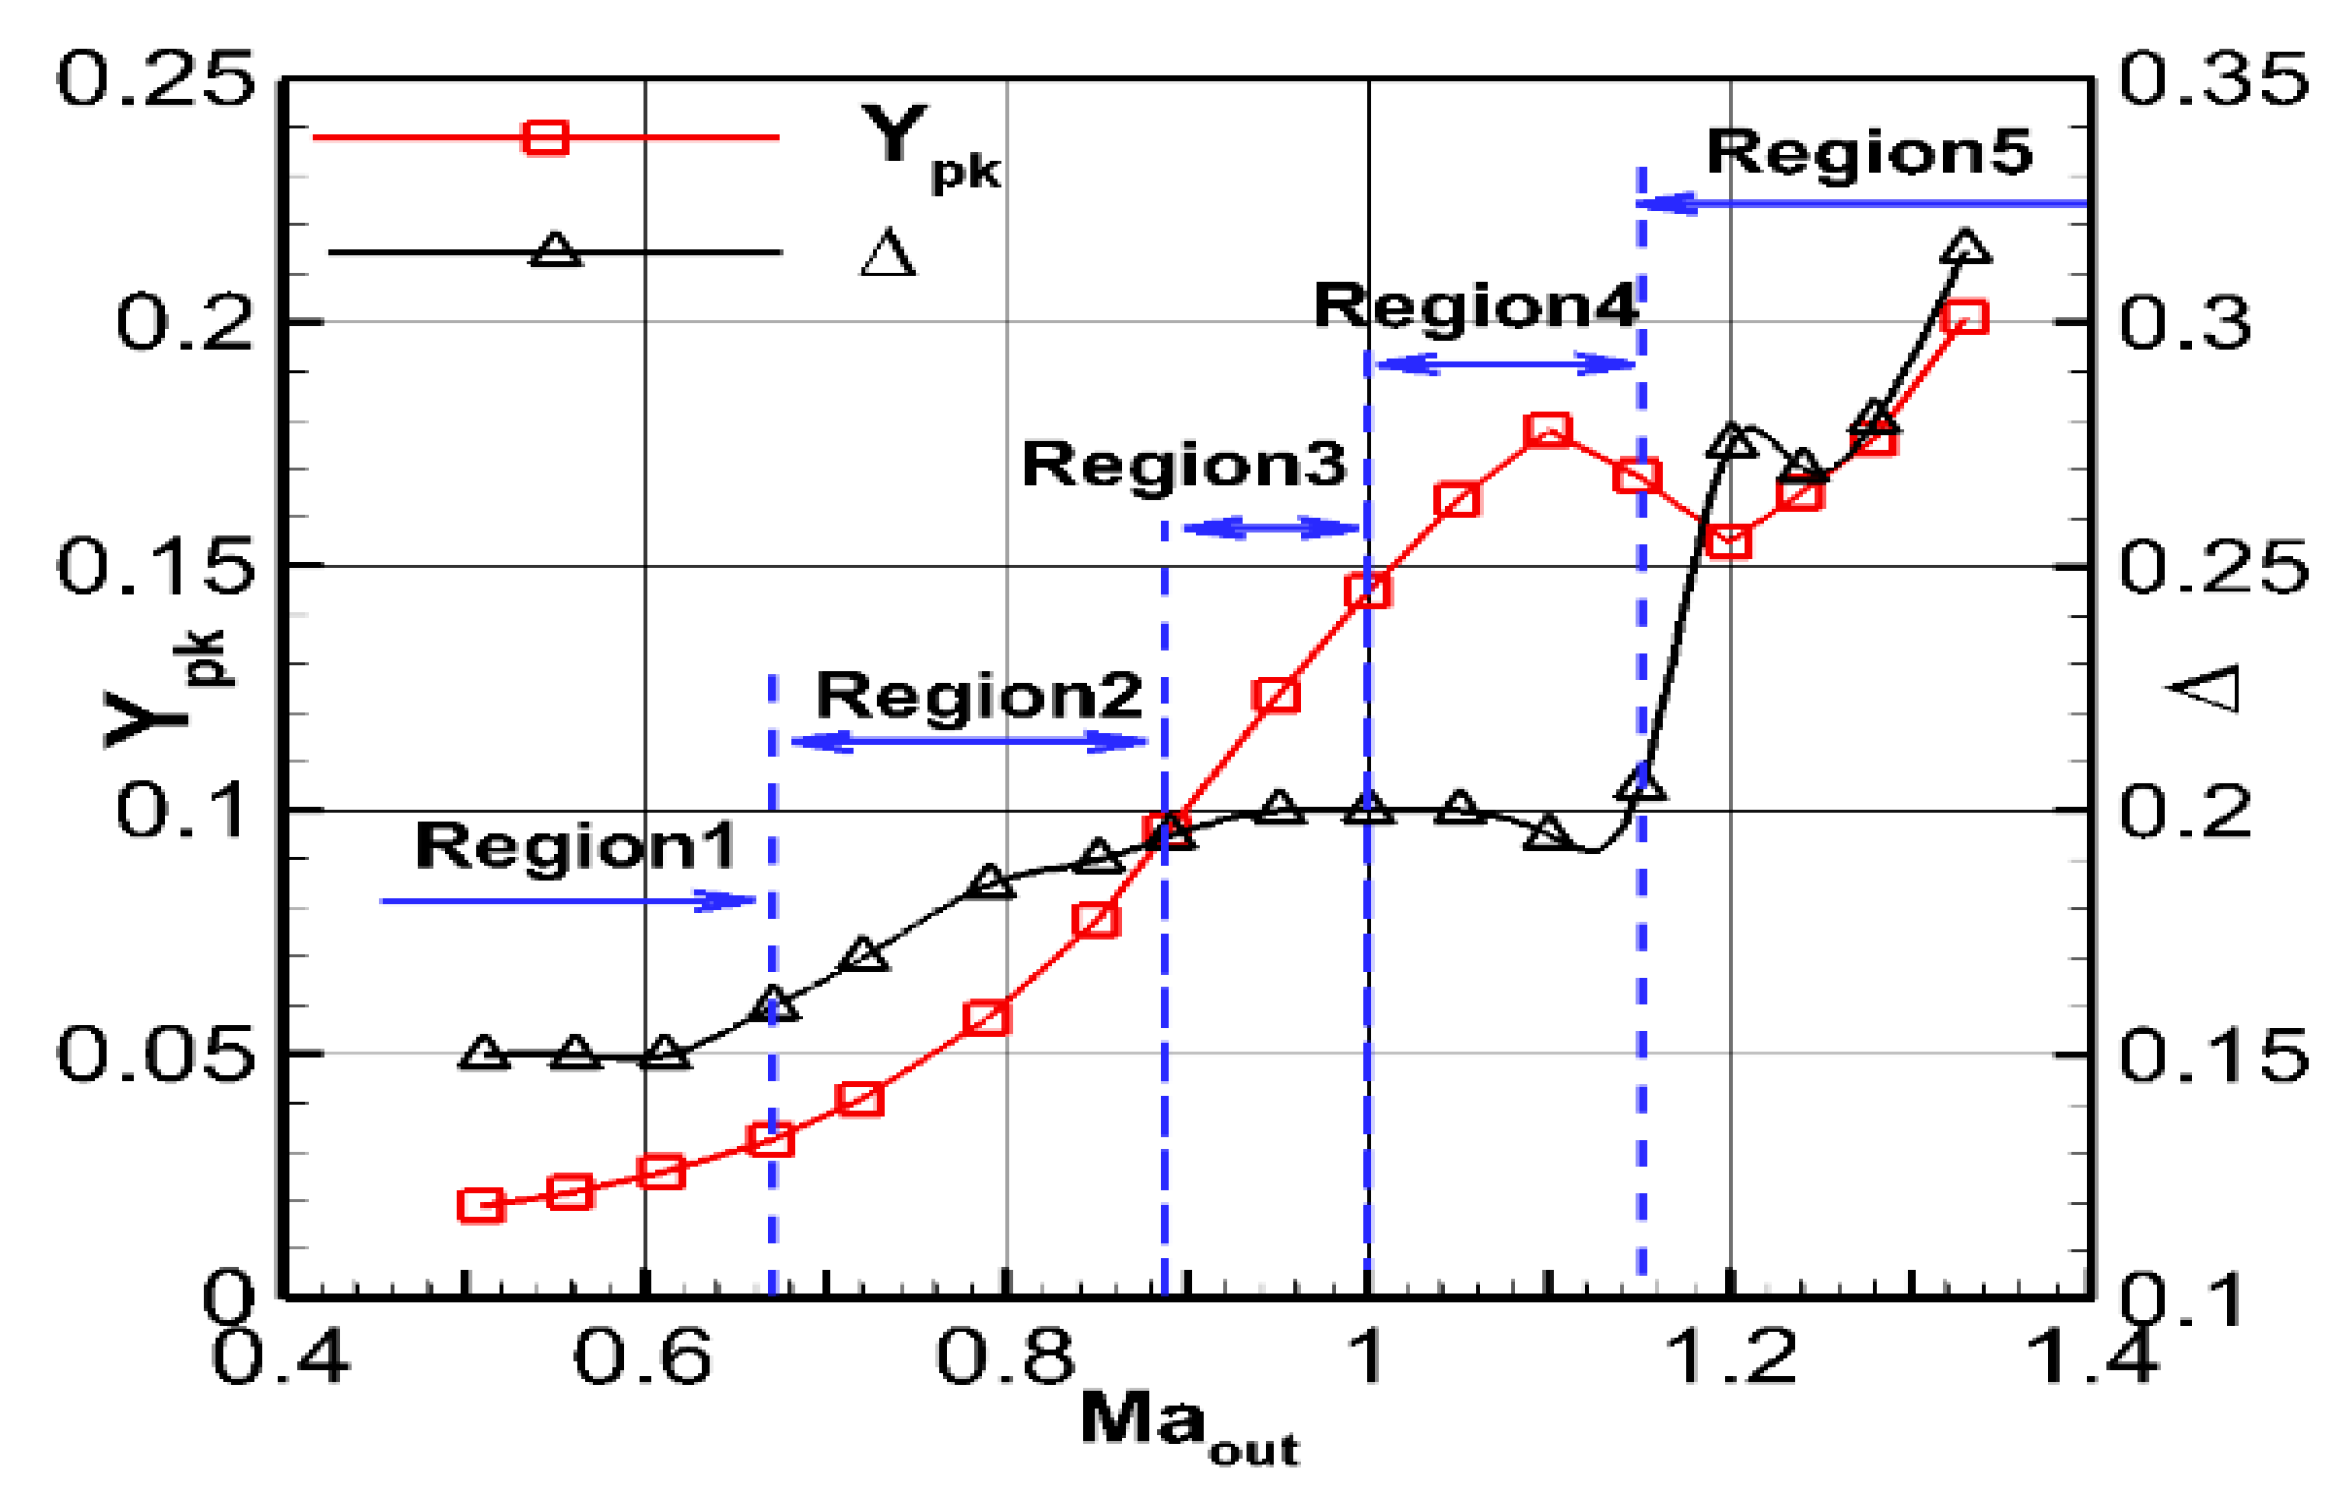
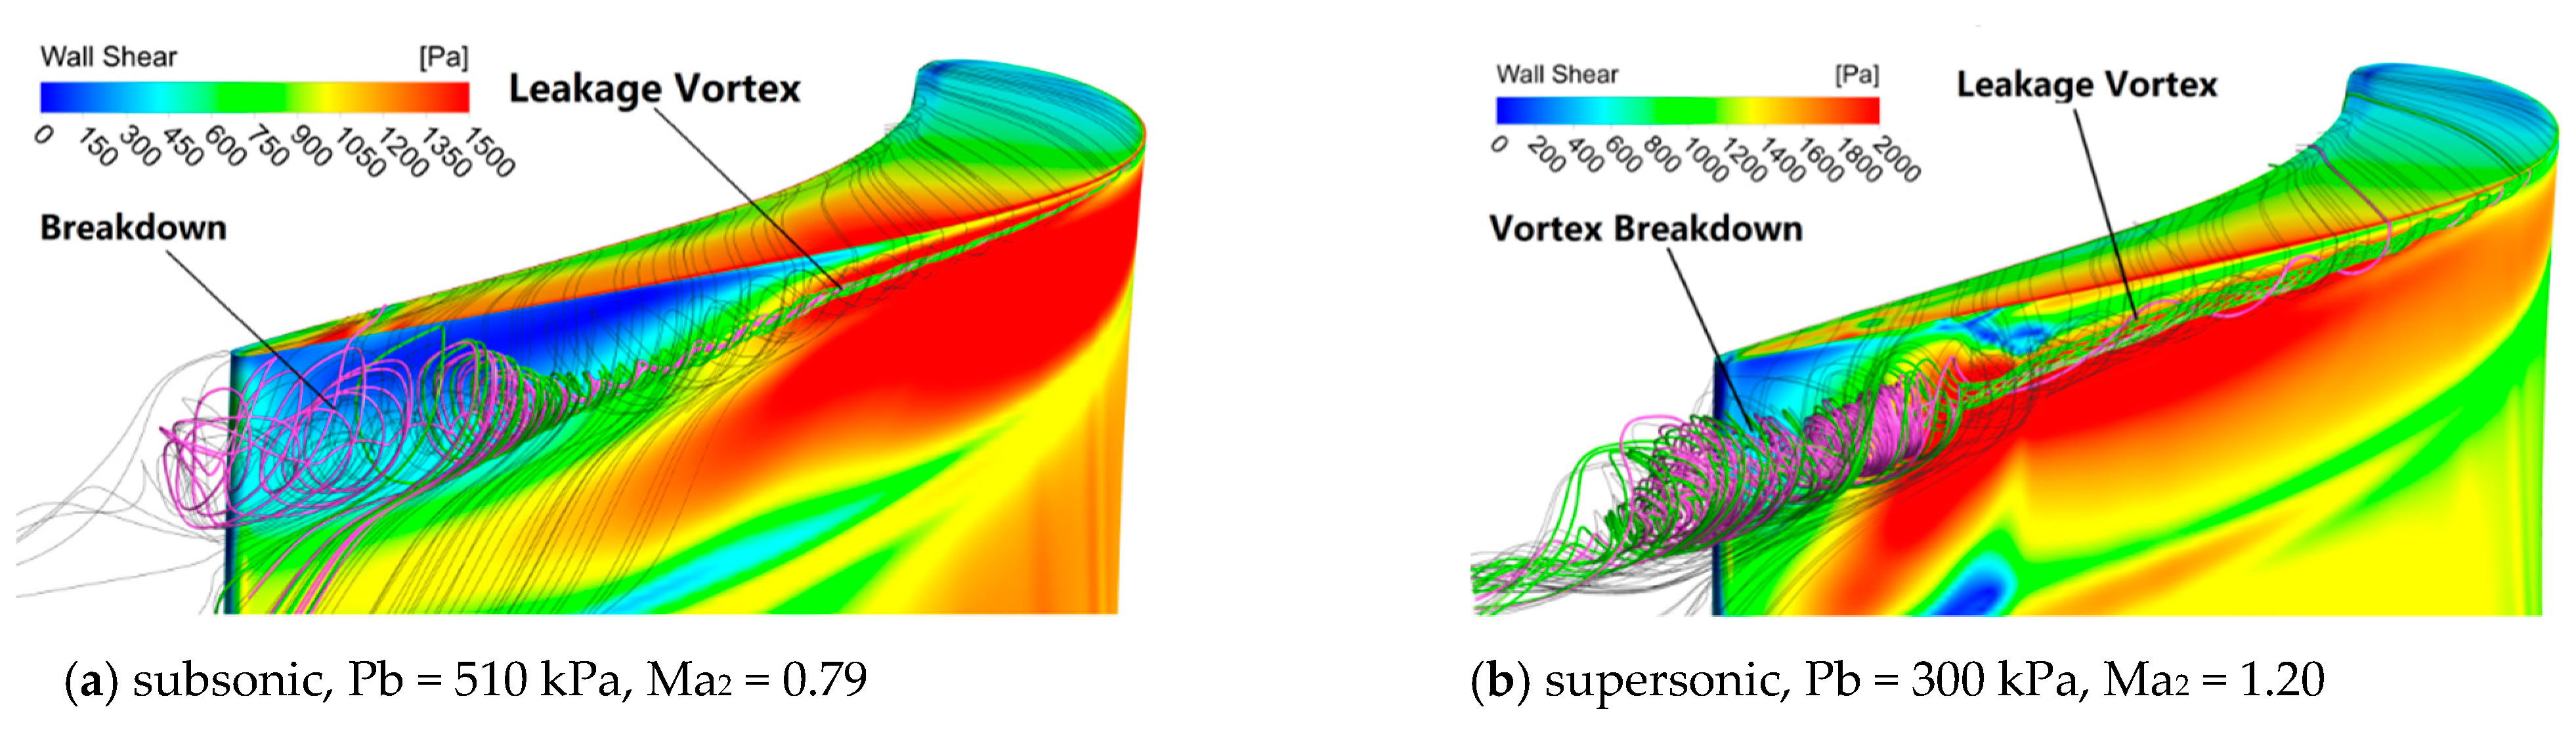
3.3.1. Leakage Vortex Breakdown

In this section, the results with back pressure of 510 kPa and 300 kPa are compared to investigate the instability of the tip-leakage vortex. The average outlet Mach Numbers of the two cases are 0.79 and 1.20, indicating that the flows are subsonic and supersonic, respectively.
Figure 12 shows the streamlines within the core of the tip-leakage vortices. It is observed that near the trailing edge of the blade, the streamline representing the tip-leakage vortex core expands and the vortex core region is taken by the chaotic flow. Figure 12a,b indicates that for a subsonic flow, the core region expands gradually as it flows downstream, while it expands almost suddenly in a sudden in the supersonic flow. Moreover, it is found that a bubble region and the reserved flow form in the vortex core.
Figure 13 shows the Mach number distribution on the streamlines near the tip-leakage vortex core. The distortion in Figure 13 is mainly because the selected streamline is not accurately at the vortex core. It is observed that for different back pressures, the flow in the tip-leakage vortex core accelerates to different levels and then decelerates to the stagnation position of the vortex core breakdown. Then, the flow velocity remains at a low level and strong oscillations occur.
Instability of the rotating jet flow [34] indicates that such flow with a stagnation point and a recirculation bubble can be considered as the vortex breakdown. Accordingly, it is concluded that the reversed flow is induced by the breakdown of the tip-leakage vortex and the vortex is unstable near the trailing edge.
In the case with a backpressure of 510 kPa, deceleration of the vortex core begins at x = 0.59 Cx for the subsonic case and the velocity drops to zero at 0.89 Cx. The latter point is the stagnation point, which is defined as the breakdown position of the leakage vortex. Accordingly, the deceleration distance is 0.3 Cx.
On the other hand, in the case with a backpressure of 300 kPa, the flow of the vortex core begins deceleration and its velocity drops to zero rapidly between 0.87 Cx and 0.95 Cx. In this case, the axial distance is 0.08 Cx, which is only 27% that of the subsonic case.
The flow velocity in Figure 11c indicates that for the backpressure of 510 kPa, a supersonic region forms on the suction surface.
It is found that in region 3 with the backpressure range from 450~400 kPa, a supersonic flow appears in the leakage vortex and the vortex breaks up under large pressure gradients similar to the normal shock wave.
This phenomenon can be used to explain the forward movement of the leakage vortex breakdown in region 3. It also shows that the leakage loss is related to the location of the leakage vortex breakdown.
Taking the stagnation position of the leakage vortex core, distribution of the stagnation position of the leakage vortex breakdown can be obtained along the outlet Mach number, as shown in Figure 14. Accordingly, five regions corresponding to the leakage vortex loss are detected, indicating that the leakage vortex loss is a function of the location of the leakage vortex breakdown. The breakdown position in different regions has different behaviors, moving forward or backward. Moreover, the variation amplitude of the axial position is up to 0.13 Cx. It is inferred that when the backpressure fluctuates unsteadily, the breakdown position may fluctuate greatly. It should be indicated that these fluctuations are quite probable because of the influence of the downstream blade in turbine stage. Since pressure fluctuations originate from the leakage vortex breakdown on the rotor blade tip area, these fluctuations may result in the blade vibration. For a real engine, the high-cycle fatigue originating from the blade vibration may lead to serious problems [35].

3.3.2. Vortex Structure

To study the vortex structure, a plane normal to the rotating axis of the vortex is considered on the suction surface at 0.85 Cx. Figure 15a shows the projection of the main velocity streamline and the location of the tip-leakage vortex on this plane for the outlet Mach number of 0.79. Moreover, Figure 15b illustrates the jet-like leakage flow from tip gap.
Considering the transverse pressure in the blade passage, the leakage flow rolls up and flows towards the blade midspan. The velocity contour indicates that the leakage vortex is composed of the high-shear flow. As the vortex develops downstream, the shear flow induced by the leakage flow is continuously rolled into the outer layer of the leakage vortex. Meanwhile, the upstream shear layer gradually rolls up into the inner side and forms the low-velocity vortex core. Therefore, the leakage vortex can be considered as a swirling vortex. The main structures of the tip-leakage vortex can be divided into two parts, including the vortex core with low-velocity fluid and the shear flow wrapped around the low-velocity core.
Based on the swirling vortex theory, the movement of the fluid in the vortex core region can be approximated as the rotation motion of a rigid body [36,37], which can be described by the Rankine vortex [38].
Figure 16 shows the relative vorticity contour on the 95% span. The relative vorticity is normalized by the physical angular velocity of the rotor, which is expressed as ω n = ω / 2 Ω . In the subsonic flow without shock wave as shown in Figure 16a, the vorticity in the vortex core gradually approaches to nearly zero. The supersonic flow in Figure 16b shows the boundary before and after the shock wave. It is observed that before the shock wave, the high vorticity value of the leakage vortex appears at the core of the leakage vortex and the surrounding region. However, a low vorticity region suddenly appears at the core of the leakage vortex after the shock wave and the high vorticity region forms at the edge of the leakage vortex. The velocity field in Figure 11g indicates that the leakage vortex breaks up rapidly after passing the shock wave. Therefore, it can be inferred that the shock wave interaction has a direct impact on the instability of the leakage vortex.

3.3.3. Shock Wave on the Breakdown of the Leakage Vortex

Figure 17 schematically shows the shock wave on the tip-leakage vortex. In this figure, α is the incident angle of the leakage vortex axis relative to the normal direction of the shock wave and β is the emergence angle of the flow behind the shock wave.
Based on the oblique shock correlation [39], the flow turns towards the shock surface after the shock so that the flow angle increases. Therefore, the axis direction of the tip-leakage vortex quickly moves away from the suction side of the blade so that it separates from the suction surface. However, the separated tip-leakage vortex re-attaches to the suction surface, thereby forming a low vorticity region A called “vorticity separation region”. This phenomenon is attributed to the transverse pressure gradient in the passage.
Considering the high adverse pressure gradient before and after the shock wave, the flow velocity in the tip-leakage vortex core decreases rapidly. Coupling with its rotating motion, the diameter of the vortex core rapidly expands and forms a low pressure and reversed flow region, which can be considered as the breakdown of the vortex core due to the centrifugal instability of swirling flow [40].
Based on the performed analysis, it is inferred that in supersonic flow, the leakage vortex breakdown mainly originates from the interaction between the shock wave and the leakage vortex. However, the internal cause is still the centrifugal instability of the vortex as that occurred in the subsonic flow.

4. Conclusions

In the present study, numerical simulations were carried out to study the effect of shock waves on the loss and breakdown characteristics of the tip-leakage vortex. By altering the backpressure of the turbine rotor, a series of results with different degrees of interaction were obtained. Based on the obtained result and performed analyses, the main conclusions of the present work are as follows:
(1) Shock wave has a serious influence on the tip-leakage vortex loss. The induced vortex breakdown by shock wave would enhance the mixing loss in the leakage vortex. As the outlet Mach number increases from 0.67 to 1.15, the loss in the leakage vortex grows exponentially, the loss increases by about 10 times and the corresponding proportion in the total loss increases sharply to 30.2%.
(2) The stagnation position of leakage vortex breakdown is nearly behind the shock wave interaction in supersonic flow. It may fluctuate as the back-pressure changes, moving forward and backward. The change distance in the axial direction is up to 0.13 Cx. Therefore, it infers that the breakdown of leakage vortex core may be influenced by the downstream blade passing and the induced pressure fluctuation may result in additional vibration to the rotor blade.
(3) The shock wave intensity has an obvious influence on the interaction of leakage vortex breakdown. With the interference of strong shock waves, the centrifugal breakdown of the leakage vortex core occurs rapidly and it influences both the expansion and instability of the vortex core and the shear layer flow on the surface of the leakage vortex.
(4) The tip-leakage vortex can be considered as a swirling vortex whose structure is forms by the vortex core with low-velocity and the high shear flow wrapped around the core. It is unstable and may turn into a flow with a breakdown bubble in core region. The interaction of shock wave is the main trigger cause of leakage vortex breakdown, but the internal cause of vortex core instability is the centrifugal instability of vortex.

Author Contributions

Conceptualization, Z.W.; methodology, Z.W. and W.C.; software, Z.W.; validation, Z.W. and W.C.; formal analysis, Z.W.; investigation, Z.W.; resources, Z.W.; data curation, Z.W.; writing—original draft preparation, Z.W.; writing—review and editing, Z.W., G.R., M.N. and X.G.; project administration, G.R. All authors have read and agreed to the published version of the manuscript.

Funding

This research was funded by the Basic and Applied Basic Research Foundation of Guangdong Province, China (Grant No. 2019A1515110450) and Science and Technology Innovation Committee Foundation of Shenzhen (Grant No. JCYJ20200109141403840).

Institutional Review Board Statement

Not applicable.

Informed Consent Statement

Not applicable.

Data Availability Statement

Data sharing is not applicable to this article.

Acknowledgments

The authors would like to thank Weiyang Qiao for the guidance and kind advice and the fellow apprentices in the research group for their help.

Conflicts of Interest

The authors declare no conflict of interest.

Nomenclature

CChord length
CxAxial chord length
Ylocal total-pressure loss
YpkPeak loss of the leakage vortex
YpBlade profile loss
Y t Tip-leakage vortex loss
Y a Total loss of the blade passage, Y a = Yd h
p ¯ t , in Averaged relative total pressure at the rotor inlet
p t Local relative total pressure
Ma2Exit Mach number
P b Back pressure of turbine
h 1 Lowest spanwise bound of leakage vortex
h 2 Lowest spanwise bound of leakage vortex
Δ Spanwise scale of the leakage vortex, Δ = h 2 h 1
Ω Physical angular velocity of the rotor
ω Vorticity
ω n Relative vorticity, ω n = ω / 2 Ω
α Incident angle of the leakage vortex axis relative to the normal direction of shock wave
β Emergence angle of the flow behind the shock wave
y+Non-dimensional distance
RANSReynolds-Averaged Navier-Stokes
SSTShear Stress Transport
HPTHigh-Pressure Turbine
3DThree-Dimensional
2DTwo-Dimensional
PSPressure Side
SSSuction Side
LELeading Edge
TETrailing Edge

References

  1. Sun, D.W. The Investigation of Secondary Flow Mechanism, Loss Model and Control Technique for High Pressure Turbine; Northwestern Polytechnical University: Xi’an, China, 2009. [Google Scholar]
  2. Denton, J.D. The 1993 IGTI Scholar Lecture: Loss Mechanisms in Turbomachines. J. Turbomach. 1993, 115, 621–656. [Google Scholar] [CrossRef]
  3. Booth, T.C. Importance of Tip Clearance Flows in Turbine Design. In Tip Clearance Effects in Axial Turbomachines; Von Karman Institute for Fluid Dynamics: Sint-Genesius-Rode, Belgium, 1985; pp. 1–34. [Google Scholar]
  4. Pullan, G.; Denton, J. Curtis, Éric Improving the Performance of a Turbine with Low Aspect Ratio Stators by Aft-Loading. J. Turbomach. 2004, 128, 492–499. [Google Scholar] [CrossRef]
  5. Zou, Z.; Wang, S.; Liu, H.; Zhang, W. Axial Turbine Aerodynamics for Aero-Engines: Flow Analysis and Aerodynamics Design, 1st ed.; Springer Nature: Singapore, 2018. [Google Scholar]
  6. Bindon, J.P. The Measurement and Formation of Tip Clearance Loss. J. Turbomach. 1989, 111, 257–263. [Google Scholar] [CrossRef]
  7. Li, W.; Qiao, W.Y.; Xu, K.F. Unsteadiness of tip clearance vortex in turbine. J. Propuls. Technol. 2008, 29, 204–207. [Google Scholar]
  8. Huang, A.C.; Greitzer, E.M.; Tan, C.S.; Clemens, E.F.; Gegg, S.G.; Turner, E.R. Blade Loading Effects on Axial Tur-bine Tip Leakage Vortex Dynamics and Loss. In Proceedings of ASME Turbo Expo 2012; ASME: Copenhagen, Denmark, 2012. [Google Scholar]
  9. Huang, A. Loss Mechanisms in Turbine Tip Clearance Flows; Massachusetts Institute of Technology: Boston, MA, USA, 2011. [Google Scholar]
  10. Gao, J.; Zheng, Q.; Xu, T.; Zhang, Z. Effect of Tip Leakage Vortex Breakdown on Losses in Axial Turbines. Chin. J. Aeronaut. 2014, 35, 1257–1264. [Google Scholar]
  11. Gao, J.; Zheng, Q.; Liu, Y.; Dong, P. Effects of blade rotation on axial turbine tip leakage vortex breakdown and loss. Proc. Inst. Mech. Eng. Part G J. Aerosp. Eng. 2017, 231, 1634–1649. [Google Scholar] [CrossRef]
  12. Hou, W.T.; Qiao, W.Y.; Luo, H.L. Shock-Wave/Boundary-Layer Interaction in a Transonic Turbine Cascade. Proc. Inst. Mech. Eng. Part G J. Aerosp. Eng. 2010, 225, 77–85. [Google Scholar] [CrossRef]
  13. Babinsky, H.; Harvey, J.K. Shock Wave-Boundary-Layer Interactions, 1st ed.; Cambridge University Press: New York, NY, USA, 2011. [Google Scholar]
  14. Giles, M.B. Stator/rotor interaction in a transonic turbine. J. Propuls. Power 1990, 6, 621–627. [Google Scholar] [CrossRef]
  15. Paniagua, G.; Yasa, T.; De La Loma, A.; Castillon, L.; Coton, T. Unsteady Strong Shock Interactions in a Transonic Turbine: Experimental and Numerical Analysis. J. Propuls. Power 2008, 24, 722–731. [Google Scholar] [CrossRef]
  16. Puterbaugh, S.L.; Brendel, M. Tip Clearance Flow-Shock Interaction in a Transonic Compressor Rotor. J. Propuls. Power 1997, 13, 24–30. [Google Scholar] [CrossRef]
  17. Yamada, K.; Furukawa, M.; Nakano, T.; Inoue, M.; Funazaki, K. Unsteady Three-Dimensional Flow Phenomena Due to Breakdown of Tip Leakage Vortex in a Transonic Axial Compressor Rotor; ASME International: New York, NY, USA, 2004; pp. 515–526. [Google Scholar]
  18. Zhang, Y. Investigation of Endwall Flow Behaviour and Its Control Strategies in Highly-Loaded Compressor; North-West Polytechnical University: Xi’an, China, 2010. [Google Scholar]
  19. Kaneko, M.; Tsujita, H. Numerical investigation of influence of tip leakage flow on secondary flow in transonic cen-trifugal compressor at design condition. J. Therm. Sci. 2015, 24, 117–122. [Google Scholar] [CrossRef]
  20. Timko, L.P. Energy Efficient Engine: High Pressure Turbine Component test Performance Report; General Electric Company, Aircraft Engine Group: Cincinnati, OH, USA, 1984. [Google Scholar]
  21. Balasubramanian, R.; Barrows, S.; Chen, J.P. Investigation of shear-stress transport turbulence model for tur-bomachinery applications. In Proceedings of the 46th AIAA Aerospace Sciences Meeting and Exhibit, Reno, NV, USA, 7–10 January 2008; Volume 566. [Google Scholar]
  22. Krishnababu, S.; Newton, P.J.; Dawes, W.N.; Lock, G.D.; Hodson, H.P.; Hannis, J.; Whitney, C. Aero-Thermal Inves-tigations of Tip Leakage Flow in Axial Flow Turbines-Part I: Effect of Tip Geometry and Tip Clearance Gap. In Proceedings of the GT2007, ASME Turbo Expo 2007: Power for Land, Sea and Air, Montreal, QC, Canada, 14–17 May 2007. [Google Scholar]
  23. Sell, M.; Treiber, M.; Casciaro, C.; Gyarmathy, G. Tip-clearance-affected flow fields in a turbine blade row. Proc. Inst. Mech. Eng. Part A J. Power Energy 1999, 213, 309–318. [Google Scholar] [CrossRef]
  24. Zhao, L.; Qiao, W.-Y.; Mu, Z.-Q.; Chen, P.-P. Tip Clearance Effects on Unsteady Behavior of the Tip Leakage Vortex and Stator/Rotor Interaction Tonal Noise. In Proceedings of the ASME Turbo Expo 2012: Turbine Technical Conference and Ex-position. Volume 8: Turbomachinery, Parts A, B, and C, Copenhagen, Denmark, 11–15 June 2012; pp. 1735–1744. [Google Scholar] [CrossRef]
  25. Behr, T. Control of Rotor Tip Leakage and Secondary Flow by Casing Air Injection in Unshrouded Axial Turbines; ETH Zürich: Zürich, Switzerland, 2007. [Google Scholar]
  26. Tang, H.; Liu, S.; Luo, H.; Hou, W. Unsteady Effects of Profiled Endwalls on a 1.5 Stage Axial Turbine. Volume 7B Struct. Dyn. 2015, 15. [Google Scholar] [CrossRef]
  27. Wei, Z.J. A Study on the Endwall Unsteady Flow and Loss of Highly-Loaded Turbine; Northwestern Polytechnical University: Xi’an, China, 2016. [Google Scholar]
  28. Dunker, R. Advances in Engine Technology, 1st ed.; John. Wiley& Sons Ltd.: Hoboken, NJ, USA, 1995. [Google Scholar]
  29. Hergt, A. Über Grenzschichtbeeinflussende Maßnahmen in den Randzonen von Verdichtergittern; Der Technischen Universität Berlin: Berlin, Germany, 2011. [Google Scholar]
  30. Wei, Z.; Qiao, W.; Duan, W.; Liu, J. Influence of scrapping effect on formation of casing passage vortex in turbine rotor. J. Aerosp. Power 2018, 33, 1695–1704. [Google Scholar]
  31. Furukawa, M.; Inoue, M.; Saiki, K.; Yamada, K. The Role of Tip Leakage Vortex Breakdown in Compressor Rotor Aerodynamics. J. Turbomach. 1999, 121, 469–480. [Google Scholar] [CrossRef]
  32. Schlechtriem, S.; Lötzerich, M. Breakdown of Tip Leakage Vortices in Compressors at Flow Conditions Close to Stall. In Proceedings of the ASME 1997 International Gas Turbine and Aeroengine Congress and Exhibition. Volume 1: Aircraft Engine; Marine; Turbomachinery; Microturbines and Small Turbomachinery, Orlando, FL, USA, 2–5 June 1997. [Google Scholar] [CrossRef] [Green Version]
  33. Hiejima, T. Criterion for vortex breakdown on shock wave and streamwise vortex interactions. Phys. Rev. E 2014, 89, 053017. [Google Scholar] [CrossRef] [PubMed]
  34. Qadri, U.A.; Mistry, D.; Juniper, M.P. Structural sensitivity of spiral vortex breakdown. J. Fluid Mech. 2013, 720, 558–581. [Google Scholar] [CrossRef] [Green Version]
  35. Cowles, B.A. High cycle fatigue in aircraft gas turbines—An industry perspective. Int. J. Fract. 1996, 80, 147–163. [Google Scholar] [CrossRef]
  36. Alekseenko, S.V.; Kuibin, P.A.; Okulov, V.L. Theory of Concentrated Vortices: An Introduction; Springer-Verlag: Heidelberg, Germany, 2007. [Google Scholar]
  37. Wu, J.-Z.; Ma, H.-Y.; Zhou, M.-D. Vorticity and Vortex Dynamics; Springer Science and Business Media LLC: Heidelberg, Germany, 2006. [Google Scholar]
  38. Rankine, W.J.M. Manual of Applied Mechanics; C. Griffen Co.: London, UK, 1858. [Google Scholar]
  39. Anderson, J.D. Fundamentals of Aerodynamics-6ed, 6th ed.; Mc Graw Hill Education: New York, NY, USA, 2017. [Google Scholar]
  40. Greitzer, E.M.; Tan, C.S.; Graf, M.B. Internal Flow: Concepts and Applications, 1st ed.; Cambridge University Press: New York, NY, USA, 2004. [Google Scholar]
Figure 1. Computational domain of the first-stage rotor of GE-E3 HPT.
Applsci 11 04991 g001
Figure 2. Casing mesh in the trailing region of rotor.
Applsci 11 04991 g002
Figure 3. Grid independence.
Applsci 11 04991 g003
Figure 4. Span-wise distribution of pressure coefficient at the turbine outlet.
Applsci 11 04991 g004
Figure 5. Circumferential distribution of the static pressure at the casing within the tip clearance.
Applsci 11 04991 g005
Figure 6. Contour of Mach number in the blade passage.
Applsci 11 04991 g006
Figure 7. Static pressure distribution on the blade surface.
Applsci 11 04991 g007
Figure 8. Span-wise distribution of the total pressure loss coefficient (Pb = 350 kPa, Ma2 = 1.10).
Applsci 11 04991 g008
Figure 9. Tip-leakage vortex loss along the outlet Mach number.
Applsci 11 04991 g009
Figure 10. Span-wise scale and loss peak of the leakage vortex along the outlet Mach number.
Applsci 11 04991 g010
Figure 11. Contour of relative Mach number on 95% span for various backpressure.
Applsci 11 04991 g011
Figure 12. Streamline line in leakage vortex core and contour of wall shear stress on blade.
Applsci 11 04991 g012
Figure 13. Velocity distributions on the streamline near the core of the tip-leakage vortex.
Applsci 11 04991 g013
Figure 14. Distribution of the stagnation position of leakage vortex breakdown along the outlet Mach number.
Applsci 11 04991 g014
Figure 15. Velocity distributions for plane normal to flow direction (Ma2 = 0.79, x Cx = 0.85).
Applsci 11 04991 g015
Figure 16. Relative Vorticity Distribution near the tip leakage vortex core (95% span).
Applsci 11 04991 g016
Figure 17. Schematic diagram of the interference between the shock wave and the tip-leakage vortex.
Applsci 11 04991 g017
Table 1. Boundary condition setting.
Parameter Value
Absolute Total Pressure/kPa 1210.13
Absolute Total Temperature/K 1588
Incoming Flow Angle/degHub73.1
Mean74.2
Shroud75.4
Incoming Turbulence Intensity/% 10
Rotating Speed/RPM 12,630
Publisher’s Note: MDPI stays neutral with regard to jurisdictional claims in published maps and institutional affiliations.

