
Effect of Sucrose on Physicochemical Properties of High-Protein Meringues Obtained from Whey Protein Isolate


1
Department of Milk Technology and Hydrocolloids, University of Life Sciences in Lublin, Skromna 8, 20-704 Lublin, Poland
2
Department of Physical Chemistry-Interfacial Phenomena, Maria Curie Skłodowska University, M. Curie Skłodowska Sq. 3, 20-031 Lublin, Poland
3
Institute of Plant Genetics, Breeding and Biotechnology, University of Life Sciences in Lublin, Akademicka 15, 20-950 Lublin, Poland
*
Authors to whom correspondence should be addressed.
Appl. Sci. 2021, 11(11), 4764; https://doi.org/10.3390/app11114764
Submission received: 8 April 2021
/
Revised: 19 May 2021
/
Accepted: 20 May 2021
/
Published: 22 May 2021
(This article belongs to the Special Issue New Perspectives in Chemical and Functional Properties of Natural Products)
Abstract
:This study reports the possibility of obtaining the WPI-based meringues with the small sucrose content (0–15%). The whey protein isolate (WPI) solution (20%, w/v) was whipped and sucrose was added to foam at the concentrations of 5, 10 and 15%. The surface tension, viscosity, zeta potential of the pre-foam solutions, foam overrun, foam stability and their rheological properties (G′, G″ and tan (δ)) were evaluated. To produce meringues, liquid foams were solidified at 130 °C for 2 h. The surface properties (roughness, contact angles, apparent free surface energy) as well as microstructural ones were determined for the solid foams (meringues). The 15% sugar concentration was detrimental for overrun, stability and rheological properties of liquid foams. The meringue production without sugar was infeasible. The addition of the smallest amount of sucrose (5%) enabled preservation of the aerated structure of the liquid foam during solidification. The 10% sugar concentration increased the stability of liquid foam, its rheology and it was the most effective for air bubbles stabilization during the foam solidification, however, its largest addition (15%) resulted in an increase in the final meringue volume. Larger sucrose concentrations produced a smoothing effect on the meringue surfaces.

1. Introduction
Aerated products gain a commercial interest owing to new sensory impressions delivered by foamed foods [1]. The aeration benefits are primarily related to texture, rheology and mouthfeel. The solid products such as cereal, snacks and meringues can become light and crisp [2]. The traditional meringue making is based on the air incorporated into the beaten egg whites [3] and sucrose as a stabilizer [4]. The angel food cake, made with egg whites, sugar and flour is also a very popular foamed confectionary product [5]. However, the concentration of sucrose in the angel food cake is very high (~40%, w/w). For the production of traditional meringues, the protein to sugar ratio of 1:2 or even 1:3 is used [6], therefore the current food trends should meet the actual strategy to reduce the sugar content in food and to provide functional and ready-to-eat high-protein products, which are still very few on the market [7,8].
Utilization of egg albumen in the food industry—the most common foaming agent—can cause microbial and technological problems [9] as this is a mixture of individual proteins, which differ in molecular weights, isoelectric points and charges [10]. The foams produced from the egg albumen demonstrate an overbeating effect [11], which is not an issue for the whey protein preparations [12]. Additionally, Peram et al. [13] reported smaller allergenicity of β-lactoglobulin during the thermal treatment while ovomucoid—one of the egg albumen components—does not reduce its allergenicity upon heating [14]. Moreover, pasteurization of egg albumen to avoid Salmonella and different safety precautions can affect these proteins negatively (e.g., denaturation). It can also cause their gelation. Those changes can produce bad foamability in the food industry, especially in the confectionaries [15].
Whey proteins with their functional properties and the unique biological value, which exceeds that of egg albumen by about 15%, are desired additives in the production of fortified foods for active people with the increased protein uptake and lower caloric value [16,17,18]. Whey proteins represent superior functional properties, such as gelation, emulsifying as well as water-binding capacity and finally, foaming. These properties make whey proteins interesting for application in the food and confectionery industry [1]. Moreover, food processors would like to have a wide range of ingredients to choose from, thus the substitution of egg albumen with whey proteins is fully justified for nutritional and environmental reasons as the increased worldwide production of cheese provides more whey as a substrate for whey protein preparations [12,19]. The whey protein isolate can be successfully applied in the production of meringues and angel food cake products, which are traditionally made from egg albumen [8,20,21].
Nastaj et al. [22] applied destructive and non-destructive techniques, such as texture profile and color analysis, to compare the properties of the WPI meringues (the compositions similar to those to be obtained and analyzed here) with the commercial ones produced from egg albumen. However, to our knowledge there are few studies focusing on the techniques including the surface properties of meringues (e.g., contact angles, roughness). The studies on the surface properties of meringues are important to control smoothness, improve the appearance and limit the defects (cracks) of the meringues, i.e., features that are important in terms of a consumer’s evaluation and product selection. Moreover, Inoue et al. [23] reported that surface roughness has an important impact on the palatability of food products. Recently, Nastaj et al. [8] stated that smoother (more hydrophilic) character of WPI-based meringues with the erythritol addition could determine their consumption time due to faster salivation in the mouth. Magens et al. [24] explained that the surface roughness is also a crucial parameter for detachment of confectionery products from the baking surfaces. Therefore, in this study, the aforementioned methods will be highlighted and it is expected that they will provide comprehensive information for potential applications of whey proteins in the confectionary industry.
As follows from the literature reports, there are no similar studies on meringues. The aim of this research is to find out whether the high-protein WPI-based meringues with a low sugar content (0–15%) can be obtained. In this study, the investigations of physicochemical properties of prepared foams, their original solutions and foams after the thermal solidification is also the objective to be examined.
2. Materials and Methods
2.1. Materials
The whey protein isolate WPI (91.4% protein) was produced by Spomlek Dairy Cooperative (Radzyń Podlaski, Poland). WPI was obtained from pasteurized milk (78 ± 2 °C), whey proteins were obtained by ultrafiltration and microfiltration processes of liquid whey, which was not subjected to any thermal treatment. The protein content was determined by the Kjeldahl method calculating the protein as N × 6.38. Sucrose produced by Krasnystaw Sugar Refinery (Krasnystaw, Poland) was purchased in a local store.
2.2. Production of Meringues
The 20% WPI solutions (calculated based on the pure protein content in the preparation, m/v) were prepared by hydration using a magnetic stirrer for 1 h. They were refrigerated overnight at 7 °C for equilibrating. Prior to the foam formation, the solutions were brought to 20 °C and stirred again for 1 h. Subsequently, 200 mL of the WPI solution was whipped at 20 °C using a KitchenAid mixer (KitchenAid, St. Joseph, MI, USA) at the speed 6 (180 RPM) for 5 min. Then, sucrose was blended in at the following concentrations: 5, 10 and 15% (w/v) and whipping was continued for 3 min at the speed 8 (225 RPM). The resulting foam was scooped up to the confectionery sleeve and deposited into the round silicone baking pans (50 × 20 mm2) and solidified using a BIR24800BGMS BEKO multifunctional convection oven (Arçelik A.Ş., Istanbul, Turkey) at 130 °C for 2 h. This resulted in the total of 3 meringue batches for further investigations. Prior to the analyses, the samples were stored in the desiccator.
2.3. Viscosity, Surface Tension and Zeta Potential of Pre-Foam Solutions
In the experiments, the same amounts of WPI and sugar were used, however, they were dissolved together under the same conditions like the protein solutions for direct foam preparation. Viscosity of pre-foam solutions was determined employing the Kinexus Lab+ rheometer (Malvern Panalytical Ltd., Malvern, UK) using cup and bob geometry. Viscosity was measured over a range of shear rates (0.1–250 s−1).
The surface tension (γ) measurements for pre-foam solutions were made using a Krüss K9 tensiometer (Hamburg, Germany) with the ring method. The apparatus was calibrated using water with a surface tension of 72.4 mNm−1. All data were recorded by the K9 Krüss software.
The zeta potential of pre-foam solutions was calculated using the Zetasizer Nano ZS90 (Malvern Panalytical Ltd., Malvern, United Kingdom). The measurements were determined by using the refractive index of WPI as 1.53 and that of the dispersant medium as 1.33.
All the above measurements were made at 20 °C and in triplicate.
2.4. Foam Overrun
The foam overrun (OR) and air phase fraction (Φ) were determined by the method proposed by Campbell and Mougeot [2]. Both parameters were calculated based on the density difference between the foam and the pre-foam solution. Immediately after whipping foam was transferred using a spatula to avoid air pockets to a tared container (50 mL). The excess foam was removed with a metal spatula for the consistent foam volume. The same procedure was applied with the pre-foam solution. Each measurement was made in triplicate. Both parameters were calculated from the equations:
Foam overrun (OR) = [(Masssolution) − (Massfoam)/(Massfoam)] × 100%
Air phase fraction (Φ) = overrun/(overrun + 100)
2.5. Oscillatory Rheology of the Liquid Foams
Rheological measurements were made with a Kinexus Lab+ rheometer (Malvern Panalytical Ltd., Malvern, United Kingdom) using plate-plate geometry. Two serrated plates (30 mm) were applied to limit the foam slippage and the gap between them was 2 mm. The frequency sweep test was carried out in the range of 0.1–10.0 Hz at 0.01% strain and changes in the storage (G′) and loss (G″) moduli were recorded. The tan (δ) was determined at the frequency of 1 Hz according to the method described by Razi et al. [25]. Every rheological measurement was made in triplicate immediately after each foam sample was formed.
2.6. Foam Stability Measured by Turbiscan
Prior to the thermal treatment, the stability of liquid foams was determined in a Turbiscan LabExpert with the TLab Cooler cooling module (Formulaction, Smart Scientific Analysis, Toulouse, France) for 1 h at 20 °C. The foam sample in a glass vial was placed in a thermostated chamber. An electroluminescence diode emitted the collimated light beam (λ = 880 nm) passing through the sample. The transmission detector recorded the light passing through the sample at the angle of 0° towards the incident light direction. Increased transmission was an effect of foam coalescence and disproportionation. Another diode acted as a backscattering detector recording the light scattered at the angle of 135°. Decreased backscattering indicated the foam drainage mechanism. The obtained curves demonstrate the transmission and backscattering as a function of time. In addition, the Turbiscan stability index (TSI) values were computed using Turbiscan Easy Soft (Formulaction, Smart Scientific Analysis, Toulouse, France, www.formulaction.com/en/turbiscan-stability-index, accessed on 20 May 2021) based on the equation:
where: xi—the mean backscattering every 1 min. of the measurement, xBS—the mean xi, n—the number of scans.
2.7. Surface Properties of the Obtained Meringues (Roughness, Contact Angles, Apparent Free Surface Energy and Microstructure)
For the obtained meringues, the surface was observed by means of an optical profilometer GT Contour Surface Metrology and Vision64 software (Veeco, Tucson, AZ, USA), while the contact angles and apparent free surface energy were determined using a contact angle meter GBX (Romans sur Isere, France) and the microstructure was observed with a polarizing optical microscope Eclipse E600Pol (Nikon, Tokyo, Japan). All analyses were performed according to the methods described earlier by Nastaj et al. [17].
2.8. Statistical Analysis
Statistical analysis performed in the STATISTICA 12.0 PL application (StatSoft Polska Sp. z o. o., Kraków, Poland). A one-way ANOVA was carried out and significant differences between the samples were determined by the Tukey’s post-hoc test at p < 0.05.
3. Results and Discussion
3.1. Properties of Pre-Foam Solutions
The properties of pre-foam solutions (surface tension and viscosity) relate to their foamability and rheology of the resulting foams [1,26]. Figure 1 illustrates the effect of sucrose on the viscosity curves of WPI solutions. For all the analyzed solutions, the viscosity decreased with the increasing shear rate (0.1–250 s−1) and increased as the concentration of sugar was higher. For instance, at the shear rate of 100 s−1, the highest viscosity was observed for the WPI/15% sucrose solution and the WPI/0% sucrose sample proved to be the least viscous. Yang and Foegeding [20] also observed that viscosity of the WPI solutions increased gradually with the increasing sucrose concentrations.
Table 1 shows the surface tension (γ) of the pre-foam solutions. The smallest γ was recorded for the WPI/0% sucrose sample. Higher concentrations of sucrose (up to 10%) resulted in a surface tension increase. It can be concluded that there is a certain concentration of sucrose between (10–15%), for which the surface tension achieves the maximum value and its further increase does not change this property. Davis and Foegeding [27] found that larger additions of sucrose resulted in an increase in the surface tension of WPI solutions as they reduce the surface activity of globular proteins due to their lower hydrophobicity. Belyakova et al. [28] reported that the sucrose addition can diminish the interactions between proteins as sucrose is recognized to facilitate less favorable conditions for protein unfolding. Raikos et al. [11] pointed out to the relation of pre-foam solution viscosity with its surface tension. Sugars increase the viscosity and thus the surface tension in the presence of sugars is greater. Therefore, protein molecules tend to remain in a continuous phase, and they do not adsorb at the air–water interface, which can affect the protein foamability. This can be confirmed by the values of the zeta potential (ζ) recorded for the WPI solutions presented in Figure 2.
The ζ is one of the most useful parameters to study electric interactions of dispersed particles. This can markedly affect the food properties, such as stability, surface hydrophobicity and rheology [29]. It can be observed that the zeta potential of WPI solutions increased with the addition of sucrose, which indicates that sucrose reduced the charge of molecules and electrostatic repulsion among whey proteins. Bhattacharjee [30] classified the solutions with the zeta potential values of ±0–10 mV as greatly unstable. However, it can be stated that higher sugar concentrations resulted in the decrease in stability of nanoparticles of the analyzed solutions. These results indicate that the sucrose was soluble in the protein solutions over the entire range of the tested concentrations.
3.2. Overrun, Air Phase Fraction and Rheology of Liquid Foams
The foamability of analyzed WPI solutions is expressed as foam overrun (OR). Table 2 shows the overrun and corresponding air phase fraction (Φ) values for liquid foams.
The OR and Φ values increased with the increasing sugar concentration up to 10%. The highest OR was observed for the WPI/10% sucrose solution. For the sample containing 15% of sugar, significant decrements in the OR and Φ were recorded. A similar effect of sucrose on protein foamability was observed by Raikos et al. [11] and Yang and Foegeding [31]. According to Davis and Foegeding [27], the rheological properties of WPI foams depend on the Φ values. The values of Φ ≥ 0.88 indicate that their bubbles have a polyhedral shape and the increase in air fraction volume leads to an improvement in the rheological properties and stability of the foams.
Since foams are unstable systems, small strain rheology was used to determine their rheological properties. The G′ (storage modulus), G″ (loss modulus) and tan (δ) values of the obtained foams are shown in Figure 3. Tan (δ) demonstrates the relative input of elastic and viscous properties of the sample (tan δ = G″/G′). When tan (δ) is less than 1, the structure is elastic and G′ value is greater than G″. The findings show that G′ dominated over the G″ in all frequency ranges indicating a solid-like behavior of the analyzed foams. For the samples, G′ is about 4 times greater than G′′, which is characteristic of weak physical gels. For stronger gels, tan (δ) is closer to 0.1 [32].
The G′ and G″ results show that frequency demonstrates a significant impact on the structure of the foams. Initially, the G′ values decreased, which indicates the changes in the foam structure, most probably by breaking unstable laminar layers in the bubbles. Next, an increase in elasticity is observed most likely due to merging of bubbles, which simultaneously proves greater stability and higher G′ value. An increase in elasticity with the increasing frequency follows directly from the Deborah number. The materials with the low Deborah number are elastic substances, also characterized by the high value of the G′ relating to G″ [33].
Increasing the sugar content up to 10% increased the rheological properties of foams while the WPI/10% sample was the strongest foam, which was reflected in the G′ and G′′ values. The lowest G′ and G′′ values were observed for the WPI/15% sample, which confirms the decrease in its rheological properties. The lowest value of tan (δ) was recorded for the WPI/10% sample. However, the small differences between the WPI/10% and WPI/5% indicate that the foam exhibits the most elastic characteristic vs. the highest tan (δ) for the WPI/15% sample with the most viscous behavior. Such behavior can be linked with the foam overrun—the higher foam overrun as a consequence of larger bubbles and the formation of flexible interfacial protein films affecting the rheological properties of the foams. The increase in the G′ and G″ values along with the increase in the foam overrun reflects the tighter packing of air bubbles [34]. Larger air bubble formation in the foam resulted in a more elastic behavior, lower tan (δ), and higher solid properties, which can be observed in the presence of sucrose up to 10% concentration. On the contrary, the highest sucrose concentration caused the decrease in OR and Φ resulting in the viscous behavior of the manufactured foams. An observed increase in the foam elasticity and its solid behavior with the increase in air incorporation is consistent with the previous studies on the rheological properties of foamed foods [20,35,36].
3.3. Foam Stability
Figure 4a–d presents the evolution of transmission and backscattering spectra and the Turbiscan stability index (TSI) values of liquid foams. There can be recognized the following phenomena: the foam drainage process identified by a peak in the backscattering profile and the foam collapse recognized as a peak in the transmission profile. The increase in transmission indicates that the samples became transparent confirming the occurrence of destabilization processes. Drainage and coalescence cause an increase in the liquid phase related to the foam, therefore, there is an increase in transmission and a decrease in backscattering. Disproportionation associated with a smaller number of larger bubbles causes an increase in transmission [37]. The most stable was the WPI/10% sucrose foam (Figure 4c), which is reflected in the scan distribution. It is also noticeable that the foam collapse decreased remarkably for this sample. On the other hand, the samples WPI/0% (Figure 4a) and WPI/15% (Figure 4d) demonstrated a completely different dynamics of scans, confirming the smallest stabilities of the obtained foams. One of the mechanisms of decreased stability is disproportionation, i.e., an increase in the air bubble diameter. According to Martínez-Padilla et al. [37], the increase in the air bubbles diameter in time might result from the air diffusion through the protein film caused by the pressure gradient between the air bubbles (Oswald ripening). The scan distribution for the WPI/10% sucrose sample proves that this phenomenon can be reduced by the sugar addition. Yang and Foegeding [20] analyzed the effect of sugar addition on the microstructure of WPI foams. Their observations confirmed that sucrose improved stability of foams due to the retarded drainage rate. Rodríguez Patino et al. [38] reported that the smaller surface tension values of the protein solutions promoted the formation of smaller bubbles in the foam, which corresponded to their improved stability. Moreover, the viscosity of the pre-foam solutions is related to the increased stability of foams, which was also observed by Yankov and Panchev [39].
TSI varies from 0 to 100 and this is a parameter to monitor the destabilization kinetics of the foams. It is also noticeable that according to the TSI scale, the TSI values above 10 are reserved for the largely unstable and visible systems like foams. The closer to 100, the more unstable the foam is. The WPI/0% sucrose sample was the least stable during the analysis. The increase in sucrose up to 10% results in the TSI decrease. The foam obtained from WPI/10% sucrose was the most stable, which was proved by having the smallest TSI value. The Turbiscan measurements confirmed the observations made earlier when the rheological properties of the foams and as well as their relation to overrun and air phase fraction were determined.
3.4. Surface Properties of Meringues
It should be emphasized that the production of meringues without sugar was infeasible. It is interesting to note that there were no quality defects, such as cracks, which is characteristic of confectionery products. The smallest sugar addition (5%) enabled preservation of the foamed structure during solidification.
Figure 5a–c illustrates the profilometer images, side profiles and the roughness parameters of the meringues. They indicate that the larger sugar addition resulted in a surface smoothing effect and meringues demonstrated smaller surface roughness, which can be seen in the profilometer images.
The WPI/15% sucrose sample was the smoothest (Figure 5c). The similar smoothing effect was also observed by Nastaj et al. [8], who analyzed high-protein meringues from WPI and erythritol. Arunepanlop et al. [40] reported that meringues demonstrated various structures with the different sucrose addition. Structures can become finer with the increasing sugar concentration. Mensink et al. [41] described a vitrification phenomenon, i.e., an amorphous glassy matrix was formed by sugars around the proteins on the surface, affecting both the roughness and the foamed structure. Berry et al. [5] emphasized the importance of continuous bubble growth in the foam that can produce a coarse structured cake after solidification. The observed reduction in roughness can be related to the increased viscosity of the pre-foam solutions because more viscous dispersions can retard the migration of bubbles towards the surface of the meringue during baking.
The contact angle values define the hydrophobic or hydrophilic character of the surface—the smaller the contact angle, the more hydrophobic the surface. Apparent surface free energy (γs) value is the result of topography and surface chemistry [42].
The values of advancing (θa) and receding (θr) contact angles of the probe water and diiodomethane and the γs values calculated from the CAH (Contact Angle Hysteresis) approach of the meringues are presented in Table 3. For all samples, the values of contact angles decreased as the sucrose addition was larger and the meringue surface became more hydrophilic. For both liquids the largest θa and θr values were measured for the WPI/5% sucrose, and the lowest for the WPI/15% sucrose sample. A significant decrease in the contact angle values proves that higher sugar concentrations modify the properties of the tested surfaces. Sucrose is a hydrophilic component and it reduces the contact angle; the probe water and diiodomethane drops are spread on the surface of the meringue more readily.
CAH W (water) represents all interactions including the electrostatic and ionic ones. CAH DM (diiodomethane) represents the dispersive component associated with the charge and these are weak interactions. The γs values increased with the increasing sugar concentrations being consistent with the increase in hydrophilic character of the surface, which suggests that the samples were more heterogeneous in terms of topography, polar and dispersive interactions. Dispersive interactions have a great impact on the total value of surface free energy, as can be seen from the surface energy calculated from diiodomethane, which interacts only with the surface in a dispersive way [43]. Higher sugar concentrations produce a number of polar groups on the surface of meringues, which justifies the increase in the γs values. An increase in the contact angle values is a resultant of roughness and surface properties. Larger additions of sucrose resulted in less rough (smoother) and more hydrophilic (wettable) products.
3.5. Microstructure of Meringues
Figure 6 shows the optical images of surfaces (a–c) and cross-sections (d–f) of the samples. Sections (a–c) confirm the previous observations from the profilometer that the surface roughness of the meringues decreases with the increasing sugar concentration. It can be also seen that the increased sugar concentration up to 10% results in an increased bubble size. The sample with 15% sugar addition is characterized by a smaller number of larger bubbles that were most likely disrupted during the solidification. This indicates that the 10% sugar concentration is optimal for maintaining the air bubbles of this system (Figure 6b,e), which is additionally confirmed by the rheological properties of the corresponding foam, its overrun and stability. In this case, a smaller viscosity of the pre-foam solution is also of special significance when compared to that containing 15% sucrose. Larger viscosity of the pre-foam solution can create a barrier to protein adsorption and thus affect the aerated structure of the meringue. Raikos et al. [11] indicate that the increased viscosity can affect the final cake volume by stabilizing the wet foam before turning into the solid one. Yang and Foegeding [20] reported that the sugar addition up to 10% kept a hold of meringue matrix more effectively.
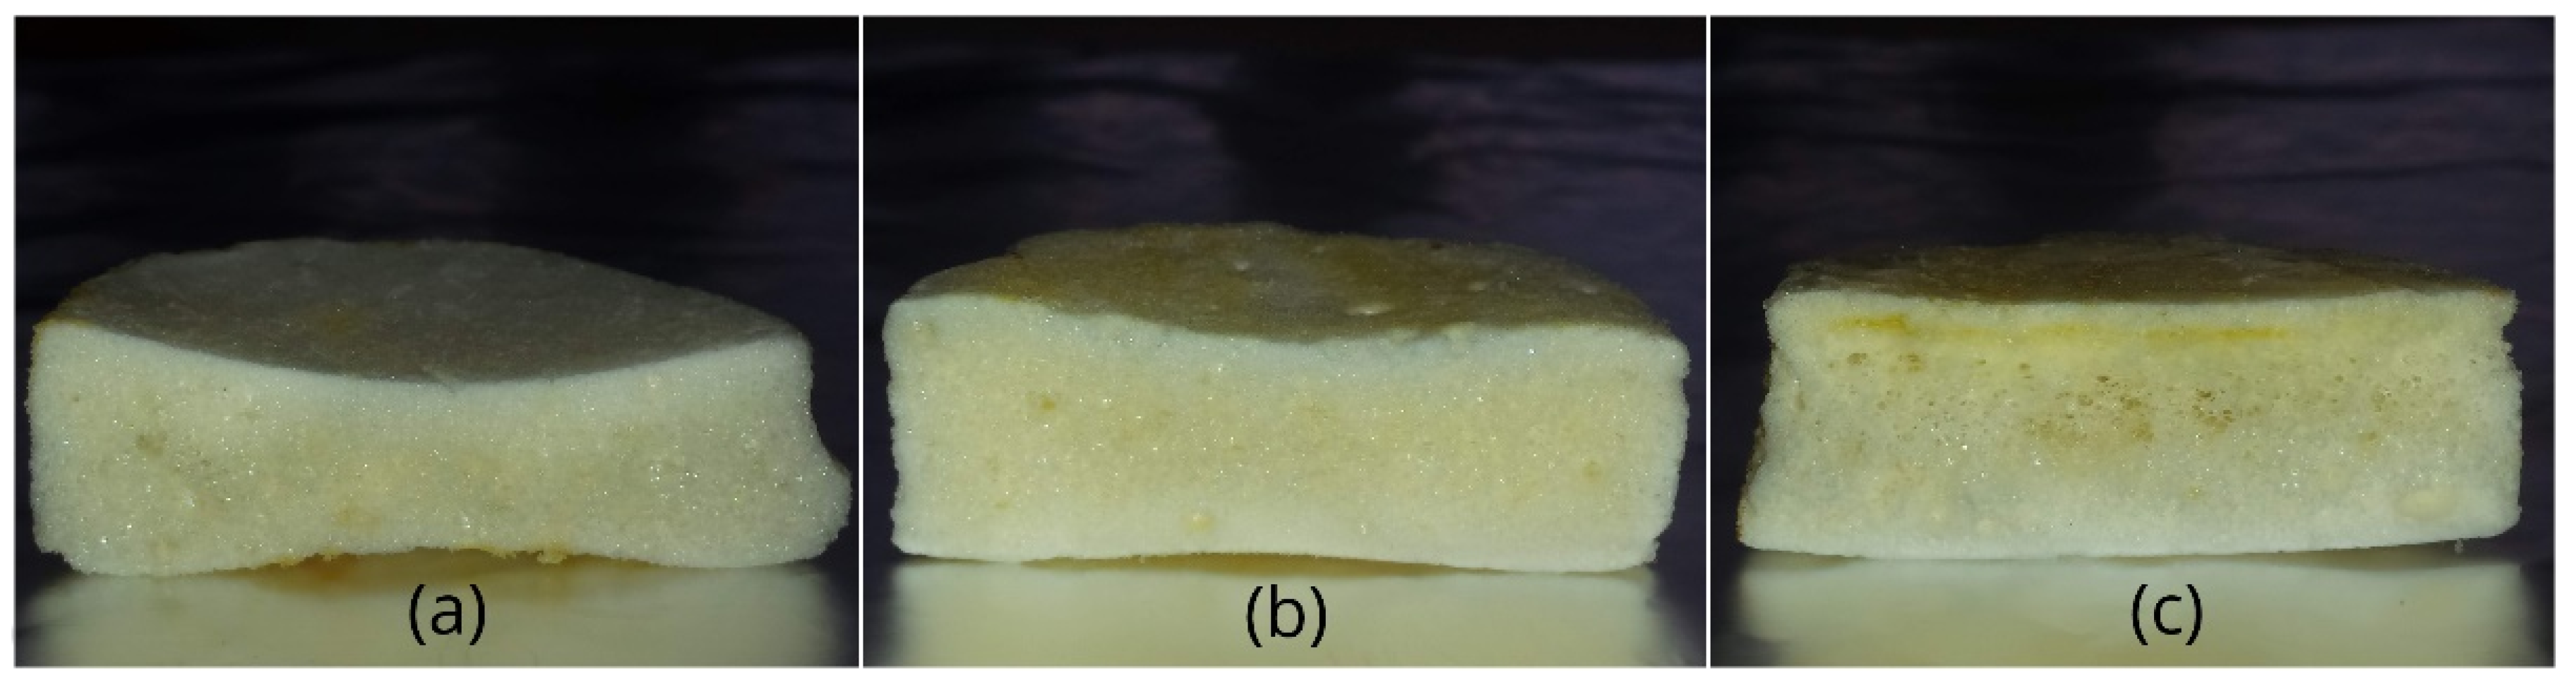
The increased sucrose concentration results in an increased final volume of the meringues (Figure 7a–c). The smallest cake volume for the sample containing 5% sugar (Figure 7a) can be due to a collapse of foam matrix during solidification, which suggests that the bulking and stabilizing effect of sugar on WPI was insufficient. The meringue with the 15% sugar content demonstrated the largest volume (Figure 7c); however, this does not correspond to the smaller overrun and stability of the liquid foam. This relation is rather hard to determine because according to Raikos et al. [11] air bubbles expand and/or coalesce during baking. The authors emphasize that the sucrose addition can change the bubble size and thickness of lamella film resulting in the increased meringue volume due to the bulking effect. At the larger sugar additions the meringue structure can change from coarse to collapsed due to the protein film rupture and bubble collapse. During solidification air bubbles in the meringues expand as temperature rises and collapse due to the bubble film rupture. The final volume and its structure is a resultant of both processes. Yang and Foegeding [31] state that the sucrose addition increases the protein denaturation temperatures. Wilderjans et al. [44] claim that the sugar addition up to 10% increased the denaturation temperature of protein by approximately 2 °C. Díaz-Ramírez et al. [21] reported that the proteins compete with the sucrose for available water; thus as the protein concentration increases, the sucrose stability decreases causing its crystallization when exposed to heat. Rodríguez Patino et al. [45] emphasized that proteins tend to interact with each other (gelation) at the air-water interface during heating. Yang and Foegeding [20] compared the effect of the powdered sugar addition before and after foam formation, and they noticed no major changes in cake volumes. However, at larger sugar concentrations, cakes with the sugar added after the foam formation demonstrated larger volumes than the samples with the sugar added before that.
4. Conclusions
It is possible to obtain high-protein meringues from WPI at the smallest sugar concentration (5%), which is not used in the industry. A different effect of sugar was observed for the liquid and solid foams. For the pre-foam solutions and liquid foams, the surface tension, G′, G″, overrun, and foam stability increased up to 10% of sucrose, then decreased at 15%. The only parameters deviating from this pattern were the solution viscosity and zeta potential, which increased in the whole range of sugar concentrations. For the solid foams, the increased sugar concentration resulted in the smoother surface and the increased surface hydrophilicity associated with the lower surface energy. It seems that surface properties of solid foams are governed more the by pre-foam solution viscosity. For the solid foams, the surface properties are more dependent on the sugar concentration itself than on the protein-sucrose interactions. The increase in the sugar concentration causes an increase in the viscosity of the solution resulting in an increase in the final volume and a decrease in the surface roughness (slower migration of bubbles towards the surface). Increasing the sugar concentration also increases the hydrophilicity of the surface since the sugar is a hydrophilic component.
Knowledge about the product structure is important to control the essential parameters that determine the properties of the final product. A significant reduction in the sugar content allows us to obtain a product with the characteristic features of traditional meringue and lower caloric value. The obtained meringues can be an alternative to the traditional protein shakes that are very labile without refrigeration.
This technology is addressed to special consumers (sportsmen and physically active people), who search for new functional foods to meet their daily protein requirements, in addition to diabetics and groups of consumers as part of weight management programs.
Author Contributions
Conceptualization, M.N.; methodology, M.N. and K.T.; software, M.N. and K.T.; validation, M.N., K.T., S.M. and M.T.-M.; formal analysis, M.N., K.T. and S.M.; investigation, M.N., K.T. and S.M.; resources, M.N. and K.T.; data curation, M.N. and K.T.; writing—original draft preparation, M.N.; writing—review and editing, M.N., K.T., S.M. and M.T.-M.; visualization, M.N. and K.T.; supervision, M.N., K.T., S.M. and M.T.-M. All authors have read and agreed to the published version of the manuscript.
Funding
This research received no external funding.
Institutional Review Board Statement
Not applicable.
Informed Consent Statement
Not applicable.
Data Availability Statement
The data that support the findings of this study are available from the corresponding author upon reasonable request.
Acknowledgments
The authors are deeply indebted to Wiesław Kucia from Wiesław Kucia’s Artistic School in Lublin, Poland (www.kucia.com.pl, accessed on 20 May 2021) for substantive help during the creation of this paper.
Conflicts of Interest
The authors declare no conflict of interest.
References
- Nastaj, M.; Sołowiej, B.G. Effect of various pH values on foaming properties of whey protein preparations. Int. J. Dairy Technol. 2020, 73, 683–694. [Google Scholar] [CrossRef]
- Campbell, G.M.; Mougeot, E. Creation and characterization of aerated food products. Trends Food Sci.Technol. 1999, 10, 283–296. [Google Scholar] [CrossRef]
- Hao, Y.; Wang, F.; Huang, W.; Tang, X.; Zou, Q.; Li, Z.; Ogawa, A. Sucrose substitution by polyols in sponge cake and their effects on the foaming and thermal properties of egg protein. Food Hydrocoll. 2016, 57, 153–159. [Google Scholar] [CrossRef]
- Licciardello, F.; Frisullo, P.; Laverse, J.; Muratore, G.; Del Nobile, M.A. Effect of sugar, citric acid and egg white type on the microstructural and mechanical properties of meringues. J. Food Eng. 2012, 108, 453–462. [Google Scholar] [CrossRef]
- Berry, T.K.; Yang, X.; Foegeding, E.A. Foams prepared from whey protein isolate and egg white protein: 1. Changes associated with angel food cake functionality. J. Food Sci. 2009, 74, 269–277. [Google Scholar] [CrossRef]
- McGee, H. On Food and Cooking: The Science and Lore of the Kitchen; MacMillian: New York, NY, USA, 1984; ISBN 1-4165-5637-0. [Google Scholar]
- Di Monaco, R.; Miele, N.A.; Cabisidan, E.K.; Cavella, S. Strategies to reduce sugars in food. Curr. Opin. Food Sci. 2018, 19, 92–97. [Google Scholar] [CrossRef]
- Nastaj, M.; Sołowiej, B.G.; Terpiłowski, K.; Mleko, S. Effect of erythritol on physicochemical properties of reformulated high protein meringues obtained from whey protein isolate. Int. Dairy J. 2020, 105, 104672. [Google Scholar] [CrossRef]
- Mleko, S.; Kristinsson, H.G.; Liang, Y.; Gustaw, W. Rheological properties of foams generated from egg albumin after pH treatment. LWT Food Sci. Technol. 2007, 40, 908–914. [Google Scholar] [CrossRef]
- Mine, Y. Recent advances in understanding of egg white protein functionality. Trends Food Sci. Technol. 1995, 6, 225–232. [Google Scholar] [CrossRef]
- Raikos, V.; Campbell, L.; Euston, S.R. Effects of sucrose and sodium chloride on foaming properties of egg white proteins. Food Res. Int. 2007, 40, 347–355. [Google Scholar] [CrossRef]
- Foegeding, E.A.; Luck, P.J.; Davis, J.P. Factors determining the physical properties of protein foams. Food Hydrocoll. 2006, 20, 284–292. [Google Scholar] [CrossRef]
- Peram, M.R.; Loveday, S.M.; Ye, A.; Singh, H. In vitro gastric digestion of heat-induced aggregates of b-lactoglobulin. J. Dairy Sci. 2013, 96, 63–74. [Google Scholar] [CrossRef] [PubMed] [Green Version]
- Shin, M.; Han, Y.; Ahn, K. The influence of the time and temperature of heat treatment on the allergenicity of egg white proteins. Allergy Asthma Immunol. Res. 2013, 5, 96–101. [Google Scholar] [CrossRef] [Green Version]
- Singh, A.; Geveke, D.J.; Jones, D.R.; Tilman, E.D. Can acceptable quality angel food cakes be made using pasteurized shell eggs? The effects of mixing factors on functional properties of angel food cakes. Food Sci. Nutr. 2020, 7, 987–996. [Google Scholar] [CrossRef] [Green Version]
- Nastaj, M.; Sołowiej, B.G.; Gustaw, W.; Perez-Huertas, S.; Mleko, S.; Wesołowska-Trojanowska, M. Physicochemical properties of High-Protein-Set Yoghurts obtained with the addition of whey protein preparations. Int. J. Dairy Technol. 2019, 72, 395–402. [Google Scholar] [CrossRef]
- Nastaj, M.; Terpiłowski, K.; Sołowiej, B.G. The effect of native and polymerised whey protein isolate addition on surface and microstructural properties of processed cheeses and their meltability determined by Turbiscan. Int. J. Food Sci. Technol. 2020, 55, 2179–2187. [Google Scholar] [CrossRef]
- Szafrańska, J.O.; Sołowiej, B.G. Cheese sauces: Characteristics of ingredients, manufacturing methods, microbiological and sensory aspects. J. Food Process Eng. 2020, 43, e13364. [Google Scholar] [CrossRef]
- Smithers, G.W. Whey and whey proteins—From ‘gutter-to-gold’. Int. Dairy J. 2008, 18, 695–704. [Google Scholar] [CrossRef]
- Yang, X.; Foegeding, E.A. The stability and physical properties of egg white and whey protein foams explained based on microstructure and interfacial properties. Food Hydrocoll. 2011, 25, 1687–1701. [Google Scholar] [CrossRef]
- Díaz-Ramírez, M.; Calderón-Domínguez, G.; García-Garibay, M.; Jiménez-Guzmán, J.; Villanueva-Carvajal, A.; de la Paz Salgado-Cruz, M.; Arizmendi-Cotero, D.; Del Moral-Ramírez, E. Effect of whey protein isolate addition on physical, structural and sensory properties of sponge cake. Food Hydrocoll. 2016, 61, 233–239. [Google Scholar] [CrossRef]
- Nastaj, M.; Sołowiej, B.G.; Gustaw, W. Physicochemical properties of high protein meringues made from different whey protein preparations. Żywność Nauka Technol. Jakość 2014, 2, 33–47. [Google Scholar]
- Inoue, K.; Fu, W.; Nakamura, T. Explaining the different textures of commercial processed cheese from fractured structures. Int. Dairy J. 2019, 97, 40–48. [Google Scholar] [CrossRef]
- Magens, O.M.; Liu, Y.; Hofmans, J.F.A.; Nelissen, J.A.; Wilson, I.D. Adhesion and cleaning of foods with complex structure: Effect of oil content and fluoropolymer coating characteristics on the detachment of cake from baking surfaces. J. Food Eng. 2017, 197, 48–59. [Google Scholar] [CrossRef] [Green Version]
- Razi, S.M.; Motamedzadegan, A.; Shahidi, A.; Rashidinejad, A. The effect of basil seed gum (BSG) on the rheological and physicochemical properties of heat-induced egg albumin gels. Food Hydrocoll. 2018, 82, 268–277. [Google Scholar] [CrossRef]
- Lau, C.K.; Dickinson, E. Instability and structural change in an aerated system containing egg albumen and invert sugar. Food Hydrocoll. 2015, 19, 111–121. [Google Scholar] [CrossRef]
- Davis, J.P.; Foegeding, E.A. Comparisons of the foaming and interfacial properties of whey protein isolate and egg white proteins. Colloids Surf. B 2007, 54, 200–210. [Google Scholar] [CrossRef] [PubMed]
- Belyakova, L.E.; Antipova, A.S.; Semenova, M.G.; Dickinson, E.; Merino, L.; Tsapkina, E.N. Effect of sucrose on molecular and interaction parameters of sodium caseinate in aqueous solution: Relationship to protein gelation. Colloids Surf. B 2003, 31, 31–46. [Google Scholar] [CrossRef]
- Cano-Sarmiento, C.; Téllez-Medina, D.I.; Viveros-Contreras, R.; Cornejo-Mazón, M.; Figueroa-Hernández, C.Y.; García-Armenta, E.; Alamilla-Beltrán, L.; García, H.S.; Gutiérrez-López, G.F. Zeta Potential of Food Matrices. Food Eng. Rev. 2018, 10, 113–138. [Google Scholar] [CrossRef]
- Bhattacharjee, S. DLS and zeta potential—What they are and what they are not? J. Control. Release 2016, 235, 337–351. [Google Scholar] [CrossRef] [PubMed]
- Yang, X.; Foegeding, E.A. Effects of sucrose on egg white protein and whey protein isolate foams: Factors determining properties of wet and dry foams (cakes). Food Hydrocoll. 2010, 24, 227–238. [Google Scholar] [CrossRef]
- Tabilo-Munizaga, G.; Barbosa-Canovas, G.V. Rheology for the food industry. J. Food Eng. 2005, 67, 147–156. [Google Scholar] [CrossRef]
- Poole, R.J. The Deborah and Weissenberg numbers. Br. Soc. Rheol. Rheol. Bull. 2012, 53, 32–39. [Google Scholar]
- Luck, P.J.; Bray, N.; Foegeding, E.A. Factors determining yield stress and overrun of whey protein foams. J. Food Sci. 2006, 65, 1677–1681. [Google Scholar] [CrossRef]
- Thakur, R.K.; Vial, C.; Djelveh, G. Effect of composition and process parameters on elasticity and solidity of foamed food. Chem. Eng. Process. 2008, 47, 474–483. [Google Scholar] [CrossRef]
- Sadahira, M.S.; Rodrigues, M.I.; Akhtar, M.; Murray, B.S.; Netto, F.M. Effect of egg white protein-pectin electrostatic interactions in a high sugar content system on foaming and foam rheological properties. Food Hydrocoll. 2016, 58, 1–10. [Google Scholar] [CrossRef]
- Martínez-Padilla, L.P.; García-Mena, V.; Casas-Alencáster, N.B.; Sosa-Herrera, M.G. Foaming properties of skim milk powder fortified with milk proteins. Int. Dairy J. 2014, 36, 21–28. [Google Scholar] [CrossRef]
- Rodríguez Patino, J.M.; Naranjo Delgado, M.D.; Linares Fernández, J.A. Stability and mechanical strength of aqueous foams containing food proteins. Colloids Surf. A 1995, 99, 65–78. [Google Scholar] [CrossRef]
- Yankov, S.; Panchev, I. Foaming properties of sugar-egg mixtures with milk protein concentrates. Food Res. Int. 1996, 29, 521–525. [Google Scholar] [CrossRef]
- Arunepanlop, B.; Morr, C.V.; Karleskind, D.; Laye, I. Partial replacement of egg white proteins with whey proteins in angel food cakes. J. Food Sci. 1996, 61, 1085–1093. [Google Scholar] [CrossRef]
- Mensink, M.A.; Frijlink, H.W.; Maarschalk, K.V.; Hinrichs, W.L.J. How sugars protect proteins in the solid state and during drying (review): Mechanisms of stabilization in relation to stress conditions. Eur. J. Pharm. Biopharm. 2017, 114, 288–295. [Google Scholar] [CrossRef]
- Terpiłowski, K.; Rymuszka, D.; Goncharuk, O.V.; Sulym, I.Y.; Gun’ko, V.M. Wettability of modified silica layers deposited on glass support activated by plasma. Appl. Surf. Sci. 2015, 353, 843–850. [Google Scholar] [CrossRef]
- Drelich, J.W.; Boinovich, L.; Chibowski, E.; Della Volpe, C.; Marmur, A.; Siboni, S. Contact angles: History of over 200 years of open questions. Surf. Innov. 2020, 8, 3–27. [Google Scholar] [CrossRef] [Green Version]
- Wilderjans, E.; Luyts, A.; Brijs, K.; Delcour, J.A. Ingredient functionality in batter type cake making. Trends Food Sci. Technol. 2013, 30, 6–15. [Google Scholar] [CrossRef]
- Rodríguez Patino, J.M.; Rodríguez Niño, M.R.; Sánchez, C.C.; Navarro García, J.M.; Rodríguez Mateo, G.R.; Cejudo Fernández, M. The effect of temperature on food emulsifiers at fluid–fluid interfaces. Colloids Surf. B 2001, 21, 87–99. [Google Scholar] [CrossRef]
Figure 1.
Viscosity curves of the pre-foam solutions.

Figure 2.
Zeta potential (ζ) values of the pre-foam solutions. The differences among the mean values in the column designated with different letters are statistically significant (p < 0.05).
Figure 2.
Zeta potential (ζ) values of the pre-foam solutions. The differences among the mean values in the column designated with different letters are statistically significant (p < 0.05).
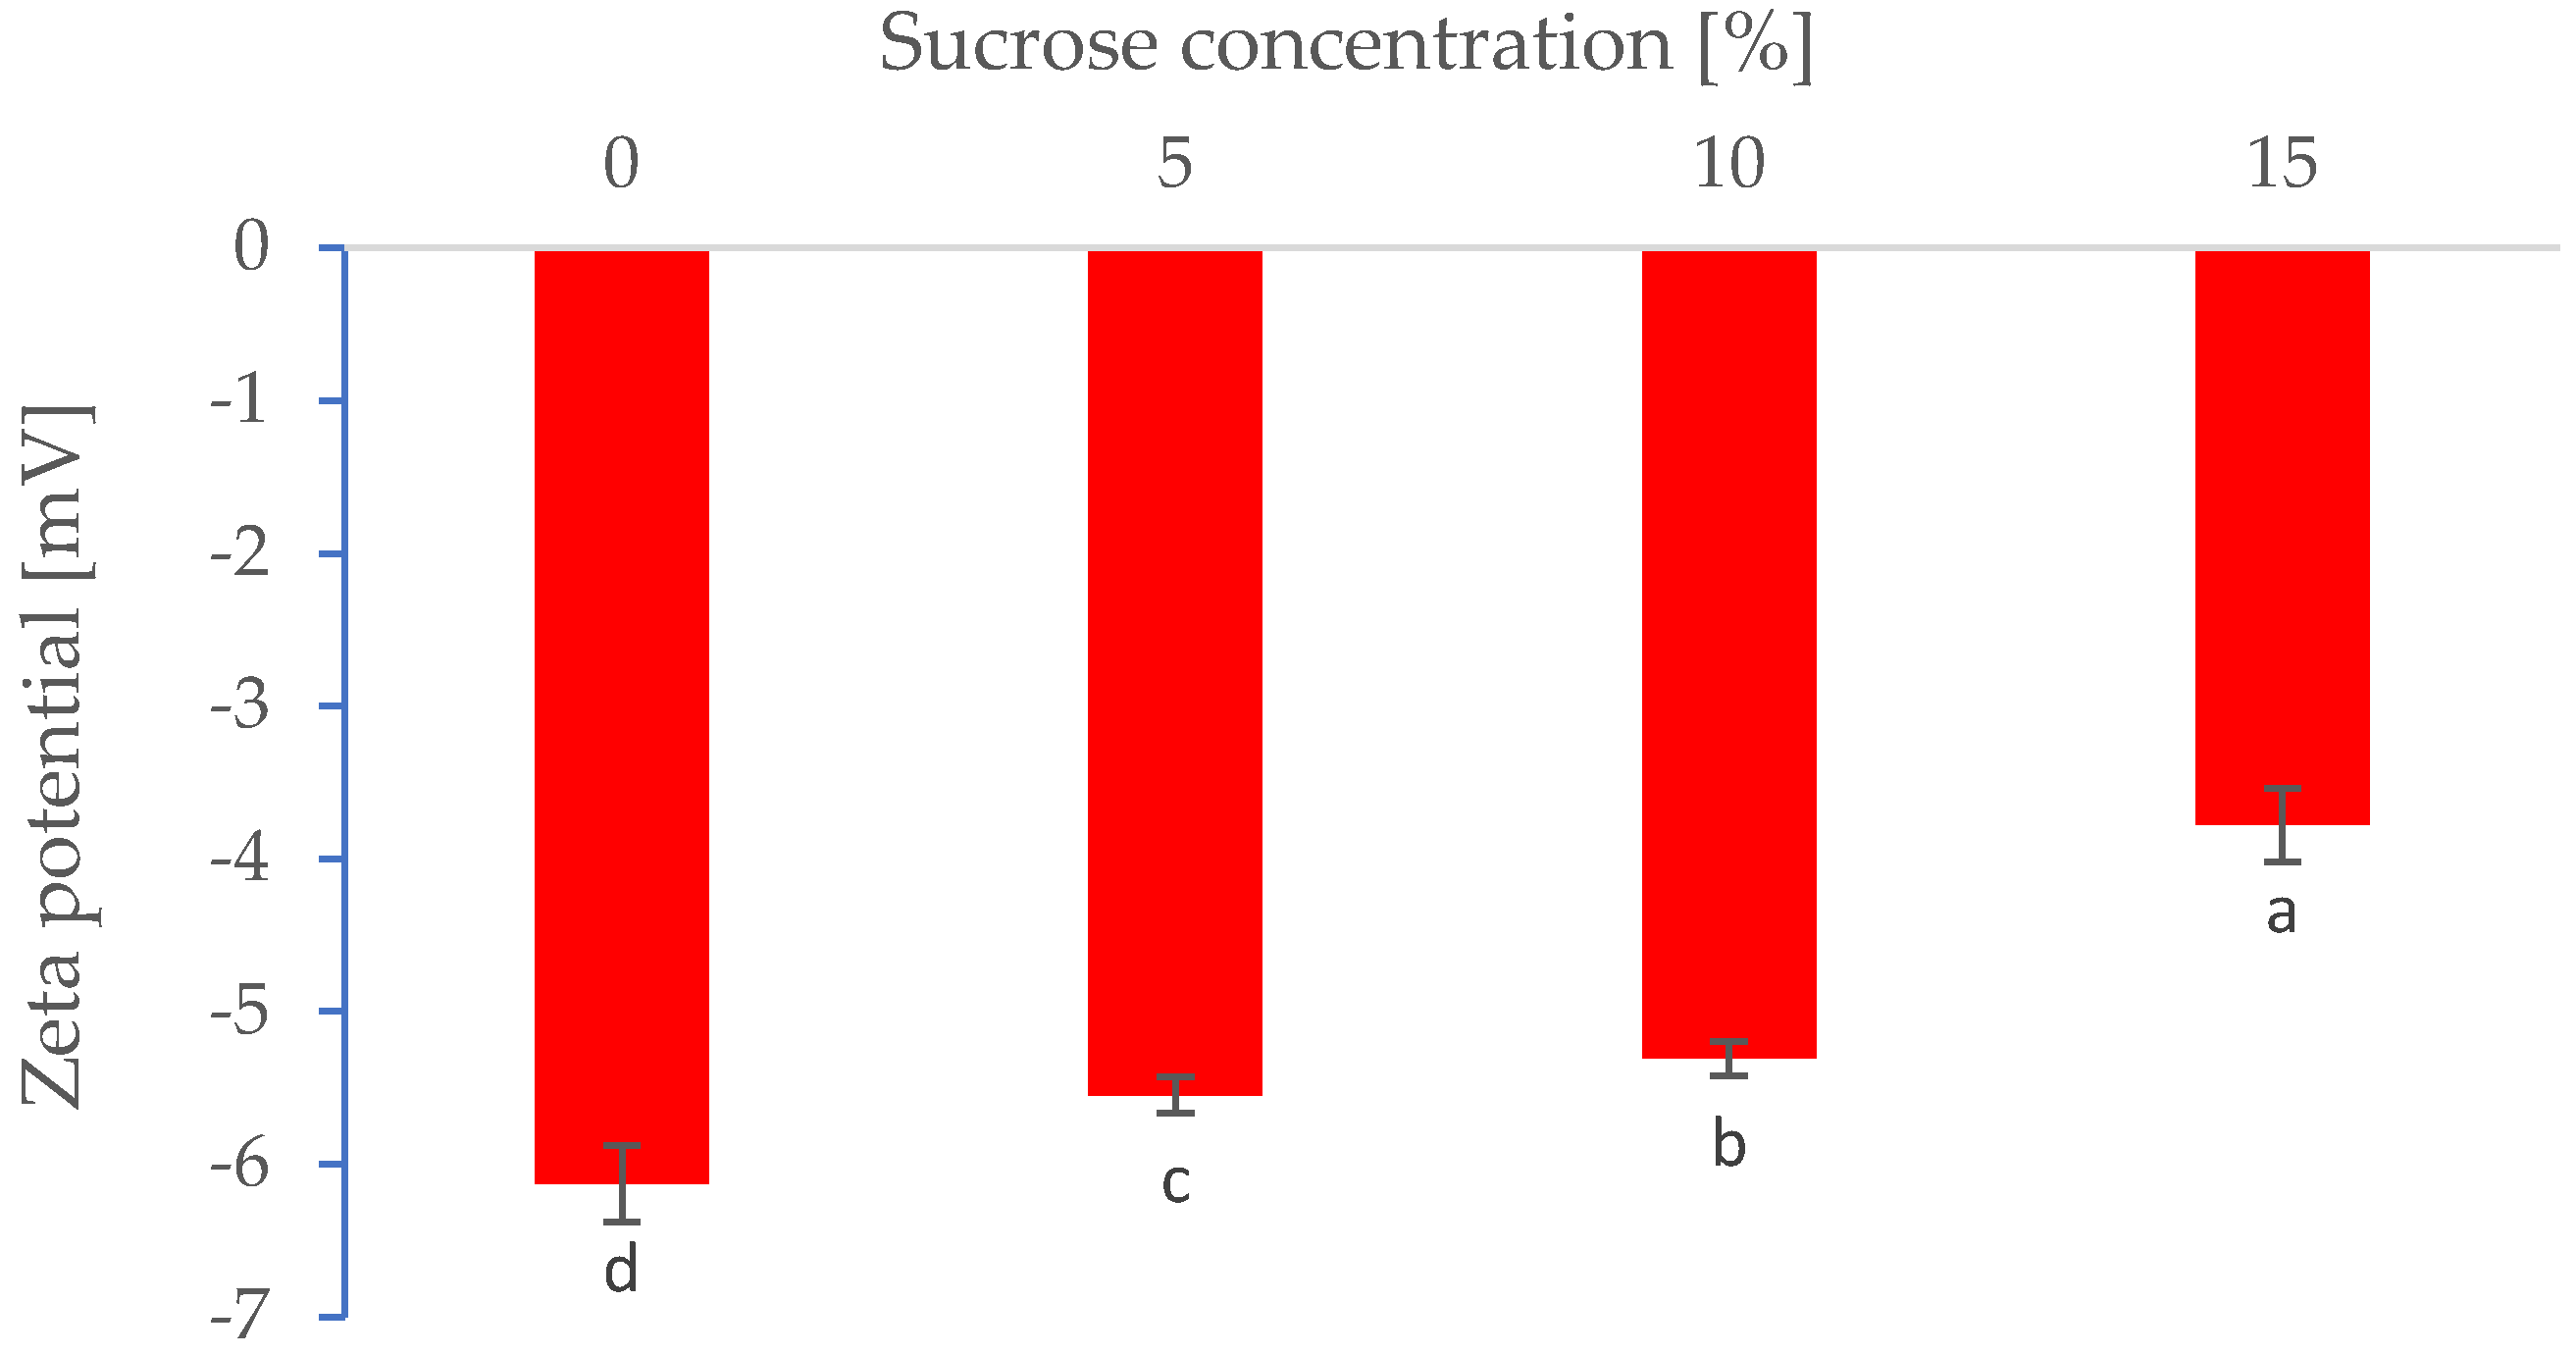
Figure 3.
Frequency sweep experiment of the analyzed liquid foams. The graph represents one replication.
Figure 3.
Frequency sweep experiment of the analyzed liquid foams. The graph represents one replication.
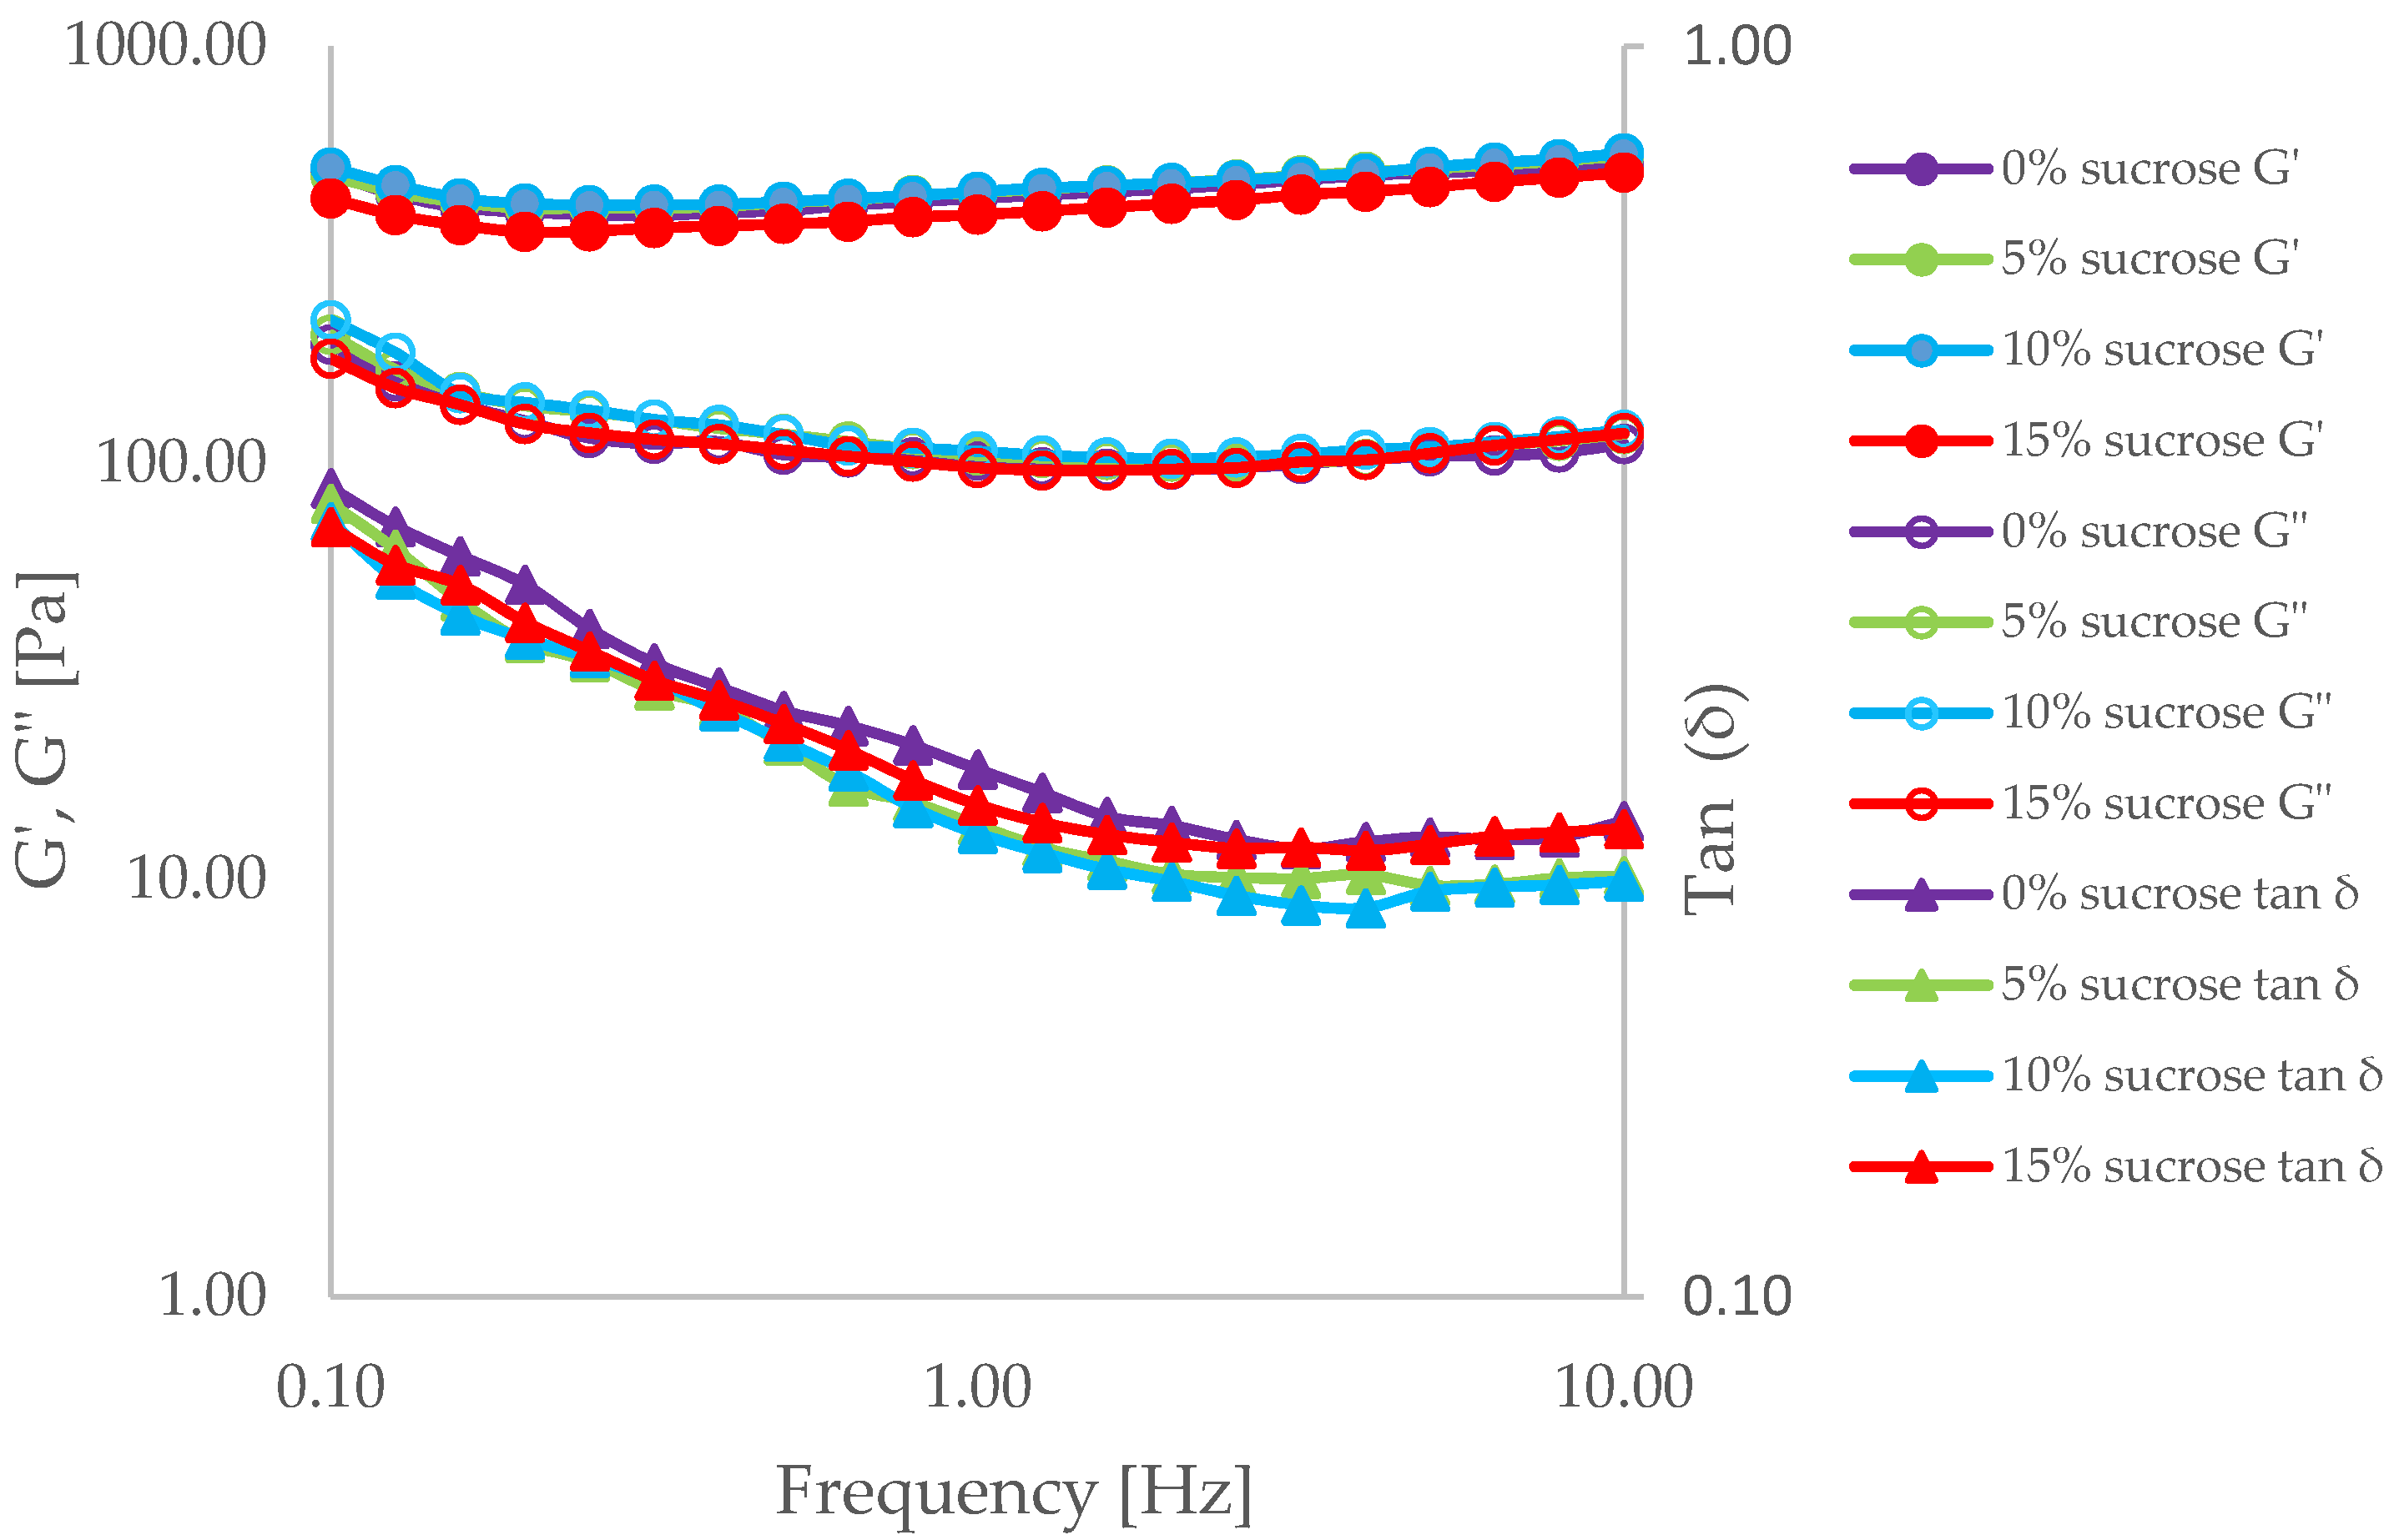
Figure 4.
Transmission and backscattering of liquid foams. (a) WPI/0% sucrose; (b) WPI/5% sucrose; (c) WPI/10% sucrose; (d) WPI/15% sucrose and corresponding Turbiscan stability index (TSI) values.
Figure 4.
Transmission and backscattering of liquid foams. (a) WPI/0% sucrose; (b) WPI/5% sucrose; (c) WPI/10% sucrose; (d) WPI/15% sucrose and corresponding Turbiscan stability index (TSI) values.
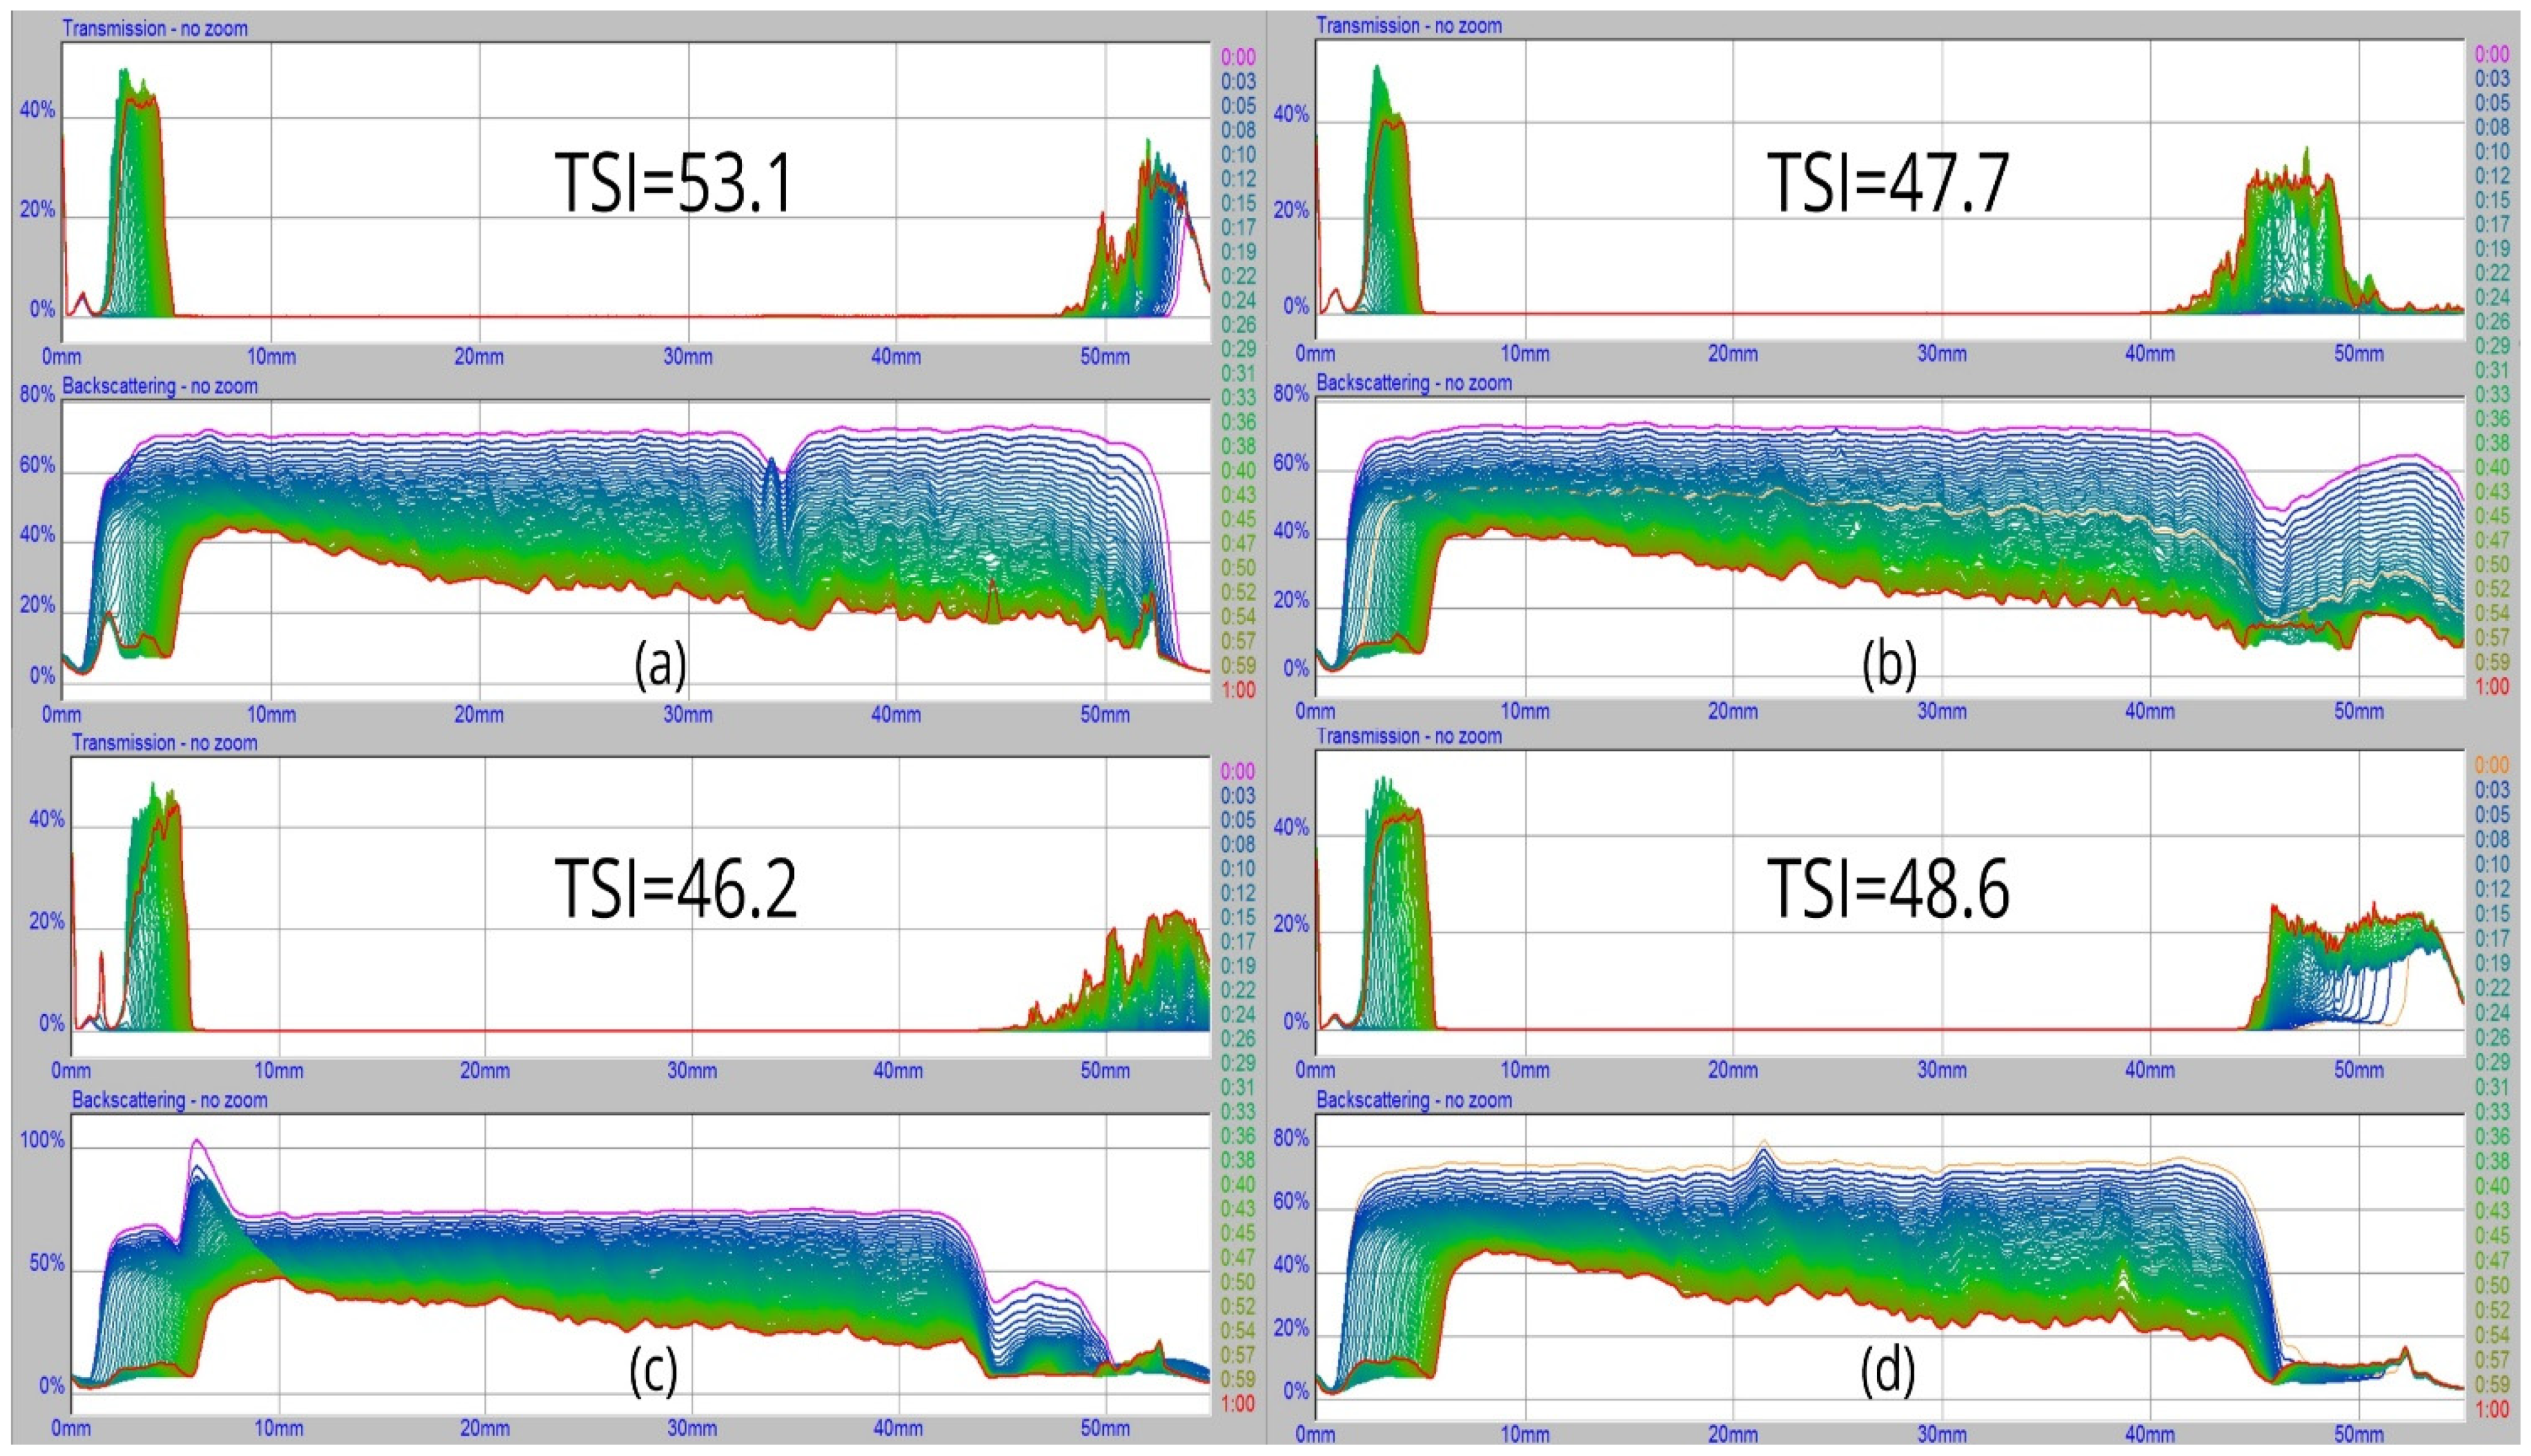
Figure 5.
Profilometer images. Z axes are represented by the side profiles on the right and the surface roughness parameters for the samples (surface 0.9 × 1.3 mm). The largest roughness values are represented by the red regions and the smallest by the blue ones. Ra-the average roughness. Rq-the quadratic mean of surface roughness. Rt-the maximum roughness height. (a) WPI/5% sucrose; (b) WPI/10% sucrose; (c) WPI/15% sucrose.
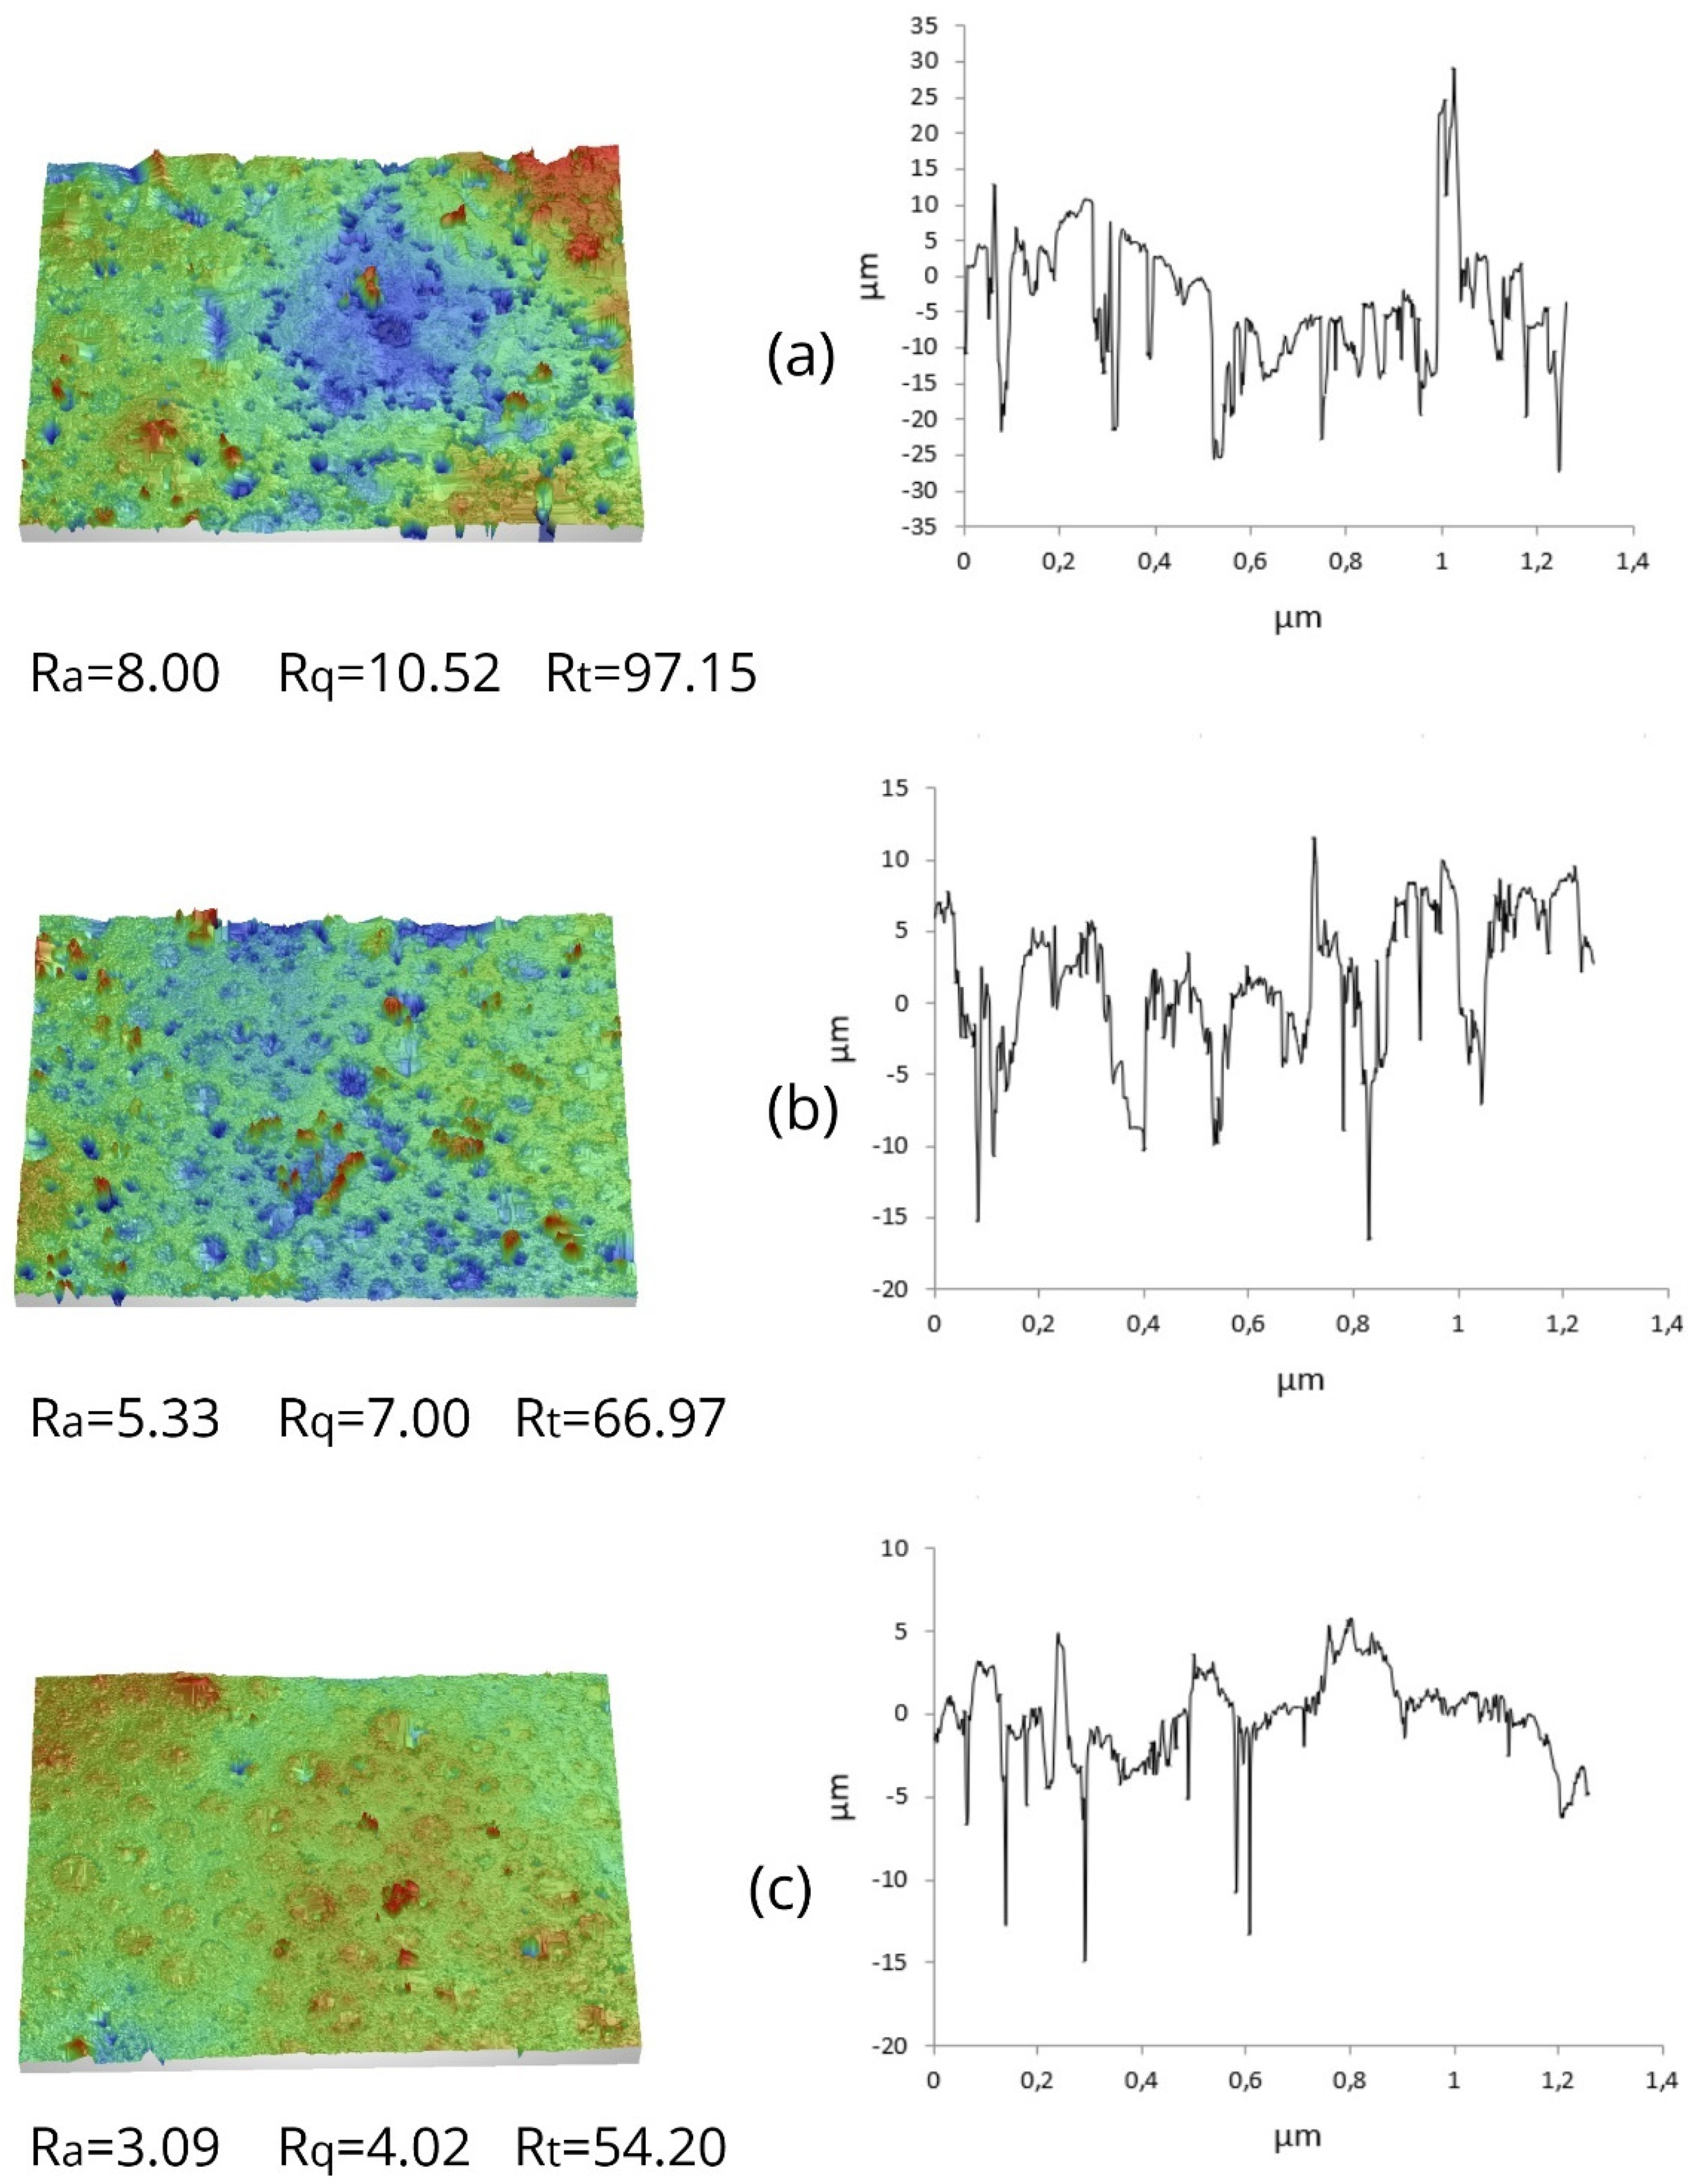
Figure 6.
Microscopic images (magnitude 40×) of surfaces (a–c) and cross-sections (d–f) of the samples. (a) WPI/5% sucrose; (b) WPI/10% sucrose; (c) WPI/15% sucrose; (d) WPI/5% sucrose; (e) WPI/10% sucrose; (f) WPI/15% sucrose.
Figure 6.
Microscopic images (magnitude 40×) of surfaces (a–c) and cross-sections (d–f) of the samples. (a) WPI/5% sucrose; (b) WPI/10% sucrose; (c) WPI/15% sucrose; (d) WPI/5% sucrose; (e) WPI/10% sucrose; (f) WPI/15% sucrose.
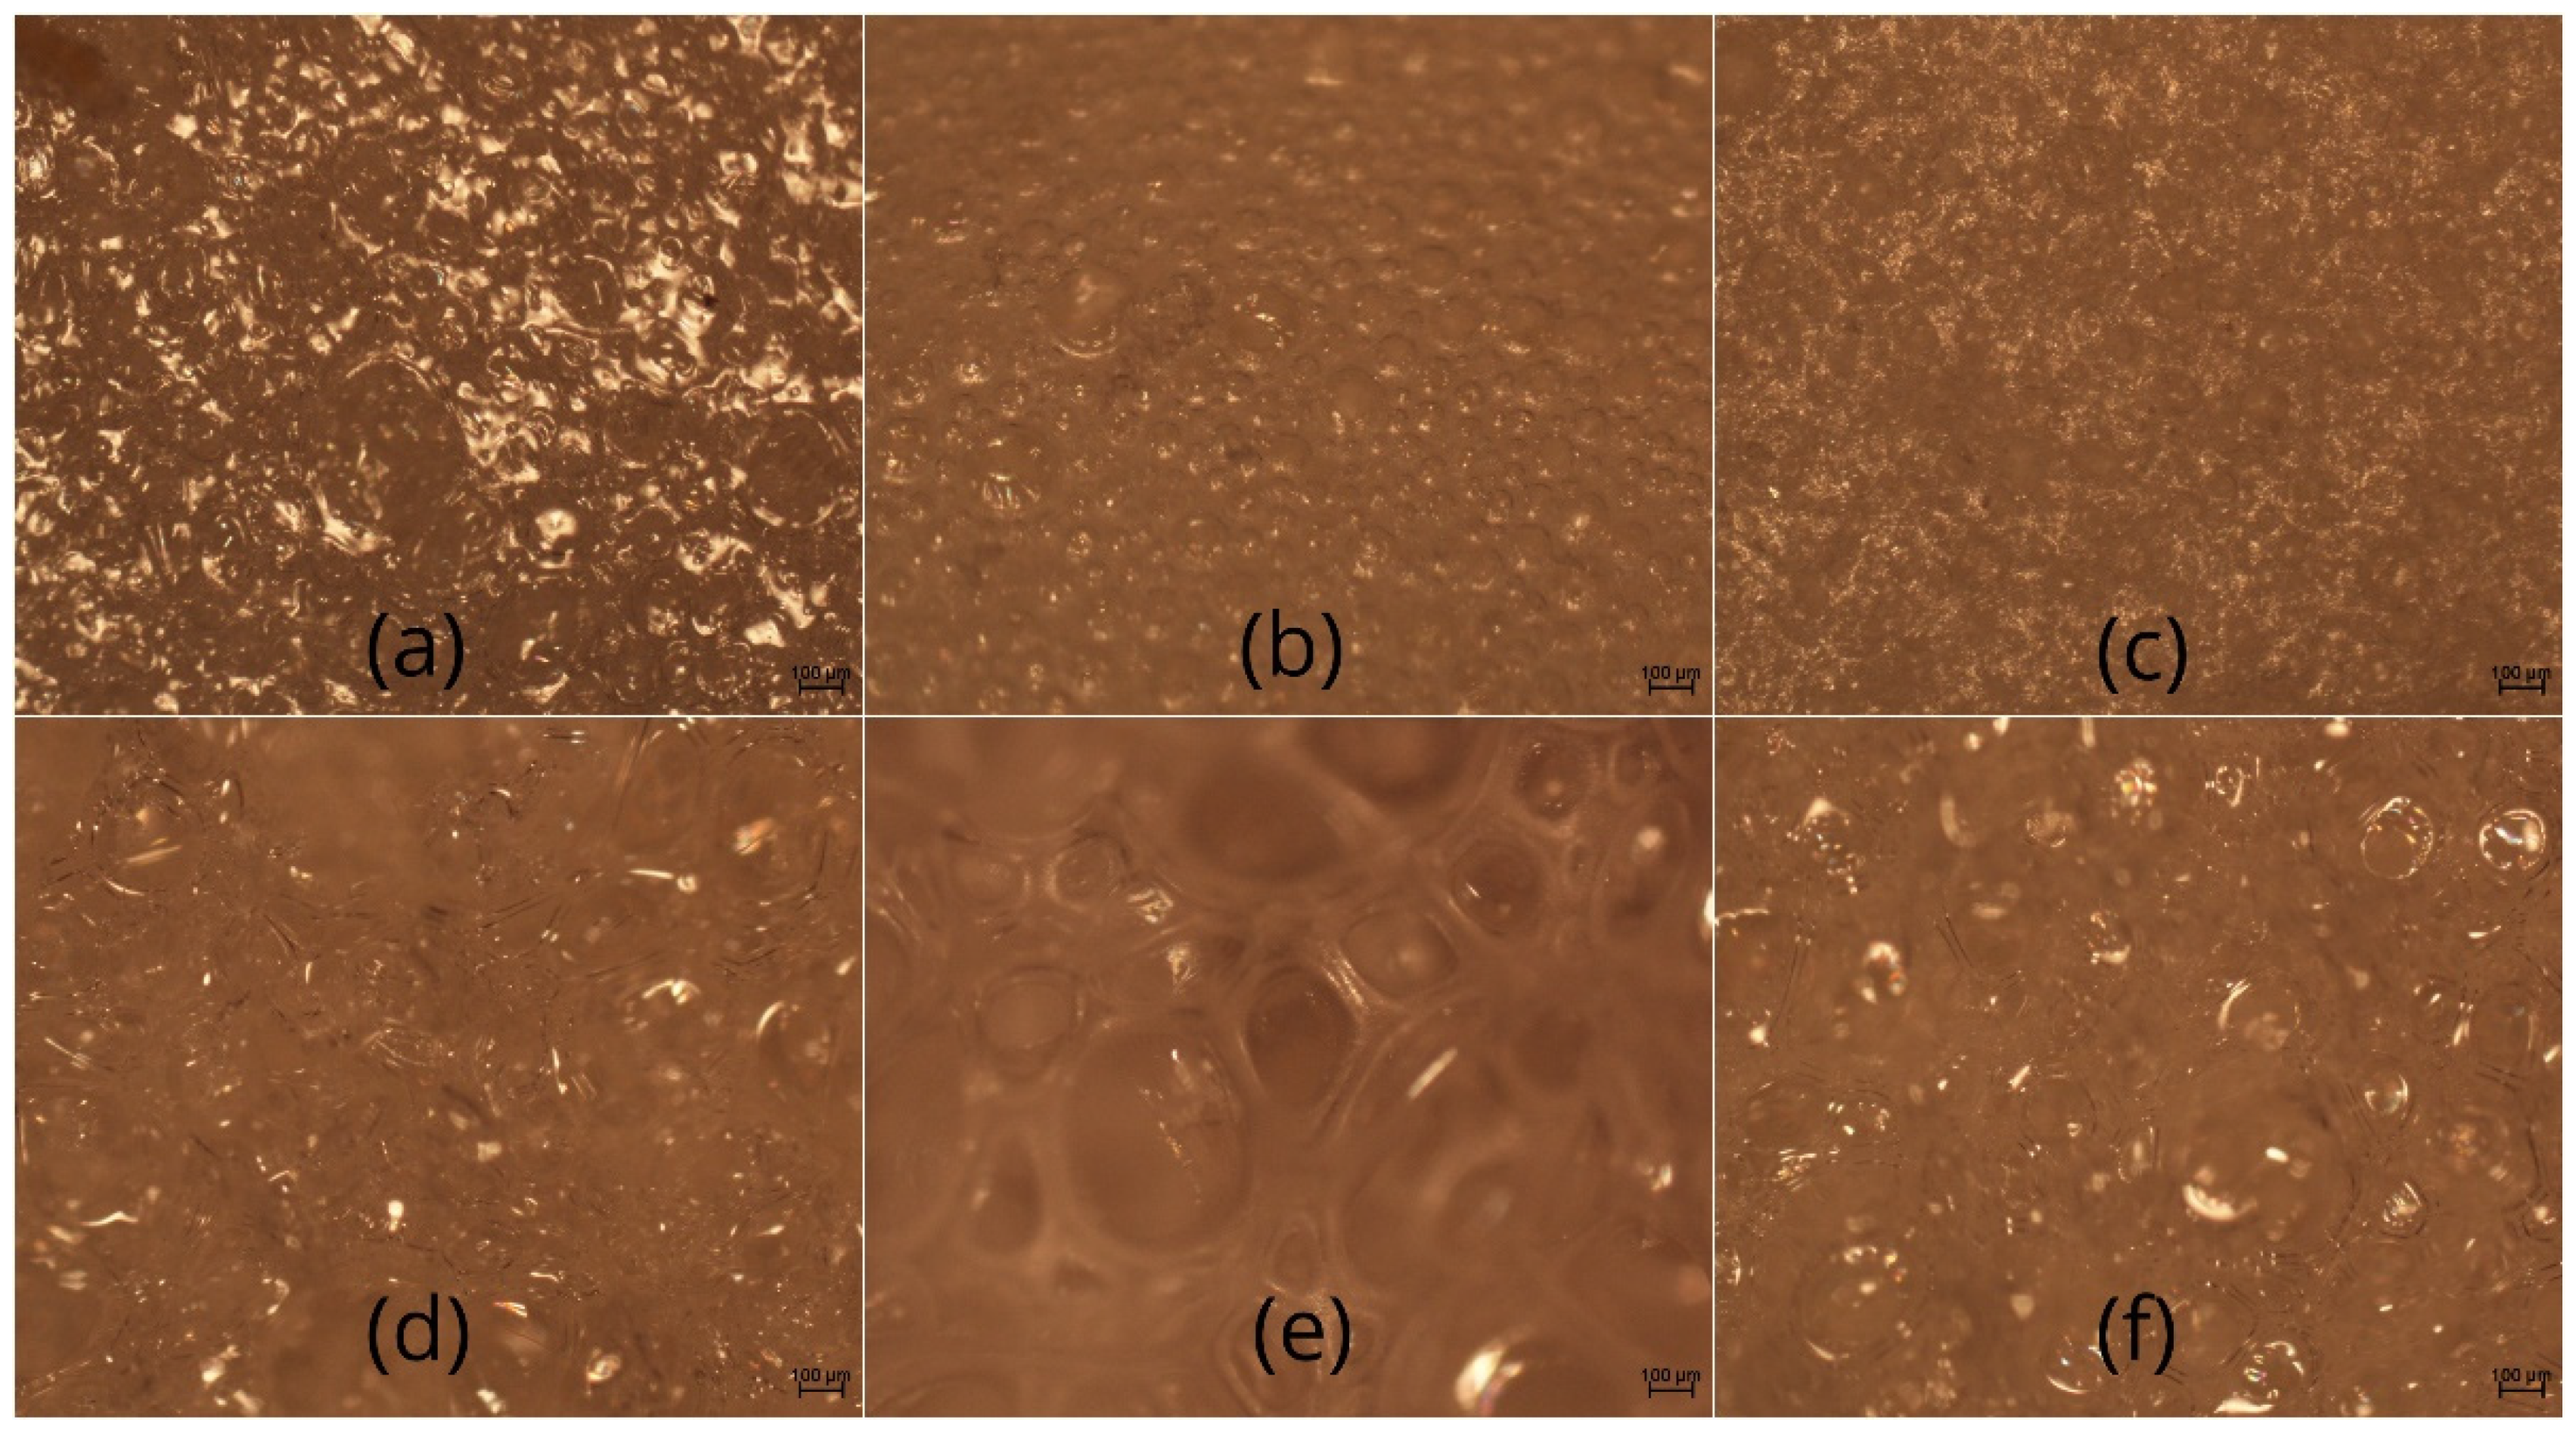
Figure 7.
Actual cross-sections (a–c) of the samples. (a) WPI/5% sucrose; (b) WPI/10% sucrose; (c) WPI/15% sucrose.
Figure 7.
Actual cross-sections (a–c) of the samples. (a) WPI/5% sucrose; (b) WPI/10% sucrose; (c) WPI/15% sucrose.

Table 1.
Surface tension values of the pre-foam solutions.
| Sample | γ (mN/m2) |
|---|---|
| 20% WPI/0% sucrose | 44.68 c ± 0.02 |
| 20% WPI/5% sucrose | 48.83 b ± 0.26 |
| 20% WPI/10% sucrose | 49.79 a ± 0.19 |
| 20% WPI/15% sucrose | 49.67 a ± 0.14 |
The differences among the mean values in the column designated with different letters are statistically significant (p < 0.05).
Table 2.
Overrun (OR) and air phase fraction (Φ) values measured for the liquid foams.
| Sample | OR (%) | Φ |
|---|---|---|
| 20% WPI/0% sucrose | 661.82 c ± 8.44 | 0.867 c ± 0.001 |
| 20% WPI/5% sucrose | 699.13 b ± 7.63 | 0.874 b ± 0.001 |
| 20% WPI/10% sucrose | 724.21 a ± 6.76 | 0.878 a ± 0.001 |
| 20% WPI/15% sucrose | 642.05 d ± 5.16 | 0.864 d ± 0.001 |
The differences among the mean values in the column designated with different letters are statistically significant (p < 0.05).
Table 3.
The advancing (θa), receding (θr) contact angles and apparent surface free energy measured for the samples.
Table 3.
The advancing (θa), receding (θr) contact angles and apparent surface free energy measured for the samples.
| Sample | Probe Liquid | Contact θa | Angles θr | γs (mJ/m2) |
|---|---|---|---|---|
| 20% WPI/5% sucrose | Water | 120.6 a ± 8.9 | 110.1 a ± 8.0 | 33.4 c ± 1.2 |
| 20% WPI/5% sucrose | Diiodomethane | 74.8 a ± 4.6 | 68.3 a ± 2.4 | 21.2 c ± 3.9 |
| 20% WPI/10% sucrose | Water | 83.2 b ± 5.5 | 65.6 b ± 4.2 | 46.4 b ± 2.8 |
| 20% WPI/10% sucrose | Diiodomethane | 52.7 b ± 5.0 | 45.5 b ± 2.8 | 42.0 b ± 1.0 |
| 20% WPI/15% sucrose | Water | 63.1 c ± 5.1 | 35.9 c ± 3.2 | 60.1 a ± 1.6 |
| 20% WPI/15% sucrose | Diiodomethane | 51.5 b ± 3.3 | 43.8 b ± 2.7 | 42.4 b ± 1.1 |
The differences among the mean values in the column designated with different letters are statistically significant (p < 0.05).
Publisher’s Note: MDPI stays neutral with regard to jurisdictional claims in published maps and institutional affiliations. |
© 2021 by the authors. Licensee MDPI, Basel, Switzerland. This article is an open access article distributed under the terms and conditions of the Creative Commons Attribution (CC BY) license (https://creativecommons.org/licenses/by/4.0/).
Share and Cite
MDPI and ACS Style
Nastaj, M.; Mleko, S.; Terpiłowski, K.; Tomczyńska-Mleko, M. Effect of Sucrose on Physicochemical Properties of High-Protein Meringues Obtained from Whey Protein Isolate. Appl. Sci. 2021, 11, 4764. https://doi.org/10.3390/app11114764
AMA Style
Nastaj M, Mleko S, Terpiłowski K, Tomczyńska-Mleko M. Effect of Sucrose on Physicochemical Properties of High-Protein Meringues Obtained from Whey Protein Isolate. Applied Sciences. 2021; 11(11):4764. https://doi.org/10.3390/app11114764
Chicago/Turabian StyleNastaj, Maciej, Stanisław Mleko, Konrad Terpiłowski, and Marta Tomczyńska-Mleko. 2021. "Effect of Sucrose on Physicochemical Properties of High-Protein Meringues Obtained from Whey Protein Isolate" Applied Sciences 11, no. 11: 4764. https://doi.org/10.3390/app11114764
Note that from the first issue of 2016, this journal uses article numbers instead of page numbers. See further details here.