Remote Sensing of Sewing Work Levels Using a Power Monitoring System


1
Department of Mechanical and Aerospace Engineering, Seoul National University, Seoul 08826, Korea
2
Hojeon Limited, Seoul 04165, Korea
3
Graduate School of Engineering Practice, Institute of Engineering Research, Seoul National University, Seoul 08826, Korea
*
Author to whom correspondence should be addressed.
Appl. Sci. 2020, 10(9), 3104; https://doi.org/10.3390/app10093104
Submission received: 19 March 2020
/
Revised: 23 April 2020
/
Accepted: 27 April 2020
/
Published: 29 April 2020
(This article belongs to the Special Issue Industrial Engineering and Management: Current Issues and Trends)
Abstract
:The measurement of sewing work in the labor-intensive garment industry depends considerably on the person performing the measurements, making it difficult to quantitatively define the level of skill (LS) of the sewing machine operator and the level of difficulty (LD) of the unit process. In this study, a power monitoring system attached to the sewing machine was used to remotely collect power consumption data, which were then analyzed to extract the working times for a series of sewing tasks. LS of each operator was then classified and LD of each process was analyzed in terms of working time and quality. Finally, the resulting LS and LD weight factors considered to optimize the subject garment production line were compared against those proposed by experts. The LS weight factor proposed by the experts was ~15% less than that indicated by the experimental results, whereas the LD weight factor proposed by the experts was ~15%–40% greater than that indicated by the experimental results. The results of this study suggest that the proposed method could be applied in real time to inform the arrangement of line workers to increase the productivity of a garment production line.
1. Introduction
The global market size of the apparel industry is similar to that of the global automotive market [1], but it is a representative labor-intensive industry in which most apparel manufacturers still rely on a human measurer to count production quantities and measure work time. Additional personnel are required to measure such work status items, not only increasing production cost but also inherently limiting the collection of measurement samples due to the associated cost. As a result, human-conducted manual measurements are prone to error and may not accurately reflect the actual work status [2]. For this reason, most apparel manufacturing facilities rely on the line manager’s empirical judgment without knowing the exact level of skill (LS) of hundreds or thousands of sewing machine operators. Additionally, the level of difficulty (LD) of a sewing task is a commonly applied metric in most garment factories, and is also quantified by the empirical judgment of the design department or line manager.
The LD and LS are the first to be considered when designing garment production lines and determining staffing requirements. However, the outcome of this consideration depends entirely on the judgment of managers with extensive experience. This expert-based decision system creates two important issues [3]. First, it is impossible to make adjustments in the production line without first consulting the expert who designed it. Second, it is difficult to verify that the expert’s judgment is accurate.
In this paper, we accordingly propose a new method to remotely measure, quantify, and visualize the LS and LD of garment sewing work using a power monitoring system to overcome the problem of error-prone human measurement and replace the experience of experts with a numerically based standard. The power monitoring system measures the working time of the sewing machine operator and is used, based on the results of experiments, to quantify the skill level of the operator and the difficulty of the task performed. In addition, the proposed method sets the weight factor criteria that can be applied when adjusting LS and LD to optimize the production line.
The remainder of this paper is arranged as follows. After a review of the relevant research literature, the factors influencing the garment sewing process are described and the power monitoring system applied by the proposed method is introduced. Then, we present the experimental method and LS and LD measured by the power monitoring system and verify the weight factors of the measured LS and LD by comparing them with the weights suggested by experts. Finally, the conclusions of this study and future work are described.
2. Literature Review
The objective of this study is to quantify the skill level of a sewing machine operator and the difficulty of sewing work using a power monitoring system. Research on the power monitoring of sewing machines has been conducted for a long time [4] and has until recently focused on reducing the energy used in the production of a garment [5,6,7]. In addition, the use of a tachogram or stitching monitoring has been studied to extract sewing work information from the operation of a sewing machine [8,9]. However, these methods are limited in application, as they require the modification of the sewing machine or the attachment of additional equipment.
Various attempts have been made to measure the sewing operator’s performance. Seifermann et al. conducted a time study on the operator’s working time and a study based on self-recorded data of the operator [10]. Jadhav et al. and Moktadir et al. measured the operator’s working time using a stopwatch [11,12]. Meanwhile, an attempt to analyze the load of the sewing operation by measuring and analyzing the operating time was also made [13,14]. In addition, digital image analysis or work measurement based on vision technology has been attempted [15,16,17]. Studies have also been conducted on a method of simultaneously analyzing time and motion [18].
A measurement of time called the standard minute value (SMV) is used as a reference time for the required work. The SMV is a numerical value that represents the standard time required for a process or operation in a standard environment for a standard worker [19]. Hanan and Seedahmed studied ways to effectively improve the SMV in the garment manufacturing process [3], and Alam and Hasan studied how to measure the SMV to improve the productivity of sewing lines [20]. Ahmed investigated an approach to improving sewing process reliability through SMV sampling studies [2]. Rajput et al. proposed a method to increase the productivity and efficiency of the garment production process through time studies [21]. Under these approaches, the skill level of the sewing machine operator and the difficulty of work are determined based on the SMV. However, the determination of SMV criteria can be problematic as the number of samples is small, human measurement errors are inevitable, and factors related to product quality are not reflected in the measurement.
Various studies on the performance measurement and monitoring of the sewing process have also been conducted using other methods. Hui et al. predicted sewing performance by applying an artificial intelligence technique to sewing work [22], and Lai and Liu presented a neural network-based model to solve the problems associated with the existing SMV measurement method [23]. Finally, Gu et al. monitored the performance of garment factory workers using a radio frequency identification (RFID) system [24].
Recently, various approaches have also been evaluated to inform the placement of operators in the manufacturing process [25,26]. Laktionov presented expert estimates using fuzzy logic to select machine operators for complex manufacturing processes [27]. Salehi et al. presented a manufacturing line balancing problem that takes into account the skill of the operator in a fuzzy environment [28]. Wang et al. attempted to reduce errors in a manufacturing process by applying ergonomic elements and Bayesian networks [29].
The level of skill of the operator and level of difficulty of the sewing work are important factors to maximize the efficiency by balancing the production line. These factors should be considered simultaneously in terms of time and quality, and can be optimized by achieving the optimal arrangement considering the skill level of the operator and difficulty level of the sewing work according to the quantified criteria. However, most of the studies discussed in this section have been conducted solely in terms of the operator’s working time, and no multi-faceted approach to quantifying the difficulty and quality of sewing work has been conducted to date.
3. Methodology
The main purpose of this study is to remotely measure an operator’s LS and a task’s LD from among the factors affecting the productivity of sewing work. This section summarizes the factors affecting the productivity of garment production lines and describes how LS and LD were remotely measured using a power monitoring system.
3.1. Factors Affecting Performance in Garment Prodiciton Lines
Time and quality, the most important productivity indicators, are closely related to LD and LS (Figure 1). In general, it is recognized that workers with a high LS have a shorter working time and can produce better quality products (Figure 1a). In contrast, tasks with a high LD take more time to complete and the resulting quality is likely to be lower (Figure 1b) [30].
The garment production line basically consists of several sets of sewing machines and their operators, who use them to assemble raw materials into garments (Figure 2).
The performance of the production line (PL), such as its output or total makespan, depends on the number of sewing machines and arrangement of operators (AO) when the material (M) is supplied to the production line. At this time, M can be ignored because it is controlled so as not to affect the operation of the production line by establishing a separate supply plan. Therefore, PL can be considered to be entirely dependent on AO as follows:
The value of AO is a function of the performance of each individual operator (PO). Therefore, PO is an important factor in determining the influence of AO on PL, and is affected by the task’s LD, the operator’s LS, and the condition of their machine (CM). Note that LD and LS should be considered together in terms of time (LDt, LSt) and quality (LDq, LSq). The value of PO is accordingly determined as follows:
In this paper, we propose a method for measuring LS and LD using a power monitoring system. In addition, we discuss a method for establishing a numerical criterion to apply the measured weights of LS and LD to AO in order to ultimately improve PL.
3.2. Romote Sensing for Sewing Work Using a Power Monitoring System
A power monitoring system (PMS) was used in the proposed method to provide remote sensing of sewing operations. The PMS applied in this study, as shown in Figure 3, was used to connect a wireless communications network to the sewing machine’s power plug in order to collect and analyze power consumption data at low cost without requiring any additional equipment modification [31]. Power monitoring devices included current sensors and Wi-Fi communication modules. The system was applied to 20 garment production lines employing approximately 50 operators, which confirmed that valid data were collected and analyzed. The power consumption was verified through the operation of approximately 1000 power monitoring devices, and the accuracy and stability of the current sensor were verified while the supply of stable voltage was confirmed. The collected power consumption data was transmitted to a cloud server to extract time information describing the unit process of the sewing machine operator using a pattern analysis algorithm.
Several pattern analysis algorithms have been researched for such applications based on data mining or deep learning algorithm approaches. In this study, the symbolic aggregate approximation (SAX) and the dynamic time warping (DTW) approaches were used to analyze the work patterns in the power consumption data and extract the working time of the unit process [32,33]. In the application of the pattern analysis algorithm performed in this study, the hardware parameters were applied equally to all tasks, and the parameters of the algorithm analyzing the pattern of each sewing task were supplemented by adjusting the DTW sensitivity of the algorithm. The power pattern analysis algorithm applied in this study measures the quantity and time of work based on the power profile generated in completing one task, including sewing and non-sewing. For information on extracting the working time of sewing work using a PMS, refer to Jung et al. [31].
The operator’s working time information extracted through pattern analysis was linked to the operator name, process name, and theoretical or existing work time information contained in the manufacturing execution system (MES). Using this matched information matrix, a baseline for each operator or task was created based on the theoretical work time or previous work time. The generated level scale was then corrected to reflect the real-time measurements of work time and defect rate, thereby calculating the scales for LS and LD.
3.3. Experiments
Experiments measuring LS and LD were performed on a sample production line at a garment manufacturing factory in Indonesia. According to the judgment of expert line managers, fifteen sewing machine operators were selected with three operators in each skill level from LS1 to LS5. In addition, the sewing line design experts recommended five tasks for each difficulty level from LD1 to LD5, representing the different levels of difficulty in sewing a single type of hooded jacket, excluding the final assembly work. The test operators were selected by considering the manager’s empirical observations based on the working period, and the production tasks were selected by the production department after considering the detailed work procedures. However, the details considered in selecting the targets are closely related to the company’s sensitive business information; therefore, they are not recorded in detail in this study. In addition, the experimental results may be distorted if the operators recognize that their performance is being measured. The power monitoring system proposed in this study is always connected to the sewing machine so that operators do not recognize when their performance is being measured. Therefore, a more reliable experiment is possible than the manual measurement method. Table 1 shows the experimental targets selected for LS and LD measurements.
Before the experiment, the experts who selected the experimental targets provided their opinions regarding appropriate weights for LS and LD. These weight factors are used to account for the relative difference between skill/difficulty levels. For example, assuming a reference value of 3 as being in the middle of levels 1 to 5, the weight factor would be defined as “1”. The LS and LD weight factors can then be applied when calculating the performance of the operator (PO) to derive a more realistic level of production. Although they rely on empirical knowledge and thus use no clear, quantifiable criteria for time and quality, the weights for each level were assumed by the experts as shown in Figure 4.
The experiment was conducted over two days. On the first day, the PMS was used to measure the performance of three tasks by three operators at each skill level (LS1 to LS5) at every level of difficulty (LD1 to LD5). After the measurements, the quality of each work result was evaluated according to three grades: A, B, or C, where A is a work product completely free of defects, B is a work product that can be vaguely judged to be defective but only partially lacking in quality, and C is an unsuccessful work product. On the second day, three additional measurements were performed for each operator at every level of difficulty using the PMS following the same procedure as on the first day. As a result, a total of 30 jobs were measured for each operator at LD1 to LD5, and the time and quality of a total of 450 jobs performed by 15 operators were measured.
4. Results and Discussion
In this section, the reliability of expert decisions regarding the LS, the relationship of time and quality to LS and LD, and the weight factors that can be applied to inform operator relocation when optimizing production lines are numerically confirmed based on the results of the experiments.
4.1. Reliability Assessment of Expert Decision for LS
Figure 5 shows the results of normalizing the remote sensing results for LS. No LS1 operators were observed in terms of time and quality, somewhat different from the expert judgment. In addition, comparing the expert decisions with the test results for LS1–LS5 indicates that the operator LS was only correctly identified by the experts 26.7% of the time for any work time or quality. This confirms that expert judgments are subjective and may not accurately reflect the actual skill level of an operator.
The experimental results show that an operator’s LS can be accurately measured by considering the working time (as measured by the PMS) and quality of the workpiece. In addition, the results of the experiments show how the working time and quality of each operator compared to the general levels, helping to identify the strengths of individual operators. Operators OP3, OP7, OP9, OP10, and OP12, located below and to the left of the diagonal midline in Figure 5, can be seen to have relatively fast work times compared to quality at each skill level, whereas the remainder of the operators can be seen to provide higher relative quality than faster work time. These operator characteristics can be an important consideration when designing an optimal production line.
4.2. Relationship of LS and LD to Time and Quality
As per the relationships between LS and LD and work time and quality shown in Figure 1, it is assumed that the higher the LS, the shorter the working time and the higher the quality, and the higher the LD, the longer the working time and the lower the quality. The validity of these assumptions is evaluated in this section.
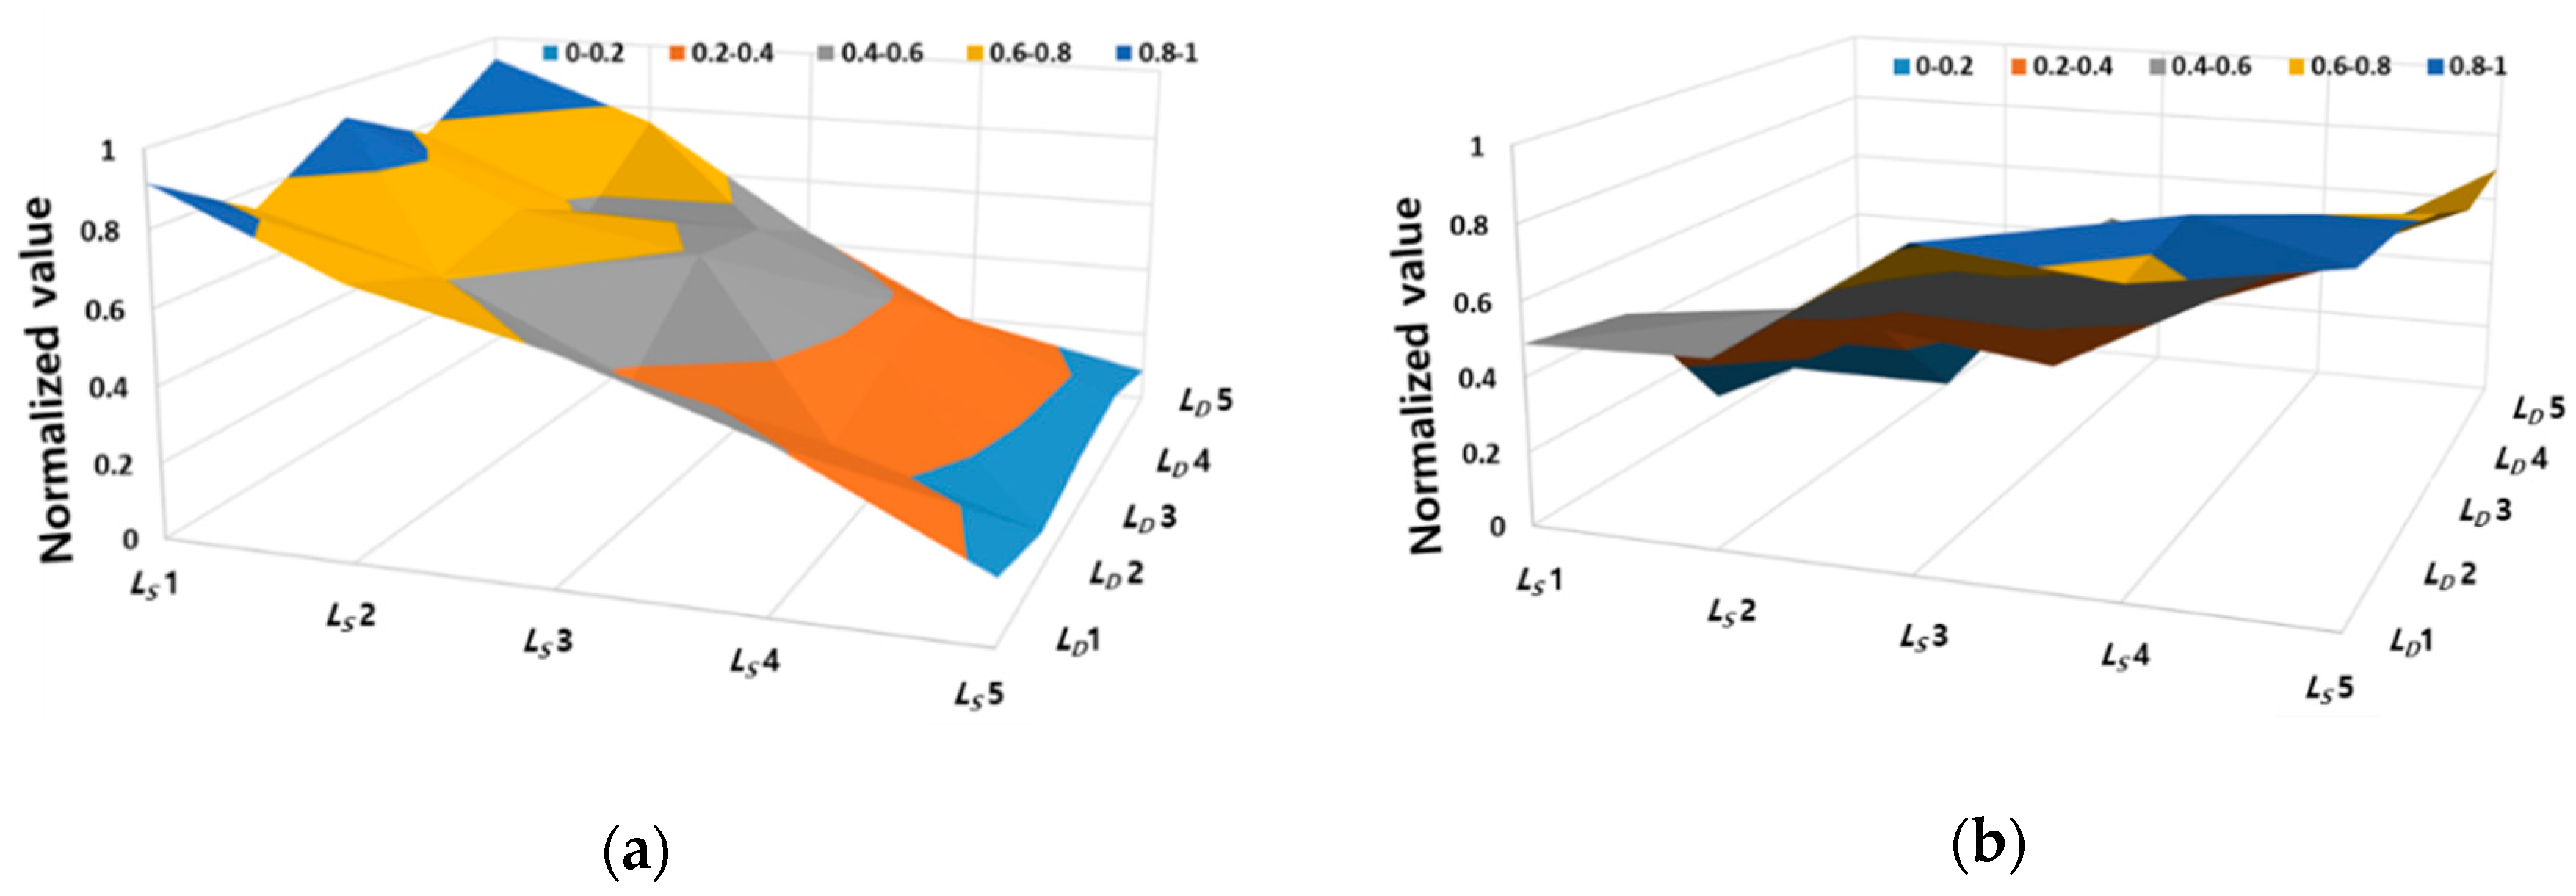
Figure 6 shows the LS and LD test results in relation to working time and quality. In the case of LS (Figure 6a), as indicated in Figure 1, the higher the operator’s skill level, the shorter the working time (LS-T) and the higher the quality (LS-Q). However, in the case of LD (Figure 6b), the higher the difficulty, the lower the quality (LD-Q), but the working time (LD-T) does not increase. This suggests that the difficulty of a task should be understood in terms of the technical aspect of performing the task without defects rather than the working time required to complete the task.
Figure 7 shows the correlation between LS and LD in terms of working time (Figure 7a) and quality (Figure 7b). As shown in Figure 7a, as LS increases, the working time decreases, but as LD increases there is only a slight change in working time. Figure 7b shows the relationship between LS and LD and quality: as LS increases, the quality increases, but as LD increases, the quality decreases.
4.3. Determining the Weight Factors of LS and LD
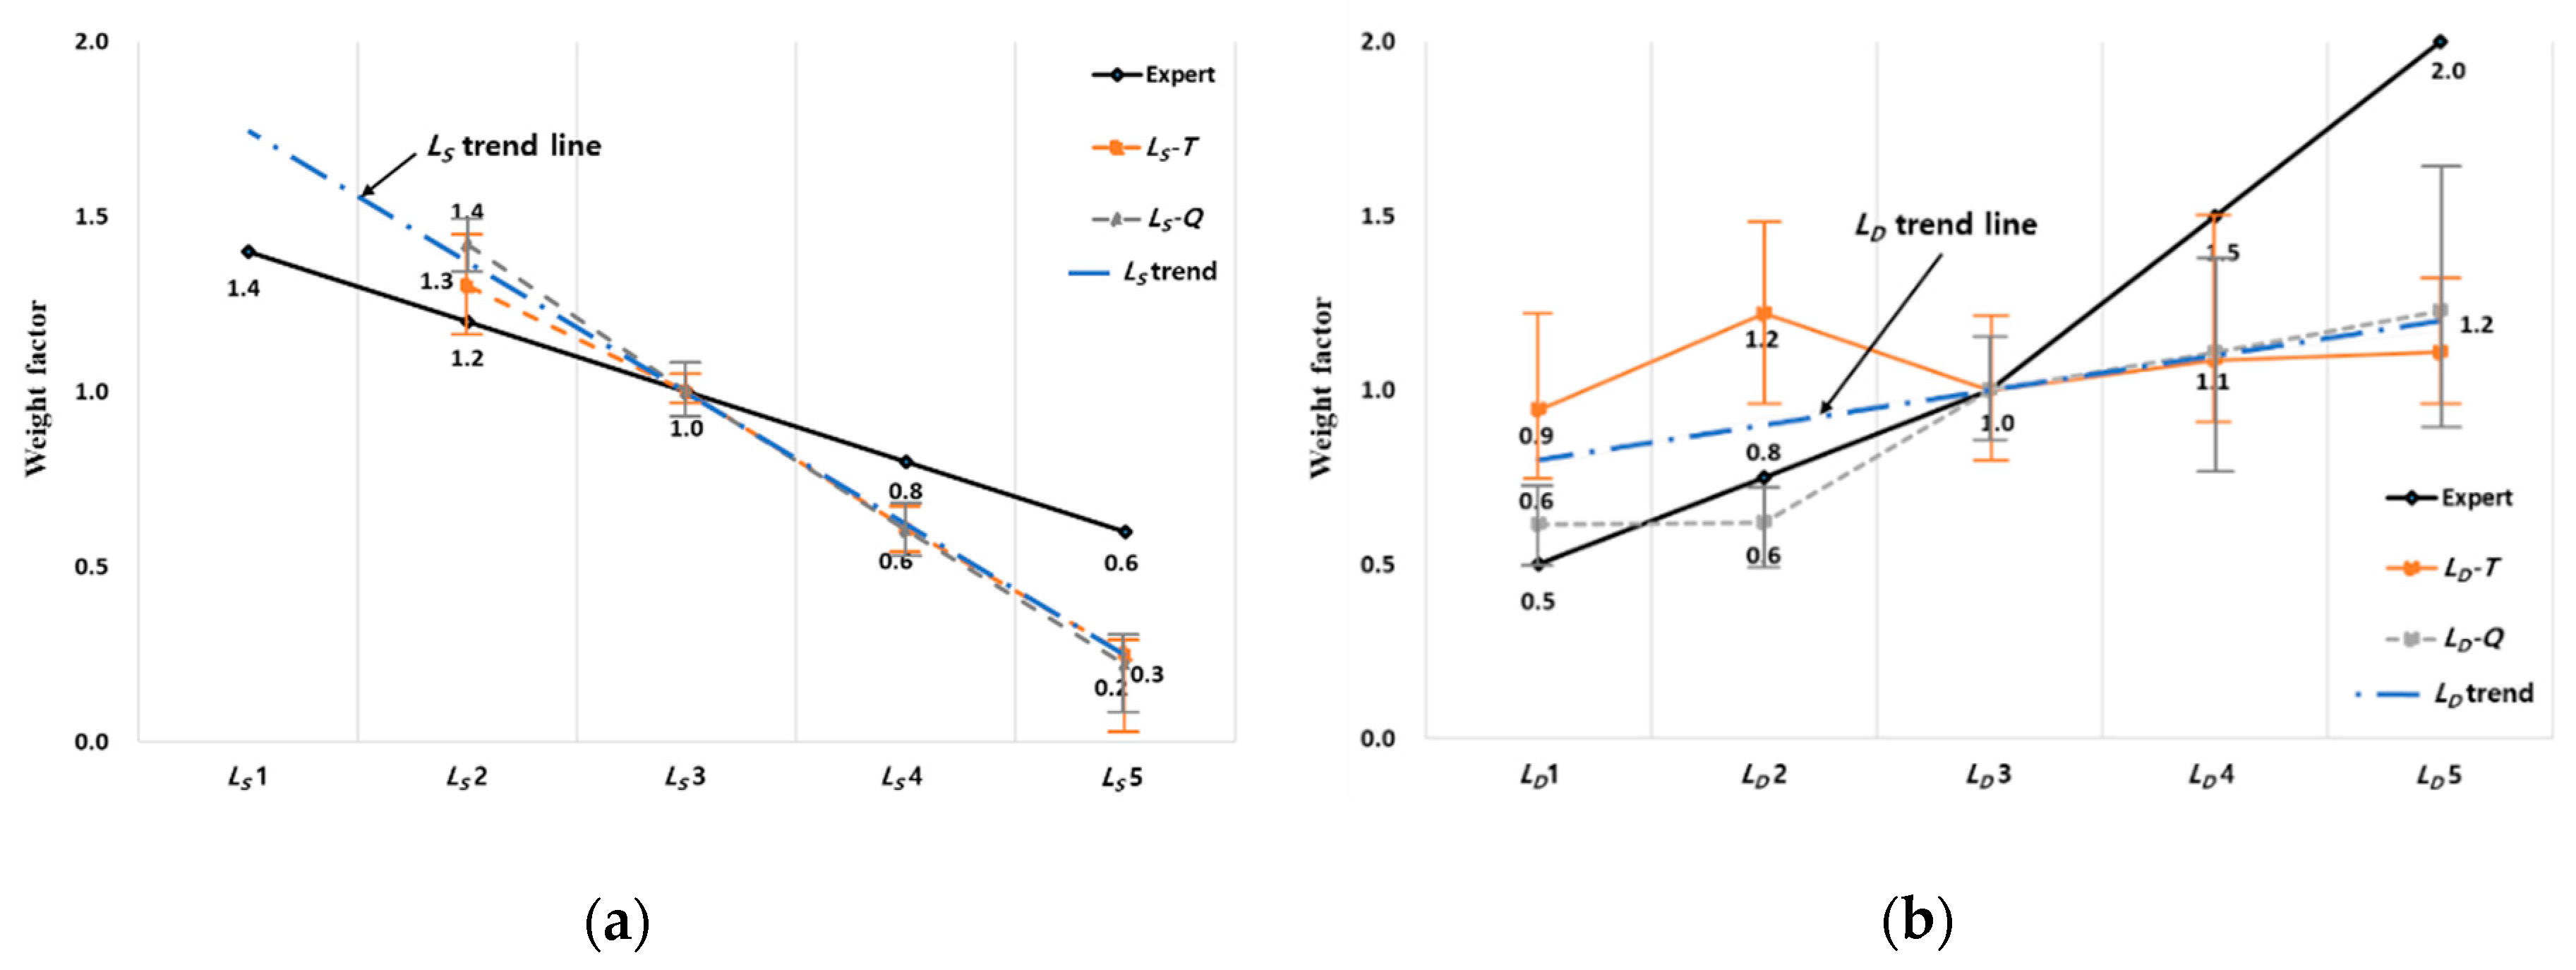
The weight factors of the different LS and LD levels are presented in Figure 4 based on expert opinion. This section compares the weights suggested by the experts with those derived from the experiments (Table 2).
Figure 8a compares the LS weight factors suggested by the experts with those calculated from the experiment. When the experts judged the intermediate LS3 to be 1, they suggested a difference of 0.2 for each level, but the experimental results indicate that this difference is closer to 0.35. It can therefore be stated that the LS values for the operators in each level were greater than those estimated by the experts. Considering the differences between the levels, the experts’ judgment appears to be about 15% lower than the experimental results. Figure 8b compares the LD weight factors suggested by the experts with the experimental results. As in the case of LS, when the intermediate LS3 was considered to be 1, the expert suggested a level difference of 0.25 and 0.5, but the experimental results indicated a level difference of 0.1. In contrast to LS, in the case of LD, each task was found be less difficult than estimated by the expert: the LD results show that expert judgment of difficulty was about 15% to 40% higher than that indicated by the experimental results.
The results in Figure 8 are examples of the use of PMS measurements to provide a quantitative evaluation of otherwise subjective expert decisions. Results in this form can be applied to determine operator arrangement for process optimization.
5. Conclusions and Future Works
In this study, a new method of remotely measuring sewing work using a power monitoring system was presented. The results of experiments using the proposed remote sensing method made it possible to derive each operator’s LS and the LD of each work task according to the measured work time and observed quality. The results indicate considerable differences between the expert-assigned and numerically determined levels: The weight factor for LS proposed by the experts was about 15% lower than that indicated by the experimental results, and the weight for LD proposed by the experts was about 15% to 40% higher than that indicated by the experimental results.
Although the experiment performed in this study was conducted over two days, the results of 30 tasks of 5 difficulty levels, performed by each operator, were analyzed. In addition, it can be determined that the power monitoring system can produce reliable results through data analysis of approximately 1000 sewing machines. Note, however, that the weight factors presented as the results of this experiment are those determined under specific conditions, and therefore, may not be applicable to all situations. Nevertheless, if we continue to increase the number of samples collected under the same conditions, the weight factors of LS and LD will continue to change and eventually converge to the appropriate values. While there is a limit to the number of samples that can be effectively collected by manual measurements, the method proposed in this study allows for the collection of a large number of measurements while the operators perform their work without knowing they are being measured. Thus, the proposed method can continuously obtain more accurate information simply by increasing the number of LS and LD samples collected. The results of this study suggest a new method that overcomes the limitations of the existing method, which was simply representative of the operating time by measuring an operator’s specific operating time with a low sample. When this system is applied, the operator’s performance is accumulated as big data as the work progresses, enabling more accurate analysis. This not only overcomes the limitations of manual measurement, but also allows accurate LS and LD measurements to be secured in the database. In addition, the database thus created can be applied to not only accurately predict the production cost and time for orders, but also to directly improve production.
As previously discussed, the results of this study can be applied to the optimization of garment production lines. By considering the quantified LS and LD when placing operators on the garment production line, it is possible to construct an optimized production line, which ensures maximum production. Studies on optimizing production lines can be examined to relocate operators or reorder tasks, and the results of this study can provide a more effective and accurate alternative to weighting in this process. In future research, if the proposed sewing work remote sensing method is applied to an actual production line using a power monitoring system, the LS and LD can be calibrated in real time to inform the arrangement of sewing line workers, helping to increase the productivity of the garment production line.
Author Contributions
Conceptualization, W.-K.J. and E.S.S.; methodology, W.-K.J. and E.S.S.; software, W.-K.J.; validation, E.S.S. and Y.-C.P.; formal analysis, W.-K.J.; resources, J.-W.L.; data curation, W.-K.J.; writing—original draft preparation, W.-K.J.; writing—review and editing, E.S.S.; visualization, W.-K.J.; supervision, E.S.S.; project administration, E.S.S.; funding acquisition, Y.-C.P. All authors have read and agreed to the published version of the manuscript.
Funding
This research was funded by SNU-Hojeon Garment Smart Factory Research Centre funded by the Hojeon Ltd. under Grant [number 0423-20190068].
Conflicts of Interest
The authors declare no conflict of interest.
References
- O´Connell, L. Global Apparel Market-Statistics & Facts. Available online: https://www.statista.com/topics/5091/apparel-market-worldwide/ (accessed on 21 January 2020).
- Ahmed, F. Identifying Wastages and Calculating SMV through Work Sampling Study in Sewing Section. Int. J. Eng. Comput. Sci. 2017, 6, 23102–23106. [Google Scholar] [CrossRef]
- Hanan, O.A.; Seedahmed, A.I. Effective Way to Estimate the Standard Minute Value (SMV) of A U3 Shirt by using Time Study Technique. Int. J. Eng. Sci. Res. Technol. 2018, 7, 179–184. [Google Scholar]
- Rogale, D.; Petrunić, I.; Dragčević, Z.; Firšt Rogale, S. Equipment and methods used to investigate energy processing parameters of sewing technology operations. Int. J. Clo. Sci. Technol. 2005, 17, 179–187. [Google Scholar] [CrossRef]
- Muthukumarana, T.T.; Karunathilake, H.P.; Punchihewa, H.K.G.; Manthilake, M.M.I.D.; Hewage, K.N. Life cycle environmental impacts of the apparel industry in Sri Lanka: Analysis of the energy sources. J. Clean. Prod. 2018, 172, 1346–1357. [Google Scholar] [CrossRef]
- Çay, A. Energy consumption and energy saving potential in clothing industry. Energy 2018, 159, 74–85. [Google Scholar] [CrossRef]
- Habib, M.A.; Hasanuzzaman, M.; Hosenuzzaman, M.; Salman, A.; Mehadi, M.R. Energy consumption, energy saving and emission reduction of a garment industrial building in Bangladesh. Energy 2016, 112, 91–100. [Google Scholar] [CrossRef]
- Lee, J.Y.; Lee, D.H.; Park, J.H.; Park, J.H. Study on Sensing and Monitoring of Sewing Machine for Textile Stream Smart Manufacturing Innovation. In Proceedings of the 24th International Conference on Mechatronics and Machine Vision in Practice, Auckland, New Zealand, 21–23 November 2017. [Google Scholar]
- Rybicki, M. Modelling of a Tachogram of Machine Sewing Process. Fibres Text. Eastern Eur. 2011, 19, 48–54. [Google Scholar]
- Seifermann, S.; Böllhoff, J.; Metternich, J.; Bellaghnach, A. Evaluation of Work Measurement Concepts for a Cellular Manufacturing Reference Line to Enable Low Cost Automation for Lean Machining. Procedia CIRP 2014, 17, 588–593. [Google Scholar] [CrossRef] [Green Version]
- Jadhav, S.S.; Sharma, G.S.; Daberao, A.M.; Gulhane, S.S. Improving Productivity of Garment Industry with Time Study. Int. J. Text Eng. Procs. 2017, 3, 1–6. [Google Scholar]
- Moktadir, M.A.; Ahmed, S.; Tuj Zohra, F.; Sultana, R. Productivity Improvement by Work Study Technique: A Case on Leather Products Industry of Bangladesh. Ind. Eng. Manag. 2017, 6. [Google Scholar] [CrossRef]
- Ahmed, M.; Chowdhury, M.S.I. Increase the Efficiency and Productivity of Sewing Section through Low Performing Operators Improvement by using Eight Wastes of Lean Methodology. Glob. J. Res. Eng. 2018, 18, 43–60. [Google Scholar]
- Iqbal, M.; Ali, M.; Haque, R.; Moin, C.J. Performance Variation with time of Apparel Sewing Workers: A Case Study. Eur. Sci. J. 2018, 14, 485–498. [Google Scholar] [CrossRef]
- Sim, E.-S.; Lee, H.-G.; Lee, J.-C.; Park, J.W. Efficient work measurement system of manufacturing cells using speech recognition and digital image processing technology. Int. J. Adv. Manuf. Tech. 2005, 29, 772–785. [Google Scholar] [CrossRef]
- Elnekave, M.; Gilad, I. Rapid video-based analysis system for advanced work measurement. Int. J. Prod. Res. 2006, 44, 271–290. [Google Scholar] [CrossRef]
- Bauters, K.; Cottyn, J.; Claeys, D.; Slembrouck, M.; Veelaert, P.; Van Landeghem, H. Automated work cycle classification and performance measurement for manual work stations. Robot CIM-INT Manuf. 2018, 51, 139–157. [Google Scholar] [CrossRef]
- Burke, T.A.; McKee, J.R.; Wilson, H.C.; Donahue, R.M.J.; Batenhorst, A.S.; Pathak, D.S. A Comparison of Time-and-Motion and Self-Reporting Methods of Work Measurement. J. Nurs. Admin. 2000, 30, 118–125. [Google Scholar] [CrossRef]
- Bandara, B.E.S.; De Silva, D.A.M.; Fernando, G. Role of Standard Minute Value in Export Processing: Will It Make Difference to the Firm Economic Performance? In Proceedings of the International Research Symposium on Engineering Advancements 2015 (RSEA 2015), SAITM, Malabe, Sri Lanka, 25 June 2015; pp. 319–329. [Google Scholar]
- Alam, F.B.; Hasan, M.M. Analysis on SMV to Increase Productivity in Sewing Section: A Case Study on T-Shirt Manufacturing in Bangladesh. Int. J. Res. Eng. Sci. 2018, 6, 18–24. [Google Scholar]
- Rajput, D.; Kakde, M.; Chandurkar, P.; Raichurkar, P.P. Enhancing Efficiency and Productivity of Garment Industry by Using Different Techniques. Int. J. Text Eng. Process. 2018, 4, 5–8. [Google Scholar]
- Hui, P.C.L.; Chan, K.C.C.; Yeung, K.W.; Frency, S.F.N. Application of artificial neural networks to the prediction of sewing performance of fabrics. Int. J. Clo. Sci. Technol. 2007, 19, 291–318. [Google Scholar] [CrossRef]
- Lai, L.K.C.; Liu, J.N.K. A Neural Network and CBR-Based Model for Sewing Minute Value. In Proceedings of the International Joint Conference on Neural Networks 2009, Atlanta, GA, USA, 14–19 June 2009. [Google Scholar]
- Gu, C.; Zhou, R.; Hu, L.; Gao, G. A method of garment factory workers’ performance monitoring using control chart based on RFID system. Int. J. Adv. Manuf. Technol. 2019. [Google Scholar] [CrossRef]
- Elnaggar, G. Effect of Operator Skill Level on Assembly Line Balancing in Apparel Manufacturing: A Multi-Objective Simulation Optimization Approach. In Proceedings of the International Conference on Industrial Engineering and Operations Management 2019, Riyadh, Saudi Arabia, 26–28 November 2019. [Google Scholar]
- Nabi, F.; Mahmud, R.; Islam, M.M. Improving Sewing Section Efficiency through Utilization of Worker Capacity by Time Study Technique. Int. J. Text Sci. 2015, 4, 1–8. [Google Scholar]
- Laktionov, A. Application of index estimates for improving accuracy during selection of machine operators. East. Eur. J. Enterp. Technol. 2019, 3, 18–26. [Google Scholar] [CrossRef]
- Salehi, M.; Maleki, H.R.; Niroomand, S. A multi-objective assembly line balancing problem with worker’s skill and qualification considerations in fuzzy environment. Appl. Intell. 2018, 48, 2137–2156. [Google Scholar] [CrossRef]
- Wang, Y.; Ding, Y.; Chen, G.; Jin, S. Human reliability analysis and optimization of manufacturing systems through Bayesian networks and human factors experiments: A case study in a flexible intermediate bulk container manufacturing plant. Int. J. Ind. Ergon. 2019, 72, 241–251. [Google Scholar] [CrossRef]
- Chen, K.S.; Huang, M.L. Performance measurement for a manufacturing system based on quality, cost and time. Int. J. Prod. Res. 2006, 44, 2221–2243. [Google Scholar] [CrossRef]
- Jung, W.K.; Kim, H.; Park, Y.C.; Lee, J.W.; Ahn, S.H. Smart sewing work measurement system using IoT-based power monitoring device and approximation algorithm. Int. J. Prod. Res. 2019. [Google Scholar] [CrossRef]
- Lin, J.; Keogh, E.; Lonardi, S.; Chiu, B. A symbolic representation of time Series, with Implications for Streaming Algorithms. In Proceedings of the DMKD’ 2003, San Diego, CA, USA, 3 June 2003. [Google Scholar]
- Eamonn, K.; Chotirat, A.R. Exact indexing of dynamic time warping. Knowl. Inf. Syst. 2005, 7, 358–386. [Google Scholar]
Figure 1.
Relationship between working time/quality and; (a) level of skill (LS); (b) level of difficulty (LD).
Figure 1.
Relationship between working time/quality and; (a) level of skill (LS); (b) level of difficulty (LD).

Figure 2.
Factors affecting performance in garment production lines.

Figure 3.
Power monitoring system for remote sensing of sewing work. MES: Manufacturing execution system.
Figure 3.
Power monitoring system for remote sensing of sewing work. MES: Manufacturing execution system.

Figure 4.
LS and LD weight factors according to experts.

Figure 5.
LS measurement results of individual operators.

Figure 6.
Relationships between LS and LD and working time and quality: (a) Relationship between working time (LS-T) and work quality (LS-Q) according to LS level; (b) relationship between working time (LD-T) and work quality (LD-Q) according to LD level.
Figure 6.
Relationships between LS and LD and working time and quality: (a) Relationship between working time (LS-T) and work quality (LS-Q) according to LS level; (b) relationship between working time (LD-T) and work quality (LD-Q) according to LD level.

Figure 7.
Correlation of LS and LD with working time and quality: (a) Relationship of LS and LD to working time; (b) relationship of LS and LD quality.
Figure 7.
Correlation of LS and LD with working time and quality: (a) Relationship of LS and LD to working time; (b) relationship of LS and LD quality.

Figure 8.
Weight factor trends: (a) LS weight factor trend from the test results; (b) LD weight factor trend from the test results.
Figure 8.
Weight factor trends: (a) LS weight factor trend from the test results; (b) LD weight factor trend from the test results.


Table 1.
Experimental operators and selected tasks.
| Operator No. | Skill Level | Process No. | Difficulty Level | Task Figure | Estimated Task Time (Sec) |
|---|---|---|---|---|---|
| 1 | LS1 | 1 | LD1 |  | 19 |
| 2 | |||||
| 3 | |||||
| 4 | LS2 | 2 | LD2 |  | 14 |
| 5 | |||||
| 6 | |||||
| 7 | LS3 | 3 | LD3 |  | 115 |
| 8 | |||||
| 9 | |||||
| 10 | LS4 | 4 | LD4 |  | 115 |
| 11 | |||||
| 12 | |||||
| 13 | LS5 | 5 | LD5 |  | 94 |
| 14 | |||||
| 15 |
Table 2.
Comparison of LS and LD weight factors proposed by the experts with those determined from the test results.
Table 2.
Comparison of LS and LD weight factors proposed by the experts with those determined from the test results.
| Level | 1 | 2 | 3 | 4 | 5 | Difference between Levels | |
|---|---|---|---|---|---|---|---|
| LS | Expert-proposed | 1.40 | 1.20 | 1.00 | 0.80 | 0.60 | 0.20 |
| Test-determined | 1.70 | 1.35 | 1.00 | 0.65 | 0.30 | 0.35 | |
| Difference | 0.30 | 0.15 | - | 0.15 | 0.30 | - | |
| LD | Expert-proposed | 0.50 | 0.75 | 1.00 | 1.50 | 2.00 | 0.25/0.50 |
| Test-determined | 0.80 | 0.90 | 1.00 | 1.10 | 1.20 | 0.10 | |
| Difference | 0.30 | 0.15 | - | 0.40 | 0.80 | - | |
© 2020 by the authors. Licensee MDPI, Basel, Switzerland. This article is an open access article distributed under the terms and conditions of the Creative Commons Attribution (CC BY) license (http://creativecommons.org/licenses/by/4.0/).
Share and Cite
MDPI and ACS Style
Jung, W.-K.; Park, Y.-C.; Lee, J.-W.; Suh, E.S. Remote Sensing of Sewing Work Levels Using a Power Monitoring System. Appl. Sci. 2020, 10, 3104. https://doi.org/10.3390/app10093104
AMA Style
Jung W-K, Park Y-C, Lee J-W, Suh ES. Remote Sensing of Sewing Work Levels Using a Power Monitoring System. Applied Sciences. 2020; 10(9):3104. https://doi.org/10.3390/app10093104
Chicago/Turabian StyleJung, Woo-Kyun, Yong-Chul Park, Jae-Won Lee, and Eun Suk Suh. 2020. "Remote Sensing of Sewing Work Levels Using a Power Monitoring System" Applied Sciences 10, no. 9: 3104. https://doi.org/10.3390/app10093104
Note that from the first issue of 2016, this journal uses article numbers instead of page numbers. See further details here.