Electronic Emulator of Biological Tissue as an Electrical Load during Electroporation


Faculty of Electrical Engineering, University of Ljubljana, Tržaska 25, SI-1000 Ljubljana, Slovenia
*
Author to whom correspondence should be addressed.
Appl. Sci. 2020, 10(9), 3103; https://doi.org/10.3390/app10093103
Submission received: 17 March 2020
/
Revised: 22 April 2020
/
Accepted: 23 April 2020
/
Published: 29 April 2020
(This article belongs to the Special Issue Electroporation Systems and Applications)
Abstract
:Featured Application
Development of a analog electronic circuit that emulates biological tissue during high voltage pulse delivery and/or electroporation. A case study and a proof of concept with potential for development of an electroporator tester.
Abstract
Electroporation is an emerging technology, with great potential in many different medical and biotechnological applications, food engineering and biomass processing. Large variations of biological load characteristics, however, represent a great challenge in electroporator design, which results in different solutions. Because a clinical electroporator is a medical device, it must comply with medical device regulative and standards. However, none of the existing standards directly address the operation or electroporator’s performance requirements. In order to evaluate clinical, laboratory and prototype electroporation devices during the development process, or to evaluate their final performance considering at least from the perspective of output pulse parameters, we present a case study on the design of an electronic emulator of biological tissue as an electrical load during electroporation. The proposed electronic load emulator is a proof of concept, which enables constant and sustainable testing and unbiased comparison of different electroporators’ operations. We developed an analog electrical circuit that has equivalent impedance to the beef liver tissue in combination with needle electrodes, during high voltage pulse delivery and/or electroporation. Current and voltage measurements during electroporation of beef liver tissue ex vivo, were analyzed and parametrized to define the analog circuit equation. An equivalent circuit was simulated, built and validated. The proposed concept of an electronic load emulator can be used for “classical” electroporator (i.e., not nanosecond) performance evaluation and comparison of their operation. Additionally, it facilitates standard implementation regarding the testing protocol and enables quality assurance.
1. Introduction
Electroporation is an emerging platform technology, with great potential [1,2,3]. One of the most successful electroporation-based applications in medicine is an anti-tumor therapy, called electrochemotherapy (ECT). Through the permeabilized cell membrane transport of chemotherapeutic drug, bleomycin or cisplatin is increased and considerably higher cytotoxicity is reached [4,5,6,7]. According to Standard Operating Procedure for ECT [8,9] in clinical practice, mainly eight square wave pulses often reported as amplitude to distance ratio in range from 1000 to 1500 V/cm, 100 s pulse duration each and repetition frequency of 1 Hz or 5 kHz are applied to the tissue. A medical device that enables electroporation is called an electroporator; it is a high voltage pulse generator that generates high voltage pulses of a specific duration, pulse repetition frequency and shape [10,11]. From the point of view of an electroporator, the load is a tissue defined by the electrodes [12].
Electric properties of biological tissue vary considerably, tissue has an inhomogeneous composition [13,14,15] and different electrode type/geometry (different distances between the electrodes) are used. In addition due to electroporation [16,17,18] tissue conductivity changes during pulse delivery, which results in a non-linear current response [16,19,20,21]. However the pre-set train of pulses should be generated and delivered to the load, for successful electroporation. This present a great challenge in electroporator design which results in different solutions. Operation errors mainly occur with low resistant loads, or when the pulse repetition rate is in the higher half of the device’s operation range. Namely some pulse generators cannot deliver sufficiently high currents or energies on the output [11]. Electroporators are however not only pulse generators, but they also have built-in protection systems for current and energy limitation and systems for ensuring the effectiveness of the therapy (for protection of patients, operators, and electronics), the operation at boundary condition of safe operation area may deviate from the expectations. Implementation of protection systems is not necessarily always straight forward, because even at normal operation, high displacement current spikes occur at the beginning of the pulse (due to capacitive nature of biological tissue as the load) and ringing is sometimes present at pulse switching.
For more than a decade our group is evaluating electroporation devices [11,22,23] and currently, a rise in electroporation device providers, can be detected on the market. Unfortunately the transitions between devices from different manufacturers, or comparison of results obtained by different researchers using different electroporators, is becoming more and more difficult or even impossible, due to the pre-programmed electroporation procedures. The researchers do not even know and therefore also do not report basic pulse parameters (e.g., pulse shape, repetition rate, and voltage amplitude [24,25]).
The most stressful conditions for an electroporator are short-circuit or discharge between electrodes during the pulse delivery, which can be tested with short-circuiting or very closely placed electrodes. However until now, for the evaluation of an electroporator performance within the safe operation area mainly a resistor or more advanced, a resistor with a capacitance in parallel were used. But those evaluations are considered over-simplified, especially for electroporators operating near their current and energy limits, and for electroporators with over-current protection circuit. Some of the clinically approved electroporators significantly drop the voltage during the delivery of a pulse train due to increased demand for current and energy. And some electroporators even stop delivering electroporation pulses during the delivery of a pulse train, i.e., in the middle of the treatment to protect the device against over-currents. This is especially problematic in clinical treatments where in such a case the patient receives only part of the treatment. Simpler load models as resistive capacitive model cannot simulate increased demand for current and energy, and activation of protection against over-currents during the delivery of a train of pulses. Since in the case of ECT a typical load is tissue, real tissue or its model should be used [26]. Currently, however, there are no available models on the market, which incorporates inhomogeneous characteristics of tissue or are too expensive, or for single-use and are thus inadequate, therefore some researchers rather use for example, a potato [27,28]. This might be a better solution than a resistor, because at least a conductivity increase (due to electroporation) and heating are present. Only a load that raises the current from pulse to pulse represent real-life situation. We think that many problems concerning electroporation devices have evolved due to the lack of standards and evaluation protocols. These are the reasons why some times therapy may not be successful and why we think that an electronic emulator is needed to thoroughly test electroporation devices before usage.
In the scope of this paper we present an idea of an analog electrical circuit that emulates biological tissue, specifically beef liver tissue in combination with needle electrodes, undergoing high voltage pulse delivery and/or electroporation. Current and voltage measurements during electroporation of liver tissue ex vivo, were analyzed and parameterized in a way to fit the proposed analog circuit equation. An equivalent circuit was then simulated, built and validated as a proof of concept. The developed equivalent electronic emulator can be used for electroporators performance evaluation and comparison of the operation between different electroporators, or of an electroporator over its lifetime. The developed device emulates small volume beef liver tissue in combination with needle electrodes. The proposed process/concept can be however applied to any electroporation measurements and specific emulators can be developed.
2. Methods and Materials
For the development of an electronic emulation circuit, high-quality measurements of current and voltage, during pulse application to the biological tissue are needed. We used ex vivo measurements on beef liver tissue, for which accurate and high sample rate ex vivo measurements were available [19]. Langus et al. [19] introduced time-dependent effects into a finite element model developed specifically for electroporation, which was able to predict the time evolution of electric current, within a 5% error. Briefly ex vivo measurements on beef liver samples, were obtained, nine different sequences of electric pulses were delivered to the tissue, by commercially available needle electrodes (IGEA, Carpi, Italy) with a 10 mm of active part, a diameter of 1.2 mm and the distance between the centers of the electrodes being 10 mm. Applied voltage (with electroporator: i.e., ELECTRO cell S20, -teh, Leroy, France) and current were monitored with an oscilloscope (WavePro 7300 A, LeCroy, Milpitas, CA, USA), by a current probe (AP015, LeCroy, USA) and a high-voltage differential voltage probe (ADP305, LeCroy, USA) and used for the development of the model. Current and voltage measurements of eight pulses in a sequence, 1000 V, 750 V, or 500 V voltage amplitude with a pulse duration of 100 s, two different repetition frequencies 1 Hz and 4717 Hz, were re-processed and analyzed in order to model and emulate electroporation load with an analog electric circuit. Measurement data were imported into Matlab R2018b (MathWorks, Natick, MA, USA) computing environment, where values of optimal circuit elements were calculated and then the circuit was simulated in PSpice AD Lite (OrCAD, Cadence, CA, USA). When pulsed electric fields (PEF) are applied to a biological tissue, current response has a typical time course which consists of a fast, high capacitive current, followed by a slight amplitude rise due to tissue electroporation, or more or less square wave pulse, if tissue was not yet electroporated [17,29,30] (Figure 1a).
2.1. Mathematical Model
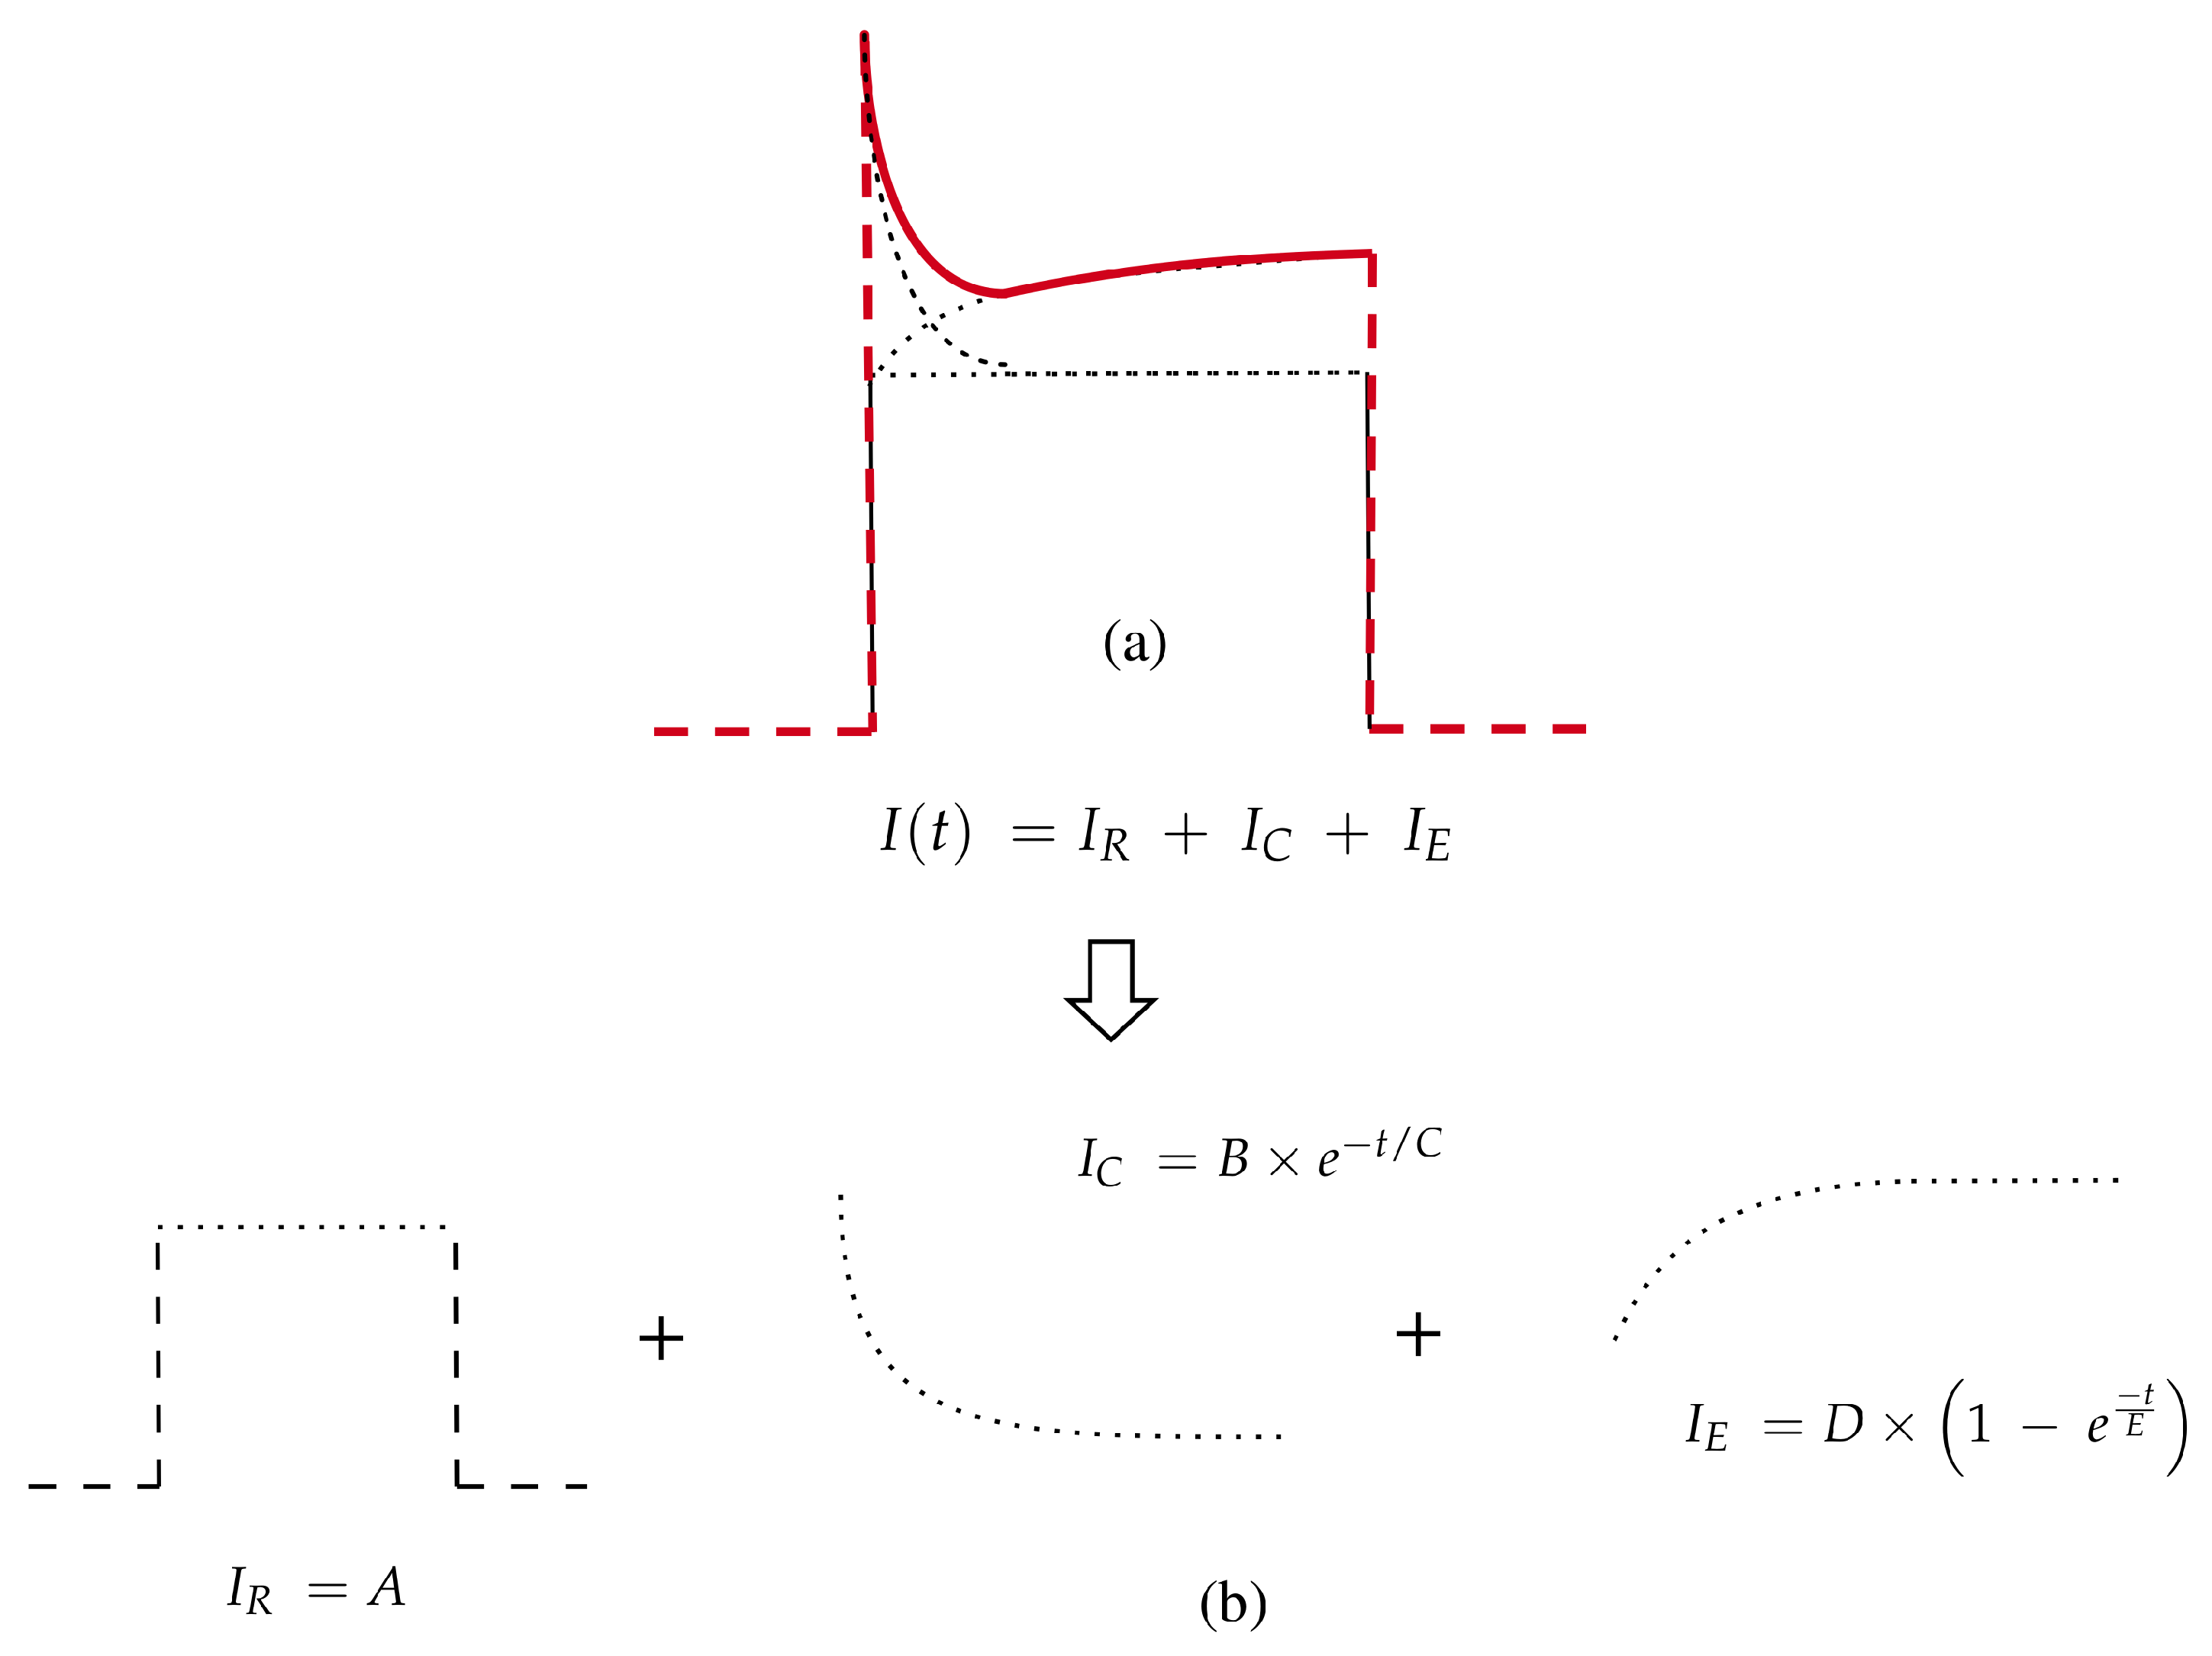
A typical current time course, during PEF application to tissue, is shown in the figure (Figure 1a), where dynamics associated with pulse rise and fall time have not been included (indicated with the red dashed line). The dynamic of measured current, during the pulse (pulse rise and fall time are not included) can be roughly described as a sum of a square wave pulse and two exponential functions, as presented with the equation (Equation (1)) (Figure 1b), where t represents time and A, B, C, D, and E are abstract parameters that are in the circuit model substituted by applied voltage and load parameters. Such a form of the equation has been chosen, because it represents a resistive, capacitive response and increase of conductivity due to electroporation, but also because it can be easily converted to an equation, which defines an analog electric circuit:
where is equal to the duration of the pulse. The first element of the equation, a constant A, represents a real (ohmic) part of the current, which is a result of resistive tissue component. But as current in tissue is also reactive, two additional elements are added. The second element , an exponential decay function, represents a capacitive current spike and can be modeled as the capacitor discharge. The third element , an exponential rise function, illustrates a conductivity growth during pulse delivery, which is a result of tissue electroporation (pore formation) and tissue heating [16,17,18].
2.2. Circuit Model
The mathematical model (Equation (1)) can be easily substituted by a circuit model (Scheme 1) with three parallel branches, namely, resistive, capacitive and inductive, which models increase of conductivity due to electroporation (Equation (2)). When the applied voltage is lower than the electroporation threshold voltage, the tissue is not electroporated and therefore the conductivity is roughly constant. In the equivalent circuit (Scheme 1) a Zener diode with breakdown voltage equal to the electroporation threshold voltage, enables or disables an inductive/electroporation branch. Additionally, at the end of each applied pulse, the stored energy in the capacitor and inductor will be released and will cause the transient exponential decay current on the trailing edge of the current waveform, resulting in a short negative value current spike. The negative spike is also present in the case of biological tissue, but we only modeled the dynamics of the pulse to facilitate calculations, therefore we neglected the rise, fall time and post pulse dynamics.
2.2.1. Single Monopolar Pulse Model
For a single positive monpolar pulse the following circuit is proposed (Scheme 1).
The values of the circuit elements are calculated using the following equations (Equations (2) and (3)):
where represents pulse voltage amplitude of applied electroporation pulse ( in Scheme 1) and electroporation threshold voltage. For the threshold voltage determination measurements at different applied voltages are required. While all the other values can be determined directly from the mathematical model:
This solution is accurate only in case of one pulse application, or when pulse repetition frequency is low (pause between pulses is longer than 1 ms [31]) e.g., in our case 1 Hz, meaning all the applied pulses in one sequence have approximately the same current time course.
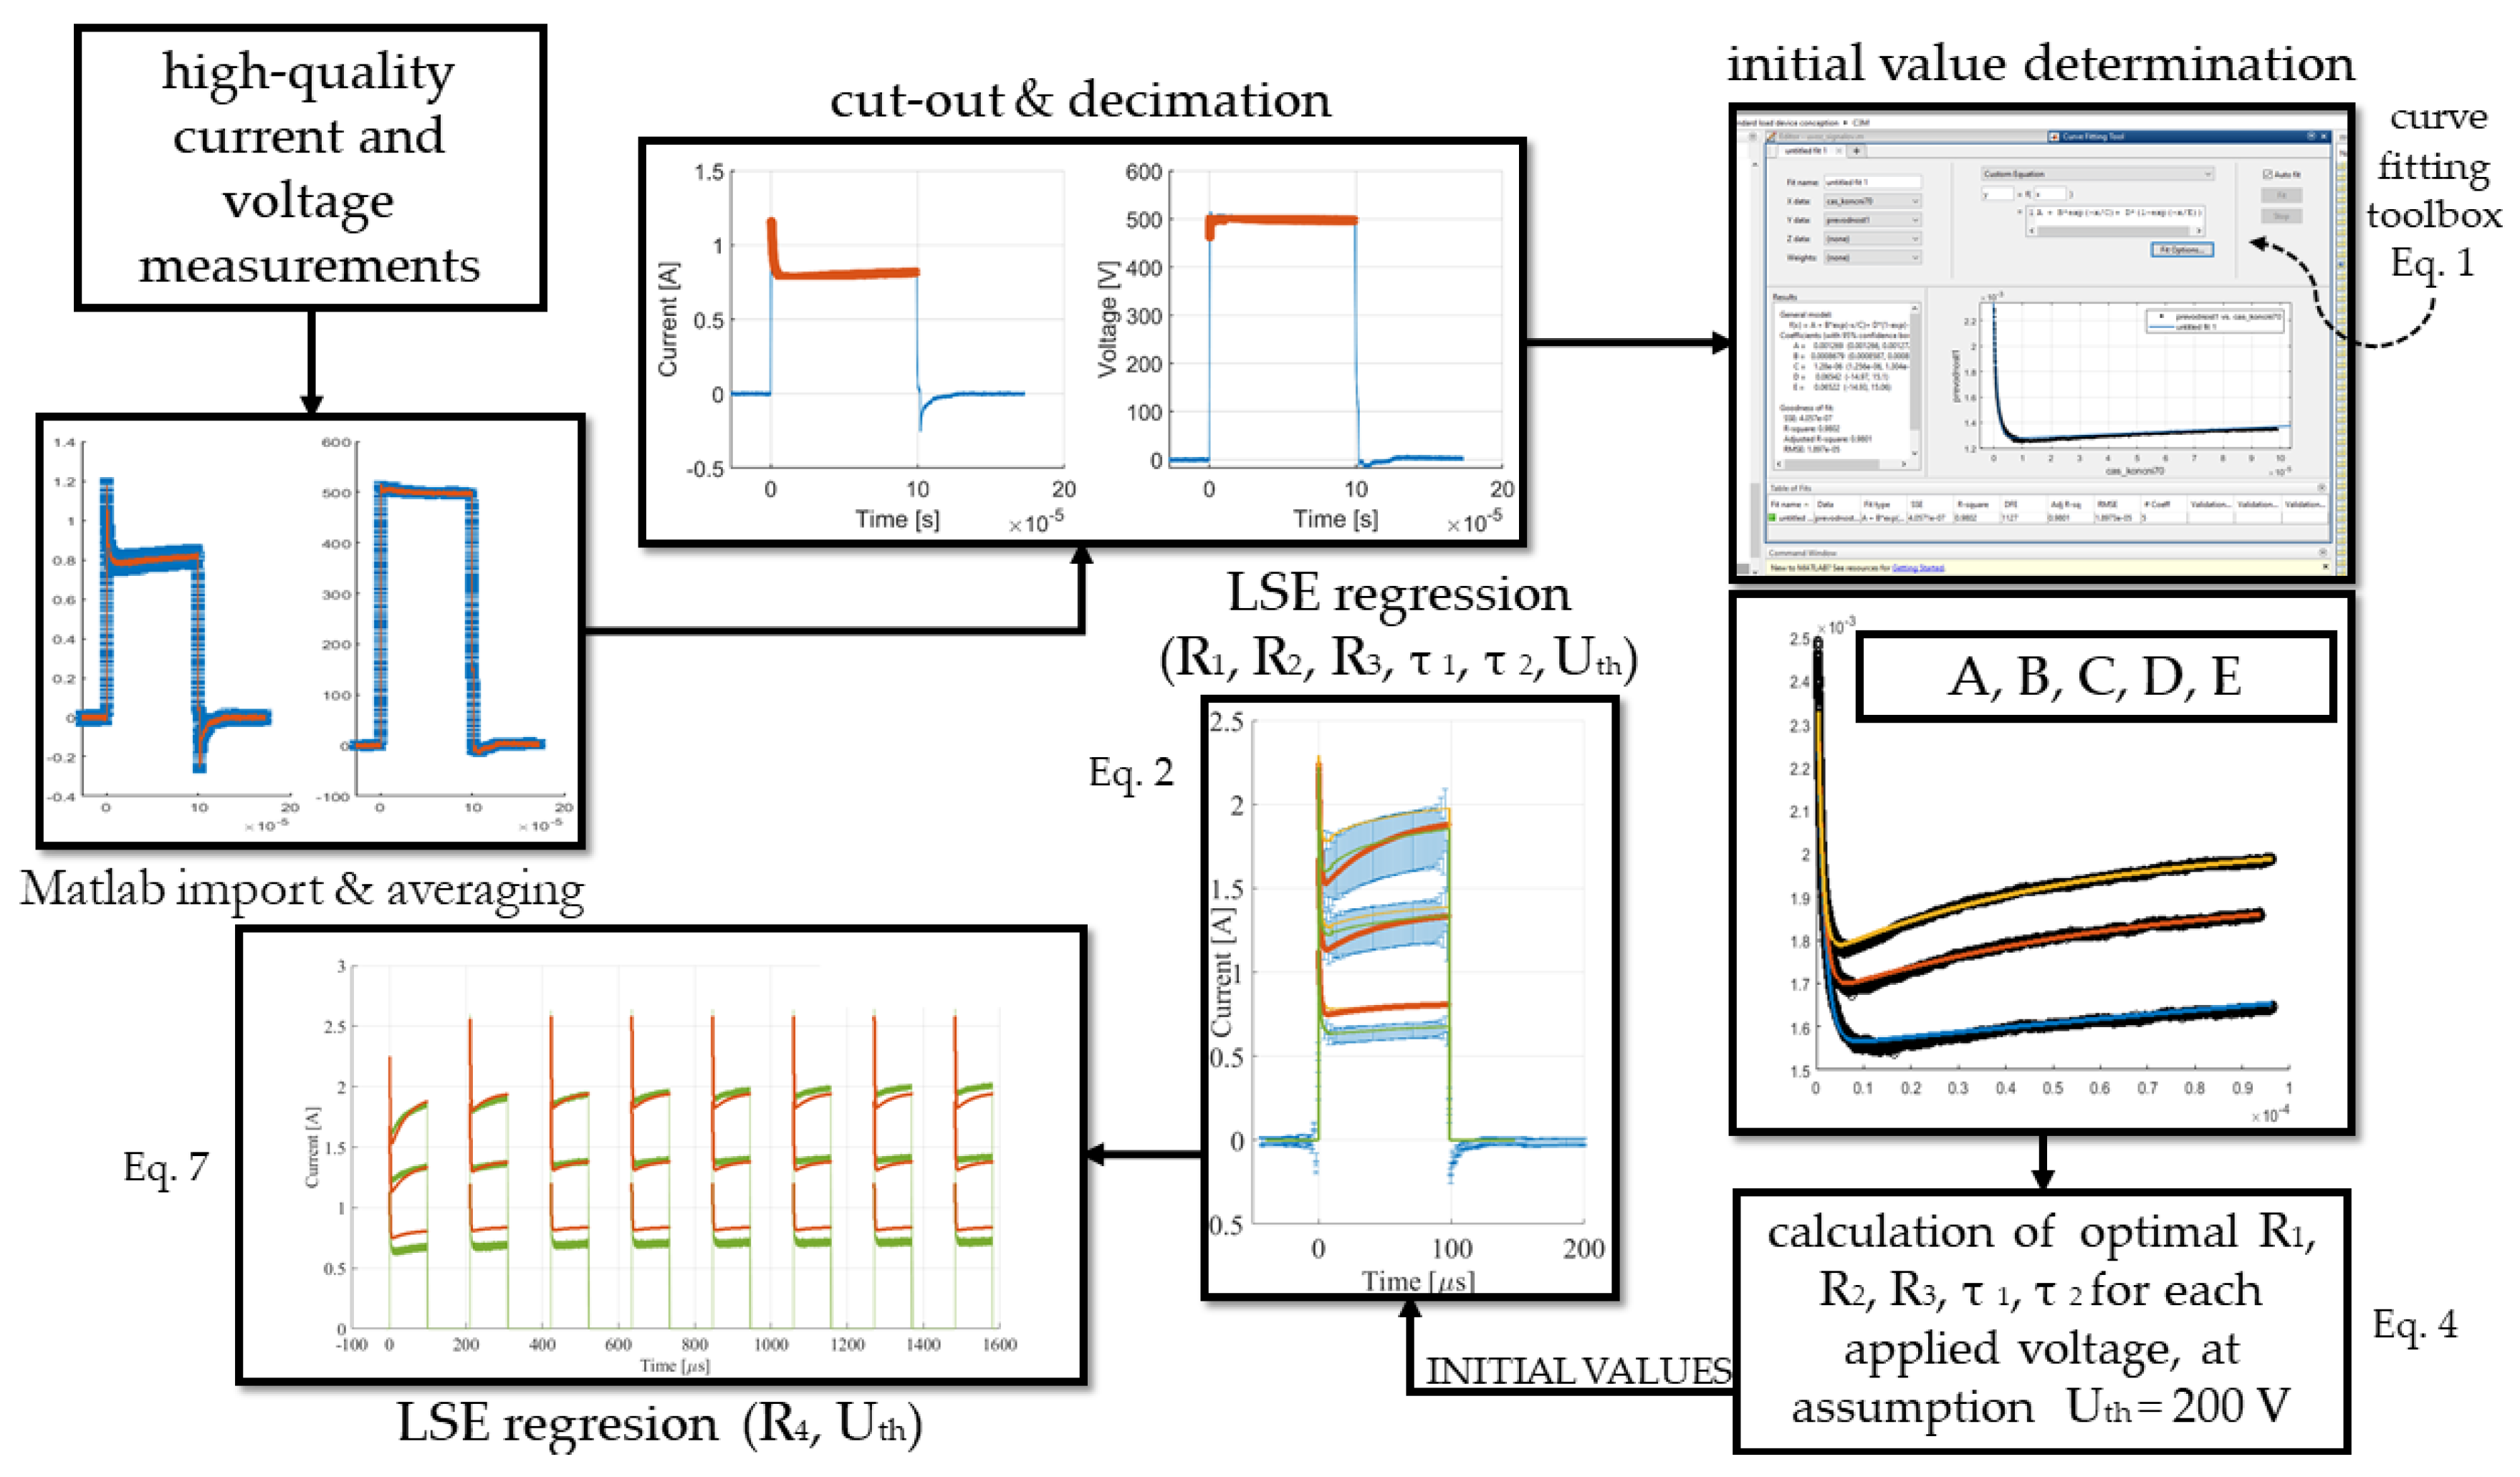
For numerical model, all measurement data (obtained and described earlier [19]), were imported into Matlab R2018b (MathWorks, Natick, MA, USA) computing environment, where values of optimal circuit elements were calculated. Due to a big number of undefined variables (, , , , , , ) a deterministic optimisation method was used. A flow chart (Figure 2) visualises a calculation process. Five high-quality measurements of applied current and voltage for each preset voltage 500 V, 750 V and 1000 V (pulse duration: 100 s and repetition frequency: 4.717 kHz), were averaged and down-sampled for further analyses. From average voltage and current signals, the active parts were cutout (values in the range from the maximal value of current to the FWHM minus 1 s). Averaged current signals were split into two parts, a capacitive current spike part and electroporation part (the minimal value in the cutout signal was set as a split point). In order to facilitate calculations, signals were decimated. The capacitive current spike part was due to its short duration-dynamics decimated by 10 (sample rate was approximately 50 MHz) and electroporation part by 70 (sample rate was approximately 7 MHz). Those two values (decimation by 10 and 70) were chosen in a way that half of the values in the new decimated signal represented a capacitive current spike part and the other half an inductive/electroporation part of the signal. At first initial values for final least square error (LSE) fit, were determined. The dynamic conductivity was calculated from applied averaged and cut-out current and voltage signals, only for the first pulse in sequence. With the Matlab’s curve fitting toolbox, optimal parameters (A, B, C, D, E) for proposed equation (Equation (1)) were defined, for each applied voltage separately. Than optimal electronic component values (, , , , ) were calculated for each applied voltage in accordance with the equation (Equation (4)), assuming the threshold voltage is equal to 200 V (assumption based on the slope of the current dynamic of electroporation part). Due to a large number of variables and three applied voltages, each variable range was predefined. For resistive components (, , ) and time constants (, ), fifteen linearly distributed values between a minimal and maximal proposed optimal values from individual fit were used. Then LSE regression was done for all three applied voltages together. While the threshold voltage was now limited between 200 V and 400 V, because in Langus et al. [19] optimal fitting maximum and minimum electric field magnitude limit were set to 200 V/cm and 400 V/cm. In this way all values of elements for single monopolar pulse circuit (Scheme 1) were determined.
2.2.2. Multiple Monopolar Pulse Model
With a higher repetition frequencies, in our case 4717 Hz, it was observed that the current reaches around of the final amplitude at the first pulse and percentage than exponentially rises with pulses, while all pulses in sequence have the same shape and amplitude in case of 1 Hz repetition frequency [19]. Already Pavlin et al. showed that for pulse repetition frequencies above 1 kHz a significant change in pulse shape occurs, meaning the following pulses start at higher initial value [31]. Heat generation, diffusion of intracellular content and pore lifetime could explain these phenomena [31,32,33]. Therefore in parallel to inductor an additional resistor and diode in series are added (Scheme 2). A diode emulates an “electroporation” memory while resistor emulates the loss of memory. For the first pulse in a pulse sequence with higher repetition frequency, the situation is the same as for first/single pulse or pulses with lower repetition frequency (Scheme 1). The electroporation memory is not yet present. During the pulse, the inductor is magnetized and right after the pulse, during the pause between pulses, the current in the model regarded as starts to flow through the new resistor and the inductor is in a demagnetization phase until the next pulse arrival. is still present when the next pulse is generated because the pause between the pulses is shorter than inductor demagnetizing time. Therefore the increases, it is the sum of inductor magnetize current and memory current. The inductor current for second and all other pulses is calculated in according to (Equations (5) and (6)):
in which, N is a pulse number, represents a current at the end of the previous pulse, is equal to the duration of the pause between pulses and in pulse period ().
All the calculated optimal component values calculated in previous section (, , , , ) are the same also in case of multiple monopolar pulse model, only threshold voltage was optimized again and which enables memory current was again defined by using LSE regression. In this case, the whole sequence, all eight pulses were, included in the calculation. Because only one variable , was left undefined, a range of potential values was extended, meaning a lot higher number of potential values were included in the regression. Final circuit emulator (Scheme 3) is based on equations (Equations (7)–(10)), which are only valid for the time of the pulse (), and well describe the behaviour of our specific biological tissue.
Final load current for higher repetition frequencies is described with discrete equation (Equation (7)), where N is the pulse number, period (pulse duration + pause). When the applied voltage is lower than the electroporation threshold voltage, the load current consists only of the ohmic and capacitive components. However when the applied voltage is higher than the electroporation threshold voltage, additionally to an ohmic and capacitive component also the inductive/electroporation current is added, which emulates conductivity rise during electroporation (Equation (7)). In the second circuit (Scheme 3) an additional memory current, which is pulse number dependent, is added to the inductive component. At the first pulse, the memory current is equal to zero because the inductor is not yet magnetized. Then with each successive pulse the memory current is higher until it reaches the plateau (Equations (8) and (9)), due to inductor magnetization and demagnetization. From the time constant also the last missing components ( and ) are calculated and thus the circuit is fully defined (Equation (10)). The proposed solution can be also used for lower frequencies in our case 1 Hz repetition rate, where all the pulses in sequence have the same dynamic. Because the time constant (329 s) of the circuit which adds the memory current is significantly smaller than pulse repetition rate (1 Hz − 1 s) the memory current can be in this case neglected.
2.3. Electronic Load Emulator
Since electronic components with exactly the same values as defined in the numerical model are not available on the market, the prototype’s components that have the closest values, were used. The circuit with commercially available components values was first simulated in PSpice AD Lite (OrCAD, Cadence, CA, USA). The load current was compared in Matlab to the measured current and an emulator was built and evaluated. The electric pulses, with the same pulse settings and with the same electroporation device (i.e., ELECTRO cell S20, -teh, Leroy, France) as in Langus et al. [19], were applied to the electronic load emulator. For the measurements of prototype emulator, oscilloscope (HDO6104A-MS, LeCroy, USA), high voltage differential probe (HVD3206A, LeCroy, USA) and current Hall probe (CP031A, LeCroy, Chestnut Ridge, NY, USA) were used.
3. Results
3.1. Numerical Calculations
For each applied voltage at 4717 Hz repetition rate individual LSE-fit of the mathematical model, gave a precise fit of the time evolution of electric current (Figure 3a), (Table 1). However the aim was to develop a prototype of electroporation load emulator, therefore the same circuit should be used for all applied voltages. Therefore a fit of a circuit model was done on all three voltages together, based on which a slightly higher deviation from the average measurement was obtained. For both 1000 V and 750 V voltage amplitude, the modeled current is however still within the standard deviation of measurements (Figure 3b), while for 500 V the optimal fit better matches the 1 Hz repetition rate measurement.
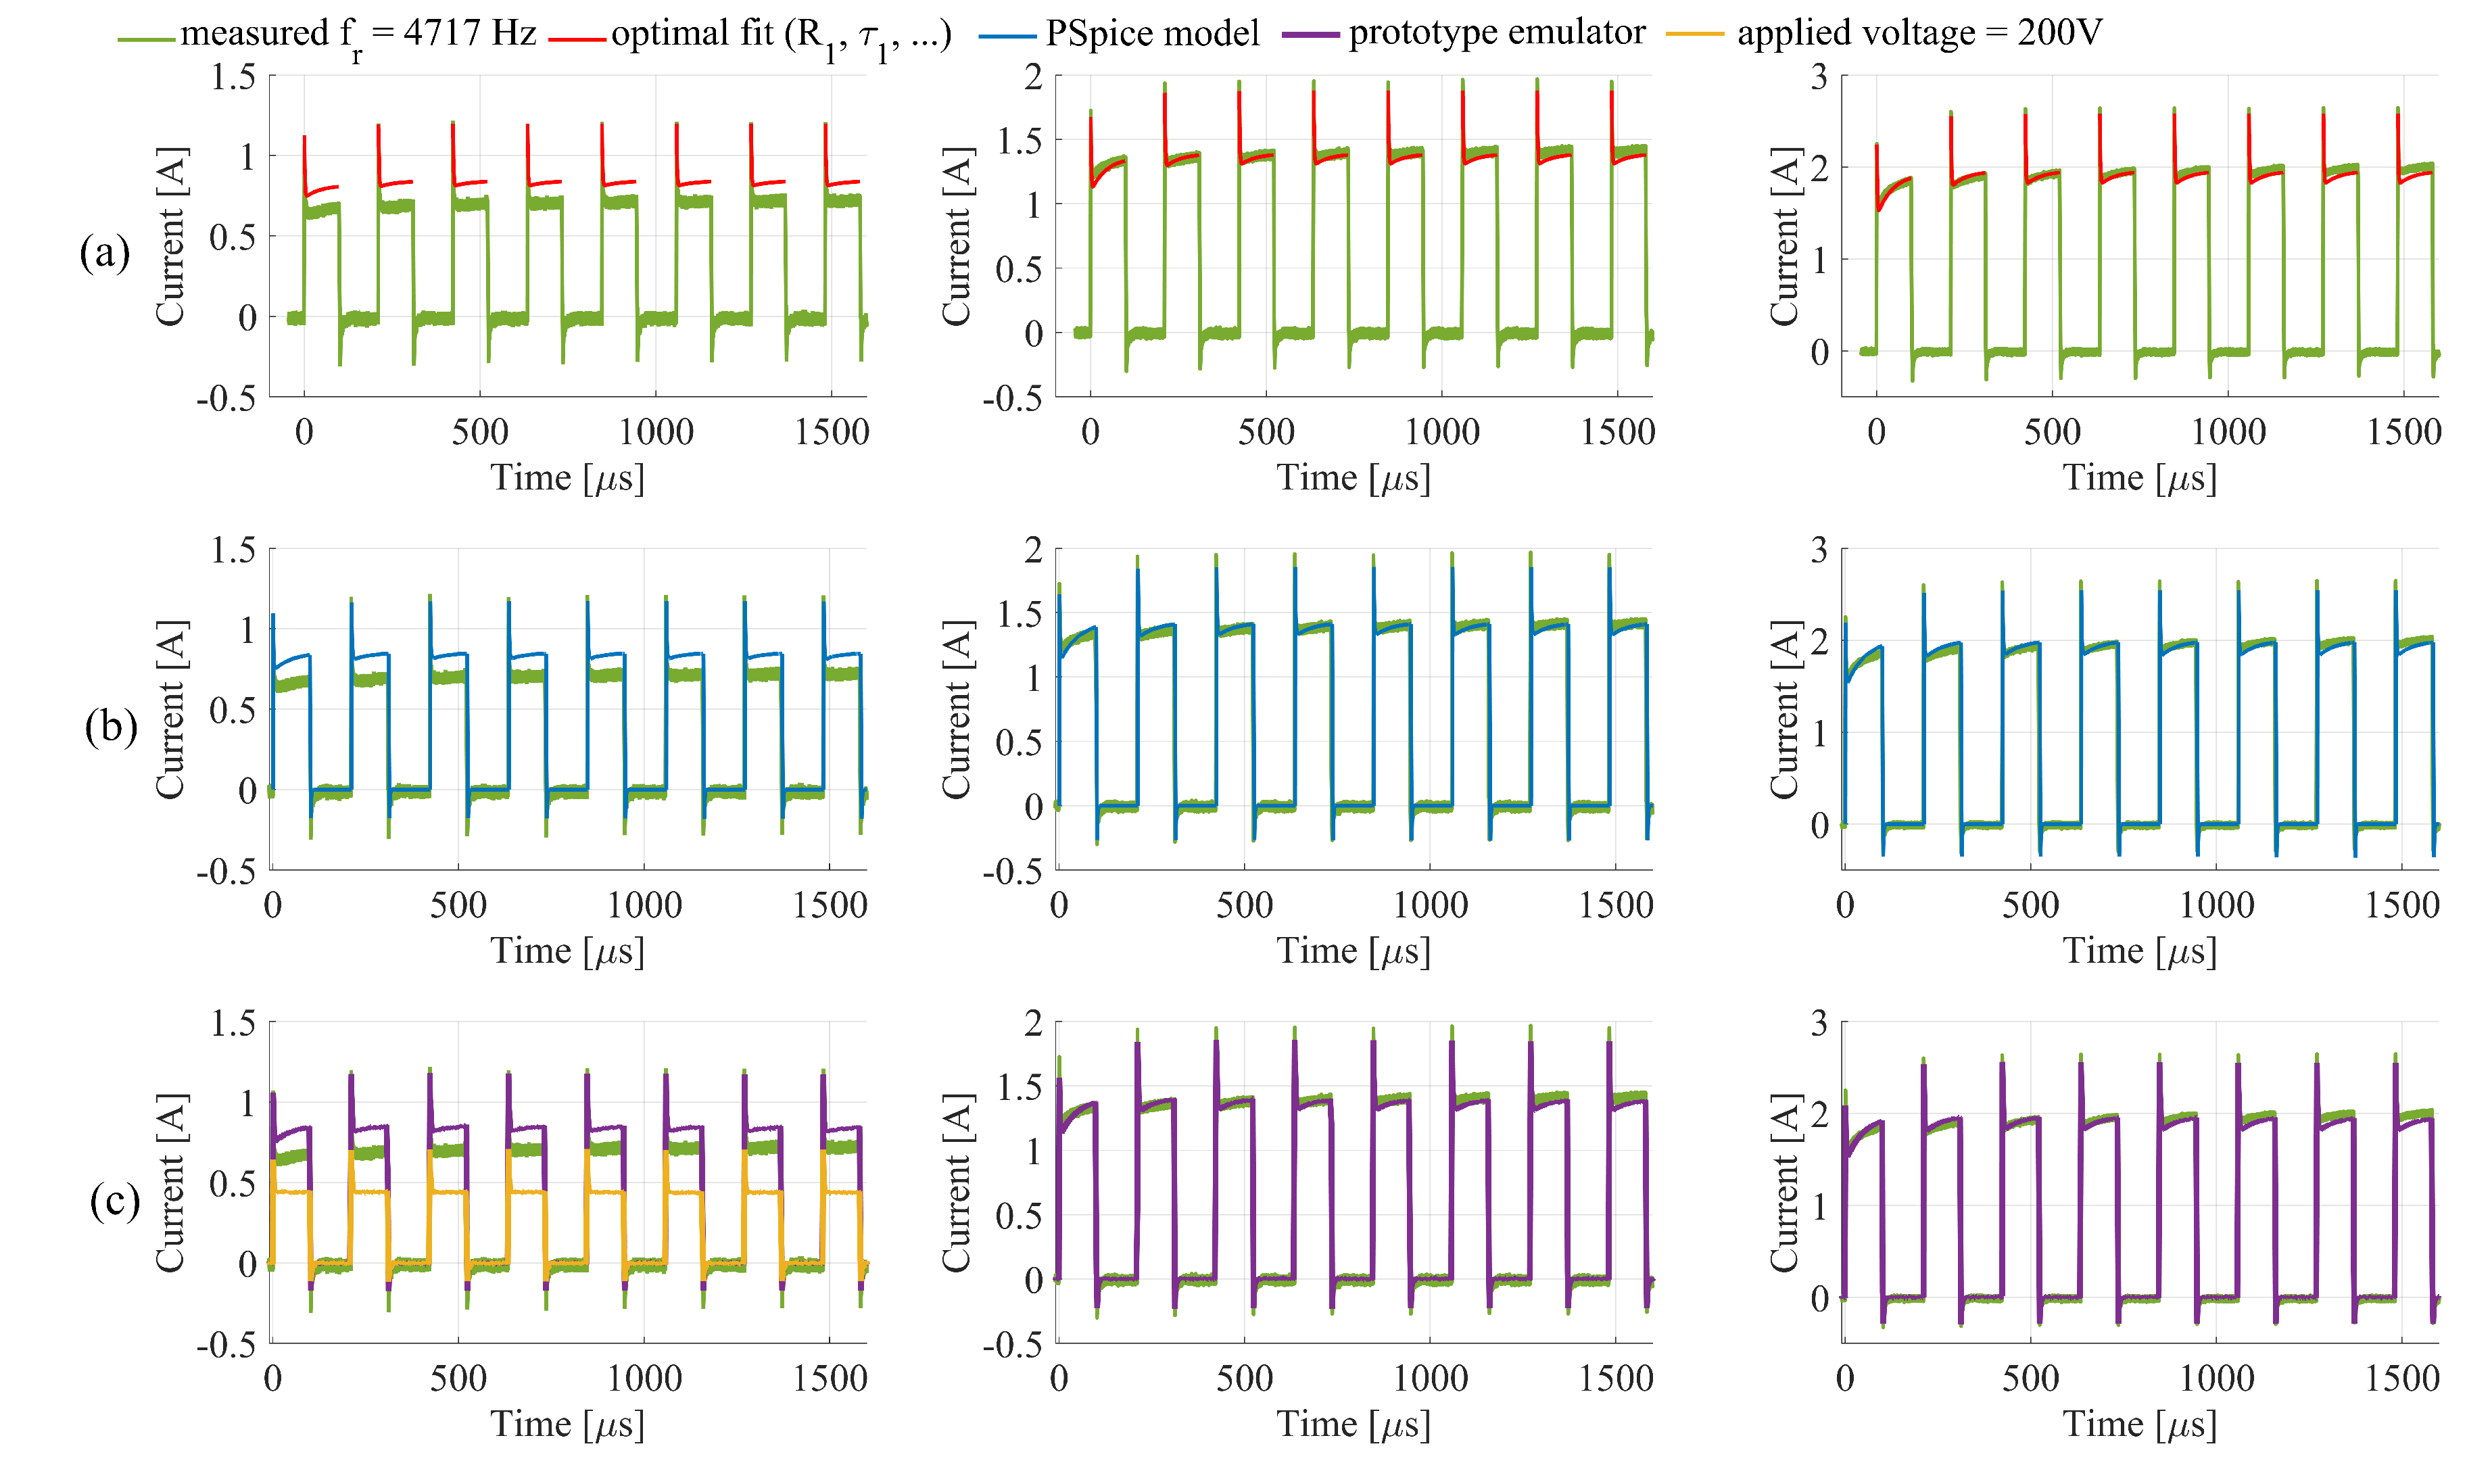
The first modeled pulse in a sequence with higher repetition frequency, has the same time course as in a single monopolar pulse model, while all consecutive pulses have higher initial values (Figure 4a, first row). Matching between measurement and modeled current, slightly decreases with pulse number, but it is still within the standard deviation (Figure 3, blue line) of measurements for 750 V and 1000 V applied voltage amplitude. Optimal values of electronic components for a single-first pulse circuit emulator and for a sequence of pulses with higher repetition frequency are presented in table (Table 2).
3.2. PSpice Model and Electronic Emulator
Based on the PSpice model, a prototype emulator was built (Figure 5). Available component values (Table 3) were implemented into PSpice transient analysis. The analysis was run for 1.6 ms. Coil internal resistance was set to measured winded wire resistance 15 . The input voltage, rise time was equal to the average rise time of all applied voltage pulses, i.e., 0.358 s and the same was done also for fall time, which was considerably slower 2.44 s. The pulse width was set to 99.5 s and period to 212 s in order to match the measurements. The PSpice simulation results of the prototype device are presented in the second row of Figure 4b.
Zener diode was composed of two Zener diodes in series, one with breakdown voltage 200 V (1N5388B, MULTICOMP) and another with 160 V (1N5384B, MULTICOMP). In order to implement the most suitable inductor, that would optimally operate at the applied pulse frequency, the inductor was made especially for this application. An RM14-type ferrite core made from N41 material grade with 1.9 mm gap (EPCOS/N41/RM14, 160 nH, 42.2 × 34.8 × 30.2mm), was winded in a 0.25 mm thick copper wire (number of windings: 600). The inductor was analyzed with an LCR meter (E4980A, Keysight, Santa Rosa, CA, USA), at 5 kHz the serial inductance was 57.6 mH and serial resistance 15 and at 10 kHz the serial inductance was 57.8 mH and serial resistance 17.6 (The inductor maximal constant current is 150 mA). CREE Silicone Carbide diode C2D05120 was used as a memory diode. Final value list of components built-in a prototype, is given in the table (Table 3). Measurements of the prototype emulator are presented in the following figure (Figure 4c, third row). An additional current measurement was added at the applied voltage set to 200 V, in order to present a current response, when the applied voltage is lower than the electroporation threshold voltage.
4. Discussion
Unfortunately, in vivo measurements are mainly collected by means of the ECT Cliniporator device, of which sampling frequency is too low to accurately measure current spikes. Additionally, due to muscle contractions (which are triggered with pulse delivery), some noise can be present in in vivo measurements. Therefore this study is based on measurements of already published research by Langus et al. [19]. In theory measurements of the first pulse, for both repetition frequencies, displayed in Figure 3 (green and yellow) should be the same. However, this reflects a reality of ex vivo and in vivo measurement and inherent variations (due to the tissue inhomogeneity, error in electrode placement, difference in temperature and water content of the tissue). The method should be robust and insensitive to such variations which we demonstrate in our method by using imperfect measurements. The proposed numerical model thus slightly deviates from the measured values obtained in ex vivo experiment. The best fit was reached for the current measurement at the input voltage 750 V. This may be explained by the fact that the electric field was due to needle electrode use, slightly heterogeneous, meaning that cells that are closer to the needles, electroporate at lower voltages. In the case of plate electrodes, we believe the fit would be even better, because of a more homogeneous electric field distribution. It is important to always consider the fact, that different electrode geometries will “define” different load. Also the negative spike at the trailing edge of the current waveform was not modeled. The biggest challenge in the post pulse calculations is the impedance of the pulse generator. After the pulse generation, the impedance is changed (due to the turn-off, of the switch in electroporator) and cannot be defined from the current and voltage measurements, due to high noise and low voltage.
PSpice model and the current measurement of the prototype emulator match well. A Zener diode that defines the electroporation threshold voltage behaves as expected and therefore enables simulation of electric current before and during electroporation. The proposed mathematical, numerical and circuit models seems thus appropriate for the development of an electronic emulator of biological tissue as an electrical load during electroporation. The performance summary table (Table 4) presents the root mean square error values, between the measurements on beef liver and mathematical model or prototype emulator or resistor and mean standard deviation of five measurements on beef liver. In case of 1 Hz repetition rate RMSE was calculated only for one pulse, as all eight pulses have the same dynamics. While in case of 4717 Hz RMSE was calculated for the whole sequence of eight pulses. For the comparison of operation, the optimal resistance value from E24 resistance value list was selected. The minimal square error criteria was used and the value of 560 gave the best match. Additionally, to the three main features (capacitive spike, rise of conductivity during the pulse and electroporation memory) the developed emulator in comparison to the optimal resistor has significantly lower RMSE, which can be observed in (Table 4). The presented circuit model could be upgraded for electroporation pulses of both polarities, named also biphasic or bipolar pulses. The last branch in the circuit should be doubled and mirrored as shown in (Scheme 4). Current measurements of both polarities should be however analyzed in detail in order to determine the relation between both inductors. If there is a memory present also between a positive, and negative pulse inductors and should be coupled.
The solution, presented in this paper, presents a new approach, which enables repeatable and unbiased testing and evaluation of electroporator performance. However, the proposed emulator has to be adjusted for specific biological load i.e., cell-suspension in cuvettes, plate electrodes, electrodes for a skin treatment or needle electrodes for deep-seated tumors. Therefore, for each specific biological load, a separate analysis should be done. At first, we have to collect accurate measurements, with a high sampling rate, and than parametrization in accordance with this paper should be done. Finally, the circuit components should be modified accordingly to the newly calculated values. From the prospect of standardization or evaluation and comparison of different electroporation devices, each of the components in the proposed circuit could also be replaced with an adjustable value component. A series of a different capacitor and Zener diode modulation would incorporate flexibility and provide versatile emulator. The maximal voltage and current of an emulator are defined with the maximal voltage and current of the selected components and the frequency is limited by the selected inductor. Characteristics of the ferrite core are frequency dependent and in case of saturation the inductor would not work as desired.
The study in this paper is focused only on “classical” electroporation pulses, which are used clinically for ECT and IRE. Recently, however a much broader range of pulse duration is investigated and therefore the frequency spectrum of induced transmembrane potential is getting more attention [34]. With lower frequencies, the proposed concept can be used, but in case of higher frequencies, actual physical components should be thoughtfully selected with minimal parasitic values, or if not possible, the parasitic contributions should be added to the PSpice model. Also, a switch from circuital to distributed models of pulse delivery may be needed.
5. Conclusions
The proposed concept and electronic emulator of biological tissue as an electrical load during electroporation accurately simulates the current during electroporation. It serves as a proof of concept with a great potential. For each specific biological load, first voltage and current measurements should be made and a specific model should be developed. But from the prospect of standardization or evaluation and comparison of different electroporation devices, each of the components in the proposed circuit could be replaced with an adjustable value component. A series of a different capacitor and Zener diode modulation would incorporate flexibility and provide a versatile emulator. One of the possible solution is also that for each electroporation application a typical or worst case standardized emulator is developed. However additional measurements on different biological loads and different electrodes should be done and analyzed for this purpose. The main innovation of the presented process/concept of an emulator is that enables sustainable, repeatable and unbiased testing, therefore, it facilitates standard implementation. Additionally, the emulator can be used as a load during the development of an electroporator, which greatly facilitates the development process. We believe this is the first step towards the development of an electroporator tester. Such testers are well known and indispensable in other fields e.g., the defibrillation [35]. In the case of a defibrillator, a load is well known and electrodes are well defined, while in case of electroporation the same device can be used with different electrodes and load can vary from the skin to liver.
Author Contributions
Conceptualisation, M.R., B.B., E.P. and D.M.; methodology, M.R., E.P. and B.B.; software, E.P. and B.B.; validation, E.P. and M.R.; writing—original draft preparation, E.P.; writing—review and editing, M.R., D.M.; visualisation, E.P.; supervision, M.R. and D.M. All authors have read and agreed to the this version of the manuscript.
Funding
This study was supported by the Slovenian Research Agency (ARRS) (MRIC UL IP-0510, P2-0249, funding for Junior Researchers to Eva Pirc).
Acknowledgments
The authors would like to thank Anja Zajc for the help with coil winding and to the agreement between Esigelec and the University of Ljubljana, which enabled Bertrand Balosetti’s visit to the University of Ljubljana.
Conflicts of Interest
The authors declare no conflict of interest.
Abbreviations
The following abbreviations are used in this manuscript:
| ECT | Electrochemotherapy |
| PEF | Pulsed electric fields |
| LSE | Least square error |
| RMSE | Root mean square error |
References
- Yarmush, M.L.; Golberg, A.; Serša, G.; Kotnik, T.; Miklavčič, D. Electroporation-based technologies for medicine: Principles, applications, and challenges. Annu. Rev. Biomed. Eng. 2014, 16, 295–320. [Google Scholar] [CrossRef] [Green Version]
- Miklavčič, D. Network for development of electroporation-based technologies and treatments: COST TD1104. J. Membr. Biol. 2012, 245, 591–598. [Google Scholar] [CrossRef] [Green Version]
- Kotnik, T.; Rems, L.; Munir, T.; Miklavčič, D. Membrane electroporation and electropermeabilization: Mechanisms and models. Annu. Rev. Biophys. 2019, 48, 63–91. [Google Scholar] [CrossRef] [PubMed]
- Miklavčič, D.; Davalos, R.V. Electrochemotherapy (ECT) and irreversible electroporation (IRE)-advanced techniques for treating deep-seated tumors based on electroporation. Biomed. Eng. Online 2015, 14, I1. [Google Scholar] [CrossRef] [PubMed] [Green Version]
- Mir, L.M.; Orlowski, S.; Belehradek, J.; Paoletti, C. Electrochemotherapy potentiation of antitumour effect of bleomycin by local electric pulses. Eur. J. Cancer Clin. Oncol. 1991, 27, 68–72. [Google Scholar] [CrossRef]
- Serša, G.; Miklavčič, D.; Čemažar, M.; Rudolf, Z.; Pucihar, G.; Snoj, M. Electrochemotherapy in treatment of tumours. Eur. J. Surg. Oncol. 2008, 34, 232–240. [Google Scholar] [CrossRef] [Green Version]
- Mali, B.; Jarm, T.; Snoj, M.; Serša, G.; Miklavčič, D. Antitumor effectiveness of electrochemotherapy: A systematic review and meta-analysis. Eur. J. Surg. Oncol. 2013, 39, 4–16. [Google Scholar] [CrossRef]
- Mir, L.M.; Gehl, J.; Serša, G.; Collins, C.G.; Garbay, J.-R.; Billard, V.; Geertsen, P.F.; Rudolf, Z.; O’Sullivan, G.C.; Marty, M. Standard operating procedures of the electrochemotherapy: Instructions for the use of bleomycin or cisplatin administered either systemically or locally and electric pulses delivered by the CliniporatorTM by means of invassive or non-invasive electrodes. Eur. J. Cancer Suppl. 2006, 4, 14–25. [Google Scholar] [CrossRef]
- Gehl, J.; Sersa, G.; Matthiessen, L.W.; Muir, T.; Soden, D.; Occhini, A.; Quaglino, P.; Curatolo, P.; Campana, L.G.; Kunte, C.; et al. Updated standard operating procedures for electrochemotherapy of cutaneous tumours and skin metastases. Acta Oncol. 2018, 57, 874–882. [Google Scholar] [CrossRef] [PubMed]
- Reberšek, M.; Miklavčič, D.; Bertacchini, C.; Sack, M. Cell membrane electroporation-Part 3: The equipment. IEEE Elect. Insul. Mag. 2014, 30, 8–18. [Google Scholar] [CrossRef]
- Pirc, E.; Reberšek, M.; Miklavčič, D. 12 Dosimetry in Electroporation-Based Technologies and Treatments. In Dosimetry in Bioelectromagnetics; Markov, M., Ed.; CRC Press: Boca Raton, FL, USA, 2017; pp. 233–268. [Google Scholar]
- Puc, M.; Reberšek, S.; Miklavčič, D. Requirements for a clinical electrochemotherapy device—Electroporator. Radiol. Oncol. 1997, 31, 368–373. [Google Scholar]
- Ivorra, A. Tissue Electroporation as a Bioelectric Phenomenon: Basic Concepts. In Irreversible Electroporation; Rubinsky, B., Ed.; Springer: Berlin/Heidelberg, Germany, 2010; pp. 23–61. [Google Scholar]
- Canatella, P.J.; Black, M.M.; Bonnichsen, D.M.; McKenna, C.; Prausnitz, M.R. Tissue Electroporation: Quantification and Analysis of Heterogeneous Transport in Multicellular Environments. Biophys. J. 2004, 86, 3260–3268. [Google Scholar] [CrossRef] [Green Version]
- Powell, K.T.; Morgenthaler, A.W.; Weaver, J.C. Tissue electroporation. Observation of reversible electrical breakdown in viable frog skin. Biophys. J. 1989, 56, 1163–1171. [Google Scholar] [CrossRef] [Green Version]
- Sel, D.; Cukjati, D.; Batiuskaite, D.; Slivnik, T.; Mir, L.M.; Miklavčič, D. Sequential finite element model of tissue electropermeabilization. IEEE Trans. Biomed. Eng. 2005, 52, 816–827. [Google Scholar] [CrossRef] [PubMed] [Green Version]
- Ivorra, A.; Al-Sakere, B.; Rubinsky, B.; Mir, L.M. In vivo electrical conductivity measurements during and after tumor electroporation: Conductivity changes reflect the treatment outcome. Phys. Med. Biol. 2008, 54, 5949–5963. [Google Scholar] [CrossRef] [PubMed]
- Neal, R.E., II; Garcia, P.A.; Robertson, J.L.; Davalos, R.V. Experimental Characterization and Numerical Modeling of Tissue Electrical Conductivity during Pulsed Electric Fields for Irreversible Electroporation Treatment Planning. IEEE Trans. Biomed. Eng. 2012, 59, 1076–1085. [Google Scholar] [CrossRef] [PubMed]
- Langus, J.; Kranjc, M.; Kos, B.; Šuštar, T.; Miklavčič, D. Dynamic finite-element model for efficient modelling of electric currents in electroporated tissue. Sci. Rep. 2016, 6, 26409. [Google Scholar] [CrossRef]
- Pintar, M.; Langus, J.; Edhemović, I.; Brecelj, E.; Kranjc, M.; Sersa, G.; Šuštar, T.; Rodič, T.; Miklavčič, D.; Kotnik, T.; et al. Time-Dependent Finite Element Analysis of In Vivo Electrochemotherapy Treatment. Technol. Cancer Res. Treat. 2018, 17, 1–9. [Google Scholar] [CrossRef] [Green Version]
- Cukjati, D.; Batiuskaite, D.; André, F.; Miklavčič, D.; Mir, L.M. Real time electroporation control for accurate and safe in vivo non-viral gene therapy. Bioelectrochemistry 2007, 70, 501–507. [Google Scholar] [CrossRef]
- Puc, M.; Corović, S.; Flisar, K.; Petkovsek, M.; Nastran, J.; Miklavčič, D. Techniques of signal generation required for electropermeabilization. Survey of electropermeabilization devices. Bioelectrochemistry 2004, 64, 113–124. [Google Scholar] [CrossRef]
- Reberšek, M.; Miklavčič, D. Concepts of Electroporation Pulse Generation and Overview of Electric Pulse Generators for Cell and Tissue Electroporation. In Advanced Electroporation Techniques in Biology and Medicine; Pakhomov, A.G., Miklavčič, D., Markov, M.S., Eds.; CRC Press: Boca Raton, FL, USA, 2010; Chapter 16; pp. 323–339. [Google Scholar]
- Chicaybam, L.; Barcelos, C.; Peixoto, B.; Carneiro, M.; Limia, C.G.; Redondo, P.; Lira, C.; Paraguassú-Braga, F.; De Vasconcelos, Z.F.M.; Barros, L.; et al. An Efficient Electroporation Protocol for the Genetic Modification of Mammalian Cells. Front. Bioeng. Biotechnol. 2017, 4, 99. [Google Scholar] [CrossRef] [PubMed] [Green Version]
- Iversen, N.; Birkenes, B.; Torsdalen, K.; Djurovic, S. Electroporation by nucleofector is the best nonviral transfection technique in human endothelial and smooth muscle cells. Genet. Vaccines Ther. 2005, 3, 2. [Google Scholar] [CrossRef] [Green Version]
- Arslan-Yildiz, A.; El Assal, R.; Chen, P.; Guven, S.; Inci, F.; Demirci, U. Towards artificial tissue models: Past, present, and future of 3D bioprinting. Biofabrication 2016, 8, 014103. [Google Scholar] [CrossRef] [PubMed]
- Zhao, Y.; Liu, H.; Bhonsle, S.P.; Wang, Z.; Davalos, R.V.; Yao, C. Ablation outcome of irreversible electroporation on potato monitored by impedance spectrum under multi-electrode system. Biomed. Eng. Online 2018, 17, 126. [Google Scholar] [CrossRef] [PubMed] [Green Version]
- Ruarus, A.H.; Vroomen, L.G.; Puijk, R.S.; Scheffer, H.J.; Faes, T.J.C.; Meijerink, M.R. Conductivity Rise During Irreversible Electroporation: True Permeabilization or Heat? Cardiovasc. Intervent Radiol. 2018, 41, 1257–1266. [Google Scholar] [CrossRef] [Green Version]
- Kranjc, M.; Bajd, F.; Serša, I.; Miklavčič, D. Magnetic resonance electrical impedance tomography for measuring electrical conductivity during electroporation. Physiol. Meas. 2014, 35, 985–996. [Google Scholar] [CrossRef] [Green Version]
- Ivorra, A.; Rubinsky, B. In Vivo Electrical Impedance Measurements during and after Electroporation of Rat Liver. Bioelectrochemistry 2017, 70, 287–295. [Google Scholar] [CrossRef]
- Pavlin, M.; Miklavčič, D. Theoretical and experimental analysis of conductivity, ion diffusion and molecular transport during cell electroporation-relation between short-lived and long-lived pores. Bioelectrochemistry 2008, 74, 38–46. [Google Scholar] [CrossRef]
- Lacković, I.; Magjarević, R.; Miklavčič, D. Three-dimensional Finite-element Analysis of Joule Heating in Electrochemotherapy and in vivo Gene Electrotransfer. IEEE Trans. Dielectr. Electr. Insul. 2009, 16, 1338–1347. [Google Scholar] [CrossRef]
- Stern, J.V.; Gowrishankar, T.R.; Smith, K.C.; Weaver, J.C. Broad pore lifetime distributions: A fundamental concept for cell electroporation. arXiv 2017, arXiv:1708.076133v1. [Google Scholar]
- Merla, C.; Pakhomov, A.G.; Semenov, I.; Vernier, P.T. Frequency spectrum of induced transmembrane potential and permeabilization efficacy of bipolar electric pulses. Biochim. Biophys. Acta (BBA)-Biomembr. 2017, 1859, 1282–1290. [Google Scholar] [CrossRef] [PubMed]
- Sharma, V.K.; Chopra, Y.C.; Bajwa, J.S.; Sohi, B.S.; Tiwari, R.K. A reliable microprocessor-based defibrillator analyzer. IEEE. Trans. Instrum. Meas. 1982, IM-31, 28–31. [Google Scholar] [CrossRef]
Figure 1.
(a) Typical time course during PEF application to the tissue (red) and three mathematical functions (black); (b) Current is modeled as a sum of a square wave pulse and two exponential functions, by following the equation (Equation (1)).
Figure 1.
(a) Typical time course during PEF application to the tissue (red) and three mathematical functions (black); (b) Current is modeled as a sum of a square wave pulse and two exponential functions, by following the equation (Equation (1)).

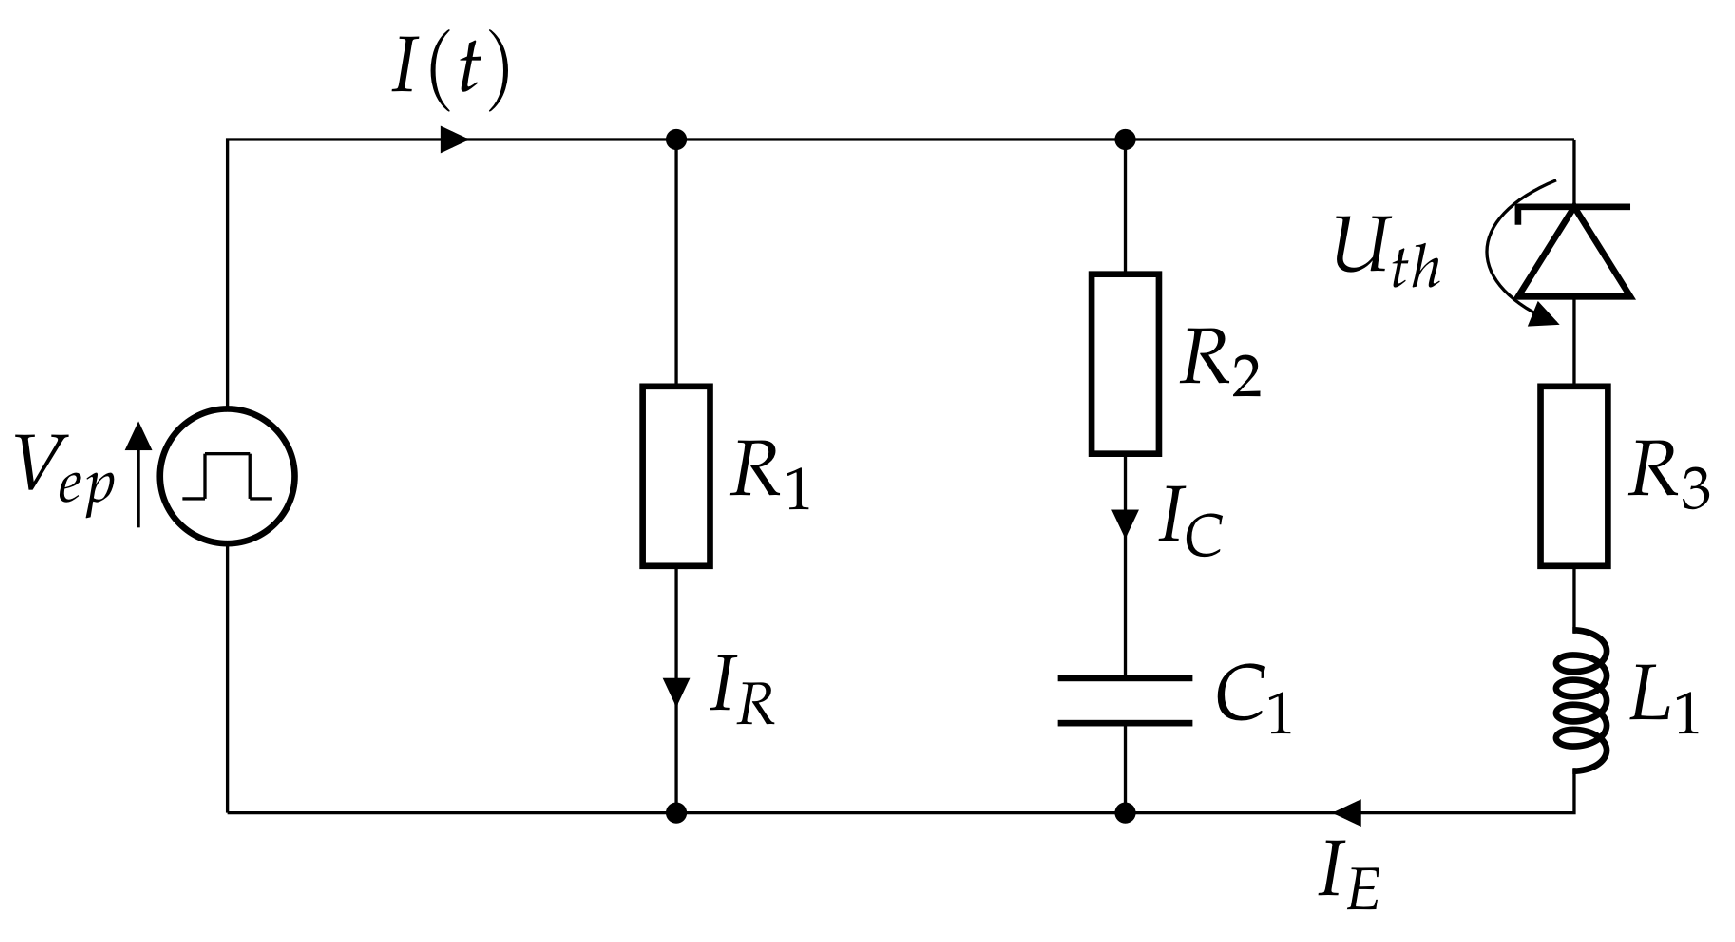
Scheme 1.
Single monopolar pulse circuit emulator: equivalent circuit model of tissue during electroporation. Where represent applied electroporation pulse, with pulse voltage amplitude and electroporation threshold voltage.
Scheme 1.
Single monopolar pulse circuit emulator: equivalent circuit model of tissue during electroporation. Where represent applied electroporation pulse, with pulse voltage amplitude and electroporation threshold voltage.

Figure 2.
Flow chart of numerical calculations in Matlab.

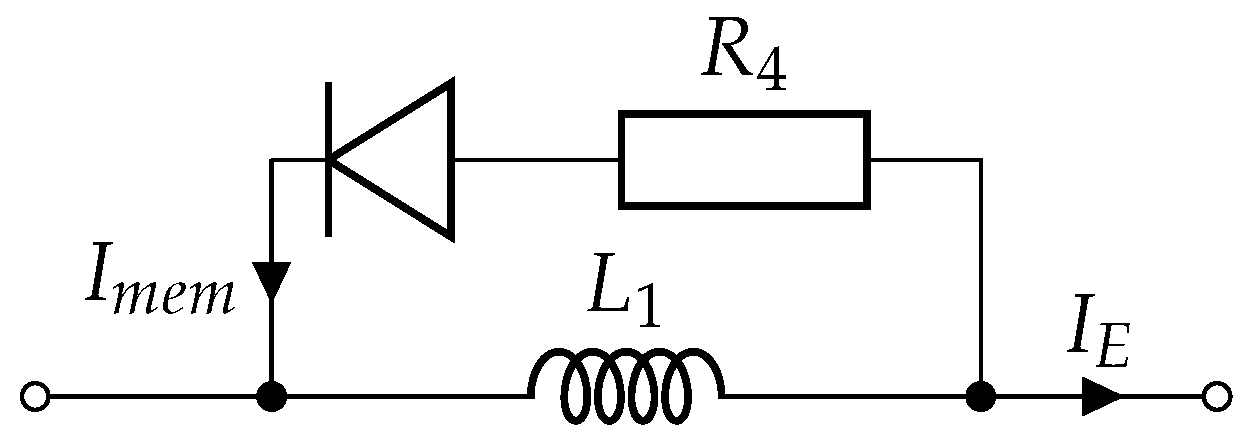
Scheme 2.
Additional in series connected resistor and diode in parallel to the inductor , emulate an “electroporation” memory, which enables that the following pulse starts at the higher initial value.
Scheme 2.
Additional in series connected resistor and diode in parallel to the inductor , emulate an “electroporation” memory, which enables that the following pulse starts at the higher initial value.

Scheme 3.
Final electronic emulator of biological tissue as an electrical load during electroporation.
Scheme 3.
Final electronic emulator of biological tissue as an electrical load during electroporation.

Figure 3.
Average of five current measurements of the first pulse at 1 Hz (yellow) and 4717 Hz (green) repetition frequency. (a) Modeled current (red), optimal circuit parameter values were determined for each applied voltage separately for 4717 Hz pulse repetition rate; (b) Modeled current (red), optimal circuit parameter values were determined with the LSE method, the cost function included all three currents at different voltages for pulse repetition rate 4717 Hz.
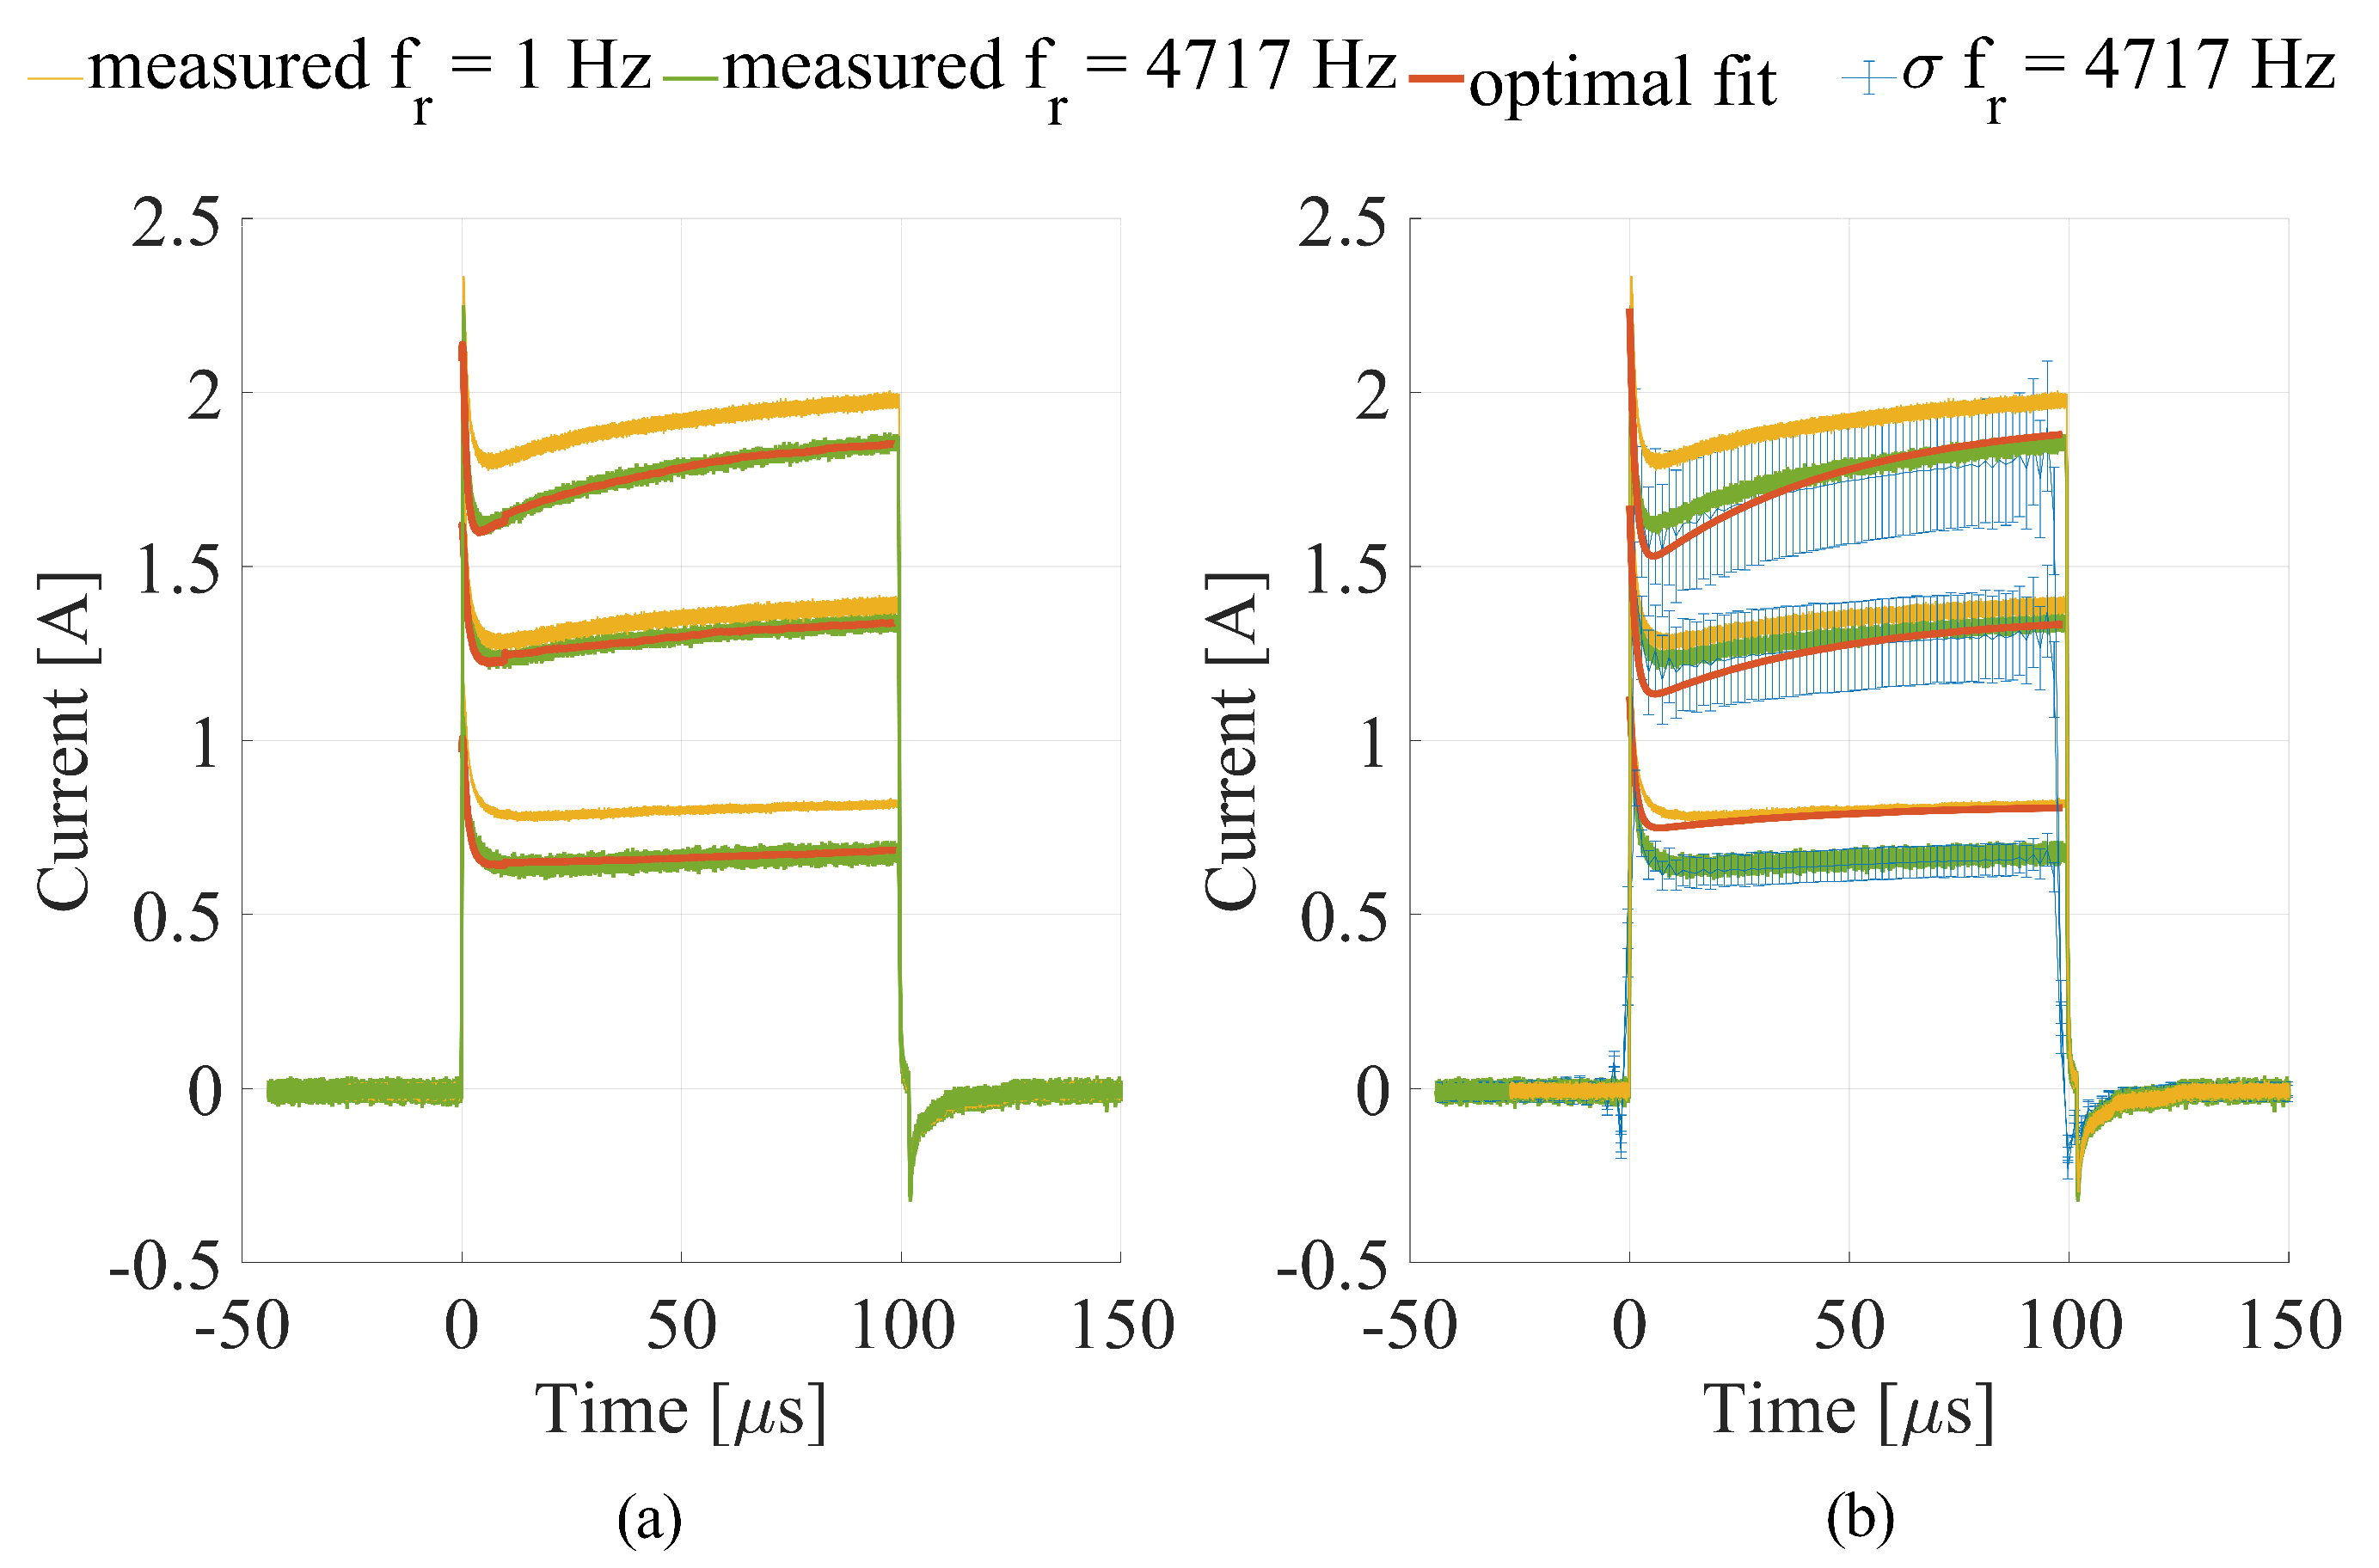
Figure 4.
Average of five current measurements at 4717 Hz repetition frequency (green), (a) numerically modeled current by Matlab (red, first row), (b) modeled current by a PSpice (blue, second row) and (c) measured current trough prototype emulator (purple, third row). An additional current measurement in the case of the emulator was added at the applied voltage set to 200 V, in order to present a current response, when the applied voltage is lower than the threshold voltage. In the first column, the current at 500 V in the second 750 V and third 1000 V applied voltage amplitude is presented.

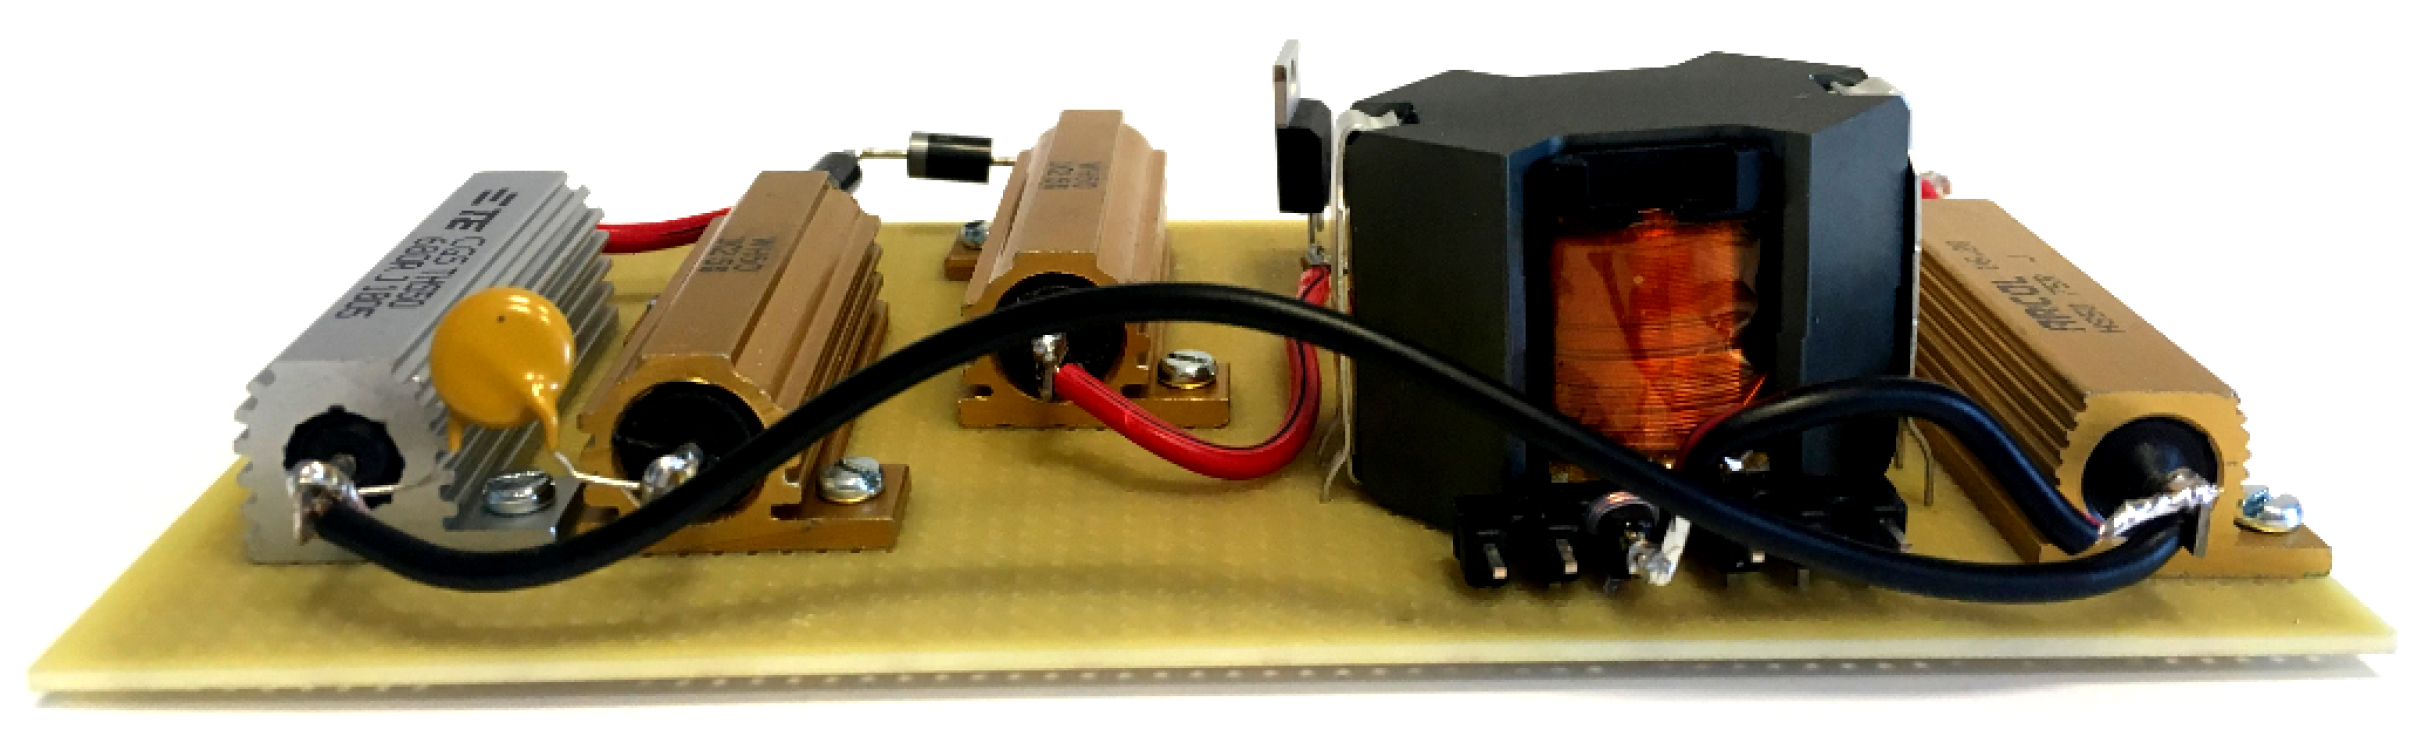
Figure 5.
A physical prototype electronic emulator of biological tissue as an electrical load during electroporation.
Figure 5.
A physical prototype electronic emulator of biological tissue as an electrical load during electroporation.

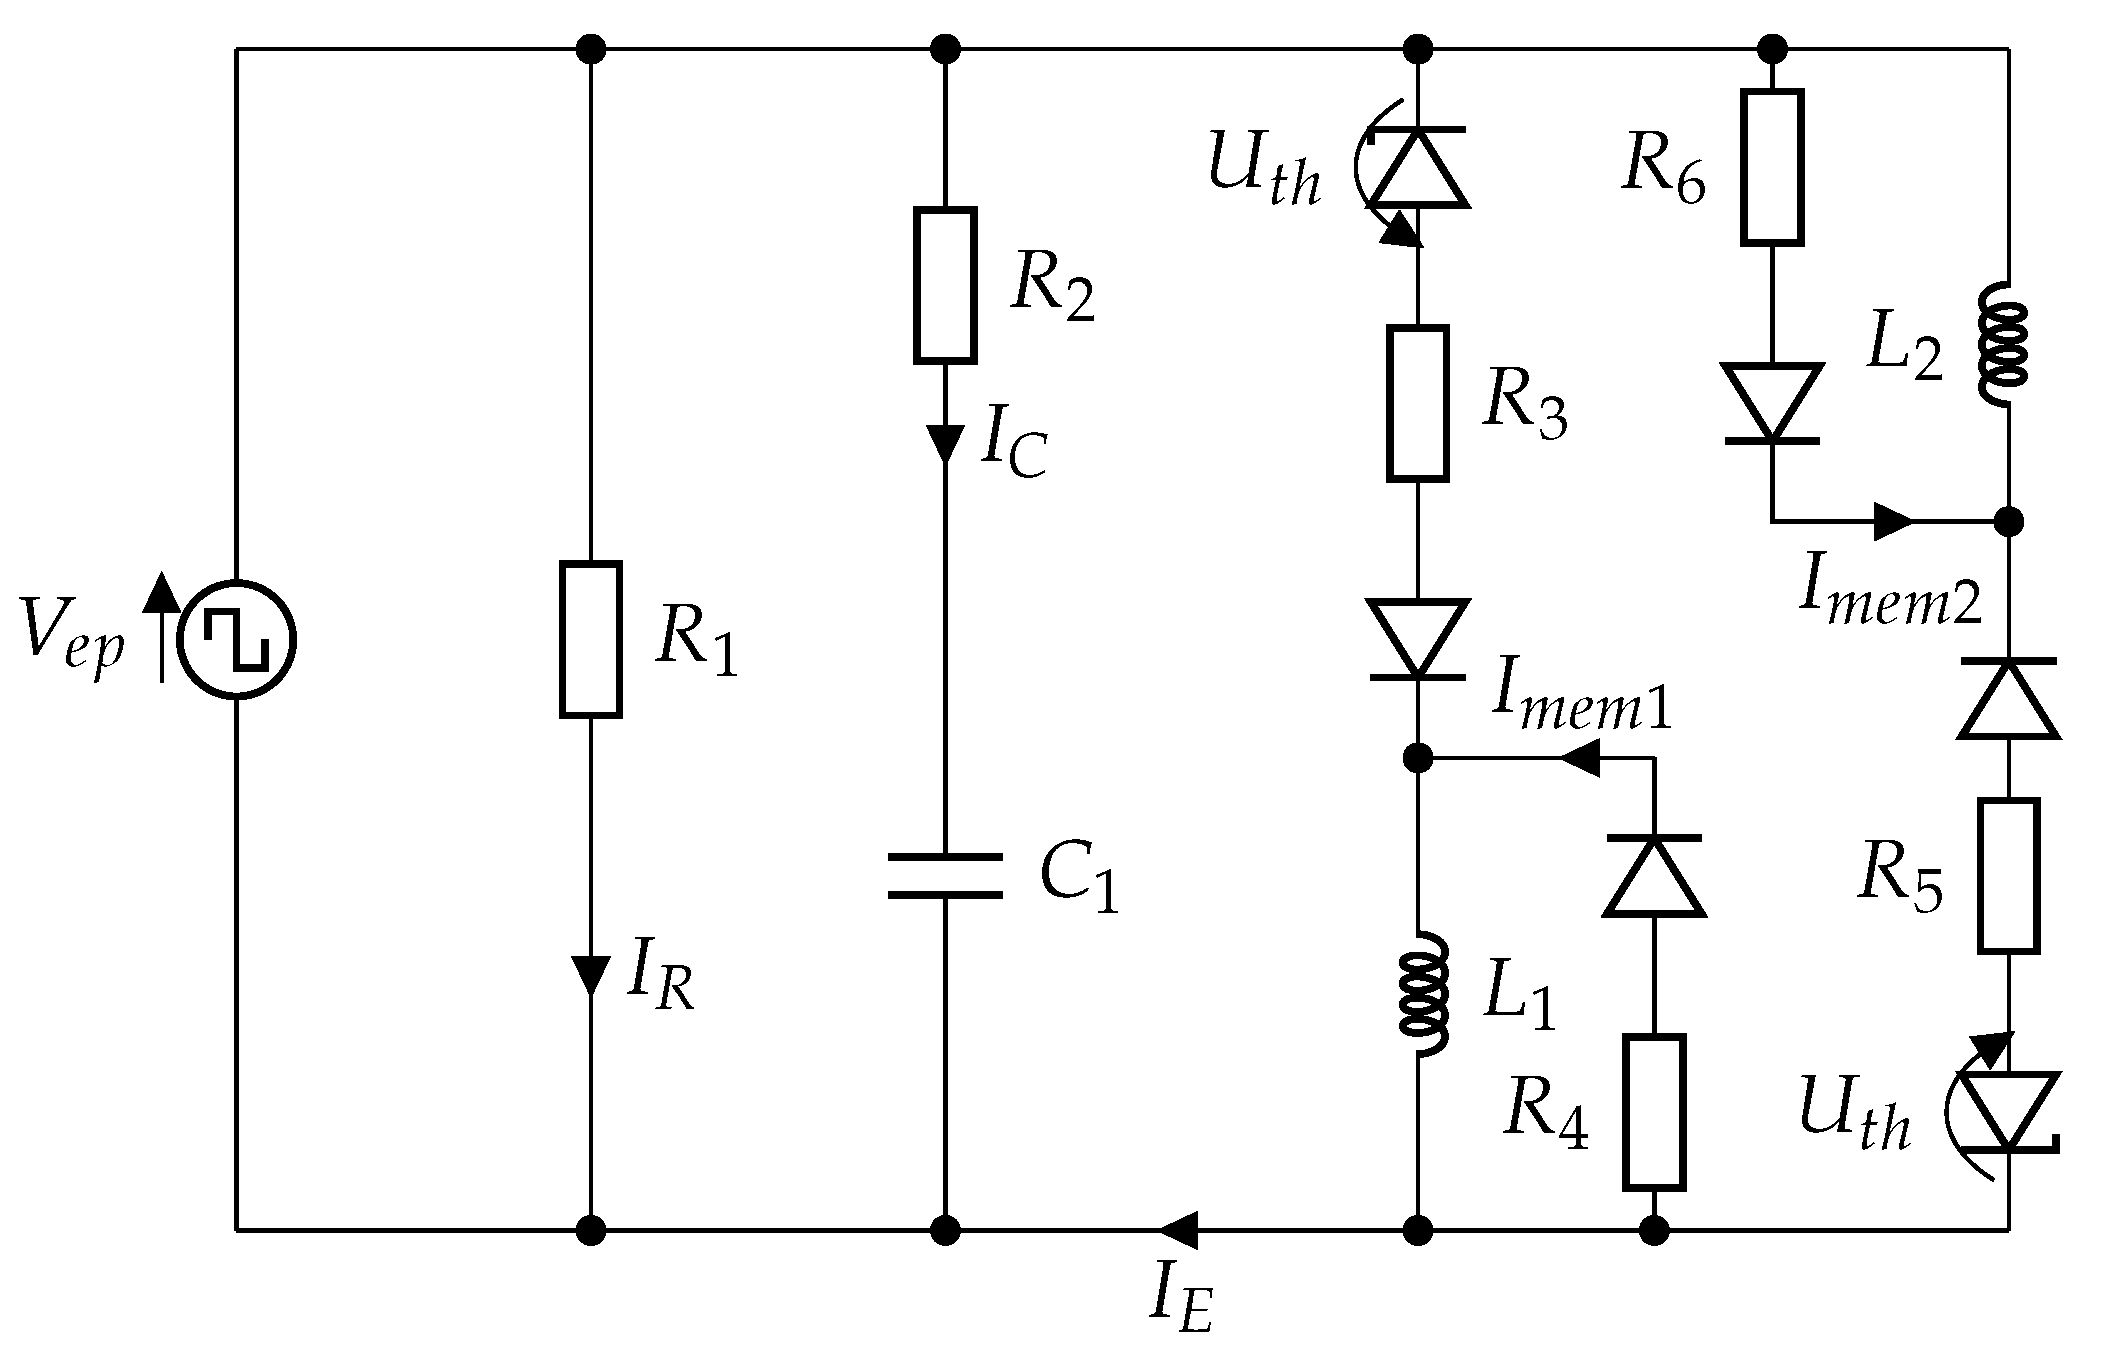
Scheme 4.
Proposed emulator upgrade for electroporation with both polarity pulses, but additional current measurements should be analyzed in detail, to determine the relation between both inductors ().
Scheme 4.
Proposed emulator upgrade for electroporation with both polarity pulses, but additional current measurements should be analyzed in detail, to determine the relation between both inductors ().


Table 1.
Optimal values of electronic components for the single positive monopolar pulse model, for each applied voltage, at assumption = 200 V (Figure 3a). Used as initial values for LSE regression (Figure 3b).
| Voltage [V] | [nF] | [mH] | [V] | |||
|---|---|---|---|---|---|---|
| 500 | 787.5 | 1.152 | 0.176 | 1.1 | 609,400 | 200 |
| 750 | 621.1 | 1.626 | 3.192 | 0.77 | 182.5 | 200 |
| 1000 | 639.9 | 1.401 | 2.393 | 0.65 | 106.9 | 200 |
Table 2.
Optimal values of electronic components for the single positive monopolar pulse model are presented in the first line and for multiple monopolar pulse model in the second.
Table 2.
Optimal values of electronic components for the single positive monopolar pulse model are presented in the first line and for multiple monopolar pulse model in the second.
| [nF] | [mH] | [V] | ||||
|---|---|---|---|---|---|---|
| 682.4 | 1.287 | 1.287 | - | 0.998 | 57.5 | 400 |
| 682.4 | 1.287 | 1.287 | 171.1 | 0.998 | 57.5 | 366.7 |
Table 3.
Final component value table, of components which were used in the PSpice simulation and prototype emulator.
Table 3.
Final component value table, of components which were used in the PSpice simulation and prototype emulator.
| [nF] | [mH] | [V] | ||||
|---|---|---|---|---|---|---|
| 680 | 1.2 | 1.2 | 175 | 1 | 57.5 | 360 |
Table 4.
The performance summary table displays the root mean square error between measurements on beef liver and mathematical model (), or prototype emulator () or resistor () and mean standard deviation of five measurements on beef liver ().
Table 4.
The performance summary table displays the root mean square error between measurements on beef liver and mathematical model (), or prototype emulator () or resistor () and mean standard deviation of five measurements on beef liver ().
| SET VOLTAGE, REP. F | ||||
|---|---|---|---|---|
| [mA] | [mA] | [mA] | [mA] | |
| 500 V, 1 Hz | 38.5 | 40.3 | 38 | 101.1 |
| 500 V, 4717 Hz | 46.3 | 125.8 | 132.1 | 101.4 |
| 750 V, 1 Hz | 115.1 | 111.6 | 106.2 | 72.6 |
| 750 V, 4717 Hz | 124.7 | 41.4 | 40.7 | 471.4 |
| 1000 V, 1 Hz | 116.1 | 192.7 | 189.5 | 131.6 |
| 1000 V, 4714 Hz | 177 | 55.7 | 58.1 | 705.7 |
| Total RMSE | 108.87 | 356.7 |
© 2020 by the authors. Licensee MDPI, Basel, Switzerland. This article is an open access article distributed under the terms and conditions of the Creative Commons Attribution (CC BY) license (http://creativecommons.org/licenses/by/4.0/).
Share and Cite
MDPI and ACS Style
Pirc, E.; Balosetti, B.; Miklavčič, D.; Reberšek, M. Electronic Emulator of Biological Tissue as an Electrical Load during Electroporation. Appl. Sci. 2020, 10, 3103. https://doi.org/10.3390/app10093103
AMA Style
Pirc E, Balosetti B, Miklavčič D, Reberšek M. Electronic Emulator of Biological Tissue as an Electrical Load during Electroporation. Applied Sciences. 2020; 10(9):3103. https://doi.org/10.3390/app10093103
Chicago/Turabian StylePirc, Eva, Bertrand Balosetti, Damijan Miklavčič, and Matej Reberšek. 2020. "Electronic Emulator of Biological Tissue as an Electrical Load during Electroporation" Applied Sciences 10, no. 9: 3103. https://doi.org/10.3390/app10093103
Note that from the first issue of 2016, this journal uses article numbers instead of page numbers. See further details here.