Modeling of the Vertical Movements of the Earth’s Crust in Poland with the Co-Kriging Method Based on Various Sources of Data


Department of Geoinformation and Cartography, University of Warmia and Mazury in Olsztyn, Oczapowskiego 2, 10-719 Olsztyn, Poland
*
Author to whom correspondence should be addressed.
Appl. Sci. 2020, 10(9), 3004; https://doi.org/10.3390/app10093004
Submission received: 30 March 2020
/
Revised: 17 April 2020
/
Accepted: 21 April 2020
/
Published: 25 April 2020
(This article belongs to the Special Issue GNSS Techniques for Land and Structure Monitoring)
Abstract
:The main aim of this study was to evaluate the applicability of the co-kriging method for modeling the vertical movements of the Earth’s crust based on data acquired with the use of precision leveling techniques and measurements conducted by permanent Global Navigation Satellite System (GNSS) stations. Data were processed with the use of empirical, theoretical, and directional variograms (semivariograms), as well as variogram maps. Large-scale spatial variability was determined using polynomial regression. The relationships between the length of the semi-major and semi-minor axes vs. the root mean square (RMS) and the standard error of the estimate were analyzed. The relationships between the anisotropic direction and the number of lags were determined, and other parameters were calculated. Preliminary data fitting produced non-stationary surfaces. The leveling data were anisotropic, and the GNSS data were isotropic. Nugget effects were observed in both datasets, in particular in the GNSS data. The size of the ellipse was strongly correlated with the RMS and σ (average standard deviation of prediction). The anisotropy angle was determined using the number of lags. Co-kriging was found to not be a suitable method for modeling the vertical movements of the Earth’s crust based on data from various sources. The final result was strongly influenced by the initial dataset. The obtained results show how the method of combining data sets (interpolation, network adjustment) affected the final cartographic model.
1. Introduction
The vertical movements of the Earth’s crust are caused by environmental, tectonic, geological, and climatic changes. Cartographic models of the vertical movements of the Earth’s crust are used in economics, Earth sciences, and reference systems. Data for cartographic models are acquired through the use of direct (geodetic measurements) and indirect (geological, geophysical, geomorphological, and hydrological data) techniques [1,2,3,4,5]. Geodetic datasets differ in their sources, measurement methods, spatial and temporal resolutions, levels of reference, data processing methods, and data trends. Cartographic models are also influenced by the applied interpolation method [6]. The choice of interpolation method is particularly important when different datasets are used [7].
The main aim of this study was to evaluate the applicability of the co-kriging method for modeling the vertical movements of the Earth’s crust based on data acquired with the use of precision leveling techniques and measurements conducted using permanent GNSS stations.
The advancements in measurement techniques, the development of measurement systems with a longer life cycle, and higher spatial and temporal resolution of measurements support the determination of the vertical movements of the Earth’s crust with unprecedented accuracy. The oldest datasets (Figure 1) originated from precision leveling campaigns that were carried out every 20 years. These data were used to develop vertical movement networks. The node points in vertical movement networks are evenly distributed and mutually interconnected. Vertical movements are observed along leveling segments (lines) with a length of several dozen to several hundred meters. The vertical movements of the Earth’s crust are usually observed relative to a point on the Earth’s surface that is fixed or has a “known” velocity. The advantage of this method is that it minimizes the influence of local terrain deformations. Models of the vertical movements of the Earth’s crust based on daily data from permanent Global Navigation Satellite System (GNSS) stations are the most widely used (Figure 1). These movements represent the absolute motion relative to an ellipsoid of revolution. The quality of GNSS data is determined mainly by the station’s operating time (minimum of 3 years) and how data are processed by the system operator. The calculated velocities can represent local movements when GNSS stations are separated by a considerable distance (several dozen kilometers) and when they are not interconnected (do not form a network). The vertical movements of the Earth’s crust are also analyzed based on satellite images, laser measurements, radar interferometry, altimetry measurements, gravimetry missions, and tide gauge data [8,9,10,11,12,13,14].
The combination of leveling data and GNSS data from the permanent stations is difficult to achieve due to various systems and working methods used [15] and the application of various solutions in the process of creating vertical crustal movement models, ranging from mathematical models to geophysical models [16].
The largest possible amount of available data (leveling and GNSS data) should be used to increase the spatial resolution of the network points. Statistical and mathematical methods for adjusting several networks, as well as interpolation techniques, are used for this purpose [17]. All datasets must have a network structure to be processed with the use of statistical methods. As mentioned earlier, vertical movements based on GNSS data do not have a network structure. In our previous study [18], the vertical movements of the Earth’s crust were determined based on GNSS data as relative movements rather than absolute movements. A network structure based on Delaunay triangulation was proposed, where the observations were based on the vertical movements between GNSS stations that constitute triangle vertices [19]. This approach was adopted to adjust the network.
Connecting nodes have to be identified to link several independent networks of vertical movements. A solution to this problem was proposed by [20]. An analysis of unadjusted vertical movement changes on selected leveling lines used to estimate the maximum distance between nodal points and GNSS permanent stations was conducted. Therefore, points from a double-leveling network and a network of GNSS stations ASG EUPOS (Active Geodetic Network - European Position Determination System) can be considered as corresponding to the same nodal point (pseudo-nodal point). These points should less than 10 km apart. Connecting nodes are defined to simultaneously adjust independent networks of vertical movements and to generate a cartographic model of the vertical movements of the Earth’s crust. The model can also be developed with the use of interpolation methods.
In this study, a least-squares collocation was selected as the optimal method due to the use of geophysical data, differences in the spatial and temporal distribution of network points, and the possible presence of anisotropy and data trends. This group of methods involves kriging and its modification, namely co-kriging, which was developed for modeling surfaces based on several datasets. Co-kriging interpolation with a variogram (semivariogram) analysis was deployed in this study. This advanced method supports the evaluation of data during the selection of interpolation algorithm parameters. The relationships between data are modeled to adjust for the effect of extreme values and derive skeleton lines [21,22,23,24]. Variogram analyses are performed to determine the correlations between the location of network points and point values. Variogram analyses support the description of anisotropic directions, the magnitude of nugget effects, and the variance. The selection of the optimal variogram significantly influences the quality of the generated model. An excessive variance could be indicative of low-quality data that requires additional processing. The nugget effect denotes undesirable local extremes in the process of modeling the vertical movements of the Earth’s crust. These extremes have to be reduced or eliminated to obtain an accurate cartographic model. Data analyses also provide information about the homogeneity of datasets, which is particularly important in hybrid models of vertical crustal movements (for example models that rely on leveling data and GNSS data). Statistical analyses are performed before and after interpolation to assess the quality of the model and its applicability for research.
In this study, the information about the relative vertical movements of the Earth’s crust was acquired from precision leveling campaigns and GNSS measurements on the territory of Poland (465 points). Poland is situated in Central Europe, and its landform is influenced by glacial movements and, to a minor extent, plate tectonics and geological events caused mainly by fossil mining. The characteristics of the existing maps (cartographic models) of vertical crustal movements on the territory of Poland are presented in Table 1. None of the existing models describe anisotropy or nugget effects, and none of them combine leveling data with GNSS data.
The obtained results show how the method of combining data sets (interpolation, network adjustment) affects the final cartographic model.
2. Materials and Methods
Four precision leveling campaigns have been carried out in Poland (#1: 1926–1937, #2: 1953–1955, #3: 1974–1982, #4: 1997–2003). Most of the collected data covers the territory of Poland after World War II. The first campaign was weakly documented and the relevant data were not used in this study. The remaining data were used to develop maps of the vertical crustal movements (Table 2, datasets A and B). The vertical movements were determined at points in the double-leveling network (vertical movement network). Successive movements were determined at network points based on data from the second, third, and fourth campaign (Table 2, dataset C), which determined the relative vertical movements of the Earth’s crust based on data from permanent GNSS stations (with a life cycle of 5 years) (Table 2, dataset D). For this article, the first joint alignment of vertical motion networks based on leveling and GNSS data was carried out. (Table 2, dataset E).
All values in the analyzed datasets relate to the same point with a constant velocity. The same adjustment method was used to facilitate the analysis and compare the generated models. Datasets differed in their spatial and temporal resolutions (Figure 2).
The spatial distribution of points in each dataset was determined by the density of the double-leveling networks (A, B, C) and the location of permanent GNSS stations (D). Due to the shape of the leveling network, dataset A was composed of sparsely distributed points on leveling lines. The remaining datasets had a higher spatial resolution. Datasets C and E were used as the reference.
A fully functional model can be derived from a limited set of representative data with the use of kriging interpolation [30]. The interpolated values are determined based on the correlations between the value and the location of the analyzed points. Kriging differs from other interpolation methods in that it relies on interpolation algorithms to identify, describe, and eliminate trends from representative data [23]. Kriging is a non-uniform method. The same data can be processed in many ways to produce radically different results that highlight and expose trends and information according to the preset parameters. Kriging methods can be classified based on the sampling interval for interpolation (local kriging, global kriging) and their application (ordinary kriging, block kriging, indicator kriging, and co-kriging, i.e., kriging with an additional variable). Simple kriging, ordinary kriging, and universal kriging methods are the most popular. Similar to least-squares collocation, kriging relies on the assumptions of the least-squares adjustment method. In kriging, the estimated value is expressed as the weighted average of the observation vector, and weights are assigned based on the distance between observations and the distance between observations and the location of the interpolated points [23]. This solution is used to identify significant discontinuities and their parameters, to determine the predicted value, and to evaluate the estimated value (variance estimation). In co-kriging, various datasets can be merged and analyzed in terms of their characteristic features.
The relationships between random variables are typically determined with the use of variant–covariant matrices. The structure of the matrix defines the strength of the correlations between variables based on the similarities between points. In co-kriging, parameters are selected with the use of a variogram. A variogram [31] describes the spatial differentiation of data. A variogram or a semivariogram, a simplified version of a variogram, is used to describe the spatial structure of data, and it provides information about the range, strength, and direction of the correlations between data. A semivariogram is half a variogram, where the semivariance increases with an increase in distance [32]. Semivariance increases to a certain point, after which point, it is stabilized. The maximum variance of a dataset is represented by a sill, which is used in large-scale studies to describe pairs of distant points. If a dataset contains random errors, measurement errors, or other inconsistencies, the semivariance increases rapidly for small distances (semivariogram limits), and this increase is referred to as the nugget effect [31]. A variogram is optimized with the use of lag intervals. Every dataset is described using an empirical variogram that is not linear due to the presence of random variables in the dataset. A variogram can only be used in interpolation if it is described using an environmental function. Predefined functions are fit to data with an empirical variogram. A highly irregular dataset (with many random variables) can be described with several functions. Typical predefined functions include the nugget effect, spherical function, exponential function, Gaussian function, linear function, and power function [33].
Datasets can be divided into the following categories based on the randomness of the data:
- (a)
- Isotropic: On isotropic surfaces, changes in attribute values are influenced by distance but not by direction; therefore, attribute values change identically in all directions.
- (b)
- Anisotropic: On anisotropic surfaces, changes in attribute values are influenced by both distance and direction; therefore, attribute values change irregularly in space and they differ in various directions.
Anisotropic surfaces can be further divided into:
- (a)
- Geometric anisotropy: Attribute values change similarly in all directions but vary with distance; therefore, the same variability is achieved in different directions when points are separated by a varied distance.
- (b)
- Zonal anisotropy: Variability is not regularly distributed in space; this type of anisotropy results from data trends.
The type and parameters of anisotropic datasets are identified with directional variograms. A variogram map presents an alternative to several directional variograms. The analyzed area is covered by a single semivariance map. The anisotropic direction is described by generating variograms for angular segments with a given tolerance. The tolerance defines the angle at which points will be analyzed relative to the defined direction.
3. Calculation
3.1. Variogram Maps for Evaluating Dataset Coherence: Anisotropy and Isotropy of Data
Datasets (A, B, C, D, E), as well as their combinations (AB, BD, BD, DB, F, G), were analyzed using co-kriging to achieve the main research objective. Datasets (AB, BA, BD, DB) were merged using co-kriging. The first letter denotes the initial dataset in the co-kriging. Set F contained datasets A and B as a single file, and dataset G contained datasets B and D. All datasets were analyzed for the presence of trends, and their coherence was evaluated. Trends were determined using polynomial regression. The degree of the polynomial was selected empirically by analyzing the coefficient of determination R2. The results of the coherence analysis are presented in the semivariogram maps in Figure 3.
An analysis of the semivariogram maps (Figure 3) revealed anisotropy of the data in datasets where vertical movements were based on leveling data. Anisotropy was determined in datasets A and B, and in merged datasets (C, AB, and BA). Dataset F was the only exception, which indicates that leveling data were influenced by an additional external factor. In paper [34] autors demonstrated that adjustments introduced to leveling data, in particular normal adjustments, could be responsible for such external effects. Dataset D (vertical movements based only on GNSS data) was isotropic, similar to datasets BD and DB, where vertical movements from both sources were used. The above implies that the even distribution of GNSS stations significantly influenced the data coherence. However, this observation was not confirmed by an analysis of dataset G or the combined adjustment of the network of vertical movements based on leveling data and GNSS data, which indicates that leveling data exerted a considerable effect on the adjustment process (set E). The weights calculated for each observation using inverse distance weighing played a more important role in this process [18]. The anisotropic direction varied across the analyzed datasets. Datasets A and AB had a northeastern orientation, whereas the remaining datasets (B, C, E, BA, G) had a northwestern to western orientation. The variation was higher around the central point of each dataset, which points to differences in the values of neighboring points (nugget effect). The above resulted from the merger of datasets, where vertical movements at the same points or proximal points were determined in two different processes (which is well illustrated in dataset F). This observation can also be attributed to a local increase in vertical movements caused by mining operations and geological features.
3.2. Empirical Variograms and the Selection of Theoretical Variograms
The analysis of data anisotropy supported the determination of the major anisotropic directions (Figure 3) and the selection of data during interpolation.
The empirical semivariogram was used to determine similarities in the point values relative to their distance and orientation. The major directions and the range of anisotropy were defined for each dataset to assign theoretical variograms to empirical variograms.
Each dataset was analyzed using a directional variogram in the major anisotropic directions (Figure 4). Figure 4 presents the examples of variograms: fluctuations in the variance (Figure 4AB), greatest differences between the minimum and maximum values (Figure 4G), nugget effect (Figure 4BD), and isotropic collection (Figure 4D). The empirical variogram was approximated with a linear function. The fluctuations in the variance were observed in datasets A, B, C, AB, BA, E, and G. The greatest differences between the minimum and maximum values were observed in datasets AB, BD, F, and G, which confirms data anisotropy (Figure 3). The model’s behavior pointed to a nugget effect in datasets BA, D, BD, DB, and F. These datasets were classic examples of the nugget effect. Datasets D, BD, and F were isotropic despite considerable fluctuations in the variance.
3.3. Calculation of the Interpolation Parameters
The interpolation parameters were calculated based on the adopted theoretical variograms. The length and direction of semi-major and semi-minor axes in the ellipse, number of sectors, partial sills, interpolation points in sectors, and maximum and minimum neighbors were analyzed in each set. Standardized root mean square (RMS) and the average standard deviation of prediction (σ) were the main selection criteria. The relationships between changes in the semi-major and semi-minor axes vs. RMS and σ are presented in Figure 5 and Figure 6, respectively. The values of RMS and σ were closest to 1 when the semi-major axis and the semi-minor axis were increased six-fold. The influence of the number of lags on the values of the direction, partial sill, predicted value, RMS, and σ for dataset A is presented in Figure 7. The selection of four sectors in all datasets supported the calculation of the remaining parameters.
The value of RMS was stabilized with a multiplier higher than 10 (Figure 6). The direction changed in a non-continuous manner with an increase in the number of lags.
The values of the nugget effect, anisotropy, direction, and partial sill in each dataset are presented in Table 3.
The values in Table 3 confirm the anisotropy and the nugget effect. Datasets A and E were the most anisotropic, which points to the presence of factors that strongly influenced the vertical movements. Minor nugget effects were observed in datasets A, B, C, and E (proximal points with different values of vertical movements were rarely encountered), which could be attributed to the combined adjustment of data. The nugget effect was greater in dataset D, which could be explained by the presence of GNSS stations where vertical movements differed considerably from those in other stations for geological and technical reasons. In datasets merged using co-kriging, anisotropy was observed only when vertical movements were based on leveling data only. Datasets were isotropic in the remaining two cases. The nugget effect was nearly four times greater in dataset BD than in dataset DB. Semivariance values were highest in the dispersed datasets A and E.
4. Results
The developed datasets and the calculated parameters were used in the co-kriging interpolation. The resulting models (Figure 8) present the relative vertical movements of the Earth’s crust in Poland from each dataset.
Cartographic models were evaluated visually. Model C was compared with model AB, and models BD and DB were compared with model E. Model AB was highly influenced by dataset A, and it was characterized by a low correlation with model C. Model BA was highly influenced by dataset B, and it was highly correlated with dataset C. Models BD and DB were highly correlated with model E, and they were highly influenced by datasets B and D, respectively. Model BD was more correlated with model B, and model DB was more correlated with model D. The merged dataset F (A + B) was also analyzed relative to model C, and the merged dataset G (B + D) was analyzed relative to model E. Dataset F was more correlated with dataset C than datasets AB and BA. Model G was relatively well correlated with dataset E and dataset BA.
5. Discussion
An analysis of datasets containing information about the vertical movements of the Earth’s crust in the territory of Poland and the resulting models revealed that datasets based on leveling data were anisotropic. The anisotropic direction differed across the evaluated datasets, and most datasets had a northwestern orientation. Anisotropy was confirmed using statistical analyses [34] of datasets A and B, which revealed unidentified disruptions. Nugget effects were identified in the analysis performed using a directional variogram. Nugget effects were detected in datasets where neighboring points had significantly different values (datasets F and D). These findings indicate that vertical movements calculated based on GNSS data differed from those determined based on leveling data (for proximal points), or even differed considerably within dataset D containing GNSS data only. The above could point to data errors or external influences, including anthropogenic or geophysical factors [35]. The number of lags significantly affected the anisotropy angle (Figure 7). The values of RMS and σ were stabilized when the length of both semi-axes of the ellipse increased several-fold. Models developed based on simultaneously adjusted data (C and E) were characterized by a better distribution of σ (Figure 9).
Models C and E were characterized by smaller variations and a smaller number of isolines with gentle curves, which could be attributed to data fitting during the adjustment procedure. In the remaining models that were generated using co-kriging, isolines differed from those noted in the reference models (C and E). The above was particularly visible in the models developed based on dataset A (models A and AB). Even greater variations were noted in the models created from datasets that had been merged before interpolation. These models were characterized by considerable nugget effects. The values of the standard error of the estimate for the analyzed datasets are presented in Table 4.
The average standard error of the estimate was the highest in datasets D, F, and G. These datasets contained points that deviated from the remaining values of σ. The presence of outliers could mainly be attributed to differences in the values of proximal points, which was confirmed by the presence of nugget effects.
6. Conclusions
Co-kriging is an advanced interpolation method that supports additional evaluations of datasets and limits the influence of factors, such as data anisotropy, data trends, and nugget effects. These considerations are important in analyses of dispersed data (GNSS) that are affected by a station’s geological configuration and “artificially” adjusted leveling data.
The selection of interpolation parameters is largely subjective. The interpolated surface was non-stationary in all datasets. An analysis of the correlations between the semi-major and semi-minor axes of the ellipse vs. RMS and σ produced satisfactory results. The anisotropic direction was correlated with the number of lags, and indirectly, with the minimum possible values of RMS and σ.
The leveling data were anisotropic. The nugget effect was highest for GNSS data. A high nugget effect led to smoother estimates, and consequently, an increase in the value of RMS (Figure 5).
Numerous datasets can be combined using co-kriging. The initial dataset significantly influences the final model. Models AB, BA, DB, and DB clearly illustrated this trend. A larger amount of data in the successive set did not play a role. The results of this study confirmed that co-kriging is a non-uniform method and that the same initial datasets could produce different models. The mean standard error was lowest for dataset E (combined adjustment of vertical movements based on leveling data and GNSS data).
Models of the vertical movements of the Earth’s crust generated using co-kriging with the use of varied datasets (method and time of measurement) have different isolines. From a statistical point of view, models based on simultaneously adjusted datasets best fit the data. Models generated from data that are merged into a single set are more correlated with the reference models than those based on datasets that are combined using co-kriging. The merger of anisotropic and isotropic datasets produces isotropic datasets. The use of data from various sources can limit the influence of anisotropy on the model’s quality.
The anisotropic directions, data trends, and nugget effects have to be taken into consideration in cartographic models of vertical movements. The application of a model based on GNSS data only will not produce reliable results in analyses evaluating the effects of glacial isostatic adjustment (GIA) (Figure 8). This study demonstrated that co-kriging did not produce satisfactory results when datasets relating to the vertical movements of the Earth’s crust were combined. Several networks had to be simultaneously adjusted before the analysis to produce the desired outcome.
In the future, attempts will be made to determine the causes of the above-average standard error of the estimate in the analyzed datasets.
Author Contributions
K.K.—Conceptualization, Formal analysis, Methodology, Writing—review and editing; A.M.K.—Data curation, Software, Visualization, Writing—review and editing; A.C.—Software, Visualization. All authors have read and agreed to the published version of the manuscript.
Conflicts of Interest
The authors declare no conflict of interest.
References
- Douglas, B.C. Global sea level rise. J. Geophys. Res. 1991, 96, 6981–6992. [Google Scholar] [CrossRef] [Green Version]
- Billiris, H.; Paradissis, D.; Veis, G.; England, P.; Featherstone, W.; Parsons, B.; Cross, P.; Rands, P.; Rayson, M.; Sellers, P.; et al. Geodetic determination of tectonic deformation in central Greece from 1900 to 1988. Nature 1991, 350, 124–129. [Google Scholar] [CrossRef]
- Hooper, A.; Segall, P.; Zebker, H. Persistent scatterer interferometric synthetic aperture radar for crustal deformation analysis, with application to Volcán Alcedo, Galápagos. J. Geophys. Res. Solid Earth 2007, 112. [Google Scholar] [CrossRef] [Green Version]
- Blewitt, G.; Altamimi, Z.; Davis, J.; Gross, R.; Kuo, C.; Lemoine, F.; Moore, A.; Neilan, R.; Plag, H.; Rothacher, M.; et al. Geodetic Observations and Global Reference Frame Contributions to Understanding Sea-Level Rise and Variability. In Understanding Sea Level Rise and Variability; Church, J.A., Woodworth, P.L., Wilson, S., Aarup, T., Eds.; Wiley: Chichester, UK, 2010; pp. 256–284. [Google Scholar]
- Zhu, X.; Wang, R.; Sun, F.; Wang, J. A Unified Global Reference Frame of Vertical Crustal Movements by Satellite Laser Ranging. Sensors 2016, 16, 225. [Google Scholar] [CrossRef] [Green Version]
- Bogusz, J.; Kłos, A.; Grzempowski, P.; Kontny, B. Modelling the Velocity Field in a Regular Grid in the Area of Poland on the Basis of the Velocities of European Permanent Stations. Pure Appl. Geophys. 2014, 171, 809–833. [Google Scholar] [CrossRef] [Green Version]
- Fuhrmann, T.; Caro Cuenca, M.; Knöpfler, A.; Van Leijen, F.J.; Mayer, M.; Westerhaus, M.; Hansen, R.; Heck, B. Estimation of small surface displacements in the Upper Rhine Graben area from a combined analysis of PS-InSAR, levelling and GNSS data. Geophys. J. Int. 2015, 203, 614–631. [Google Scholar] [CrossRef] [Green Version]
- Hofmann-Wellenhof, B.; Lichtenegger, H.; Collins, J. Global Positioning System: Theory and Practice; Springer Science & Business Media: Wien, Austria, 2012. [Google Scholar]
- Bürgmann, R.; Rosen, P.A.; Fielding, E.J. Synthetic aperture radar interferometry to measure Earth’s surface topography and its deformation. Annu. Rev. Earth Planet. Sci. 2000, 28, 169–209. [Google Scholar] [CrossRef]
- Pearlman, M.R.; Degnan, J.J.; Bosworth, J.M. The international laser ranging service. Adv. Space Res. 2002, 30, 135–143. [Google Scholar] [CrossRef]
- Campbell, J. Very Long Baseline Interferometry—A high precision tool for geodesy and astrometry. C. R. Acad. Sci.-IV-Phys. 2000, 1, 1255–1265. [Google Scholar] [CrossRef]
- Altamimi, Z.; Sillard, P.; Boucher, C. ITRF2000 A new release of the International Terrestrial Reference Frame for earth science applications. J. Geophys. Res. 2002, 107, ETG-2. [Google Scholar] [CrossRef] [Green Version]
- Matsumura, S.; Murakami, M.; Imakiire, T. Concept of the New Japanese Geodetic System; Bulletin of the Geographical Survey Institute: Tokyo, Japan, 2004; Volume 51, pp. 1–9. [Google Scholar]
- Sacher, M.; Ihde, J.; Liebsch, G.; Mäkinen, J. EVRF07 as Realization of the European Vertical Reference System. Presented at the Symposium of the IAG Sub-Commission for Europe (EUREF), Brussels, Belgium, 18–21 June 2008; Volume 68, pp. 35–50. [Google Scholar]
- Kenyeres, A.; Jambor, T.; Caporali, A.; Drosč_cak, B.; Garayt, B.; Georgiev, I.; Jumare, I.; Nagl, J.; Pihlak, P.; Ryczywolski, M. Integration of the EPN and the dense national Permanent Networks. Presented at EUREF Symposium, Budapest, Hungary, 29–31 May 2013. [Google Scholar]
- Ågren, J.; Svensson, R. Postglacial Land Uplift Model and System Definition for the New Swedish Height System RH 2000; Reports in Geodesy and Geographical Information Systems; Lantmäteriverket: Gävle, Sweden, 2007.
- Vestøl, O. Determination of postglacial land uplift in Fennoscandia from leveling, tide-gauges and continuous GPS stations using least squares collocation. J. Geod. 2007, 80, 248–258. [Google Scholar] [CrossRef]
- Kowalczyk, K.; Rapiński, J. Robust network adjustment of vertical movements with GNSS data. Geofizika 2017, 34, 45–65. [Google Scholar] [CrossRef]
- Kowalczyk, K.; Bogusz, J.; Figurski, M. The analysis of the selected data from Polish Active Geodetic Network stations with the view on creating a model of vertical crustal movements. In Proceedings of the 9th International Conference “Environmental Engineering”, Vilnius, Lithuania, 22–23 May 2014; ISBN 978-609-457-640-9. [Google Scholar] [CrossRef] [Green Version]
- Bednarczyk, M.; Kowalczyk, K.; Kowalczyk, A.M. Identification of pseudo-nodal points on the basis of precise leveling campaigns data and GNSS. Acta Geodyn. Geomater. 2018, 15, 5–16. [Google Scholar] [CrossRef] [Green Version]
- Oliver, M.A.; Webster, R. Kriging: A method of interpolation for geographical information systems. Int. J. Geogr. Inf. Syst. 1990, 4, 313–332. [Google Scholar] [CrossRef]
- Li, X.; Cheng, G.; Lu, L. Comparison of spatial interpolation methods. Adv. Earth Sci. 2000, 3, 208. [Google Scholar]
- El-Sheimy, N.; Valeo, C.; Habib, A. Digital Terrain Modeling: Acquisition, Manipulation, and Applications; Artech House: Boston, MA, USA, 2005. [Google Scholar]
- Yilmaz, H.M. The effect of interpolation methods in surface definition: An experimental study. Earth Surf. Process. Landf. J. Br. Geomorphol. Res. Group 2007, 32, 1346–1361. [Google Scholar] [CrossRef]
- Wyrzykowski, T. Map of Recent Absolute Velocities of Vertical Movements the Earth’s Crust Surface on the Territory of Poland 1:2,500,000; Instytut Geodezji i Kartografii: Warszawa, Poland, 1971. [Google Scholar]
- Wyrzykowski, T. New Determination of the Speed of Modern Vertical Movements of the Earth’s Crust Surface in Poland; Instytut Geodezji i Kartografii: Warszawa, Poland, 1987; Volume 34, pp. 41–64. [Google Scholar]
- Kowalczyk, K. Determination of land uplift in the area of Poland. In Proceedings of the 6th International Conference Environmental Engineering, Vilnius, Lithuania, 26–27 May 2005; pp. 903–907. [Google Scholar]
- Kontny, B.; Bogusz, J. Models of vertical movements of the Earth crust surface in the area of Poland derived from leveling and GNSS data. Acta Geodyn. Geomater. 2012, 9, 331–337. [Google Scholar]
- Kowalczyk, K. The creation of a model of relative vertical crustal movement In the Polish territory on the basis of the data from Active Geodetic Network EUPOS (ASG EUPOS). Acta Geodyn. Geomater. 2015, 12, 215–225. [Google Scholar] [CrossRef]
- Maroufpoor, S.; Bozorg-Haddad, O.; Chu, X. Geostatistics: Principles and methods. In Handbook of Probabilistic Models; Samui, P., Bui, D.T., Chakraborty, S., Deo, R.C., Eds.; Butterworth-Heinemann: Oxford, UK, 2020; Chapter 9; pp. 229–242. [Google Scholar]
- Atkinson, P.M.; Lloyd, C.D. Geostatistical Models and Spatial Interpolation. In Handbook of Regional Science; Fischer, M.M., Nijkamp, P., Eds.; Springer: Berlin/Heidelberg, Germany, 2019; pp. 1–15. [Google Scholar] [CrossRef]
- Pajak, K.; Blaszczak-Bak, W.; Sobieraj, A. Evaluation of the semivariogram selection on the kriging interpolation. In Proceedings of the International Multidisciplinary Scientific GeoConference Surveying Geology and Mining Ecology Management, SGEM, Albena, Bulgaria, 18–24 June 2015; Volume 2, pp. 235–246. [Google Scholar]
- Urbański, J. “Gis in Enviroinmental Sciences (GIS w Badaniach Przyrodniczych)”; Centrum GIS, Uniwersity of Gdansk: Gdansk, Poland, 2008; pp. 230–232. ISBN 978-83-7326-516-5. [Google Scholar]
- Kowalczyk, K.; Rapiński, J. Evaluation of levelling data for use in vertical crustal movements model in Poland. Acta Geodyn. Geomater. 2013, 10, 401–410. [Google Scholar] [CrossRef] [Green Version]
- Watson, C.; Tregoning, P.; Coleman, R. Impact of solid Earth tide models on GPS coordinate and tropospheric time series. Geophys. Res. Lett. 2006, 33. [Google Scholar] [CrossRef] [Green Version]
Figure 1.
Leveling network (blue triangles) and distribution of GNSS stations (red frames). Source: mapy.geoportal.gov.pl.
Figure 1.
Leveling network (blue triangles) and distribution of GNSS stations (red frames). Source: mapy.geoportal.gov.pl.
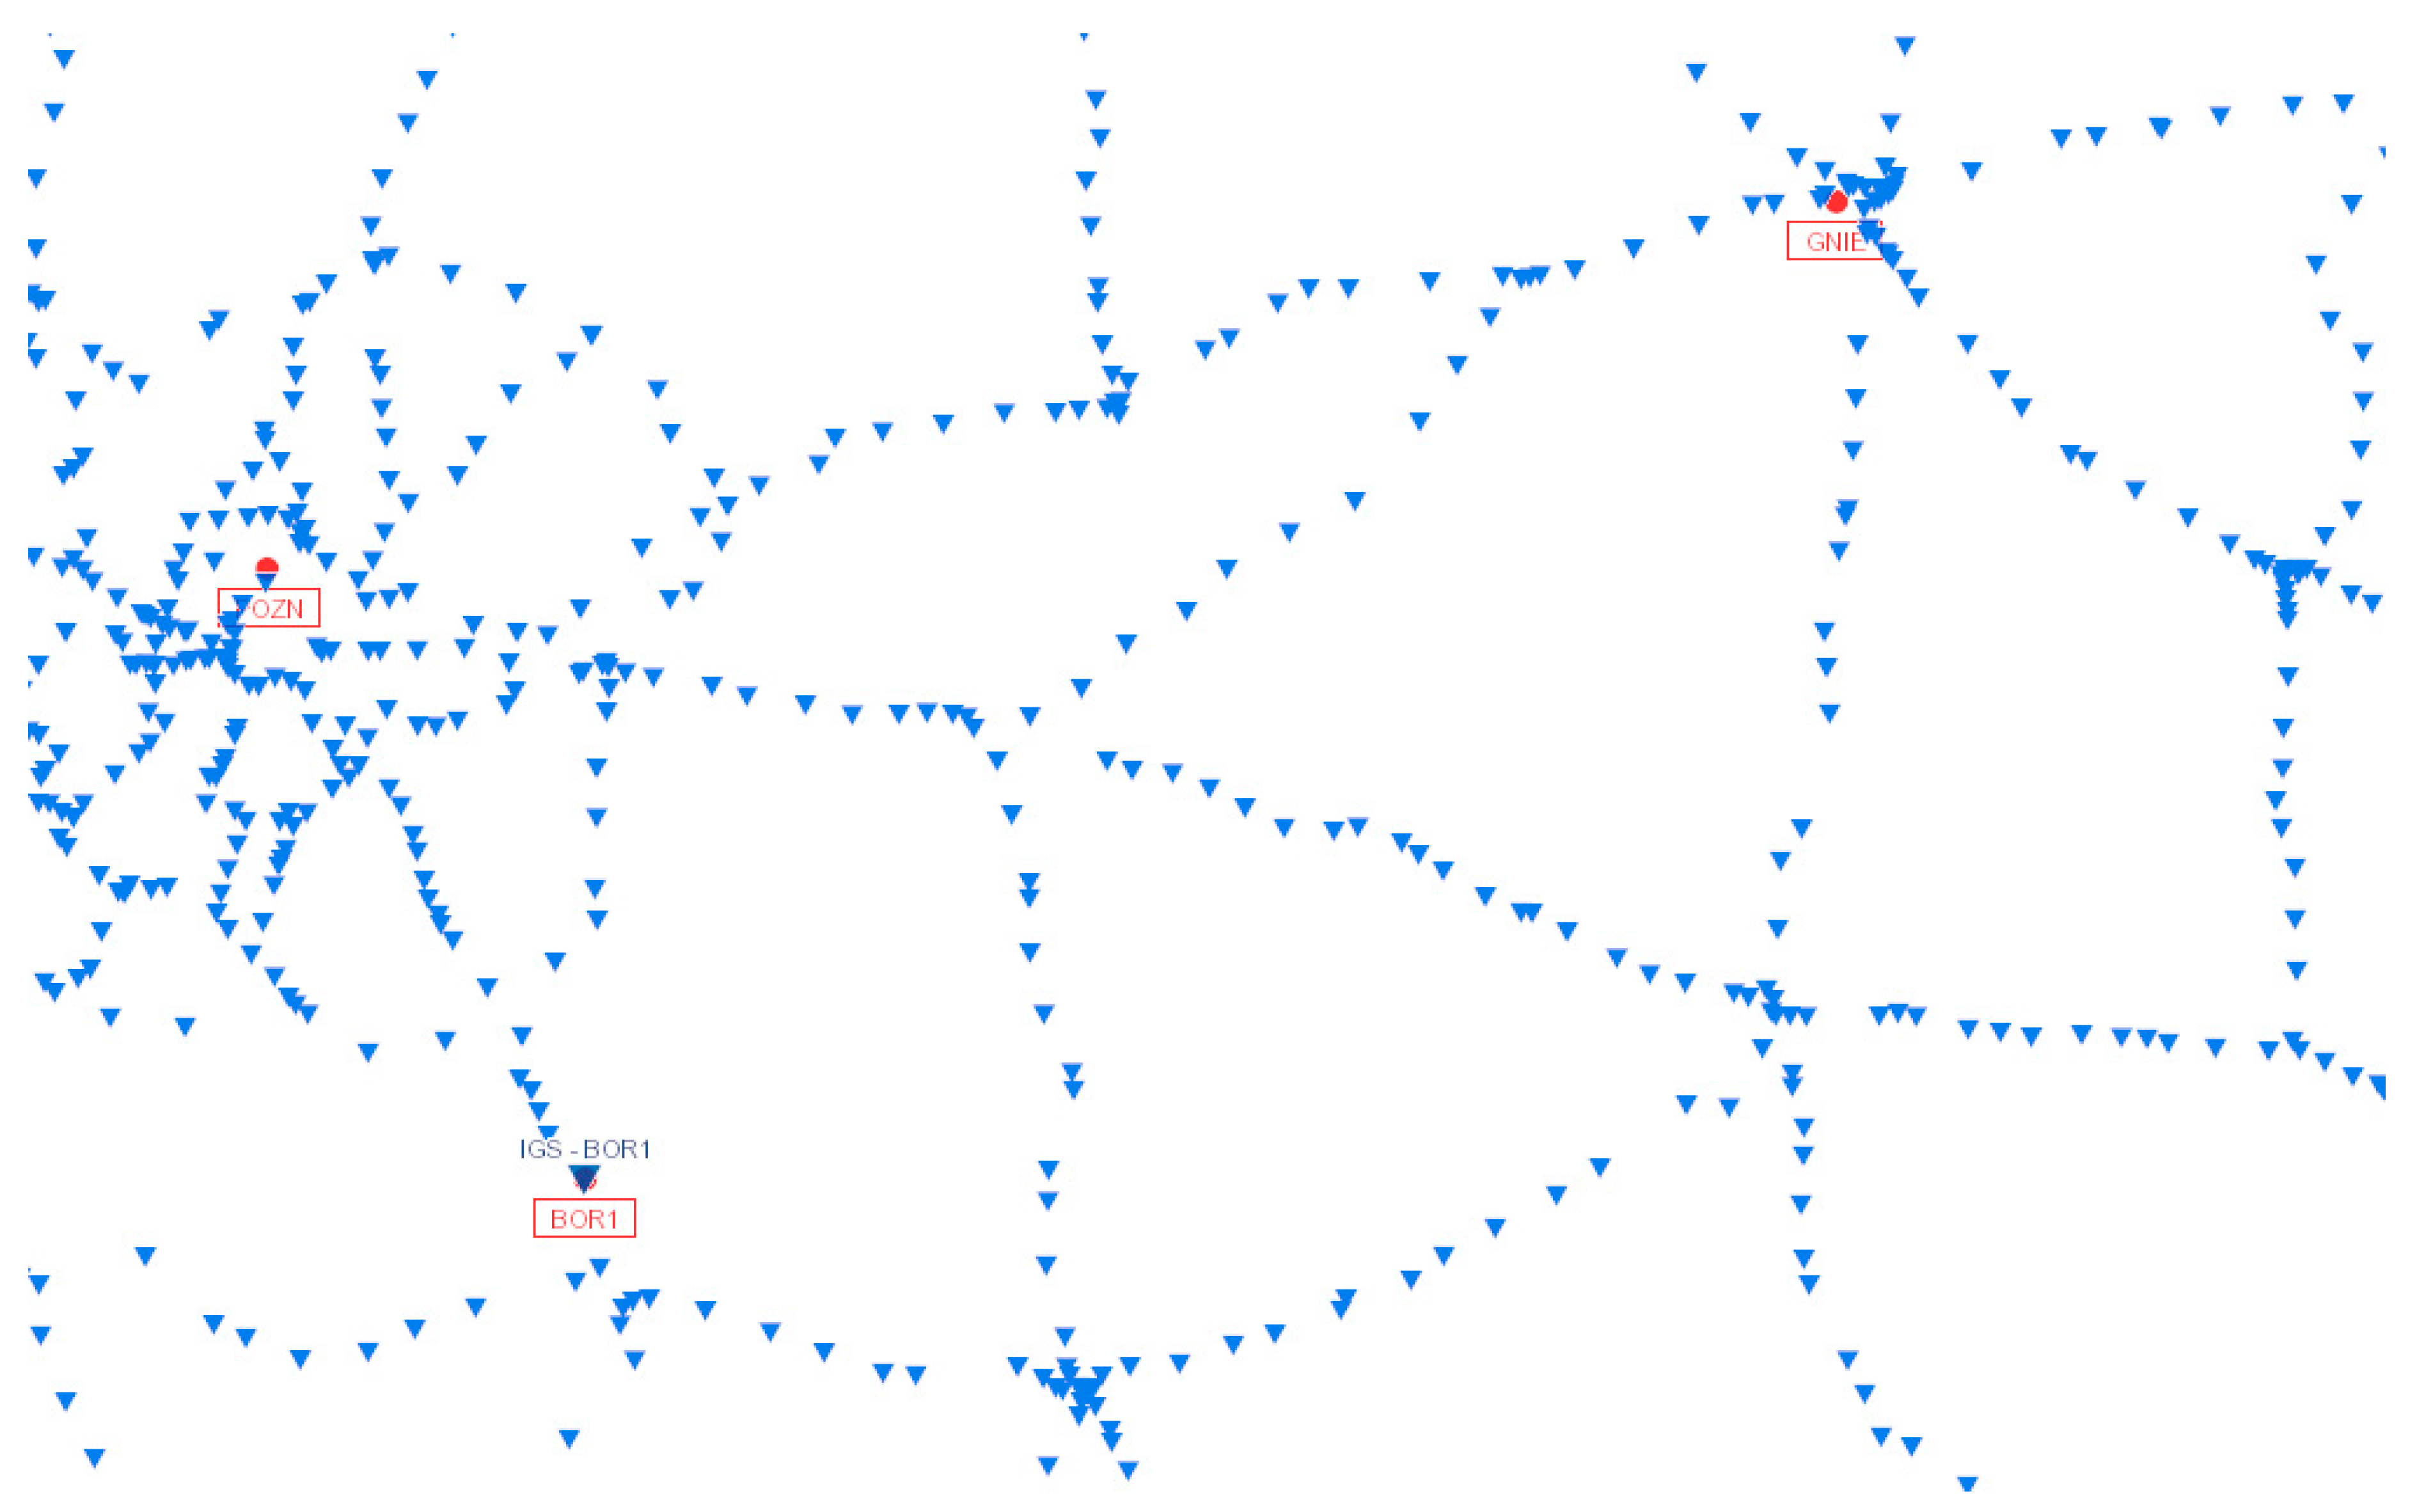
Figure 2.
Graphical presentation of the point distributions of the datasets.
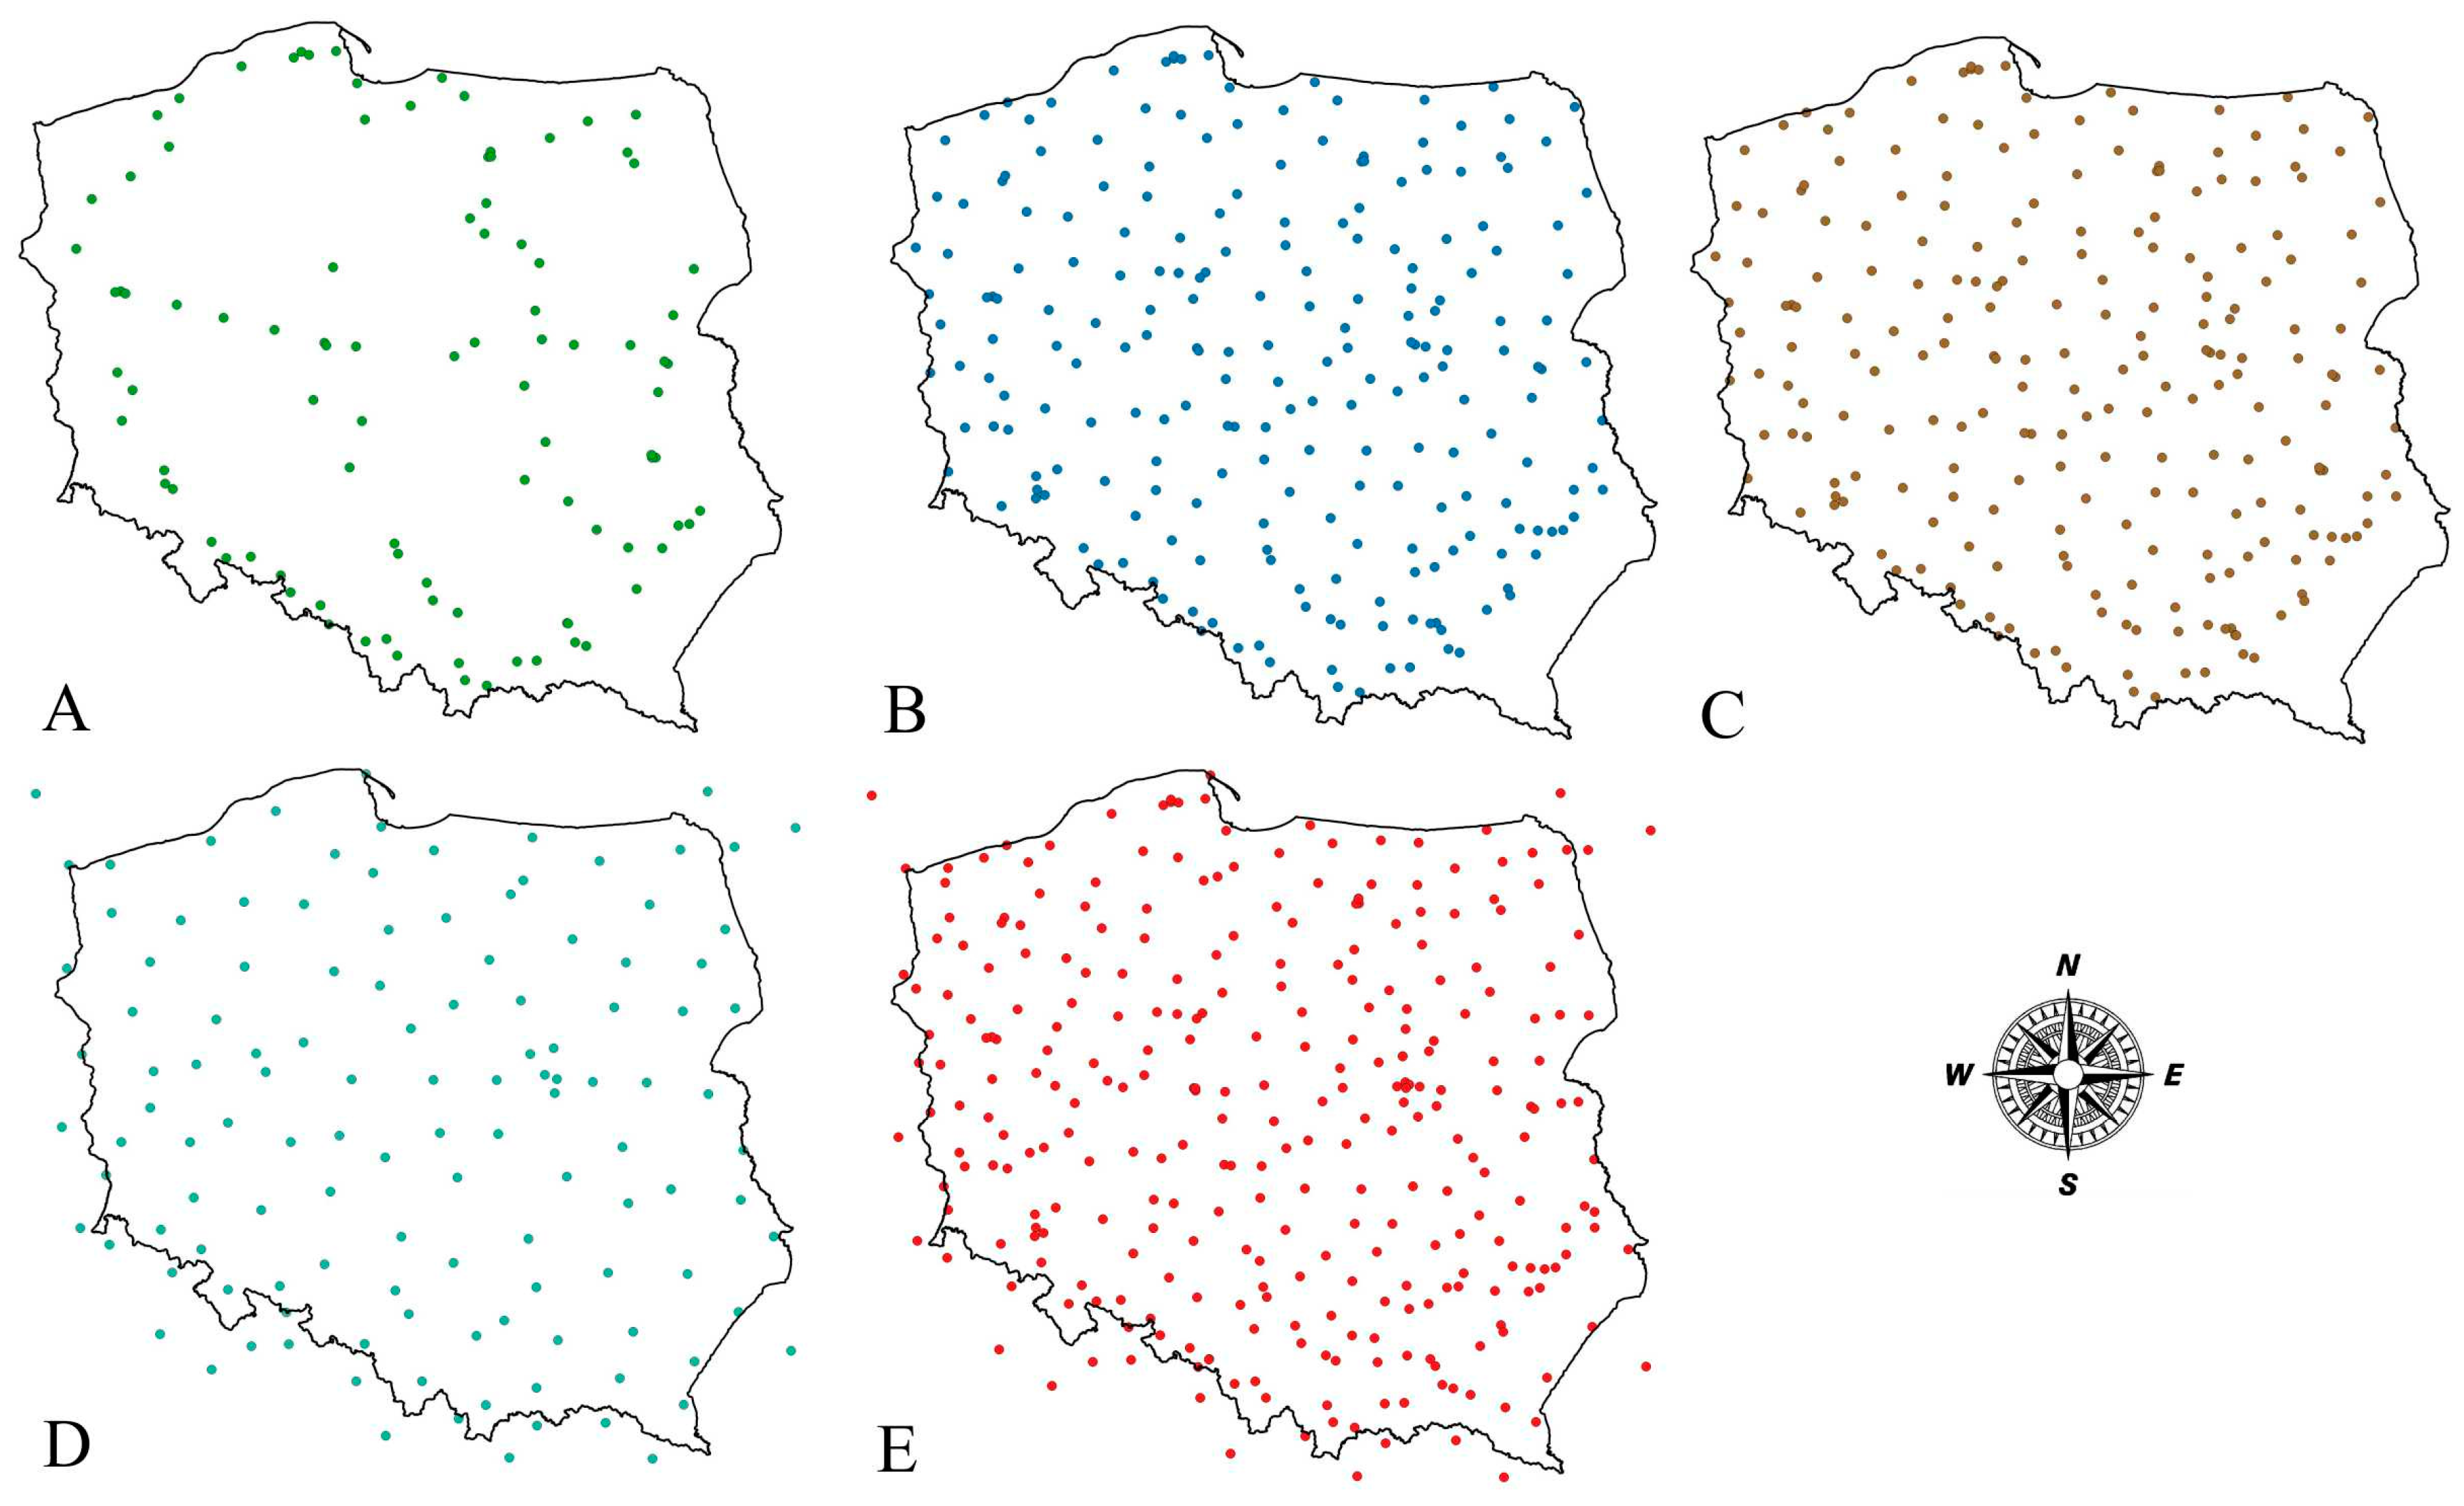
Figure 3.
Semivariogram maps for datasets A, B, C, D, E, AB, BA, BD, DB, F, and G.
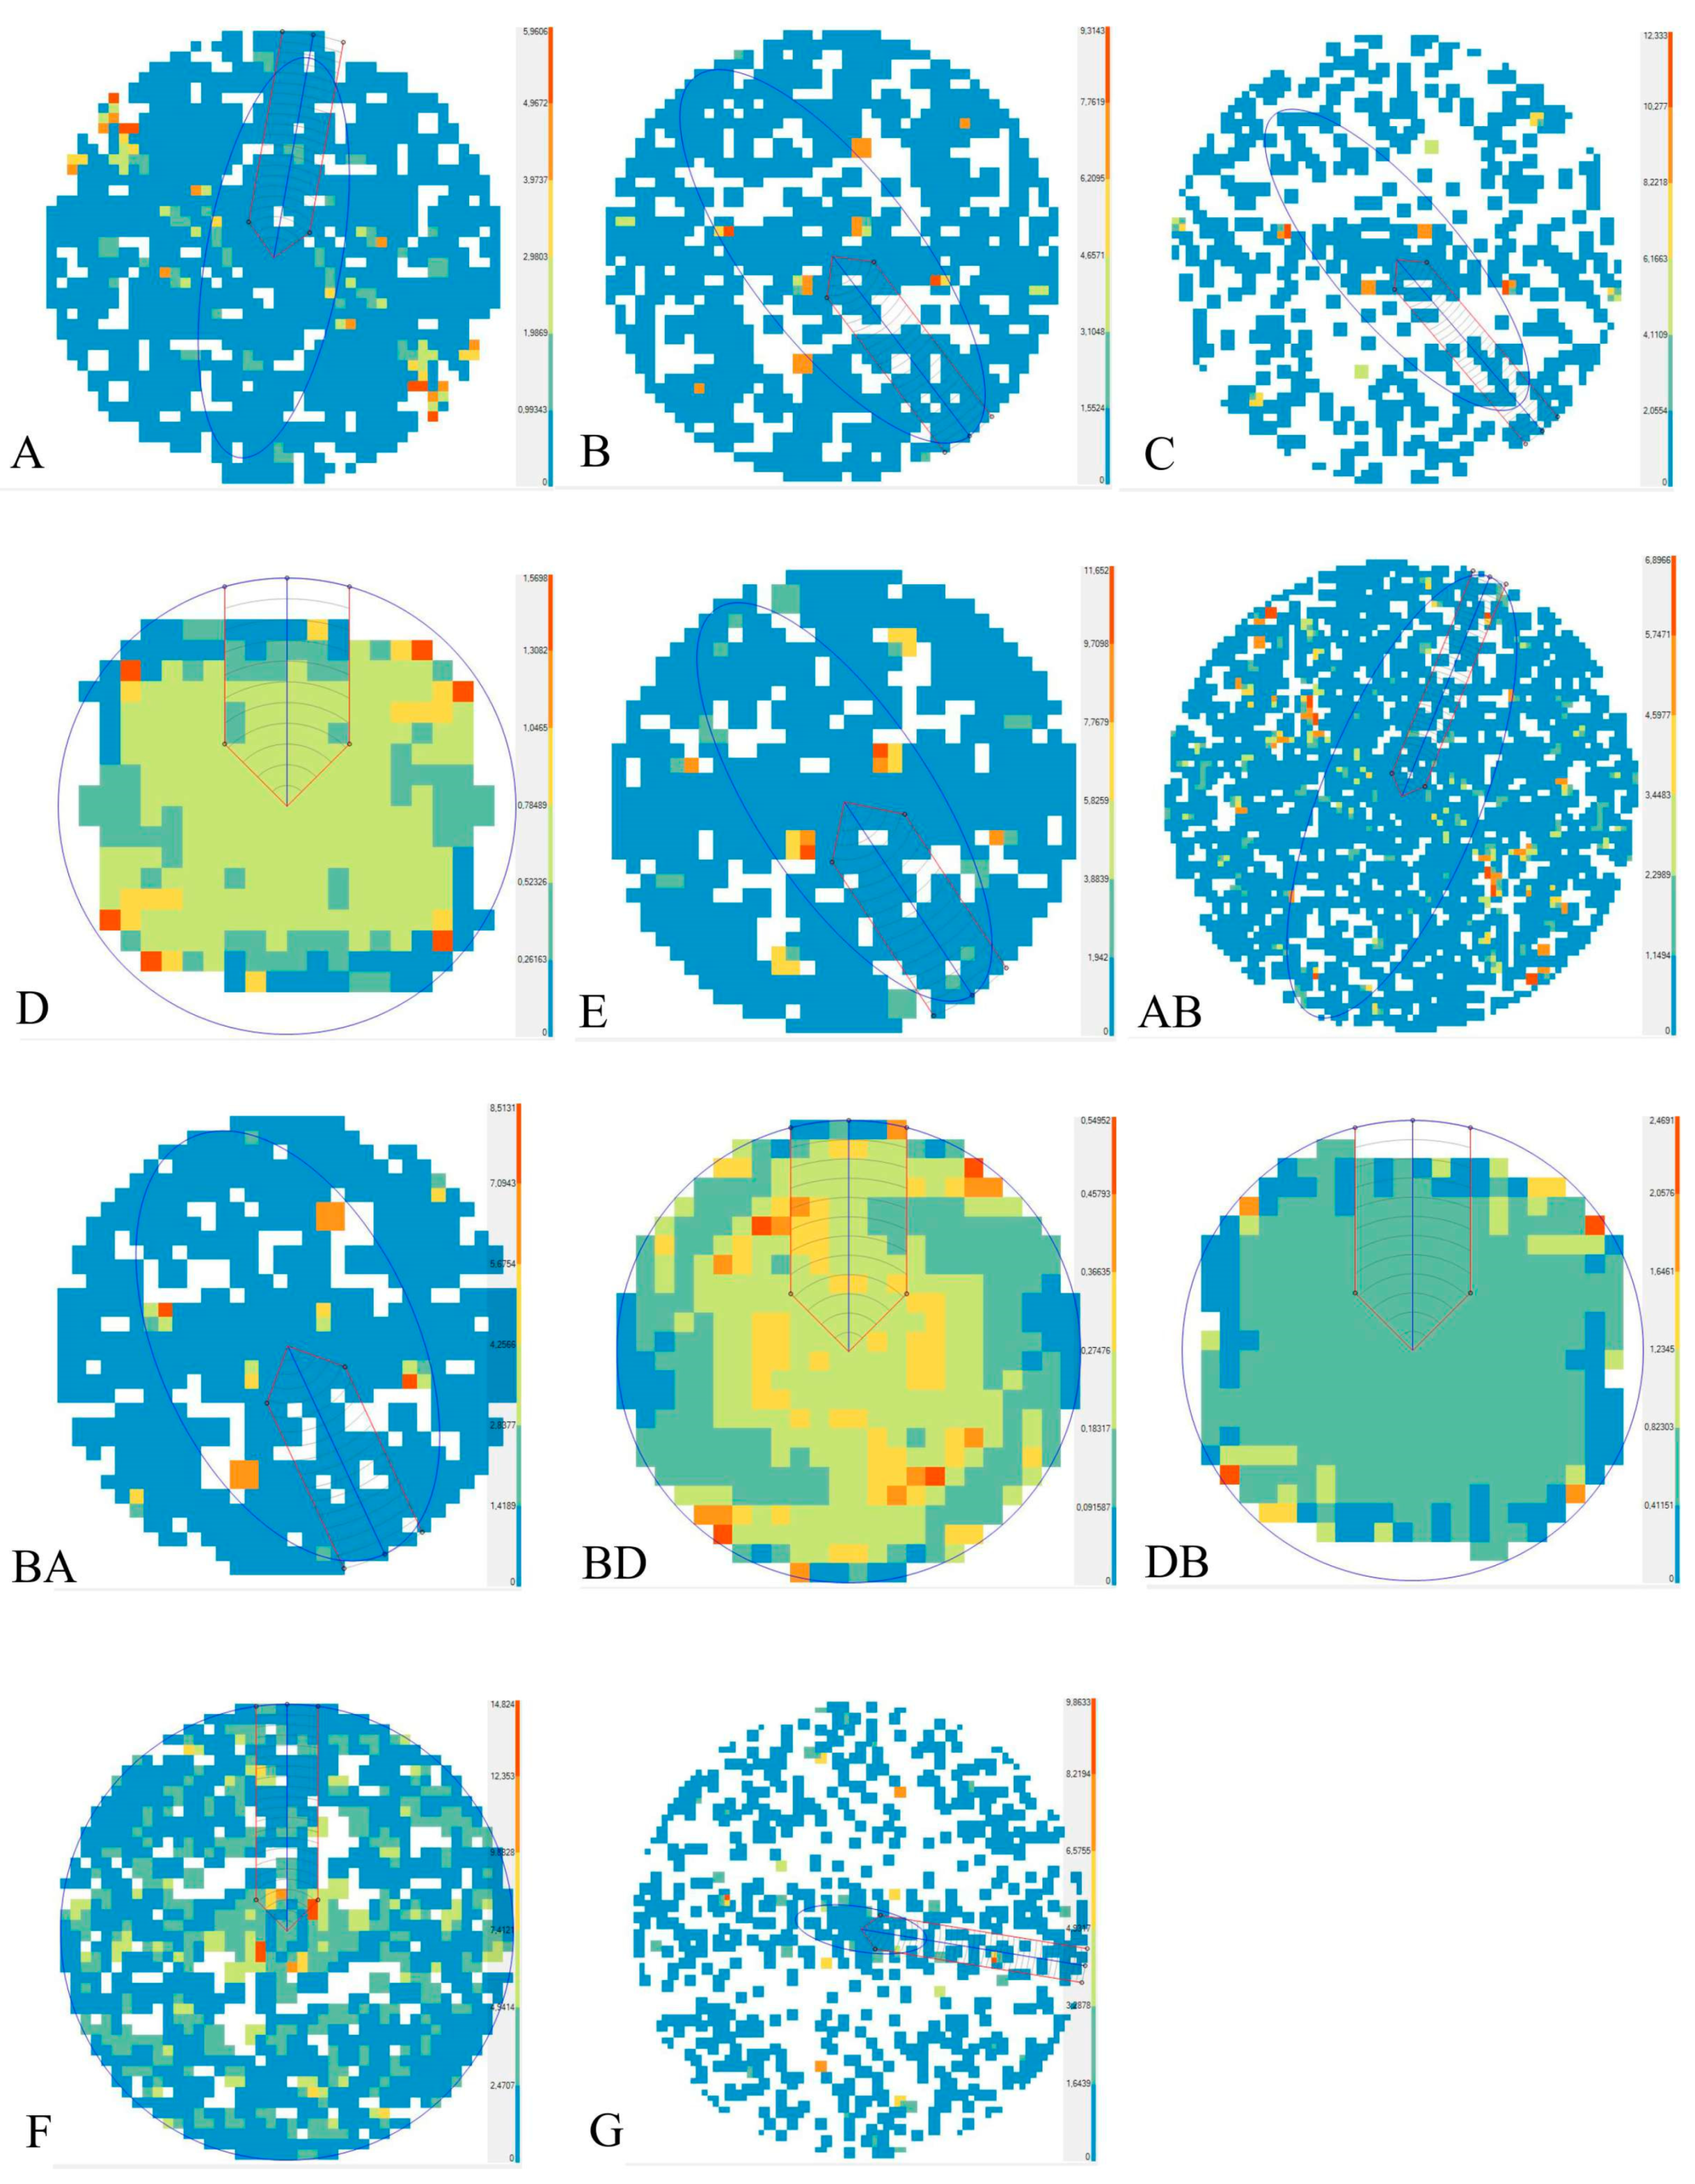
Figure 4.
Selected examples of directional variograms (empirical and theoretical), AB—fluctuations in the variance, G—greatest differences between the minimum and maximum values, BD—nugget effect, D—isotropic collection.
Figure 4.
Selected examples of directional variograms (empirical and theoretical), AB—fluctuations in the variance, G—greatest differences between the minimum and maximum values, BD—nugget effect, D—isotropic collection.
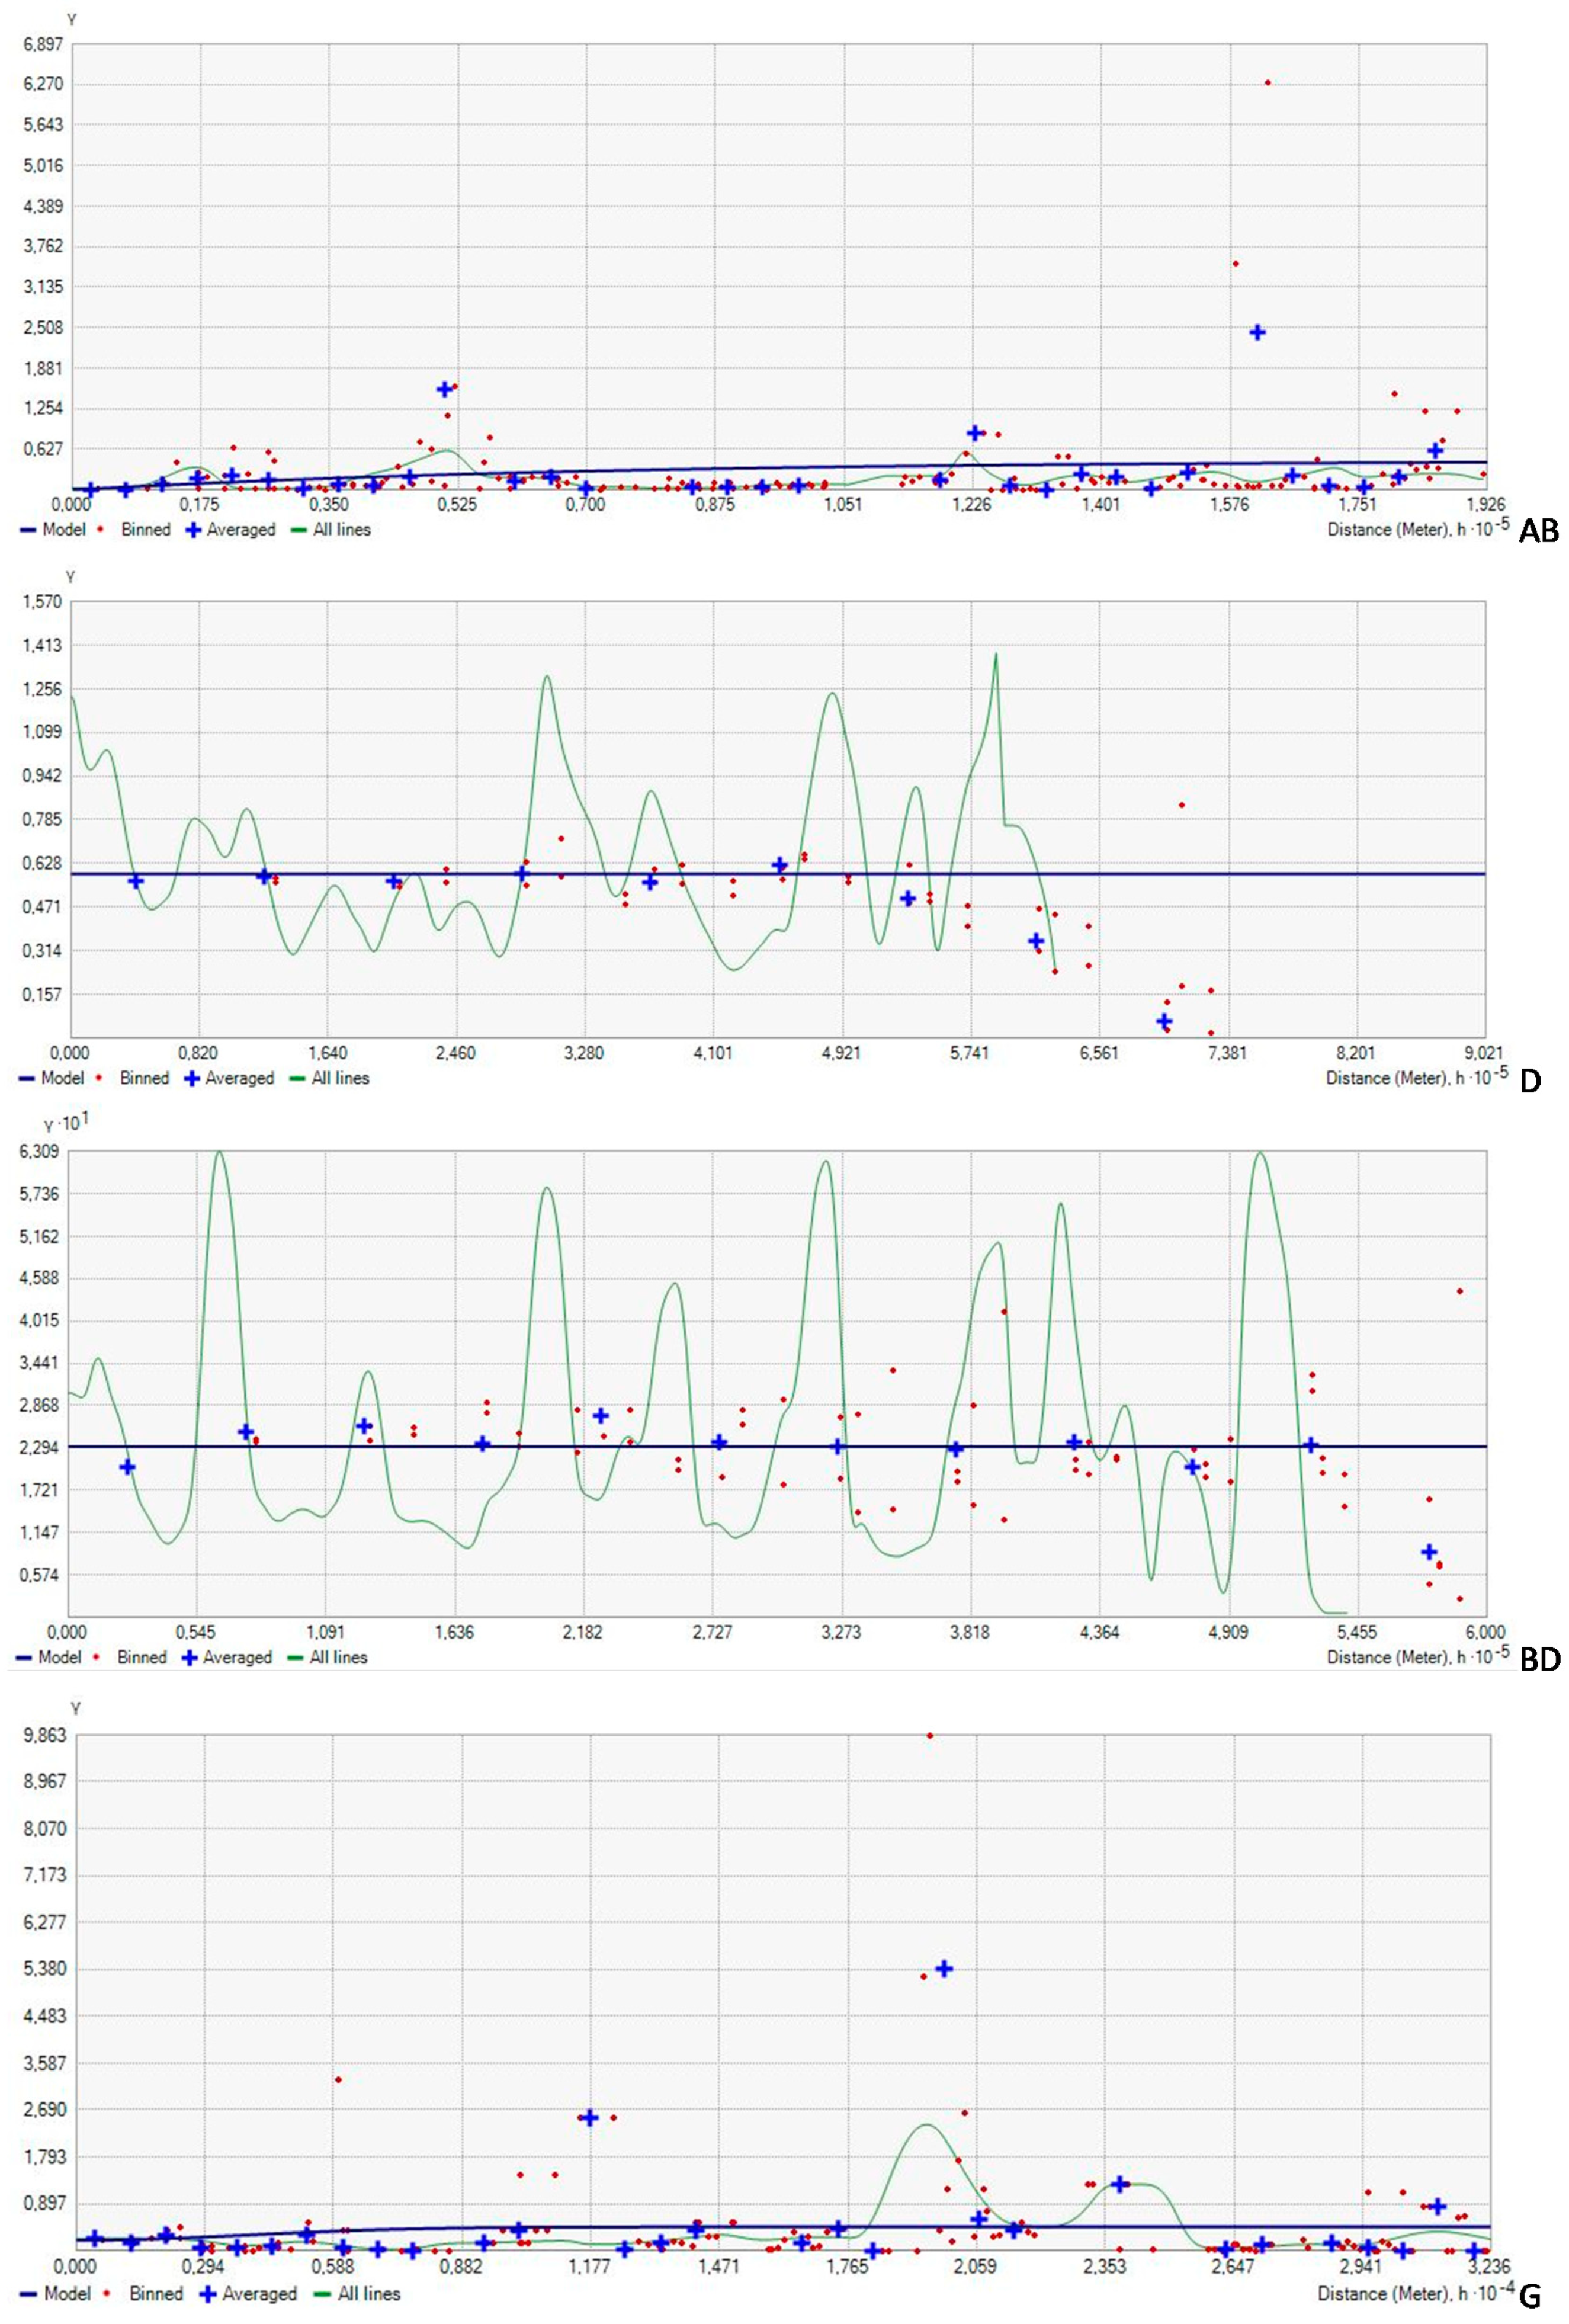
Figure 5.
Analysis of the relationships between the lengths of semi-major and semi-minor axes of the ellipse and the standard deviation (datasets A, B, C, D, and E).
Figure 5.
Analysis of the relationships between the lengths of semi-major and semi-minor axes of the ellipse and the standard deviation (datasets A, B, C, D, and E).
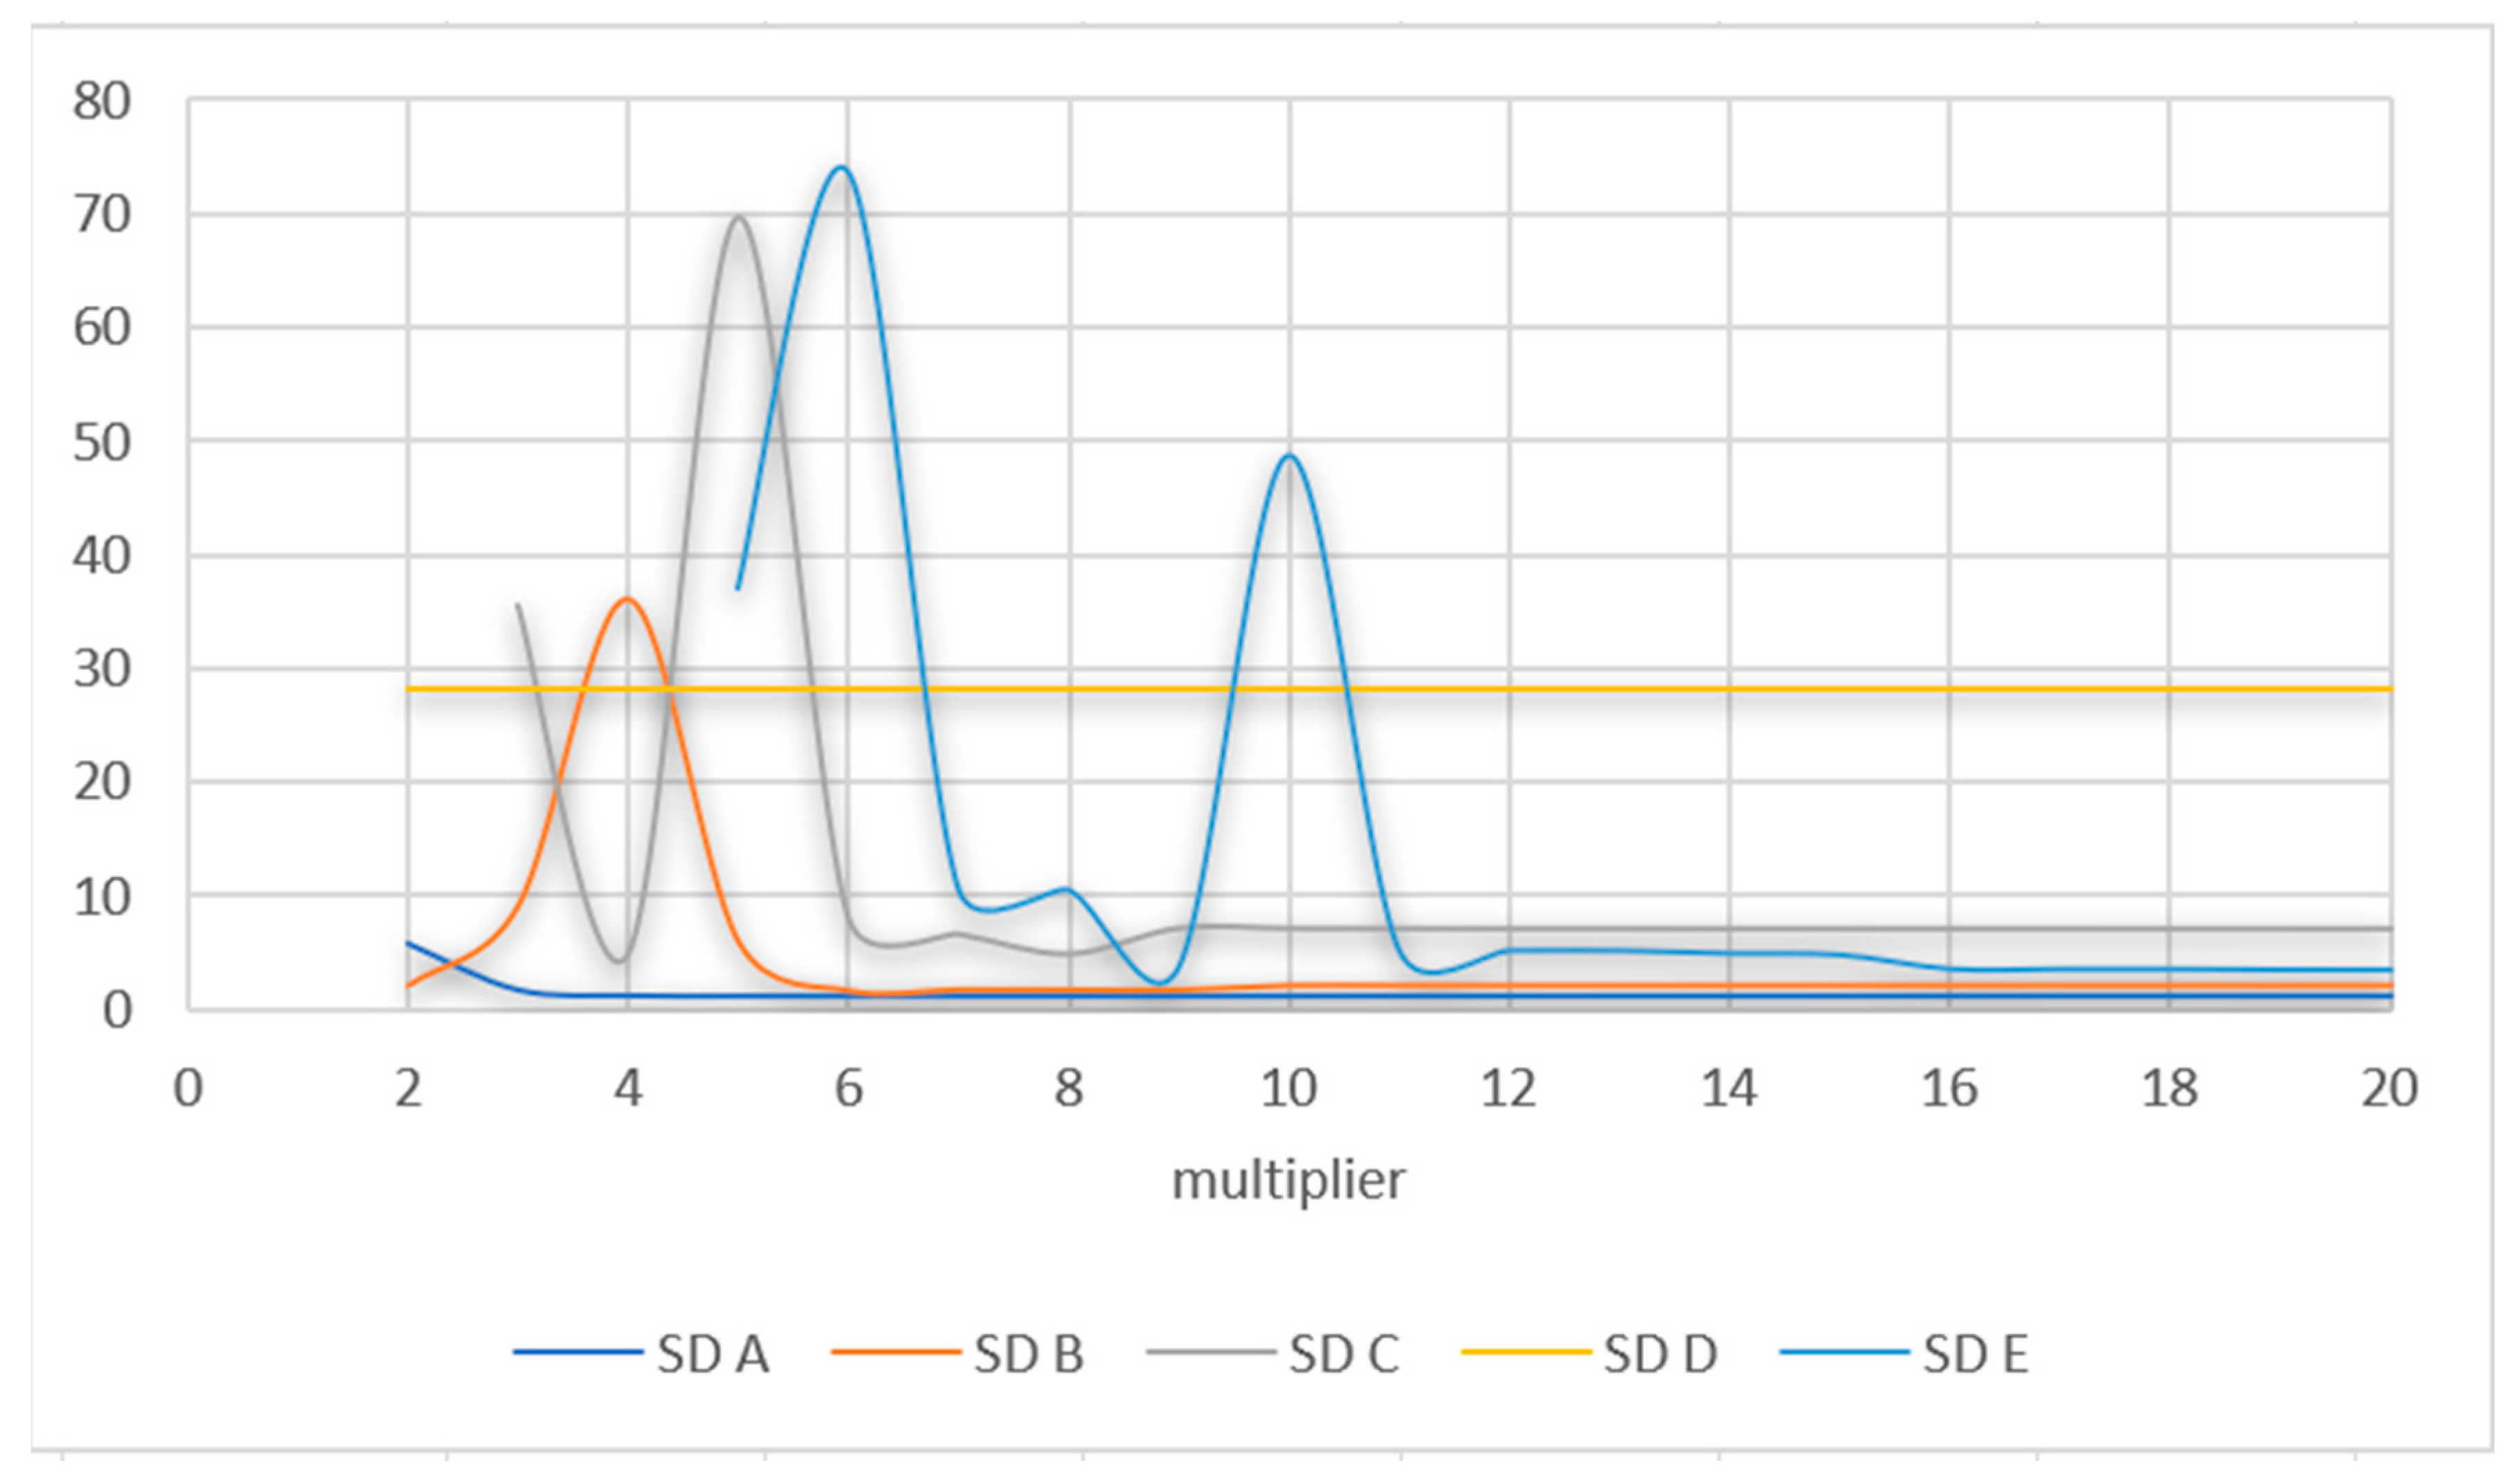
Figure 6.
Analysis of the relationships between the lengths of semi-major and semi-minor axes of the ellipse and the root mean square (RMS) (datasets A, B, C, D, and E).
Figure 6.
Analysis of the relationships between the lengths of semi-major and semi-minor axes of the ellipse and the root mean square (RMS) (datasets A, B, C, D, and E).
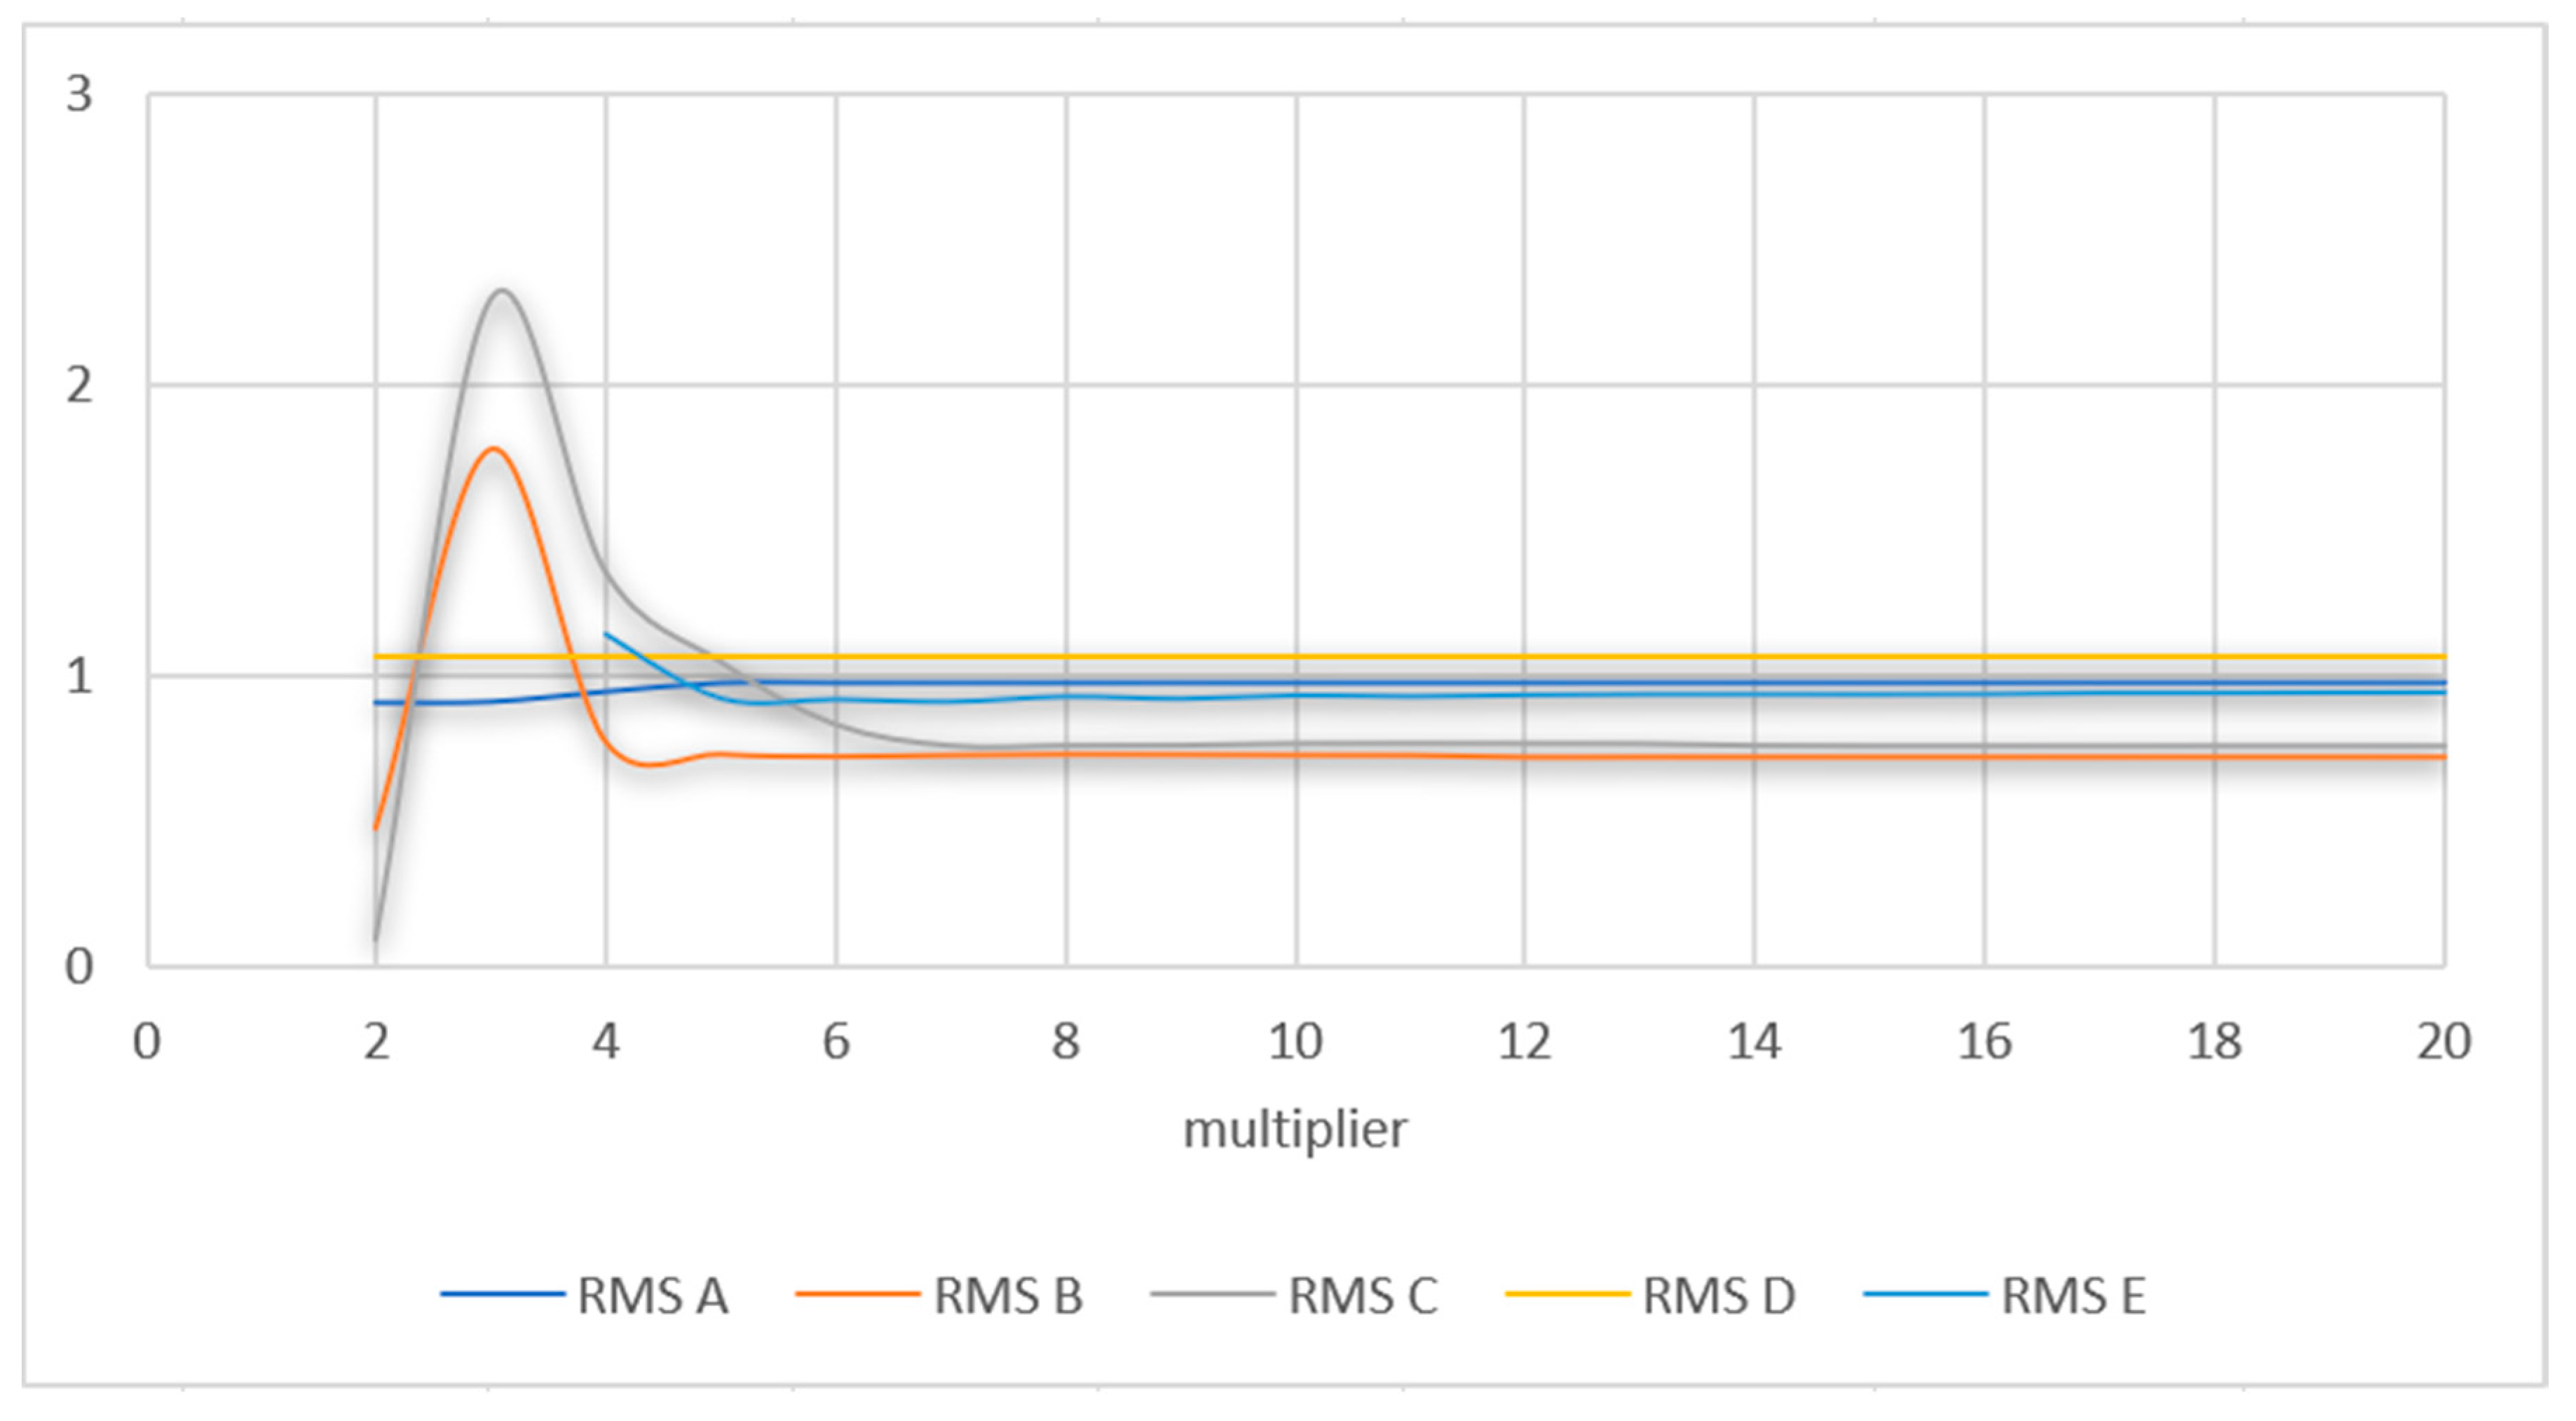
Figure 7.
Analysis of the variation in the anisotropic direction, partial sill, predicted value, RMS, and standard deviation in dataset A.
Figure 7.
Analysis of the variation in the anisotropic direction, partial sill, predicted value, RMS, and standard deviation in dataset A.
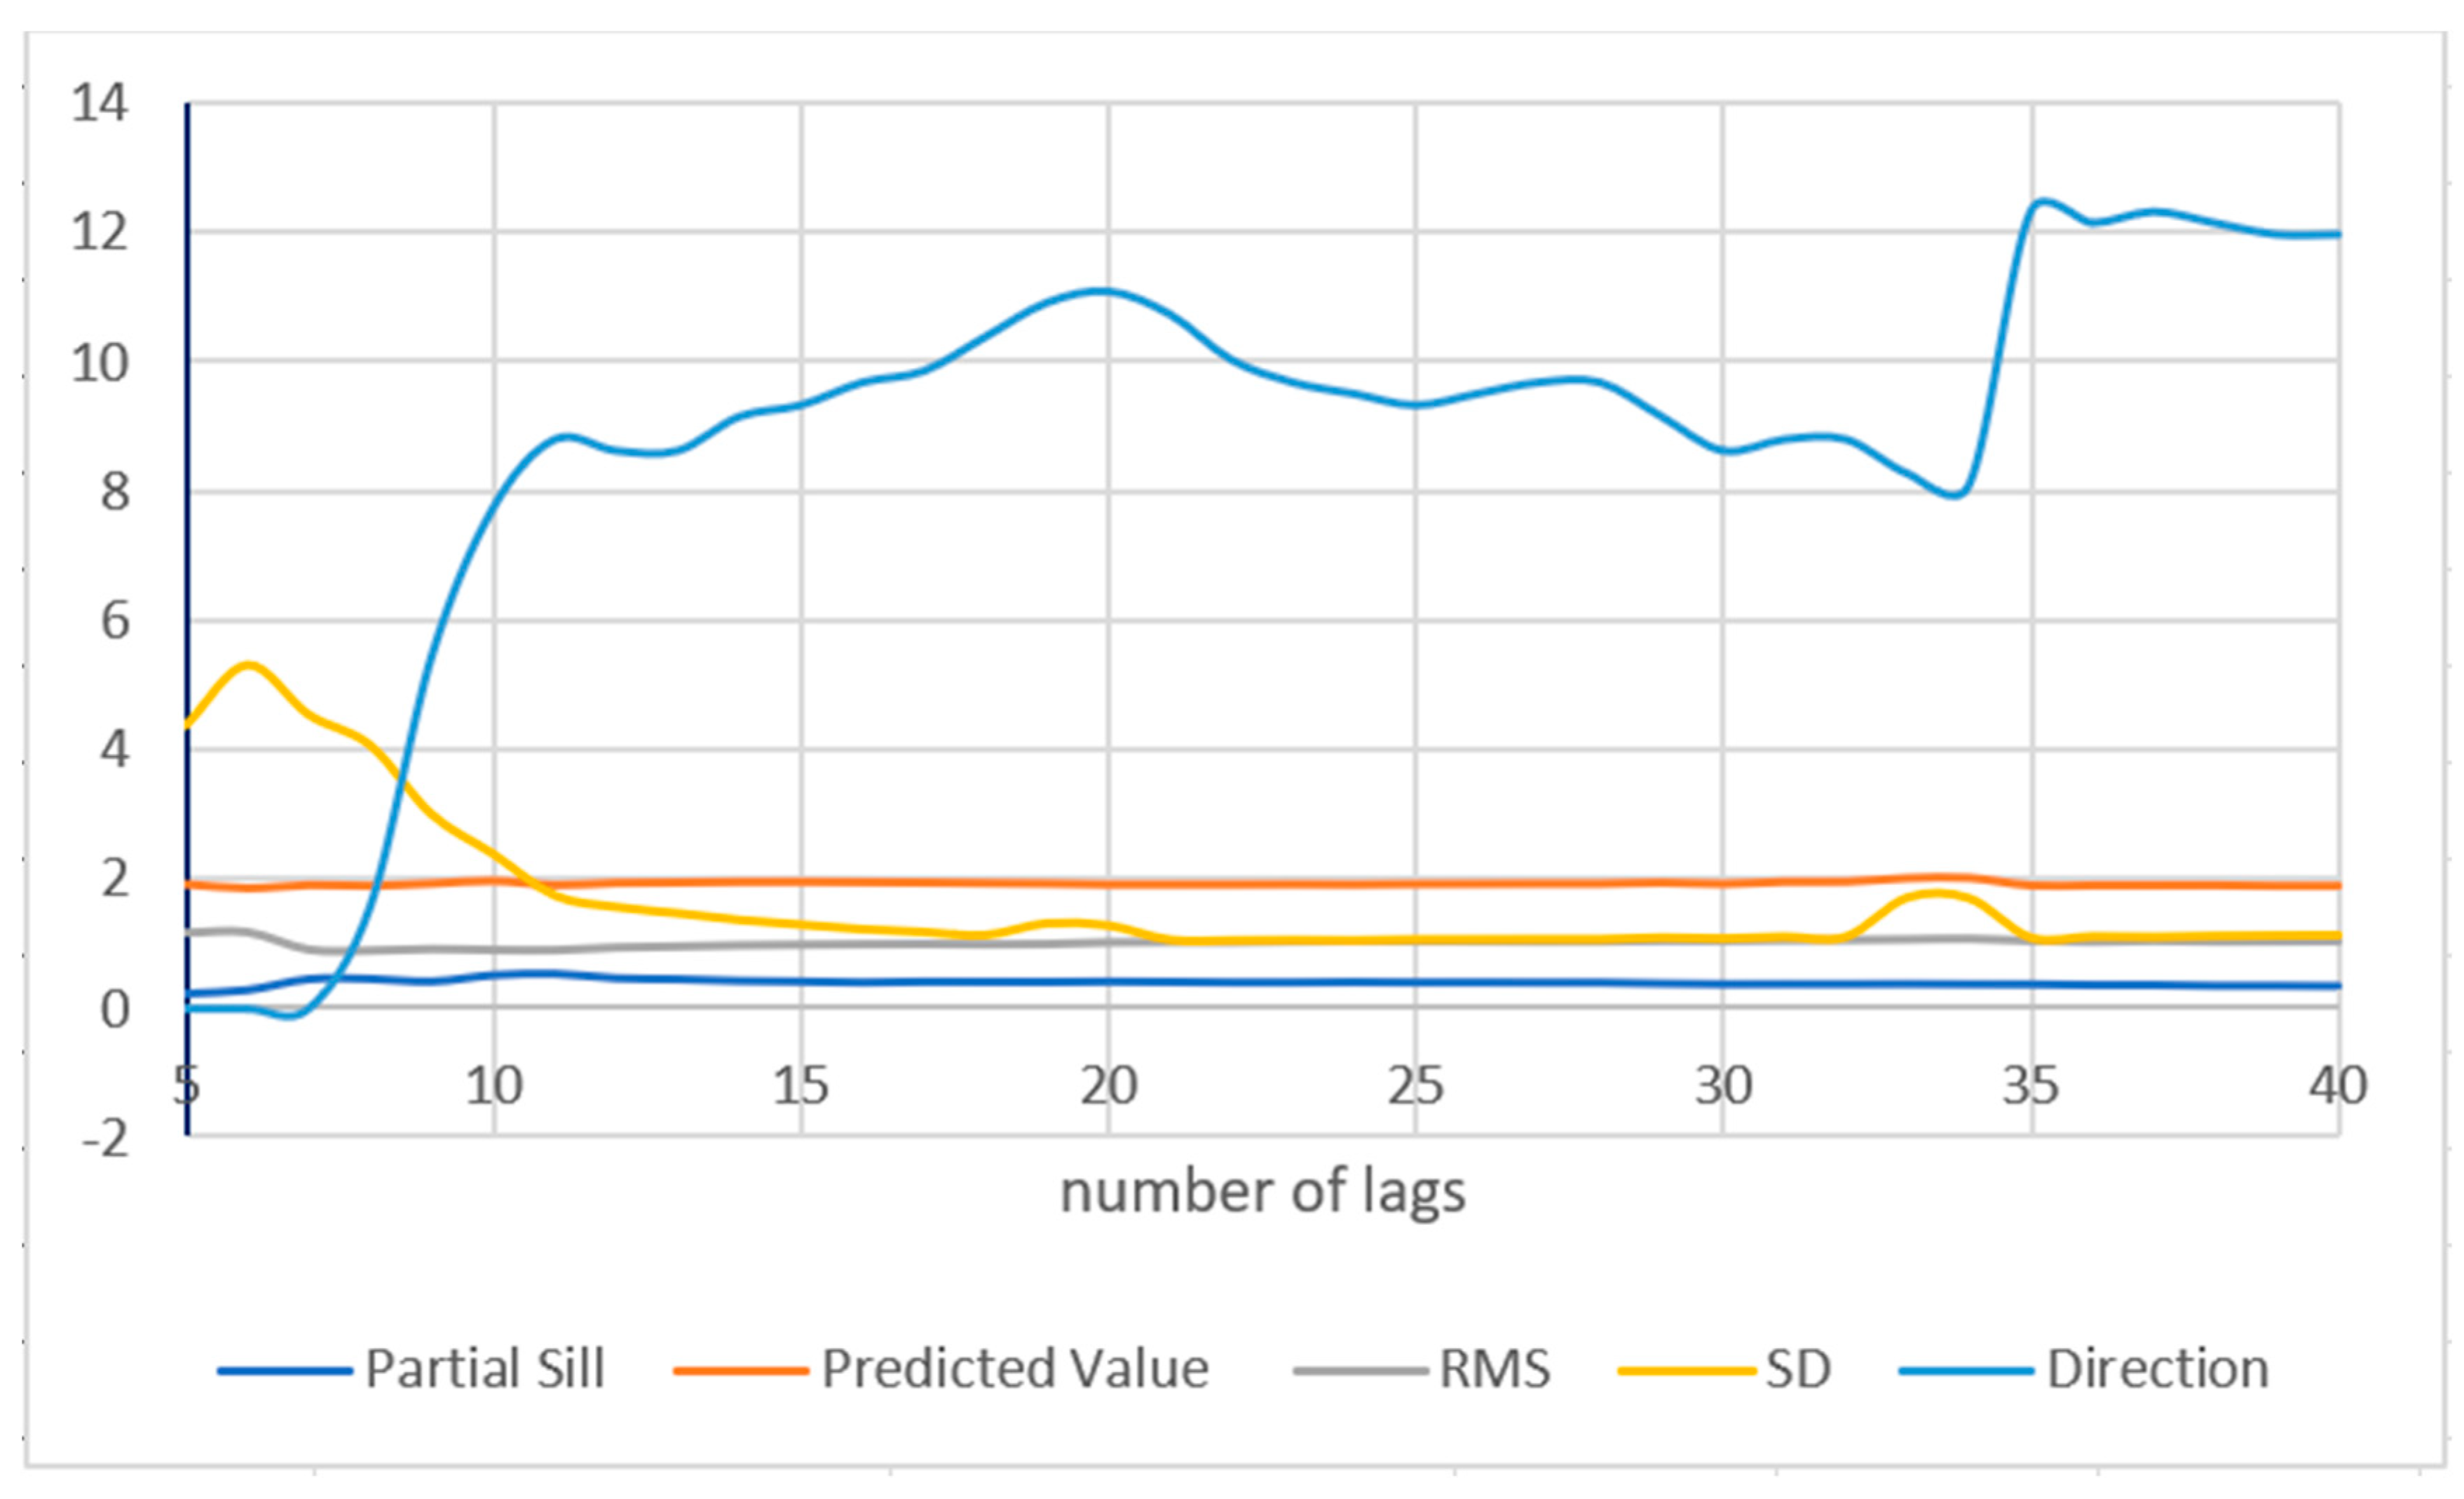
Figure 8.
Cartographic models of relative vertical crustal movements developed using co-kriging.
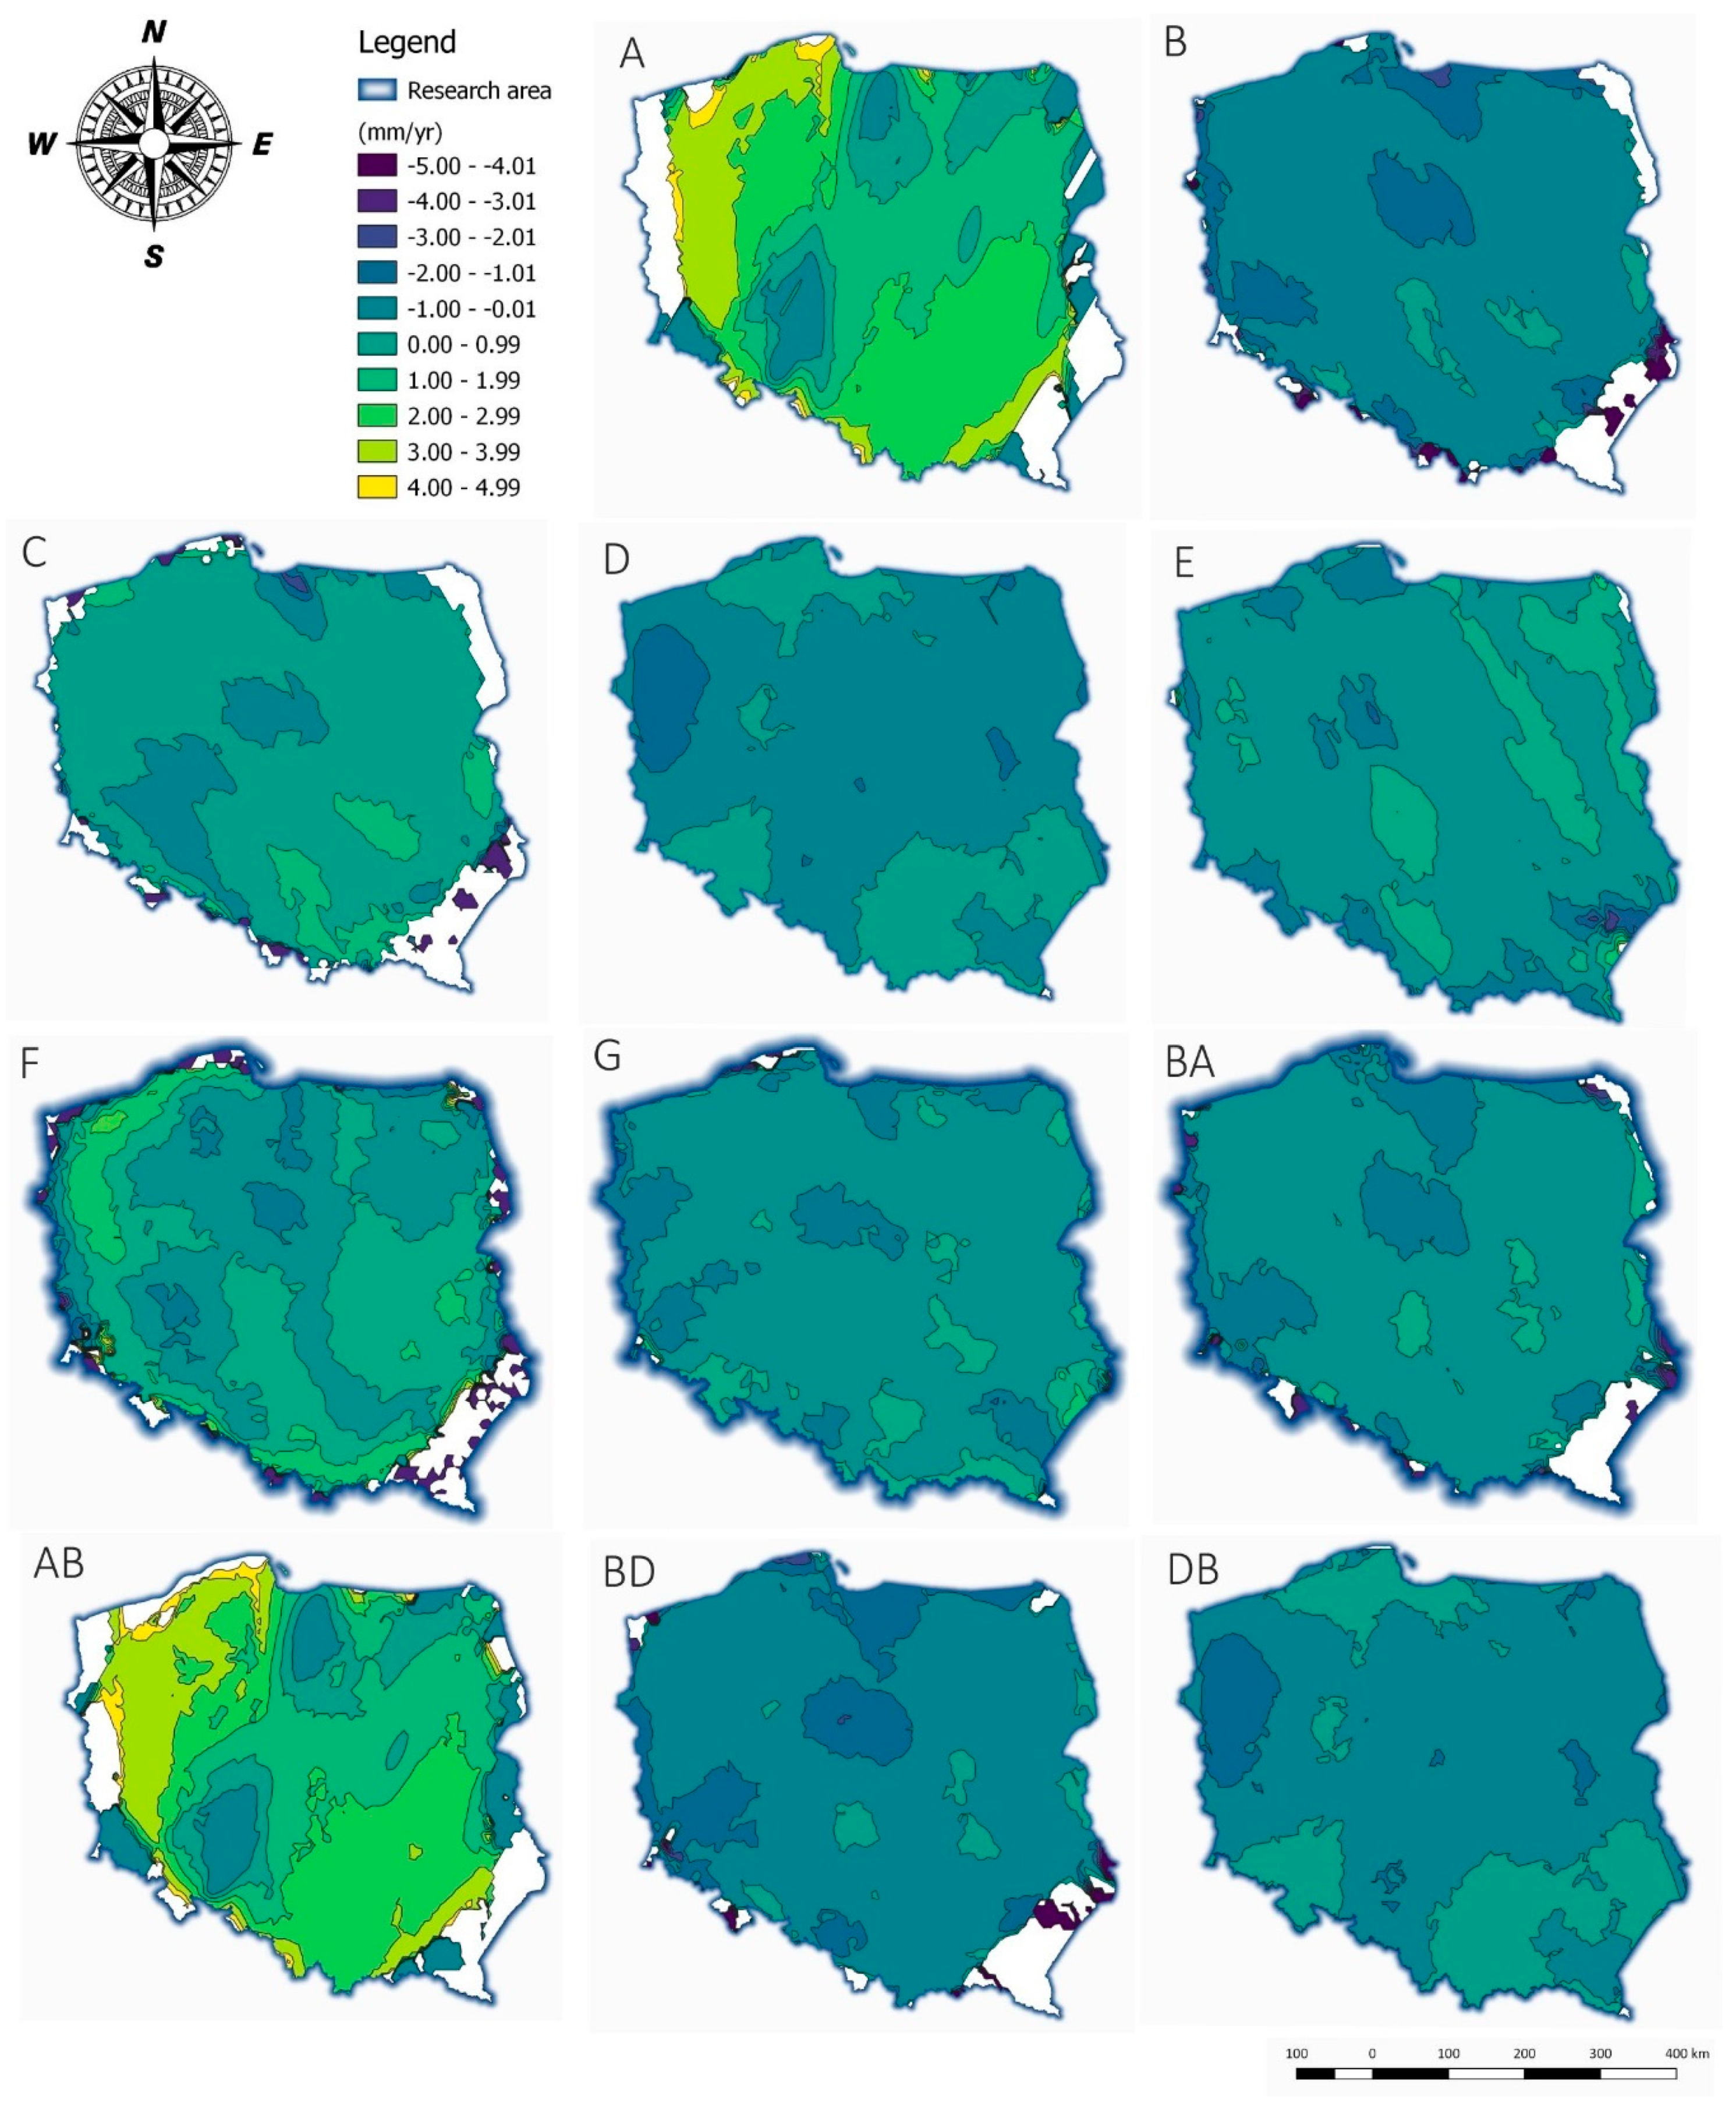
Figure 9.
Standard error of the estimate for dataset E.


Table 1.
Characteristics of maps (cartographic models) of the vertical movements of the Earth’s crust on the territory of Poland [25,26,27,28,29].
| Authors | Data | Type | Type of Data Processing | Form Maps (Models) | Interpolation | Determination of Anisotropy | Additional Isoline Corrections |
|---|---|---|---|---|---|---|---|
| [25] | Precise leveling | Point | Adjustment | Analog | Linear | No | Geological |
| [26] | Precise leveling | Point | Adjustment | Analog | Linear | No | Geological |
| [27] | Precise leveling | Point | Adjustment | Analog, numerical (grid: 20′ × 20′) | Collocation using the Hirvonen analytical function | No | No |
| [28] | Data from GNSS stations | Point | Development of time series | Analog | Kriging method with the linear semivariogram | No data | No |
| [29] | Data from GNSS stations | Point | Development of time series, adjustment | Analog | Kriging method with the linear semivariogram | No | No |
Table 2.
Characteristics of datasets used in the analysis. GNSS: Global Navigation Satellite System.
Table 2.
Characteristics of datasets used in the analysis. GNSS: Global Navigation Satellite System.
| Data Set | Leveling Data | GNSS Stations Data | Number of Nodal Points | Number of Leveling Campaing |
|---|---|---|---|---|
| A | + | − | 98 | #2, #3 |
| B | + | − | 222 | #3, #4 |
| C | + | − | 228 | #2, #3, #4 |
| D | − | + | 123 | − |
| E | + | + | 345 | #3, #4 |
Table 3.
Values of the nugget effect, anisotropy, direction, and partial sill in the analyzed datasets.
Table 3.
Values of the nugget effect, anisotropy, direction, and partial sill in the analyzed datasets.
| Data Collections | Nugget Efect | Anisotropy | Direction | Partial Sill | |||
|---|---|---|---|---|---|---|---|
| [1][0] | [1][1] | [1][0] | [0][1] | [1][1] | |||
| A | 0.01 | 2.44 | 10.01 | 0.39 | |||
| B | 0.05 | 1.83 | 142.73 | 0.21 | |||
| C | 0.11 | 1.65 | 139.74 | 0.17 | |||
| D | 0.59 | 1 | 0 | 0 | |||
| AB | 0 | 0.24 | 1.64 | 21.79 | 0.44 | −0.01 | 0.0003 |
| BD | 0.23 | 0.59 | 1 | 0 | 0 | 0 | 0 |
| DB | 0.60 | 0.16 | 1 | 0 | 0 | 0 | 0 |
| E | 0.26 | 2.46 | 146.60 | brak | brak | 0.28 | |
Table 4.
Standard error of the estimate for the analyzed datasets.
| A | B | C | D | E | F | G | AB | BA | BD | DB | |
|---|---|---|---|---|---|---|---|---|---|---|---|
| Mean standard error | 0.69 | 0.85 | 1.60 | 4.66 | 1.23 | 2.31 | 2.05 | 2.11 | 0.94 | 1.35 | 4.71 |
© 2020 by the authors. Licensee MDPI, Basel, Switzerland. This article is an open access article distributed under the terms and conditions of the Creative Commons Attribution (CC BY) license (http://creativecommons.org/licenses/by/4.0/).
Share and Cite
MDPI and ACS Style
Kowalczyk, K.; Kowalczyk, A.M.; Chojka, A. Modeling of the Vertical Movements of the Earth’s Crust in Poland with the Co-Kriging Method Based on Various Sources of Data. Appl. Sci. 2020, 10, 3004. https://doi.org/10.3390/app10093004
AMA Style
Kowalczyk K, Kowalczyk AM, Chojka A. Modeling of the Vertical Movements of the Earth’s Crust in Poland with the Co-Kriging Method Based on Various Sources of Data. Applied Sciences. 2020; 10(9):3004. https://doi.org/10.3390/app10093004
Chicago/Turabian StyleKowalczyk, Kamil, Anna Maria Kowalczyk, and Agnieszka Chojka. 2020. "Modeling of the Vertical Movements of the Earth’s Crust in Poland with the Co-Kriging Method Based on Various Sources of Data" Applied Sciences 10, no. 9: 3004. https://doi.org/10.3390/app10093004
Note that from the first issue of 2016, this journal uses article numbers instead of page numbers. See further details here.