Article

Numerical Evaluation of Dynamic Responses of Steel Frame Structures with Different Types of Haunch Connection Under Blast Load

by
Mustafasanie M. Yussof
1,*,
Jordan Halomoan Silalahi
2,*,
Mohd Khairul Kamarudin
3,
Pei-Shan Chen
4 and
Gerard A. R. Parke
5
1
School of Civil Engineering, Universiti Sains Malaysia, Nibong Tebal 14300, Malaysia
2
Damit Worley Parsons Engineering Sdn. Bhd, Kuala Belait KA1131, Brunei
3
Faculty of Civil Engineering, Universiti Teknologi MARA, Shah Alam 40450, Selangor, Malaysia
4
Department of Civil and Architectural Engineering, Kyushu Institute of Technology, Fukuoka 804-8550, Japan
5
Department of Civil and Environmental Engineering, University of Surrey, Guildford GU2 7XH, UK
*
Authors to whom correspondence should be addressed.
Appl. Sci. 2020, 10(5), 1815; https://doi.org/10.3390/app10051815
Submission received: 16 December 2019 / Revised: 10 February 2020 / Accepted: 12 February 2020 / Published: 6 March 2020
(This article belongs to the Special Issue Buildings and Structures under Extreme Loads)

Abstract

:
This research is aimed at investigating the dynamic behaviour of, and to analyse the dynamic response and dynamic performance of steel frames strengthened with welded haunches subjected to a typical hydrocarbon blast loading. The structural dynamic analysis was carried out incorporating the selected blast load, the validated 3D model of the structures with different welded haunch configurations, steel dynamic material properties, and non-linear dynamic analysis of multiple degree of freedom (MDOF) structural systems. The dynamic responses and effectiveness of the reinforced connections were examined using ABAQUS finite element software. Results showed that the presence of the welded haunch reinforcement decreased the maximum frame ductility ratio. Based on the evaluation of the results, the haunch reinforcements strengthened the selected steel frame and improved the dynamic performance compared to the frame with unreinforced connections under blast loading, and the biggest haunch configuration is the “best” type.

1. Introduction

The record of oil and gas industry accidental events shows that the historical offshore disasters have generally caused very significant losses in term of human lives, economy, and environmental pollution. Steel frames, as shown in Figure 1, are typical structures used in the offshore industry. The main functions of these frames is to support mechanical equipment, electrical and instrument cables, and hydrocarbon pipelines. Its function as a pipe rack is one of the reasons for selecting the frame because a ruptured pipeline which contains hydrocarbon liquid or gases may escalate the damage in a blast accident by intensifying the fire from the explosion. Therefore, this frame type was considered in our research.
During the period from 1993–2013, the worldwide petroleum and chemical insurance market reported that about 1100 insurance claims on major incidents were made [1]. Among these accidents, hydrocarbon explosions are the most hazardous events. Although a hydrocarbon explosion is a very rare accidental event, totally eliminating such incidents is difficult. Therefore, efforts should be made to keep the risk as low as possible and reduce the amount of structural damage if an explosion incident occurs. One of the approaches to minimize the risk to people and the facility is to utilize a blast resistant design or structural strengthening. The frames must have adequate stiffness, strength, and ductility capacity to resist blast loading. The connections of the structural component need to provide a significant contribution to maintain the integrity of the structural system. In many cases, connection strengthening can be implemented to enhance the structural dynamic performance.
In recent years, a few studies [2,3,4,5,6,7] were conducted on the investigation of the steel connection performance subjected to blast loading. Several steel joint reinforcement methods which strengthen and provide a better performance were proposed. An additional plate attached to beam flanges can improve the connection performance under blast loading [3]. Blast events are dynamic phenomena which are similar to earthquakes. Both blast resistant structure design and seismic design involve the ductile behaviour of the structures. Under seismic loading, the performance of the welded haunch connection reinforcements was studied by many researchers [8,9,10,11]. In seismic design, the welded triangular haunch, as shown in Figure 2, is one of the steel connection reinforcement methods that has been effectively implemented for enhancing steel moment connection performance as recommended by several seismic design guidelines [12,13,14]. Since seismic and blast loading characteristics are different, design for seismic load does not guarantee adequate performance for blast loading. Therefore, seismic design recommendations on connection reinforcement, and using welded haunches, cannot be directly implemented in blast design.
This study investigates the dynamic behaviour of a simple single-bay two-storey steel frame structure subjected to blast loading caused by hydrocarbon explosions. To achieve these objectives, a typical hydrocarbon explosion dynamic pressure was considered and the selected structural configuration including the connection details were modelled by numerical simulation using the finite element analysis (FEA) computer program ABAQUS/Explicit. To facilitate the model validation, a single-bay two-storey steel frame configuration from Chan and Chui [15] was adopted and developed as a 3D model. Before modifying the model for further analysis, a validation exercise was performed by comparing the numerical simulation responses with the responses as reported by Chan and Chui [15]. The model linear response was also compared with the theoretical approach/method computed using MATLAB Toolbox.

2. Non-Linear Finite Element Analysis

An explosion event typically happens in a very short duration of less than 1 s which indicates that the loading is time-dependent and requires a dynamic approach in the structural analysis. To solve the dynamic problem, a few techniques for structural dynamic analysis for blast resistant design have been developed; namely, the conventional equivalent static load or an elastic approach, a single degree of freedom (SDOF), and non-linear FEA. Offshore steel structures or petrochemical facility structures are generally constructed as a structural module with complex configurations and highly occupied by equipment and pipelines. This complexity leads to the classification of the structure as a multiple degree of freedom (MDOF) system and requires the non-linear MDOF analysis to provide the most comprehensive approach in the structural response computation.
The basic concepts and problem-solving techniques for MDOF systems can be found in many references [16,17,18,19]. A simple structure consisting of a MDOF system with the general dynamic equation of motion given in Equation (1).
M u ¨ ( t ) + C u ˙ ( t ) + F i n t ( t ) = F e x t ( t )
M is the mass matrix, C is the damping matrix, u, ú, ü are the displacement, velocity, and acceleration vectors, respectively, Fint is the internal forces vector, and Fext is the external forces vector. For dynamic events like the explosion case with a very high loading rate within short duration, the calculation requires small time increments to obtain a high-resolution for accurate solutions. Additionally, this technique is stable for small-time increment steps and requires relatively small computational cost per increment [20]. Therefore, the explicit method is efficient and suitable to be used in transient dynamic cases such as blasts, explosions, and impacts [21].

2.1. Finite Element Modeling
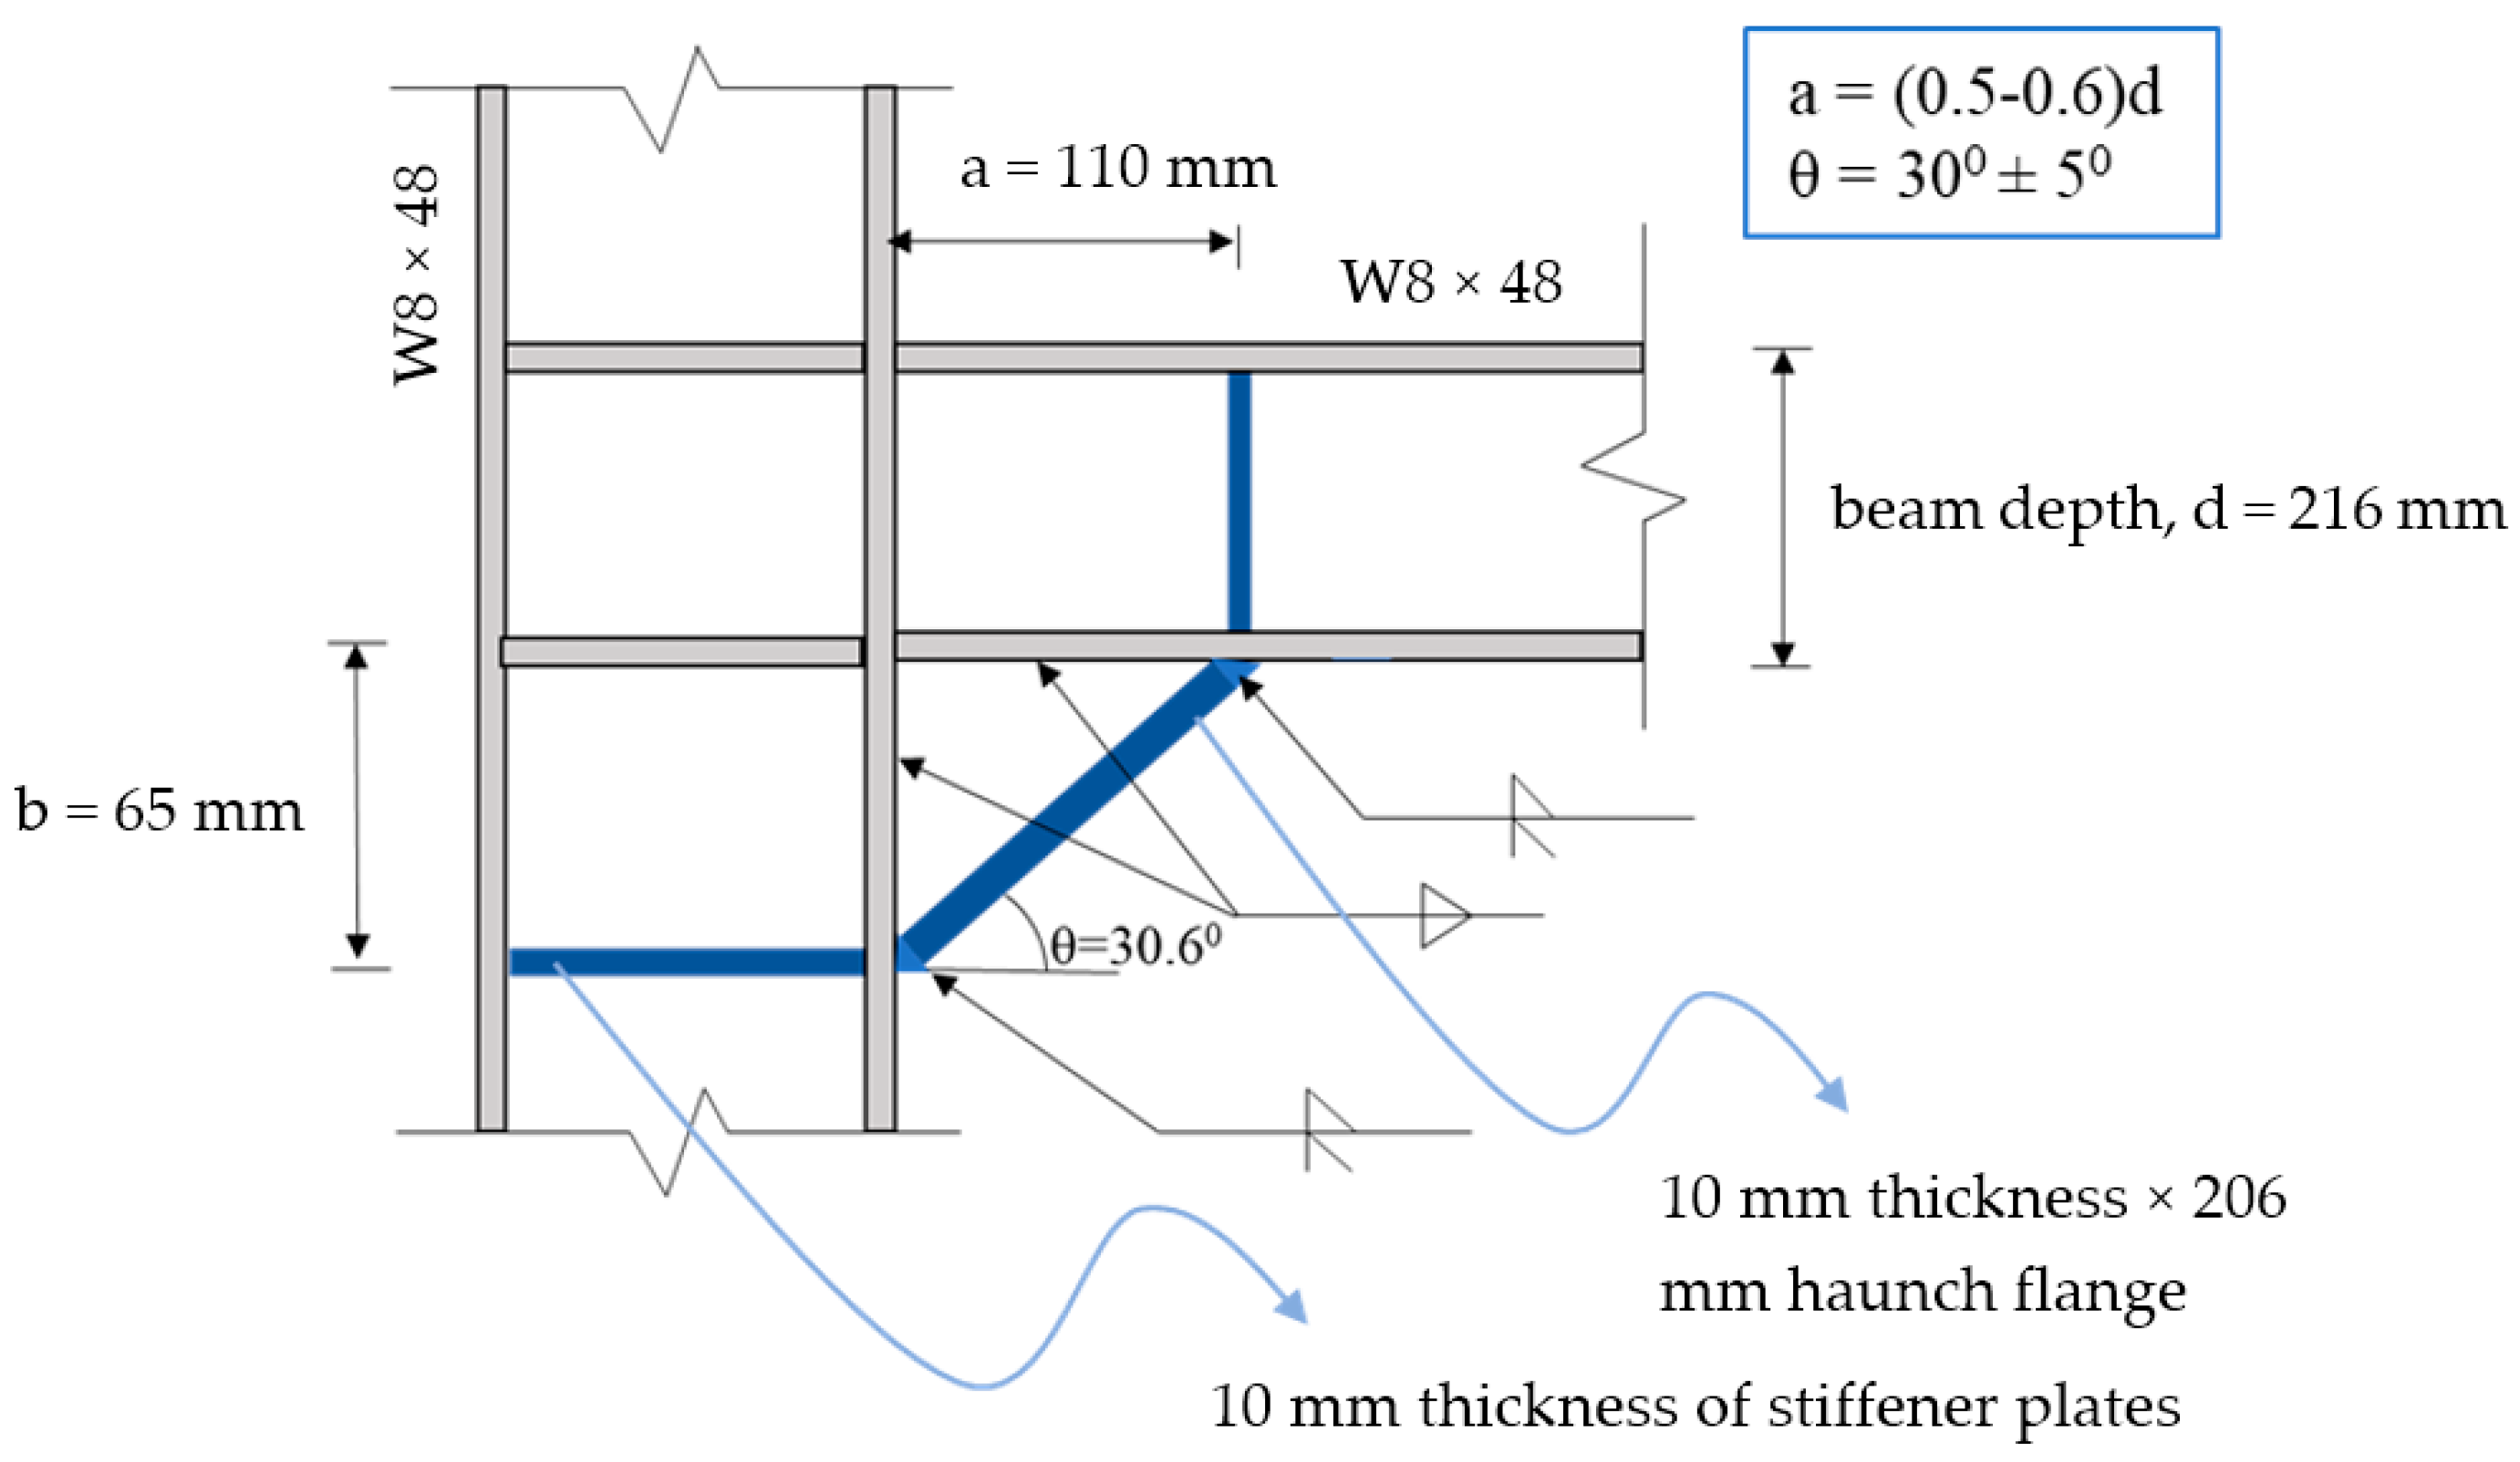
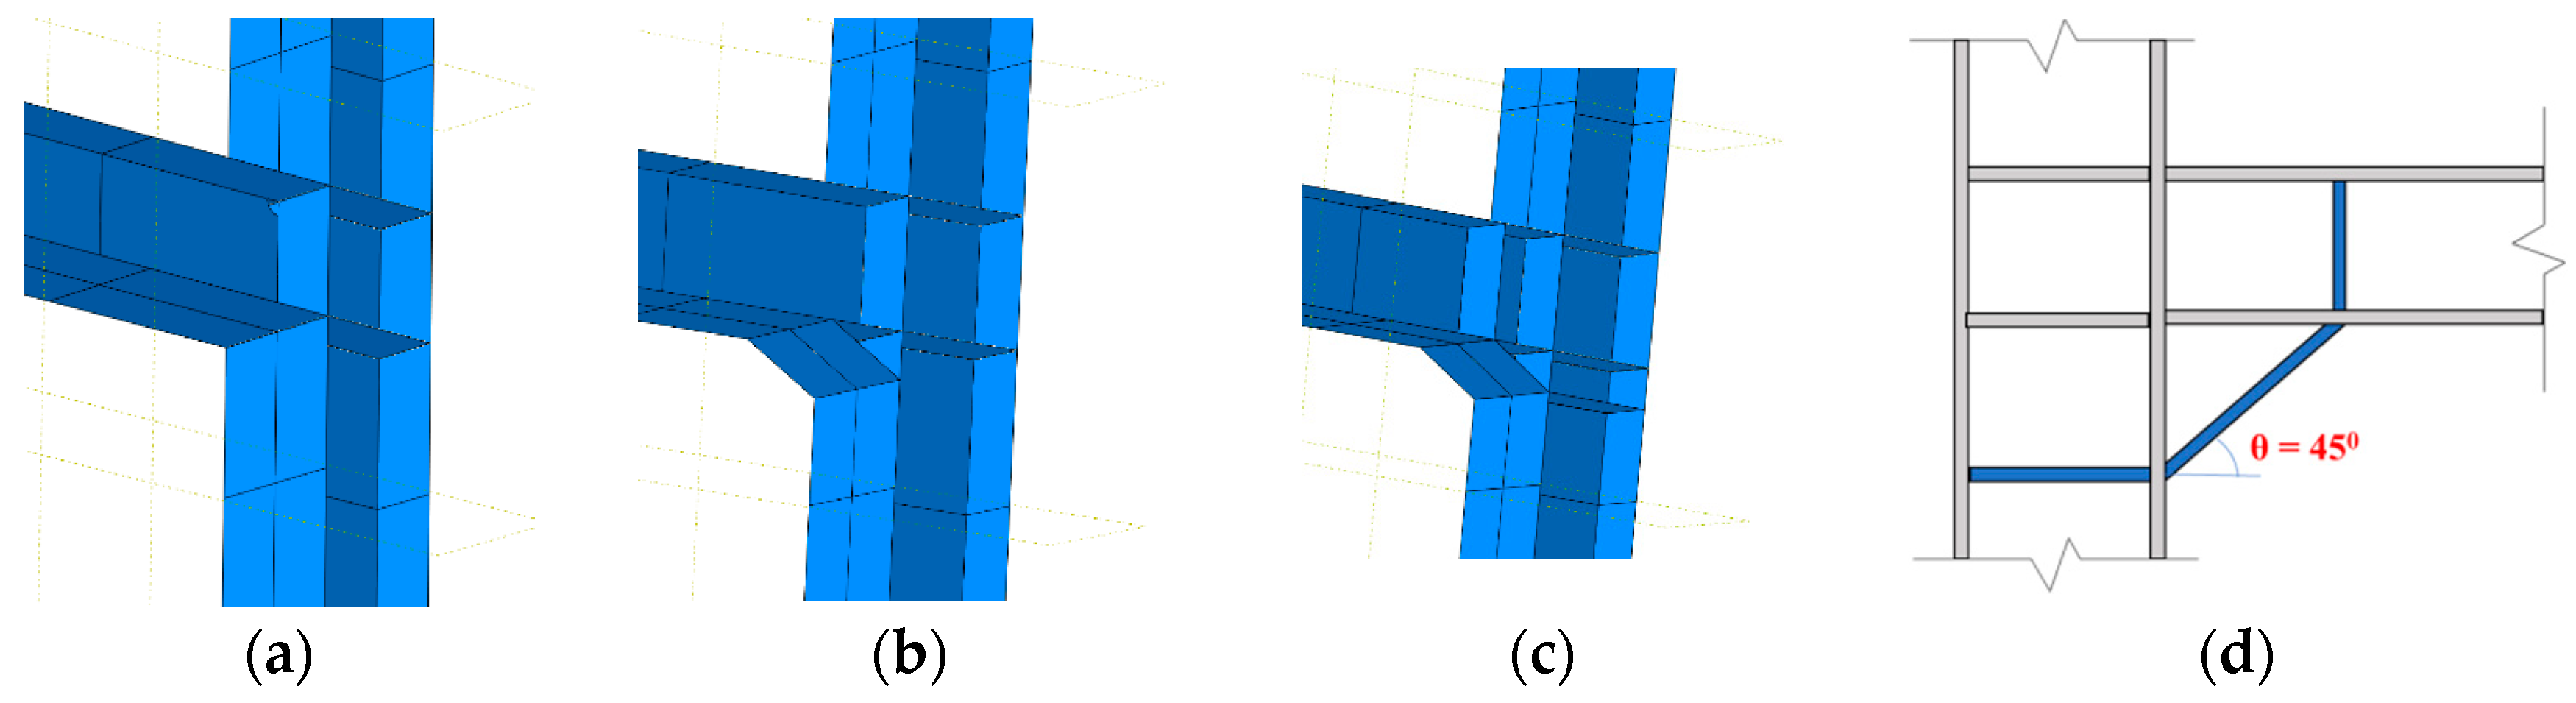
2.1.1. Geometry

Pipe rack framings are usually symmetric with uniformly distributed loadings. The braces support any lateral loadings in the longitudinal direction and restrain lateral movements whereby relatively small deflections will be experienced in this direction. This is a reasonable assumption to simplify the model by considering only a single-bay two-storey moment frame in the analysis.
To provide sufficient space for an access walkway and escape route, a minimum clear space of 1.0m width and 2.1 m height must be included within the structure [22]. Therefore, a column distance of 4 m that represents a typical offshore steel pipe racks framing configuration is considered sufficient. Regarding the requirement for vertical space between beams, the first author found no restrictions as long as the space for pipelines is sufficient in accordance with the piping engineers design, and the structural integrity can fulfil the design criteria. Therefore, a single-bay two-storey frame [15] was adopted and modified. The selected frame configuration is shown in Figure 3. This selected configuration facilitates the final model development after conducting the validation.
The haunch length, a, and angle, θ, were dimensioned in accordance with the provision given in Gross et al. [13]. The haunch is usually fabricated by cutting a structural beam sections or plates with standard thickness. In this research, plates with a standard thickness of 10 mm were considered for the haunch and stiffener plates. The thickness was selected because it is the maximum standard plate thickness that is less than the beam and column web/flange thicknesses. The haunch flanges are attached to the beam and column flanges by groove welding, and the webs are then fillet welded to the beam and column flanges as described in Figure 4. The haunches are placed only on the lower side of the beams to avoid obstruction for the pipelines on the top of the beams.
Varying details of beam-column connections were considered in this study. In addition to the joint type based on the configuration shown in Figure 4, a connection without reinforcement and a connection with a haunch slope angle of 45° were also considered in the analyses, as presented in Figure 5. The latter is a typical connection that is usually used in many offshore frame structures. The FE model of the steel frame was developed using ABAQUS/Explicit. The model geometry was modelled in accordance with the single-bay two-storey frame configuration, as depicted in Figure 3. The cross section of W8 × 48 was modelled and assigned to both the beams and columns.

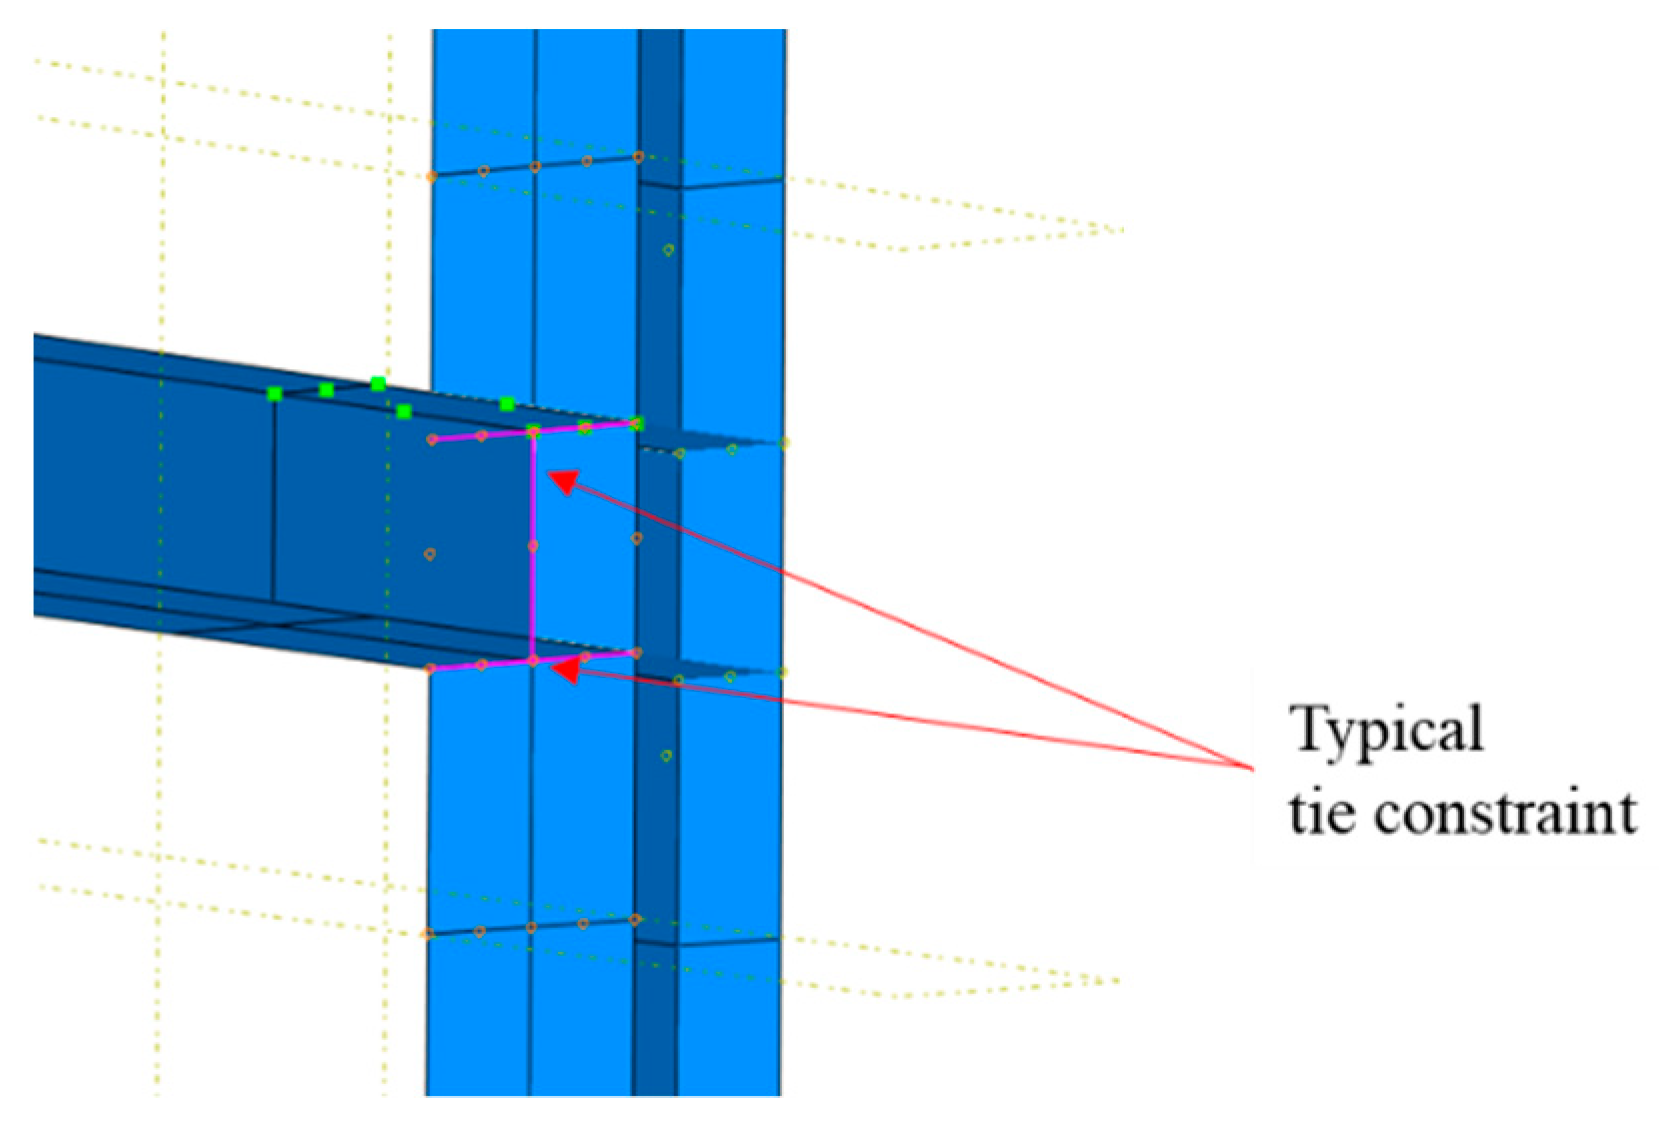
2.1.2. Constraint and Boundary Conditions

The beams-columns, plates, and haunches were connected using the tie constraint that connects two surfaces regardless of the mesh size of each surface. The tie constraint is equivalent to a welded joint that prevents penetration, separating or sliding in the interaction between the modelled surface relative to another surface [20]. The application of this constraint in the model is illustrated in Figure 6. The column bases were considered as fixed supports which were created by restraining all the degrees of freedom of the nodal points concerned in the model boundary conditions.

2.1.3. Material Properties

For large deformation cases, the cross-sectional area undergoes a significant reduction and therefore true stress-strain indicating true material deformation must be considered. The following Equations (2) and (3) are the nominal stress-strain and true stress-strain relationships [23].
A = π r 2 σ t r u e = σ e n g ( 1 + ε e n g )
ε t r u e = l n ( 1 + ε e n g )
where σtrue is the true stress, σeng is the engineering stress, εtrue is the true strain and εeng is the engineering strain. It is recommended that the material properties for nonlinear analysis is based on the actual test results. However, in many cases this data is unavailable. In the absence of actual tensile test results, Det Norske Veritas (DNV) [23] established idealized material curves according to the European Standards. The elasto-plastic material properties for steel grade S235 with isotropic hardening was selected for the non-linear properties of steel [23]. ABAQUS defines the rate-dependent behaviour in term of plastic strain rate ε ˙ ¯ p l expressed as:
ε ˙ ¯ p l = D ( R 1 ) q
where R is the ratio of the dynamic yield stress to the static yield stress, D and q are material constants. To match the Cowper-Symonds constitutive equation, the material constants for structural steel in Equation (4) were specified as D = 40.4 s−1 and q = 5 [24] which were included in the power law rate dependence definition input.
Typically, Gurson’s porous model is considered to model material with relative density greater than 0.9. Amadio et al. [25] considered Gurson’s porous model in the material attributes to overcome the limitation of the Von Mises constitutive law. However, Gurson’s damage model on material plasticity is not considered in this study. The study is more concentrated on the structural performance based on global response without investigation of the material constitutional law, sensitivity of the local effect in the beam-column connections, and detail failure mechanism.

2.1.4. Element Type and Mesh

The required numerical results obtain from the FE analysis are depending on the selection of element type for the FE model. The accuracy of FE results is relatively influenced by the type of elements defined onto the FE model [26]. Solid element is significantly useful to obtain numerical stress components of the FE model. However, in this study, only the displacement component of the FE model is required to estimate the dynamic behaviour of the structure considered under blast load. Both solid and shell elements can significantly produce the same results of the displacement component of the element under static and even extreme load such as blast load [26,27]. All structural components were modelled using deformable four-node doubly curved with reduced integration S4R shell element. The S4R element is suitable for large-rotation problems because it includes finite membrane strains and arbitrarily large rotations [20]. A fine mesh size of 25 mm was used in the connection region and a coarse mesh size of 100 mm for the regions other than the connection area were selected as shown in Figure 7.

2.1.5. Loadings

All loadings associated with in-place actions that contribute to the dynamic masses must be included in the dynamic analysis [28]. The dead loads not contributing to the overall structural stiffness were incorporated as inertia masses input because these masses, including the weight of all pipes, contribute to the inertia mass in the dynamic behaviour of the overall structure. The inertia mass of pipes was determined by assuming all pipe size as 400 mm diameter × 12.7 mm thickness with a span length of 5 m. The weight of each pipe was 1.2 tonnes. At the same time, the miscellaneous dead loads such as smaller pipes, cable tray, electrical lines, grating, and handrails were included in the model. A total inertia mass of 10.2 tonne (100 kN) at each pipe location were assumed and included in the model. The total mass based on the assumed inertia masses gives a conservative scenario, besides maintaining the same total mass as in the original steel frame presented by Chan and Chui [15]. The weight of the pipes on the rack was modelled by applying mass inertia at four prescribed locations as shown in Figure 8.
During the gas explosion process, the atmospheric pressure increases dramatically to a maximum pressure with the propagation of the blast wave, and then it slowly decreases to a negative value with respect to the standard atmospheric pressure. The negative phase pressure occurs because the shockwave forces the air to move as it spreads outward from the explosion centre and creates a lack of air behind, causing a partial vacuum or negative pressure phase. This negative phase can be ignored in structural design [29]. However, the negative phase of the blast pressure is important in order to accurately predict the responses of blast loading on structures [30], and it is unconservative if the negative phase is ignored [31]. The original pressure-time history output of blast simulation is not practicable to be used in structural dynamic analysis and needs to be idealized [32]. Mohamed et al. reference [30] summarised typical nominal blast overpressures for offshore structure according to industrial standard guidelines. The durations of these loads were reported to be between 50 and 200 msec and considered to be close to typical offshore structure natural periods (between 300 to 1100 msec). Yasseri et al. [33] also proposed an overpressure load of 0.9 bar and 2.25 bar as the lower and upper level events for hydrocarbon explosions, respectively.
During an explosion event, the following three fundamental consequences can occur; namely, the blast overpressures, dynamic pressures (drag loads) and projectiles, missiles, and shrapnel. Among these consequences, the explosion overpressures are generally considered to be the most critical measurement. In the absence of project-specific data, it has been suggested in a Chevron Engineering Standard that a load equal to one-third of the positive phase load can be considered for the negative phase pressure. The negative pressures are usually within the range 10–30% of the maximum pressure [34].
The explosion loads on open frame structures, structural components, equipment items and pipework are usually caused by dynamic pressure loads [35] containing drag loads, inertia loads, and a pressure difference load. The first two loadings are similar to the fluid force terms in the Morrison equations (refer Equation (5)) [36].
F D = π 4 C m ρ D 2 U t + 1 2 ρ v g a s 2 C D A
FD is the drag force, Cm and CD are the inertial and drag coefficients. For small objects and typical gas velocities, the contribution of the inertia load is less than 1% of the force hence it may be neglected [37]. Therefore, the Morrison’s equation can be reduced and the magnitude of the drag forces on the steelwork elements can be calculated using Equation (6).
F D = 1 2 ρ v g a s 2 C D A
where CD is the drag coefficient of the object which is dependent on the shape of the structure (projected area), ρ is density of gas (kg/m3), vgas is velocity of the unburned gas mixture (m/s) and A is structures projected area (m2). Since the prediction of gas density and velocity in an explosion event are very difficult, Mohamed et al. Reference [30] reported that the dynamic pressure (drag load) calculation in Equation (6) can be simplified to the following empirical expression given by Equation (6).
q D ( t ) = C D × p ( t ) × O D
where qD(t) is the line load on a pipe function with respect to time, p(t) is maximum overpressure time-history and OD is outer pipe diameter. According to Equation (7), the dynamic pressure can be calculated by using the maximum overpressure values. The maximum dynamic pressure Pmax of 2.5 bar was selected based on Mohamed et al. [30] whereas the peak negative pressure Pmin of −0.83 bar was taken as one-third of the maximum dynamic pressure as suggested by in the Chevron Engineering Standard and Hansen et al. [34]. The pressure duration of 0.136 s for pressures Pmax of 2.5 bar and the duration of 0.24 s for Pmin of −0.83 bar were determined using the curve in Figure 9.
The dynamic pressure wave profile can be developed using the pressures and durations information. The idealized triangular waveform shown in Figure 10 was considered to describe the dynamic pressure history that was applied in the FE models.
In the analyses, a uniform distributed pressure of 2.5 bar was applied on the column flanges. To simplify the problem, the drag loads on the unmodeled pipes and non-structural items on the frame were ignored. Since the blast direction and the beam longitudinal direction are parallel, the beams are to be minimally affected by the lateral pressures, and thus no blast loads were applied to the beams.
In a blast event, the structures might buckle and undergo large geometry changes, hence the necessity to also consider geometric non-linearity [20]. In the initial step, initial conditions, boundary conditions, and predefined fields that are applicable with the analysis can be specified. In addition to the initial step, three steps were specified to simulate the blast analysis, namely; self-weight (quasi-static analysis with structural weight and dead load), blast (dynamic analysis using dynamic pressure history with self-weight propagation) and post-blast (only dead load is set active, no propagation of blast load from previous analysis step). In each analysis step, the incrementation settings were set to automatic incrementation so that ABAQUS automatically adjusts the time increment size depending on the numerical stability limit [20].
Before applying dynamic pressure, the initial condition of the structure was in a static condition under self-weight consisting of structural dead load and piping masses. Unfortunately, ABAQUS cannot directly combine static analysis with dynamic explicit analysis in the same model. When dynamic explicit analysis is being used, all the following analysis in the next steps must also be in the dynamic explicit mode. Therefore, the self-weight member forces also need to be analysed using dynamic explicit analysis. When the self-weight is applied instantaneously in the dynamic analysis, oscillatory vertical reaction force occur as shown in Figure 11. This oscillation does not represent the correct static condition in which the structure should be before the blast is initiated. This oscillation will create incorrect stress variations during and after the actual blast dynamic analysis. To overcome this problem, the ramp loading was implemented in the self-weight dynamic analysis whereby the load was applied slowly to avoid the dynamic effect. The basis of this method is related to the concept of the dynamic case of “step force with finite rise time” [16,17,18] in which if the rising time of the self-weight dynamic loading is relatively long and greater than three times the structural natural period, the dynamic response is quasi-static or like a static force. Therefore, a rise time of 2.15 s (=3 × 0.717 sec) was used in the self-weight dynamic step as shown in Figure 12. The result of ramp loading implementation in the self-weight step is presented in Figure 13 whereby no oscillation has occurred in the self-weight dynamic step.
In the “blast” analysis step, the dynamic pressure was introduced. The duration of the blast analysis step was specified in line with the total duration of the blast amplitude definition as 0.376 sec. During this analysis step, the self-weight propagating from the previous self-weight analysis step was included in the analysis. After the blast analysis step, the last analysis step, called the post blast, was created with the purpose of studying the post-blast response of the structure. No load was applied in this step except the self-weight propagation from the previous step. Since the transient dynamic response is the primary interest of the study, a step duration of 2 s was considered in the post-blast analysis. In the explosion dynamic analysis, the maximum dynamic response usually occurred within the transient response duration. Therefore, the duration of 2 s is considered adequate to describe the steady state response of the structure. Moreover, a longer duration needs to be avoided to minimize the total computation duration.

2.2. Structural Assessment

2.2.1. Ductility Ratio of the Steel Frame

The level of structural performance can be measured by quantifying its stresses, strains, displacements, ductility, functionality, and similar parameters. Like seismic design, blast resistant structural design also considers inelastic response under dynamic load. In terms of the structural response, the impulsive blast load yields higher response frequency than the response due to seismic load [38] and the inter-story drifts due to the blast loading on a building are generally higher than the drifts due to earthquakes [39]. In the case of blast loading, the design is based on the member’s plastic behaviour and the structural component is governed by its ductility and rotation [40]. The ductility is defined as the structural capability of plastic deformation without fracturing. The maximum plastic displacement of a structure can be measured by the ductility ratio (µ) relative to first yield [41] as given in Equation (8).
μ = δ u δ y
where δu is the maximum plastic displacement, and δy is the displacement at first yield. The displacement at first yield is not obvious for most material. It can be determined by using graphical methods with several alternative definitions [41]. The method based on initial yielding, also called the Tangent Method, is usually implemented to approximate the yield point which is defined as the intersection between the tangential lines of elastic and plastic behaviour [42].
In design practice, ductility ratio values and rotation criteria are used for designing structure particularly topside offshore structures. The ductility ratio and the plastic strain are related, and the failure of the structure is assumed to occur when the plastic strain approaches the material failure strain [43]. The allowable range of the structural member’s plastic deformations is measured based on the calculated ductility ratio, whereas the limit on the support rotation makes sure that tension membrane action, that may develop in a member, will be in a safe range where no connection failures occur.

2.2.2. Evaluation Criteria

In industrial practice, various design codes and guidelines [24,31,40,44,45,46] are used for blast design evaluation criteria. Specifically, for a petroleum facility, API RP 2FB [24] defines two important levels of assessment namely ductility level blast (DLB) and the strength level blast (SLB). These levels are associated with the explosion loading risks by analogy with earthquake assessment. A low-probability high-consequence event representing the extreme design event may be assessed using DLB. While a higher-probability lower-consequence event, such an explosion case with low overpressure, can be assessed using SLB.
Louca et al. [6] summarised the ductility values that were used in the offshore structure design practice. By correlating the ductility ratio and damage levels, Yasseri [47] proposed the ductility ratio criteria. Several design guidelines in the industry present the response criteria [40,46].

3. Results

3.1. Model Validations Results

A single-bay two-storey steel framing configuration as presented in Figure 14 was chosen to develop the model. The selected steel frame was considered appropriate for the object in the study because a simple and small structure does not require excessive computation resources. Chan and Chui [15] investigated the transient dynamic response of the inelastic steel frames with nonlinear connections. Geometric imperfections and residual stress with a maximum magnitude of 50% of yield stress were included in their study.
The model of the selected steel frame was developed in ABAQUS. Before starting the simulations for the research, two different analyses namely elastic and elastic-perfectly-plastic analyses were used for validating the model by comparing the dynamic responses from numerical analyses against the dynamic responses presented by Bathe [19]. To differentiate the analysis, two different material properties were created representing the elastic and elastic-perfectly plastic with a yield stress of 235 MPa. The elastic and elastoplastic analyses were carried out. To verify the dynamic characteristic of the frame using theoretical calculations, elastic dynamic analysis was also carried out using CALFEM which is a MATLAB computational toolbox for teaching FEM developed at Lund University [48]. The structural lateral displacement responses are presented in Figure 15 and Figure 16.
Since the response based on CALFEM calculation matches the elastic response presented by Chan and Chui [15], their dynamic characteristics are considerably identical. This implies that the dynamic characteristic based on CALFEM calculations represents the similar dynamic characteristic of the frame presented by Chan and Chui [15]. According to the dynamic response in Figure 15 and Figure 16, the maximum response from the ABAQUS analysis is 42% higher than the maximum response given by Chan and Chui [15]. In addition to this, the displacement response wave period of the ABAQUS results are shorter than the results from Chan and Chui [15].
To investigate these discrepancies, the natural frequencies that represent the dynamic characteristic of the frames were calculated using ABAQUS and CALFEM. As shown in Figure 17, the structure natural frequency of 1.4978 Hz extracted from ABAQUS is 5.4% higher than the CALFEM result (1.4214 Hz). Tedesco et al. [18] showed that the effect of mass and load distribution on the dynamic response of a structural system in which a structural system with distributed mass is stiffer than a system where the entire mass is concentrated at midspan points. Unlike beam finite element formulation, the structural masses in the ABAQUS model is distributed throughout the structure and not concentrated at points. This implies that the ABAQUS model should be stiffer than the CALFEM calculation, hence it will have a higher natural frequency.
The effect of the nonlinearity of the system was also investigated. As shown in Figure 18, the Von Mises stress reaches the yield stress value. This situation is considered overstress, in which the validated model undergoes yielding and buckling. In this case, analysis using ABAQUS does have capability to consider inelastic moment redistribution [49] and P-delta effects by activating the geometric non-linearity option in the dynamic analysis. These features allow the analysis using ABAQUS to capture the more realistic dynamic behaviour of the structure.
The preceding section explained possible factors affecting the higher dynamic responses obtained from ABAQUS compared to the dynamic response presented by Chan and Chui [15].

3.2. Eigenmodes and Eigenvalues

The natural period of the structure was obtained by eigenvalue analysis. To perform this, the analysis model was copied and modified by removing the blast loading and maintaining the structural and piping masses. The dynamic analysis step was replaced by linear perturbation frequency analysis type. Ten values of the eigenvalues were requested for the analysis output. The mode shape which is parallel with the direction of blast loading was selected as the representation of the dynamic characteristics of the structure. Therefore, the structural natural period associated with this mode shape was used in the step duration of self-weight dynamic analysis. By relating the structural natural period to the dynamic loading duration, the structural dynamic response was classified into impulsive td/Tn < 0.3, dynamic 0.3 < td/Tn < 3, or quasi-static 3 < td/Tn categories [50]. Where td is the dynamic load duration and Tn is the structural natural period. The structural dynamic characteristic was identified by undertaking the eigenvalue analysis. Four mode shapes considered to to be the most important shapes are presented in Figure 19. The first mode as the highest eigenvalue is usually considered as the critical case. However, mode shapes 1 and 2 in this study were considered not to be the critical cases because the columns, bracings, and lateral beams provide lateral restrains in the longitudinal direction of the actual structure. The mode shape-3 that deflects in the same direction as the blast excitation loading was selected to represent the dynamic characteristic for the structure. Subsequently, the eigenvalue based on mode shape-3 was used in all calculations that are relevant with the structural dynamic characteristics.
By considering the dynamic load duration of td = 0.376 s and the structural natural period of 0.717 s, the ratio of the dynamic loading duration to the natural period is determined as td/Tn = 0.52. The ratio is greater than 0.3 and less than 3, hence falls into the dynamic category. Therefore, dynamic analysis was solved using numerical integration of the dynamic equations of equilibrium that is already implemented in the ABAQUS numerical computational technique.

3.3. Lateral Displacement Response and Ductility Ratio

Structural ductility was calculated using Equation 8 and the value of structural displacement at first yield was determined using initial yield or the tangent method [41]. A new model was developed by modifying the analysis model. The static pushover analysis was performed with only lateral loading applied at the top corner of the frame considered.
The force-displacement resulting from the analysis is presented in Figure 20. By using the curve, the structural displacement at first yield was determined by estimating the yield point location which is defined as the intersection between the tangential lines of elastic and plastic behaviour, where the displacement at first yield is 71 mm. Subsequently, the structural ductility ratio was calculated as the ratio of peak displacement under blast load to the displacement at first yield.
Figure 21 describes the general displacement direction of the frame swaying horizontally in the same direction as the blast excitation load. Two different points depicted in the figure that represents structural height and beam elevations were selected as the node locations to extract the global lateral displacement responses. The lateral displacement at the top right corner (Point A) was considered as a good measurement point for the frame system deformation, whereby the maximum lateral displacements at Point B were used in structural ductility ratio calculation.
The sway histories for these two observation points are presented in Figure 22a,b for all frame analysis with different beam-column connection. The maximum sway responses at lower and upper beam elevations, points A and B, were observed during the blast duration. The maximum responses of the frame without reinforcement are higher than the frames that are reinforced with haunches.
To measure the frames dynamic performance based on the sway responses, the extracted maximum sway displacements at the top elevation for each frame during blast and post blast are presented in Table 1 and Figure 23. Subsequently these maximum sway responses were used to calculate the ductility ratios as tabulated in Table 1. The maximum lateral displacement of 94.6 mm occurred in the frame without haunch reinforcement. Since the ductility ratio is proportional with the maximum displacement, the maximum ductility ratio of 1.33 also occurred in the same frame without haunch. The calculated results as presented in Table 1 show that all maximum sway responses and maximum ductility ratios are less than the maximum criteria recommended [40,46]. The allowable deflection and ductility ratio of frame structures are 1.5 and 240 mm (Height/25), respectively [40,46].
To evaluate the relative differences between frames performance using ductility criteria, the ductility ratios are presented in Figure 24. The trends show that the frames with haunches performed better compared to the frame without haunches. Qualitatively, the Haunch_03 impact on the frame sway response is the highest among all the haunch types. The Haunch_03 connection reinforcement reduced the ductility ratio by 12% against the frame without haunches, while in the case of the Haunch_02 the reduction is 5% and for the Haunch_01 is 4%. The results demonstrated that the Haunch_03 provides a enhanced dynamic performance. It was also observed that the plate stiffeners on beam-column joints (Haunch_02) provided slightly better ductility ratio than the case of the haunch without the plate stiffeners (Haunch_01). In general, the biggest haunch configuration provided the best frame dynamic performance. This finding is relevant to the beam-to-column connections flexibility whereby connection strengthening increases the stiffness of the frame.

4. Discussion

The results of this research are limited and cannot be extrapolated to cover the structural dynamic performance of steel frames with connection haunch reinforcement because this research considered only four cases of frames with different joint haunch configurations. To further understand the dynamic performance aspects of typical steel frame subjected to blast loading, the following points are recommended to be undertaken:
  • In this research, the blast loadings were applied on the columns of a typical steel frame structure, whereas in actual structures, the blast pressure are also applied onto unmodeled items such as pipelines and equipment located on the structure. Further study is recommended to investigate the effect of blast loading on the pipelines and additional equipment attached to the structures, both with and without haunch reinforcement.
  • The Gurson porous model has an important local effect in the beam-column connection. Therefore, further sensitivity study comparing the effects of using material constitutive law of Von Mises versus Gurson model on material plasticity is suggested to investigate the stresses evolution in joint area. In addition to the material model aspect, a solid element is to be included in the study as element selection plays major impact in the analysis result as shown in the study
  • Generally, the analysis results demonstrated an enhanced performance when the haunches with a size greater than the size recommended by AISC [14] was used. To investigate the optimum haunch size, it is recommended to carry out parametric study on haunch sizes and stiffener plate thicknesses. A parametric study on the beam and column sizes are also suggested to understand the effect of a combination of haunches and frame configurations.
  • In the absence of actual blast loading data, it is also recommended that a parametric study on pressure time histories is carried out.

5. Conclusions

The structural eigenvalue was extracted and compared to the dynamic loading duration in order to characterize the dynamic response. The obtained ratio of 0.52 that is greater than 0.3 and less than 3 has classified the dynamic response under the influence of dynamic category. Therefore, the dynamic analysis was solved using numerical integration of dynamic equations of equilibrium that is already implemented in ABAQUS. The structural maximum ductility ratio achieved using haunches was 1.33 and less than the allowable criteria of 1.5. Generally, the structural ductility ratios decreased due to the presence of the haunch reinforcement. The ductility ratio of the frame with Haunch_03 reinforcement was reduced by 12% compared with the frame without haunches, while in the case of the Haunch_02 the reduction was 5% and for Haunch_01 was 4%. According to the evaluation results, the haunch reinforcements have strengthened the selected steel frame and improved dynamic performance compared to the frame with unreinforced connections under blast loading. The Haunch_03 as the biggest reinforcement configuration performed better compared to other connection configurations.

Author Contributions

Conceptualization, supervision, project administration, visualization, M.M.Y; methodology, software, validation, resources, data curation, writing—original draft preparation, M.Y. and J.S; formal analysis, investigation, J.H.S.; supervision, project administration M.M.Y.; writing—review and editing, M.M.Y., M.K.K., P.-S.C. and G.A.R.P. All authors have read and agreed to the published version of the manuscript.

Funding

This research was supported by the Universiti Sains Malaysia bridging grant (304/PAWAM/6316571).

Conflicts of Interest

The authors declare no conflict of interest.

References

  1. Nolan, D.P. Handbook of Fire and Explosion Protection Engineering Principles: In For Oil, Gas, Chemical and Related Facilities, 3rd ed.; Elsevier: Amsterdam, The Netherlands, 2014. [Google Scholar]
  2. Krauthammer, T. Blast-resistant structural concrete and steel connections. Int. J. Impact Eng. 1999, 22, 887–910. [Google Scholar] [CrossRef]
  3. Sabuwala, T.; Linzell, D.; Krauthammer, T. Finite element analysis of steel beam to column connections subjected to blast loads. Int. J. Impact Eng. 2005, 31, 861–876. [Google Scholar] [CrossRef]
  4. Krauthammer, T.; Yim, H.C.; Astarlioglu, S.; Starr, C.; Lim, J. Blast-Induced Response of Moment Connections. In Structural Engineering Research Frontiers; Wallace, J.W., Ed.; American Society of Civil Engineers: Reston, VA, USA, 2007; pp. 1–15. [Google Scholar]
  5. Yim, H.C.; Krauthammer, T. Mechanical properties of single-plate shear connections under monotonic, cyclic, and blast loads. Eng. Struct. 2012, 37, 24–35. [Google Scholar] [CrossRef]
  6. Louca, L.A.; Mohamed Ali, R.M. Improving the Ductile Behaviour of Offshore Topside Structures Under Extreme Loads. Eng. Struct. 2008, 30, 506–521. [Google Scholar] [CrossRef]
  7. Urgessa, G.S.; Arciszewski, T. Blast response comparison of multiple steel frame connections. Finite Elem. Anal. Des. 2011, 47, 668–675. [Google Scholar] [CrossRef]
  8. Yu, Q.S.K.; Uang, C.-M.; Gross, J. Seismic Rehabilitation Design of Steel Moment Connection with Welded Haunch. J. Struct. Eng. 2000, 126, 69–78. [Google Scholar] [CrossRef]
  9. Valente, M. Welded Triangular Haunch for the Seismic Improvement of Steel Beam-to-column Connections. In Design, Fabrication and Economy of Welded Structures; Elsevier: Amsterdam, The Netherlands, 2008; pp. 245–252. [Google Scholar]
  10. Jiang, L.Y.; Liu, G.J.; Sun, X.D. Mechanic Behavior Analysis of Connection with Haunch under Single and Cyclic Load. Appl. Mech. Mater. 2011, 105–107, 848–852. [Google Scholar] [CrossRef]
  11. Liu, Y.J.; Wang, Y. The Study on Mechanical Property for Welded Haunch-Reinforced Seismic Connections of Steel Frame. Appl. Mech. Mater. 2014, 501–504, 485–494. [Google Scholar] [CrossRef]
  12. FEMA-351. Recommended Seismic Evaluation and Upgrade Criteria for Existing Welded Steel Moment-Frame Buildings; Federal Emergency Management Agency: Washington, DC, USA, 2000.
  13. Gross, J.L.; Engelhardt, M.D.; Uang, C.-M.; Kasai, K.; Iwankiw, N. Steel Design Guide Series 12: Modification of Existing Welded Steel Moment Frame Connections for Seismic Resistance; American Institute of Steel Construction: Chicago, IL, USA, 1999. [Google Scholar]
  14. AISC. Seismic Design Manual, 2nd ed.; American Institute of Steel Construction: Chicago, IL, USA, 2012. [Google Scholar]
  15. Chan, S.L.; Chui, P.P.T. Nonlinear Static and Cyclic Analysis of Steel Frames with Semi-Rigid Connections; Elsevier: Amsterdam, The Netherlands, 2000. [Google Scholar]
  16. Chopra, A.K. Dynamics of Structures: Theory and Applications to Earthquake Engineering, 4th ed.; Prentice Hall: Upper Saddle River, NJ, USA, 2012. [Google Scholar]
  17. Craig, R.R.; Kurdila, A. Fundamentals of Structural Dynamics, 2nd ed.; John Wiley & Sons: Hoboken, NJ, USA, 2006. [Google Scholar]
  18. Tedesco, J.W.; McDougal, W.G.; Ross, C.A. Structural Dynamics: Theory and Applications; Addison Wesley Longman: Menlo Park Calif, CA, USA, 1999. [Google Scholar]
  19. Bathe, K.J. Finite Element Procedures; Prentice Hall, Pearson Education, Inc.: Upper Saddle River, NJ, USA, 2006. [Google Scholar]
  20. ABAQUS 6.14. Documentation: Getting Started with Abaqus-Interactive Edition. 2014. Available online: http://130.149.89.49:2080/v6.14/pdf_books/GET_STARTED.pdf (accessed on 16 December 2019).
  21. Kang, K.-Y.; Choi, K.-H.; Choi, J.W.; Ryu, Y.H.; Lee, J.-M. Explosion Induced Dynamic Responses of Blast Wall on FPSO Topside: Blast Loading Application Methods. Int. J. Nav. Archit. Ocean. Eng. 2017, 9, 135–148. [Google Scholar] [CrossRef] [Green Version]
  22. S-DP-001. Desing Principles Technical Safety; Norwegian Technology Standards Institution: Oslo, Norway, 1994. [Google Scholar]
  23. DNV. DNV-RP-C208: Determination of Structural Capacity by Non-linear FE Analysis Methods; Det Norske Veritas; DNV: Oslo, Norway, 2013; Available online: https://pdfs.semanticscholar.org/9051/79af16102318a837f9f2315f2b1064c777ee.pdf (accessed on 16 December 2019).
  24. API RP 2FB. Recommended Practice for the Design of Offshore Facilities Against Fire and Blast Loading; API: Washington, DC, USA, 2006. [Google Scholar]
  25. Amadio, C.; Bedon, C.; Fasan, M.; Pecce, M.R. Refined numerical modelling for the structural assessment of steel-concrete composite beam-to-column joints under seismic loads. Eng. Struct. 2017, 138, 394–409. [Google Scholar] [CrossRef] [Green Version]
  26. Peeters, M.; Santo, G.; Degroote, J.; Van Paepegem, W. Comparison of shell and solid finite element models for the static certification tests of a 43 m wind turbine blade. Energies 2018, 11, 1346. [Google Scholar] [CrossRef] [Green Version]
  27. Momeni, M.; Hadianfard, M.A.; Bedon, C.; Baghlani, A. Numerical damage evaluation assessment of blast loaded steel columns with similar section properties. In Structures; Elsevier: Amsterdam, The Netherlands, 2019. [Google Scholar]
  28. ISO 19901-3. Petroleum and Natural Gas Industries-Specific Requirements for Offshore Structures Part 3: Topsides Structure; BSI: London, UK, 2010. [Google Scholar]
  29. Biggs, J.M. Introduction to Structural Dynamics; McGraw-Hill: New York, NY, USA, 1964. [Google Scholar]
  30. Mohamed Ali, R.M.; Louca, L.A. Performance based design of blast resistant offshore topsides, Part I: Philosophy. J. Constr. Steel Res. 2008, 64, 1030–1045. [Google Scholar] [CrossRef]
  31. Gilsanz, R.; Hamburger, R.; Barker, D.; Smith, J.L.; Rahimian, A. Steel Design Guide 26: Design of Blast Resistant Structures; American Institute of Steel Construction: Chicago, IL, USA, 2013. [Google Scholar]
  32. Burgan, B.A.; Hamdan, F.H.; Burgan, B.A.; Hamdan, F.H. Response of topside structures to fires and explosions: Design considerations. In Proceedings of the Offshore Technology Conference, Houston, TX, USA, 6–9 May 2002. [Google Scholar]
  33. Yasseri, S.F. Performance Based Blast Resistant Design. In FABIG Newsletter Sept 2002; FABIG Newsletter: Ascot, UK, 2002. [Google Scholar]
  34. Hansen, O.R.; Kjellander, M.T.; Pappas, J.A. Explosion Loading on Equipment from CFD Simulations. J. Loss Prev. Proces. Ind. 2016, 44, 601–613. [Google Scholar] [CrossRef]
  35. Walker, S.; Bleach, R.; Carney, S.; Fairlie, G.; Louca, L.A. New Guidance on the Design of Offshore Structures to Resist the Explosion Hazard. In Proceedings of the ASME 2003 22nd International Conference on Offshore Mechanics and Arctic Engineering, Cancun, Mexico, 8–13 June 2003; pp. 111–117. [Google Scholar]
  36. Zhang, D.; Paterson, E.G. A study of wave forces on an offshore platform by direct CFD and Morison equation. E3S Web Conf. 2015, 5, 04002. [Google Scholar] [CrossRef] [Green Version]
  37. Corr, R.B.; Tam, V.H.Y. Gas Explosion Generated Drag Loads in Offshore Installations. J. Loss Prev. Process. Ind. 1998, 11, 43–48. [Google Scholar] [CrossRef]
  38. Dusenberry, D.O. Handbook for Blast-Resistant Design of Buildings; John Wiley & Sons: Hoboken, NJ, USA, 2010. [Google Scholar]
  39. ASCE. Design of Blast-Resistant Buildings in Petrochemical Facilities, 2nd ed.; American Society of Civil Engineers: Reston, VA, USA, 2010. [Google Scholar]
  40. Nourzadeh, D.; Humar, J.; Braimah, A. Comparison of Response of Building Structures to Blast Loading and Seismic Excitations. Procedia Eng. 2017, 210, 320–325. [Google Scholar] [CrossRef]
  41. Yasseri, S.F. An Approximate Method for Blast Resistant Design; FABIG Newsletter: Ascot, UK, 2002. [Google Scholar]
  42. Mohamed Ali, R.M.; Louca, L.A. Performance-based design of blast resistant offshore topsides, Part II: Modelling and design. J. Constr. Steel Res. 2008, 64, 1046–1058. [Google Scholar] [CrossRef]
  43. Goel, M.D.; Matsagar, V.A. Blast-Resistant Design of Structures. Pract. Period. Struct. Des. Constr. 2014, 19, 4014007. [Google Scholar] [CrossRef] [Green Version]
  44. DNV. Design against Accidental Loads. In DNV-RP-C204; Det Norske Veritas; DNV: Oslo, Norway, 2010; Available online: https://rules.dnvgl.com/docs/pdf/DNV/codes/docs/2010-10/RP-C204.pdf (accessed on 16 December 2019).
  45. Bowerman, H.; Owen, G.W.; Rumley, J.H.; Tolloczko, J.A. Interim Guidance Notes for the Design and Protection of Topside Structures Against Explosion and Fire; SCI-P-112/299UK; Steel Construction Institute: Ascot, UK, 1992. [Google Scholar]
  46. Unified Facilities Criteria (UFC) 3-340-02. Structures to Resist the Effects of Accidental Explosions. In US Department of the Army, Navy and Air Force Technical Manual; U.S. Department of Defense: Washington, DC, USA, 2008. [Google Scholar]
  47. Yasseri, S.F. Iso-Damage Diagrams for Blast Resistant Design. In FABIG Newsletter April 2005; FABIG Newsletter: Ascot, UK, 2005. [Google Scholar]
  48. Austrell, P.E.; Dahlblom, O.; Lindemann, J.; Olsson, A.; Olsson, K.G.; Persson, K.; Wernberg, P.A. CALFEM: A Finite Element Toolbox Version 3.4; Division of Structural Mechanics, LTH: Lund, Sweden, 2004. [Google Scholar]
  49. Kim, S.E.; Lee, D.H. Second-Order Distributed Plasticity Analysis of Space Steel Frames. Eng. Struct. 2002, 24, 735–744. [Google Scholar] [CrossRef]
  50. N-004. Design of Steel Structures, No. N-004, Rev. 2. In NORSOK Standard; McGraw-Hill: New York, NY, USA, 2004. [Google Scholar]
Figure 1. Typical steel frames used in offshore structures. (a) Pipe rack; (b) Mechanical Equipment Support.
Applsci 10 01815 g001
Figure 2. Typical sketch of a haunch connection configuration.
Applsci 10 01815 g002
Figure 3. The steel frame model description.
Applsci 10 01815 g003
Figure 4. The welded triangular haunch configuration.
Applsci 10 01815 g004
Figure 5. Different details of joint configurations with reinforcement. (a) Case 1—Beam-column connection without haunch; (b) Case 2—Haunch_01 Beam-column connection with haunch by Chopra [16] but no web stiffener plate on the beam and no continuity plates for haunch flange; (c) Case 3—Haunch_02 Beam-column connection with haunch by Chopra [16]. Web stiffener plates and haunch continuity plates were provided on the beam and column, respectively; and (d) Case 4—Haunch_03 Beam-column connection with haunch but the haunch configuration is modified by providing the slope angle of 45°.
Applsci 10 01815 g005
Figure 6. Typical tie constraint at beam-column connection.
Applsci 10 01815 g006
Figure 7. Finer mesh size at used in the connection region.
Applsci 10 01815 g007
Figure 8. Pipe inertia masses and locations.
Applsci 10 01815 g008
Figure 9. Pressure durations relationship based on API RP 2FB [24].
Applsci 10 01815 g009
Figure 10. Dynamic pressure history.
Applsci 10 01815 g010
Figure 11. Vertical reaction force for instantaneously applied self-weight.
Applsci 10 01815 g011
Figure 12. Dynamic analysis steps and durations.
Applsci 10 01815 g012
Figure 13. Vertical reaction force after ramp loading implementation in the self-weight step.
Applsci 10 01815 g013
Figure 14. A two-storey steel frame under dynamic loading [15].
Applsci 10 01815 g014
Figure 15. Elastic analysis dynamic response ABAQUS, Chan and Chui [15] and CALFEM/MATLAB.
Applsci 10 01815 g015
Figure 16. Elastoplastic analysis dynamic response ABAQUS and Chan and Chui [15].
Applsci 10 01815 g016
Figure 17. Structural natural frequency from (a) ABAQUS and (b) CALFEM/MATLAB.
Applsci 10 01815 g017
Figure 18. Yielding and buckling in the validated model.
Applsci 10 01815 g018
Figure 19. Structural eigen modes and eigen periods. (a) Mode shape 1; (b) Mode shape 2; (c) Mode shape 3; and (d) Mode shape 4.
Applsci 10 01815 g019
Figure 20. Structural displacement at first yield approximation.
Applsci 10 01815 g020
Figure 21. Selected points for structural displacement location.
Applsci 10 01815 g021
Figure 22. (a) Lateral displacement response history at top right corner of the frame; (b) Lateral displacement response history at right end of the lower beam.
Applsci 10 01815 g022
Figure 23. Maximum lateral displacement response.
Applsci 10 01815 g023
Figure 24. Frames ductility.
Applsci 10 01815 g024
Table 1. Summary of maximum displacement at all beam elevations for connection types of all cases considered in this study.
CaseLocationMaximum Displacement, u (mm)Ductility µ 1
BlastPost-BlastBlastPost-Blast
No haunchUpper beam94.661.41.330.86
Lower beam34.929.6--
Haunch_01Upper beam91.160.01.280.84
Lower beam33.129.6--
Haunch_02Upper beam90.260.61.270.85
Lower beam32.730.0--
Haunch_03Upper beam83.762.41.180.88
Lower beam31.431.7--
1 From Equation (8).

