Article

CBR Predictive Models for Granular Bases Using Physical and Structural Properties

by
Mildred Estivaly Montes-Arvizu
1,
Omar Chavez-Alegria
1,
Eduardo Rojas-Gonzalez
1,
Jose Ramon Gaxiola-Camacho
2 and
Jesus Roberto Millan-Almaraz
3,*
1
Department of Civil Engineering, Autonomous University of Queretaro, 76010 Queretaro, Mexico
2
Department of Civil Engineering, Autonomous University of Sinaloa, 80020 Culiacan, Mexico
3
Department of Physics and Mathematics, Autonomous University of Sinaloa, 80020 Culiacan, Mexico
*
Author to whom correspondence should be addressed.
Appl. Sci. 2020, 10(4), 1414; https://doi.org/10.3390/app10041414
Submission received: 31 January 2020 / Revised: 15 February 2020 / Accepted: 17 February 2020 / Published: 20 February 2020
(This article belongs to the Special Issue Building Materials from Fundamentals to Applications)

Abstract

:
The California bearing ratio (CBR) test evaluates the structure of the layers of pavements. Such a test is laborious, time-consuming, and its results are generally affected by sample disturbance and tests conditions. The main objective of this research was to build a numerical model for the prediction of CBR tests that might substitute laboratory tests. The model was based on structural and physical parameters of granular bases. Four different materials from the central region (Querétaro) and north (Mexicali) of Mexico were used for the experimental work. Using the above-mentioned materials, 36 samples were fabricated, and six of them were used for the evaluation of the model presented in this research. Numerical and experimental comparisons demonstrated the adequacy of the model to predict the result of CBR tests from soil parameters.

Graphical Abstract

1. Introduction

The pavement is a structure formed by several soil layers designed to provide and maintain a smooth surface for several applications. It requires supporting and distributing the stresses as well as minimizing permanent deformations on it. In general terms, the structure is formed by the main pavement layer, the base, and the sub-base, which are built on a prepared subgrade surface [1,2]. In addition, the pavement structure can be constructed using reinforced concrete or simply asphalt emulsion.
Among the main factors affecting the performance and quality of pavements are the mechanical and hydraulic characteristics of materials employed for each layer, climatic conditions, equipment and technology used in the site, and the skills of workmen involved in the construction. Due to these and other factors, it is complicated to provide quality control schemes in the field of engineering of pavements [3]. Hence, it is important to check and verify certain parameters used in pavements during their construction. Otherwise, the predictions made for the durability and serviceability of pavements will not be realistic, affecting the costs of maintenance and rehabilitation [4]. The design of pavements requires the knowledge of soil mechanics and specifically the behavior of compacted soils. This discipline establishes the laboratory and field tests required to evaluate the quality of compacted layers as well as the needed conditions in terms of durability and serviceability of a pavement subjected to certain loading conditions. In general, field and laboratory tests must meet the following requirements: (a) simple and standardized, (b) swift, (c) easy to interpret, and (d) use inexpensive tools easy to calibrate and use [5].
It is well-documented in the literature that granular soils are the most common materials used for the construction of bases for pavements [2]. These soils can be mixed with lime, asphalt, or other chemical products to increase its strength and reduce deformations [2]. Then, granular compacted soil layers are stiff, with large hydraulic conductivity, and show low deformations when subjected to cyclic loading [6]. When such materials are not well-compacted, or the strength of aggregates is deficient, fissuring and large permanent deformations occur on the pavement. Because of this and some other reasons, granular materials used on bases and subbases of pavements require a previous and rigorous evaluation. One of the tests employed for this purpose is the California bearing ratio (CBR) test [7]. Although pavements design has evolved in the past fifteen years, and CBR tests have been displaced by cyclic triaxial tests to define the resilient modulus of soil, these last tests are time-consuming and require specialized and expensive equipment. This is one of the reasons why CBR tests are still in use, especially in developing countries [8].
In general, the CBR test is a strength index used for the design of pavements that provides the structural capacity of the different layers of soil employed in the construction of bases, subbases, and subgrades. It can be described as a loading-deformation test that can be performed in the field or laboratory. The results of such a test are used to define the thickness of the different layers of a paved surface, depending on the loading conditions. This value depends on the compaction method and the type of soil. For the supervision of the quality of compacted layers on the field, it is normal to perform these tests on unsaturated soil samples [9,10]. In addition, it is important to mention that the CBR test is frequently time-consuming and burdensome. Its results are affected by soil disturbance and test conditions [5]. Because of this, it is important to implement models that are both reliable and easy to use. If properly generated, the models presented in this research may substitute or complement the CBR tests. Hence, such models are based on correlations between physical and structural properties.
It is well-known that different models have been developed to predict the results of the CBR test. Some models are based on compressibility of the material, the dry lose weight volumetric, and the optimum water content. However, their results are mostly unsatisfactory. Other models use the soil properties, such as the plastic index, gradation, and soil compressibility. The results of such models are complex, presenting low precision because of an inadequate weight on the properties of the soil [11,12].
In this paper, the proposed model had been built from the results of CBR tests performed on four different materials obtained from two cities of Mexico: (1) Querétaro in the central part, and (2) Mexicali on the north. These two different materials were used to verify the applicability of the model for different soils as climatic conditions influence the physical properties of soils [3]. In summary, the main objective of this research was to generate a general, precise, and reliable mathematical model that could simulate the results of the CBR test. First, the gravimetric and volumetric parameters of both materials were obtained. Then, several CBR tests were performed, and the results of them were correlated with the parameters of the soil. Afterward, different models were tested using the proposed correlations. Finally, the results of the different models were compared with the results of real CBR tests, demonstrating the potential benefits of the proposed models. In this sense, the new aspects and contributions of the CBR models presented in this research to the literature remain in the introduction of mathematic expressions that can be used in the pavement engineering area to save time and effort when carrying out the widely-used CBR tests.

2. Materials and Methods

Characteristics of Tested Materials

Material 1 was obtained from a quarry in the city of Querétaro, while materials 2, 3, and 4 were obtained from the city of Mexicali. Samples from both cities were extracted according to the recommendations reported in the ASTM D75 Norm [13], and also, the process documented in the norm ASTM C702/C702M-11 was followed [14]. The location and geological characteristics of the above-mentioned materials are summarized in Table 1.
In the condition received from the quarry, Table 2 presents some of the main characteristics of the materials studied in this research. The CBR values corresponded to samples compacted at the optimum water content, resulting from the Modified Proctor compaction tests. Besides, for their classification, the following 6 tests were performed: (1) consistency limits according to standard ASTM D4318-05 [15], (2) dry loose volumetric mass according to standard M-MMP-1-08/03 [16], (3) relative density of solids according to standard ASTM C127-12 [17], (4) modified Proctor compaction test according to standard ASTM D1557-09 [18], (5) CBR test according to standard ASTM D1883-07 [19], and (6) water content according to standard ASTM D2216-10 [20].
For the thirty-six different samples, their grain size distribution was obtained. Also, the main volumetric and gravimetric parameters for these samples were obtained, as well as the results of the CBR test. Seven different samples were tested from quarry 1 (samples 1 to 7). These samples were prepared with different grain sizes distributions and water contents. In this way, sample 1 showed the original grain size distribution of the quarry. The grain size distribution for samples 2, 3, and 4 was modified to produce samples with 50% gravel and 50% sand. Samples 5, 6, and 7 only contained sand. Samples with different characteristics were prepared from quarries 2, 3, and 4:10 for quarry 2, 9 for quarry 3, and 10 for quarry 4 (samples 8 to 36). Samples from the same quarry presented similar grain size distributions. Figure 1 shows the grain size distribution for the different samples according to standard ASTM C136-06 [15].
Some samples were compacted according to the Modified Proctor compaction method and considering different water contents. Other samples were prepared using different compaction energies (CE) with the purpose of analyzing its effect on the CBR results. For such samples, the number of blows was modified. Thus, samples 1 to 4 from quarry 1, samples 8 to 11 from quarry 2, samples 18 to 21 from quarry 3, and samples 27 to 31 from quarry 4 were compacted according to the Modified Proctor compaction method, and the samples 5 to 7 from quarry 1, 12 to 17 from quarry 2, samples 22 to 26 from quarry 3, and samples 32 to 36 from quarry 4 were compacted with the same equipment and procedure but applying a different number of blows. The compaction energy and water content for each sample are summarized in Table 3.
In addition to the main characteristics of the different samples, their volumetric and gravimetric parameters after compaction were obtained according to the procedures established by [21]. Such parameters are shown in Table 3 and include the volumetric weight (γm), the volumetric weight of solids (γs), the specific density of solids (ss), the relative density (Cr), the void ratio (e), the porosity (n), the degree of saturation (Gw), the degree of concentration of air (GA), the volumetric water content (θ), the degree of compaction with respect to dry volumetric weight from a compaction test (GC).
The low CBR values of some samples from the same quarry were related to their low compaction energy. Therefore, CBR values were influenced by both the grain size distribution and compaction energy.

3. Results

In order to define which gravimetric and volumetric parameters have the largest influence on the values of CBR tests, dispersion graphics were used, and a tendency line was plotted for different parameters. This task was performed by plotting the coefficient R2, which indicated the reliability or accuracy of the correlation. In other words, the more R2 coefficient approached unity, the more reliable or accurate was the correlation. Table 4 summarizes the values of coefficient R2 for each one of the volumetric and gravimetric parameters described in Table 3 with respect to the thirty-four CBR tests.
It could be observed that the values of coefficient R2 showed low values for all volumetric and gravimetric parameters of the soil. This means that not only a single parameter was influencing the CBR values but a combination of them. Also, different parameters affected CBR values, depending on the type of soil. For this reason, different equations were developed, depending on the type of material.
Due to the nature of the soils tested, five groups of correlation analyses were performed for the different samples according to their classification: (1) samples with classification GW-GM and GP, (2) samples with classification SP, (3) samples with classification GW, (4) samples with classification GP, and (5) the combination of samples with classification GW or GP. Only these groups were created since the samples tested belong to such soil classifications. In order to develop other correlation analyses of materials with different soil classifications, it is necessary to perform tests on other materials with different graduation than those analyzed in this research.
Table 5 shows the results of coefficient R2 for the correlations, considering individually each one of the fourteen parameters for each group. Figure 2a–e shows these correlations.
In general, the parameters presenting the largest correlations with the CBR test are the dry volumetric weight (γd), the water content (w), and the void ratio (e). These correlations could be observed in Figure 2a. For materials GW-GM and SM, a linear relationship with γd could be observed with R2= 0.83. For w, a polynomial correlation was observed with R2 = 0.91. For e also, a linear relationship was observed with R2 = 0.86.
In the case of the materials SP, CBR values correlated linearly with parameters γd with R2 = 0.73; w with R2 = 0.7; e and n with R2 = 0.73. Also, for materials GW, CBR values correlated linearly with the following four parameters: (1) γd with R2 = 0.97, (2) γm with R2 = 0.79, (3) e with R2 = 0.96, and (4) n with R2 = 0.96. Figure 2c illustrates these correlations. Materials GP showed also linear relationships with the following parameters γd, e, and n with R2 = 0.85 and γm with R2 = 0.71. These correlations are shown in Figure 2d. The combination of the materials with classification GW and GP showed correlations with parameters γd with R2 = 0.93; γm with R2 = 0.85; e and n with R2 = 0.93. Such correlations are shown in Figure 2d.
From the results summarized in Table 5, it could be observed that water content influenced the results of sandy soils (materials SP). The largest correlations of parameters γd, e, n, and γm were obtained for gravels (materials GW and GP), while the lower for sandy materials. As the parameter w might show seasonal variations during the dry and wet season, also CBR values might be subjected to these seasonal variations.

3.1. Regression Analysis

Regression analysis is a statistical method used to identify the relationship between dependent and independent variables. It provided the coefficients of the best fitting relationship between dependent and independent variables. In this case, CBR values represented the dependent variable, while soil parameters γd, γm, w, and e represented the independent variables.

3.2. CBR Predictive Model

Table 6 shows the coefficients of the CBR predictive models for each type of soil obtained from the multi-linear regression analysis. For this technique, how the coefficient R2 was obtained had no relevance, since this parameter was used to determine the level of influence on the CBR, so, it was valid to use multilinear regression analysis even though the coefficient R2 of w was obtained by means of a polynomial function. Also, the linear multiple regression analysis yielded values for coefficients that made up equations whose variables are of degree 1 (linear). It could be observed that the standard deviation for material GP was larger when compared with the combination of models for GP and GW. For this reason, a model was proposed for both materials.
In Table 6, it could be noticed that the predicted CBR values for gravels were closer to experimental results when the soil was clean with no traces of plastic soil. Therefore, four models had been established for the materials analyzed in this research. The four models (Equation (4)) could be used in materials GW or GP, but it was decided to apply only in GP materials since model 3 (Equation (3)) had greater reliability when applied to GW materials. Besides, γd was replaced by its equivalence (Equation (5)), where γ0 is the specific weight of distilled water (equal to 1 or an entire power of 10); n was eliminated; hence it is related to Equation (6).
Soils GW-GM and SM (plastic):
C B R =   0.6231 S S 1 + ω S S γ O 9.5447 w 1319.1924 e + 1924.9925
For soils SP with no traces of plastic soils:
C B R = 1.6064 γ d 5.3303 w + 2462.2411 e 3913.2472
For clean GW soils with no traces of plastic soils:
C B R = 0.5979 S S 1 + ω S S γ O + 0.0024 γ m + 469.4978 e 1307.6738
For soils GP with no traces of plastic soil:
C B R = 0.1856 S S 1 + ω S S γ O 0.0551 γ m 346.259 e 113.4502
S S 1 + ω S S γ O
n = e 1 + e
The above-mentioned models were selected, depending on the soil classification, according to USCS. Hence, they required volumetric weight, void ratio, and water content of the compacted material according to the Modified Proctor test [18].
As previously mentioned, the precision of such models had been tested using six samples (37 to 42) of compacted material obtained from three different quarries. Samples 37 and 38 came from different quarries and were tested at the optimum water content, whereas samples 39 to 42 were compacted at a water content different from the optimum. For sample 41, the CBR test was performed at the maximum dry volumetric weight. Table 7 shows the CBR values obtained in the laboratory and those obtained with the corresponding predictive model according to the soil classification and the consistency limits.
Samples 39 and 42 showed the largest deviation from the experimental CBR value. This might suggest that Equation (1) was more accurate when it was applied to soils compacted at the maximum dry density. This was so because the model was built from samples compacted at the optimum level. In addition, the model applied to sample 38 showed a difference of 24, which was reasonable, considering the differences in materials coming from different quarries.
It is important to mention that the CBR predictive models could be applied to materials showing the same geologic conditions, mechanical parameters, and consistency limits. Thus, due to this important limitation, it is necessary to develop more models of prediction of CBR, particularly applicable to materials with different classifications than those analyzed in this research. In addition to the classification of soils, consideration should be given to the plasticity of the material.

4. Discussion

The adequacy in developing CBR predictive models comes from the fact that laboratory tests need to be quick, easy, with no interference of the operator. The use of an analytical model to predict the result of CBR tests from simpler and current laboratory tests may yield in time-saving while keeping the same precision. In addition, it must be considered that the CBR values for a similar soil may be very diverse; such a variation depends on the number of combinations of the factors that define soil resistance. However, once results are obtained, certain correlations can be established to estimate the CBR value for a particular type of soil. Finally, it is important to mention that the CBR models presented in this paper might be restricted, in a certain way, to the physical conditions of the selected soil samples.

5. Conclusions

Based on the results presented in this paper, the following conclusions could be stated.
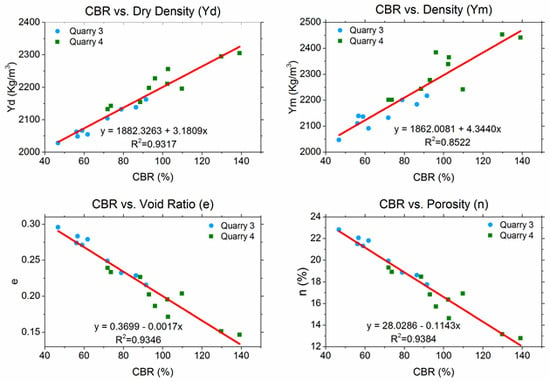
  • The predictive models for CBR tests were applied according to the classification of the considered soil. Four different CBR predictive models were obtained: for gravel and sand with some plasticity (GW-GM and SM); for sands (SP); for clean gravel (GW); and clean gravel well or poorly graded (GW or GP).
  • For the development of the regression models, 14 parameters of the soil were considered.
  • The more influencing parameters on the results of CBR tests were: γm, γd, e, n, and w. The last parameter presented an important influence on plastic materials.
  • The precision of the models presented in this research was tested using compacted samples from different quarries to those initially employed for the development of the models. In this sense, it was observed that Equation (1) was more precise for samples compacted at the optimum level. On the other hand, Equation (4) presented important differences to experimental results, which might come from the origin of the parent rock.

Author Contributions

M.E.M.-A. carried out this project and its required experiments. O.C.-A. and E.R.-G. designed this study as thesis advisors. Finally, J.R.M.-A. and J.R.G.-C. provided support to write this scientific paper and its statistical analysis. All authors have read and agreed to the published version of the manuscript.

Funding

Authors gratefully acknowledge the financial support of the Consejo Nacional de Ciencia y Tecnología (CONACYT-Mexico) for this research.

Acknowledgments

Authors wish to thank CONACYT-Mexico for the sabbatical research stay for Jesus R. Millan Almaraz.

Conflicts of Interest

The authors declare no conflict of interest in this paper.

References

  1. Gurung, N. A laboratory study on the tensile response of unbound granular base road pavement model using geosynthetics. Geotext. Geomembr. 2003, 21, 59–68. [Google Scholar] [CrossRef]
  2. Alawi, M.H.; Helal, M.M. A mathematical model for the distribution of heat through pavement layers in Makkah roads. J. King Saud Univ.—Eng. Sci. 2014, 26, 41–48. [Google Scholar] [CrossRef] [Green Version]
  3. Wang, Y.; Xuan, W.; Ma, X. Statistical Methods Applied to Pavement Construction Quality Assurance. In ICCTP 2010: Integred Transportation Systems-Green Intelligent Reliable; American Society of Civil Engineers: Reston, VA, USA, 2010. [Google Scholar]
  4. Tan, S.G.; Cheng, D. Quality Assurance of Performance Data for Pavement Management Systems. In Proceedings of the Geo-Hubei 2014 International Conference on Sustainable Civil Infrastructure, Yichang, Hubei, China, 20–22 July 2014. [Google Scholar]
  5. Rico, A.; Del Castillo, H. La Ingeniería de Suelos en las Vías Terrestres Vol. 2 Carreteras, Ferrocarriles y Aeropuertos, 1st ed.; Limusa Noriega Editores: Mexico City, Mexico, 1998. [Google Scholar]
  6. Karrech, A.; Duhamel, D.; Bonnet, G.; Roux, J.N.; Chevoir, F.; Canou, J.; Sab, K. A computational procedure for the prediction of settlement in granular materials under cyclic loading. Comput. Methods Appl. Mech. Eng. 2007, 197, 80–94. [Google Scholar] [CrossRef] [Green Version]
  7. Jiang, Y.; Wong, L.N.Y.; Ren, J. A numerical test method of California bearing ratio on graded crushed rocks using particle flow modeling. J. Traffic Transp. Eng. 2015, 2, 107–115. [Google Scholar] [CrossRef]
  8. Araya, A.; Molenaar, A.; Houben, L. Characterization of unbound granular materials using repeated load CBR and Triaxial Testing. In Proceedings of the GeoShanghai International Conference 2010, Shangai, China, 3–5 June 2010. [Google Scholar]
  9. Liu, Z.; Zhang, Y.; Di, J. Analysis on the Factors affecting the CBR value of silt oadbed. In Proceedings of the International Conference on Transportation Engineering, Chengdu, China, 25–27 July 2009. [Google Scholar]
  10. Joseph, D.; Vipulanandan, C. Characterization of Field Compacted Soils (Unsoaked) Using the California Bearing Ratio Test. In Proceedings of the Geo-Frontiers Congress 2011, Dallas, TX, USA, 13–16 March 2011. [Google Scholar]
  11. Patel, M.A.; Patel, H.S. Laboratory Assessment to Correlate Strength Parameter from Physical Properties of Subgrade. Procedia Eng. 2013, 51, 200–209. [Google Scholar] [CrossRef] [Green Version]
  12. Rollings, M.P.; Rollings, R.S. Geotechnical Materials in Construction, 1st ed.; McGraw-Hill Professional: New York, NY, USA, 1996. [Google Scholar]
  13. ASTM D75/D75M-09. Standard Practice for Sampling Aggregates; ASTM International: West Conshohocken, PA, USA, 2009. [Google Scholar]
  14. ASTM C702/C702M-11. Standard Specification for Materials for Reducing Samples of Aggregate to Testing Size; ASTM International: West Conshohocken, PA, USA, 2011. [Google Scholar]
  15. ASTM D4318-5. Standard Practice for Liquid Limit, Plastic Limit, and Plasticity Index of Soils; ASTM International: West Conshohocken, PA, USA, 2005. [Google Scholar]
  16. SCT M-MMP-1-08/03. Masas Volumétricas y Coeficientes de Variación Volumétrica; Secretaría de Comunicaciones y Transportes: Mexico City, Mexico, 2003. [Google Scholar]
  17. ASTM C127-12. Standard Practice for Density, Relative Density (Specific Gravity), and Absorption of Coarse Aggregate; ASTM International: West Conshohocken, PA, USA, 2012. [Google Scholar]
  18. ASTM D1557-9. Standard Specification for Materials for Laboratory Compaction Characteristics of Soil Using Modified Effort (56,000 ft-lbf/ft3(2700 kN-m/m3); ASTM International: West Conshohocken, PA, USA, 2009. [Google Scholar]
  19. ASTM D1883-7. Standard Specification for Materials for CBR (California Bearing Ratio) of Laboratory-Compacted Soils; ASTM International: West Conshohocken, PA, USA, 2007. [Google Scholar]
  20. ASTM D2216-10. Standard Specification for Laboratory Determination of Water (Moisture) Content of Soil and Rock by Mass; ASTM International: West Conshohocken, PA, USA, 2010. [Google Scholar]
  21. Juarez, E.; Rico, A. Mecánica de Suelos Tomo I: Fundamentos de la Mecánica de Suelos, 1st ed.; Limusa: Mexico City, Mexico, 2012. [Google Scholar]
Figure 1. Grain size distribution for the samples.
Applsci 10 01414 g001
Figure 2. Parameters influencing California bearing ratio (CBR) values: (a) materials GW with γd, w, and e; (b) materials SP with γd, w, e and n; (c) materials GW with γd, γm, e, and n; (d) materials GP with γd, γm, e and n; (e) combination of materials GW and GP with γd, γm, e and n.
Applsci 10 01414 g002aApplsci 10 01414 g002bApplsci 10 01414 g002c
Table 1. Location and geological characteristics of the rocks, treatment, and classification of the soils.
LocationQuarry Coordinates UTM (m)Origin of RockType of MaterialTreatmentClassification USCS
NorthEast
Querétaro12281062.80363855.13Igneous basic extrusive BasaltTotal crushing and sievingGW-GM y SM
Mexicali23603070.10629274.95SedimentaryClasticPartial crushing and sievingSP
33573429.00657540.00SedimentaryClasticPartial crushing and sievingGW
43568274.44657006.26SedimentaryClasticPartial crushing and sievingGP
USCS: unified soil classification system; GW: well-graded gravel; GM: silty gravel; SM: silty sand; SP: poorly graded sand; GP: poorly-graded gravel; GW-GM: well-graded gravel with silt.
Table 2. Main characteristics of samples from the different quarries.
Quarry LVW (kg/m3)SD
Ss
Modified Proctor Compaction TestCBR (%)USCS
LL (%)PI (%)Direct ValuesCorrected ValuesAdded w (%)CE (kN*m/m3)
γd (kg/m3)wopt (%)γd (kg/m3)wopt (%)
1271217722.7522408.023146.98.32692111GW-GM
2--18112.6322305.322724.45.3264286SP
3--16812.6321622.622941.62.6264292GW
4--17042.6423045.923464.45.92645139GP
LL: liquid limit; PI: plastic index; LVW: loose volumetric weight; SD: specific density; γd: dry specific density; wopt: optimum water content; w: water content; CE: compaction energy.
Table 3. Volumetric and gravimetric parameters of soil samples.
QuarryCE (kN-m/m3)Sampleγd (kg/m3)CBR (%)GravimetricVolumetric
(kg/m3) (%) (%)
γsγdγmSswCrenGwGaθGc
12692117721112753220823912.758.3930.252092718.495
2676217591842757221723272.764.9830.2420554410.997
2690317591782757224123942.766.8910.2319811815.298
2673417591472757219723492.767.9820.2520742515.2108
78651616982810204122262.818.51000.3827673218.5100
60161616492815195720912.816.8800.4430435613.496
60271616282815198619862.815.0870.463229709.5100
2264282158722634215822482.634.2830.221850509.083
92230862634223023482.635.31000.1815772311.7100
102192722634219223332.636.4910.2017841614.191
112144432634214423262.638.5790.231998218.279
1179122090552634209021982.635.2830.2621534710.983
132118532634211822432.635.9910.2420643612.691
142146642634214622882.636.61000.2319772314.2100
152122562634212222742.637.1930.2419782215.193
162076412634207622572.638.7790.2721851518.179
172084262634208422952.6310.2810.2621102−221.281
32642182104722627210421322.631.4880.252014862.888
192138862627213821842.632.1950.231925754.695
202162922627216222172.632.61000.221832685.6100
212132792627213222012.633.2940.231937636.994
1179222028472627202820462.630.9900.30238921.990
232054622627205420912.631.8970.282217833.797
242062562627206221102.632.3990.272222784.899
252066592627206621372.633.41000.272133677.0100
262048572627204821392.634.5950.282242589.295
426452721961102642219622412.642.1820.201727734.682
282198932642219822772.643.6820.201747537.982
2922561032642225623652.644.8920.1715752510.992
3023041392642230424412.645.91000.1513107−713.6100
3122941302642229424532.646.9980.1513120−2015.898
1181322142742642214222012.642.7840.231931695.984
332132722642213222012.643.2820.241936646.982
342154892642215422432.644.1860.231848528.986
3522101022642221023392.645.8970.2016792112.997
362226962642222623842.647.01000.1916100015.7100
Table 4. Values of coefficient R2 for the thirty-six CBR tests related to different parameters.
QuarrySampleGravimetric VolumetricCE
γsγdγm s s w Cr. e n G w G a θ G C
1–41–360.0960.5450.4020.0960.0040.0240.1970.2050.0830.0830.0130.0410.355
Table 5. Coefficient R2 for the correlations of CBR values and soil parameters for different materials.
USCSGravimetric (g/cm3)Volumetric (%)CE
γsγdγm s s w Cr e n G w G a θ G C
GW-GMSM0.64700.83120.77580.72910.91450.25520.86310.85400.39290.39290.03930.01590.7573
SP----0.72930.0634----0.70300.45400.72930.72930.27440.27440.64540.44860.3166
GW----0.96820.7999----0.00370.02010.96660.96750.09340.09340.01180.02010.8124
GP----0.85560.7118----0.30940.44610.85270.85560.54420.54420.35320.44550.4796
GW and GP0.46120.93170.85220.46120.43150.01010.93460.93840.63360.63360.48140.00080.3571
Table 6. Coefficients of the predictive models for each type of soil.
USCSγd (x1)γm (x2) w e n ConstantR2ErrorStandard Deviation
GW-GM
SM
−0.6231----−9.5447−1319.1924----1924.99250.905226.34703.7380
SP1.6064----−5.33032462.24110−3913.24720.95594.48941.7746
GW0.59790.0024----469.49780−1307.67380.96863.42162.4894
GP13.93300.0667----4816.3003292.0012−36564.56090.89389.42882.4352
GW and GP0.1856−0.0551----−346.2590−113.45020.92566.81436.0547
Table 7. The precision of CBR predictive models.
QuarrySampleUSCSConsistency LimitsOrigin of RockTypeModelCBR (%)Difference
ExplNum
537GWPlasticIgneous extrusive basicCrushedEquation (1)1601644
638GPNon plasticIgneous extrusive acidSievedEquation (4)1101044
739GWPlasticIgneous extrusive basicCrushedEquation (1)11117463
40GWPlasticEquation (1)1751805
41GWPlasticEquation (1)17018010
42GWPlasticEquation (1)12417652

