Quantifying the Effect of Catalysts on the Lifetime of Transformer Oil


Faculty of Electrical Engineering, Regional Innovation Centre for Electrical Engineering, University of West Bohemia, Univerzitní 8, 306 14 Pilsen, Czech Republic
*
Author to whom correspondence should be addressed.
Appl. Sci. 2020, 10(4), 1309; https://doi.org/10.3390/app10041309
Submission received: 11 October 2019
/
Revised: 1 November 2019
/
Accepted: 7 February 2020
/
Published: 14 February 2020
(This article belongs to the Section Electrical, Electronics and Communications Engineering)
Abstract
:The effect of catalysts in the form of a transformer copper winding with Kraft paper insulation on the lifetime of transformer oil was studied via ultraviolet-visible (UV-Vis) spectroscopy and Fourier transform infrared (FT-IR) spectroscopy. The tested naphthenic mineral oil was exposed to accelerated thermo-oxidative aging with limited access to air at temperatures of 110, 120, and 130 °C for times ranging from 24 to 2424 h in the presence and absence of catalysts. The UV-Vis technique focused on assessing the change in the color of the oil and quantified a 35%–45% reduction in oil lifetime, depending on the aging temperature, due to the influence of catalysts. The FT-IR analysis focused on the decrease in the spectral band at 3650 cm−1, which corresponds to the low-temperature antioxidant present in the oil, and quantified the 35% reduction in the oil lifetime independent of the aging temperature. This high rate of reduction in the transformer oil lifetime points to the dominant catalytic role of the Kraft paper and copper during the aging process of the transformer insulation system.
1. Introduction
Power transformers are an integral component of the electricity transmission network. These devices are essential for the efficient and safe conversion of electricity between diverse voltage systems, as well as for the separation of the transmission system into several subsystems. Considering that transformers are among the most expensive parts of the transmission network due to their size and complexity [1], their planned service lifetime is several decades under standard operating conditions. The insulating system of the transformer, commonly composed of mineral oil and Kraft paper, is considered the most sensitive to aging [2,3], and as such, it has attracted the attention of researchers and engineers. While the paper part of the transformer insulation cannot be easily replaced during the planned service lifetime [4], the state of the oil itself is usually continuously monitored, and where appropriate, the oil can be either reclaimed or replaced.
Transformer mineral oils contain a mixture of many different organic molecular species, but are generally composed of three main components: alkanes, naphthenes, and aromatic hydrocarbons. The alkanes include saturated linear (normal) and branched (iso-) paraffins, the naphthenes include alkylated carbon rings, and the aromatic hydrocarbons contain unsaturated discrete or fused aromatic rings that may have side alkyl- or naphthenic substituents [5]. The oil properties are determined by the ratio of these three components and naturally degrade with transformer operation. As such, the condition of the transformer oil directly influences the lifetime of the transformer.
It is generally known that the aging of transformer insulation is principally a function of temperature, humidity, and oxygen. However, with modern cooling systems, the effect of moisture and oxygen is suppressed; therefore, the temperature remains a dominant factor influencing the lifetime of the transformer insulation [6]. A convenient way to slow down the thermal oxidation of the used mineral oil, and thus to prevent the fast degradation of the whole transformer insulating system, is the addition of an appropriate antioxidant. A phenolic antioxidant, such as 2,6-di-tert-butyl-4-methylphenol (CAS no. 128-37-0), also called 2,6-di-tert-butyl-p-cresol (DBPC), is usually used for such purposes [7,8].
Nevertheless, the properties of mineral oil do not deteriorate solely under the influence of the abovementioned temperature, but also because of the presence of metallic particles originating mainly from copper winding wrapped in the insulating paper and immersed in the transformer oil. Metallic particles, together with moisture, which is naturally present in the structure of cellulose paper, can synergistically act as catalysts [9,10], accelerate oil-paper insulation aging, and hence, reduce the lifetime of the whole transformer. For these reasons, the influence of catalysts on the aging mechanisms of transformer insulation has attracted the attention of numerous researchers in recent years, leading to studies by Kalantar [11] and Amimoto [12], technical brochure CIGRE WG A2-32 [13], and others. The majority of these studies have addressed the role of copper sulfide formation and its influence on transformer failure. With a few exceptions, e.g., a recent study by Hao et al. [14], insufficient data exist to enable the exact quantification of the synergic effect of catalysts on the lifetime of transformer mineral oil. Hao et al. [14] addressed the catalytic effect of copper on the thermal aging rate and the micro/nanolevel morphology of the oil-paper insulation aged with and without copper at 130 °C for 80 days (1920 h). These researchers confirmed that copper plays a catalytic role in the aging of naphthenic oil-paper insulation, and that this role becomes obvious during the later stages of the aging process. The thermal aging rate of paper was higher for the oil-paper insulation aged with copper. Nevertheless, considering that all of the aforementioned findings, that most likely depend on the temperature of aging, it is necessary to extend the research activities in this field and attempt to quantify the effect of catalysts on the lifetime of transformer oil at various aging temperatures. Such an experiment would provide further insight into the dynamics of mineral oil aging in the presence and absence of catalysts.
For these reasons, within this study, the tested mineral oil was exposed to accelerated thermo-oxidative aging at temperatures of 110, 120, and 130 °C for times ranging from 24 to 2424 h in the presence and absence of catalysts. The effect of catalysts on the lifetime of transformer oil was then quantified using ultraviolet-visible (UV-Vis) spectroscopy and Fourier transform infrared (FT-IR) spectroscopy.
2. A Brief Overview of Methods for Assessing the Condition of Transformer Insulation
The procedure for determining the technical lifetime of materials used in electrical engineering is generally defined by standard IEC 60216 [15]. Such a procedure requires suitable monitored parameters, usually called observables, which should correspond to aging, as well as methods with satisfactory sensitivity. A variety of measurement techniques for testing the oil-paper insulation of power transformers are available [16]. The traditional and routinely available techniques can be divided into three main groups [16]: (i) electrical techniques (measurement of the insulation resistance, dielectric dissipation factor, partial discharges, etc.), (ii) mechanical techniques (measurement of the tensile or folding strength), and (iii) chemical techniques (measurement of the molecular weight, analysis of the morphology and chemical composition of the paper and many others). Further overviews of traditional methods used for aging studies and lifetime estimations of transformer insulation have been published; see, e.g., comparative studies by Meshkatoddini [9], Taslak et al. [17], and Abdi et al. [18], or a recent review by Wang et al. [19]. Most of the techniques presented in the aforementioned studies, such as the measurement of the dissipation factor or the breakdown voltage of the oil, have been in use for many years. Nevertheless, electrical techniques do not always provide adequate effectivity, sensitivity, and reproducibility because moisture, which reversibly migrates between the paper and the oil with changes in the transformer operating temperature [20], has a dominant effect on most of the measured electrical properties [16]. Therefore, in addition to traditional methods, alternative methods, including UV-Vis spectroscopy, turbidity, near-infrared (NIR) spectroscopy, FT-IR spectroscopy [21,22,23,24,25], and differential scanning calorimetry (DSC) [26], have also been continuously explored as effective diagnostic tools to assess transformer oil quality. For these reasons, we utilized UV-Vis spectroscopy and FT-IR spectroscopy in this study.
3. Materials and Methods
3.1. Tested Oil and Thermo-Oxidative Aging
The tested oil was Nytro Lyra X oil manufactured by Nynas AB (Sweden). Nytro Lyra X is a high-grade naphthenic oil, inhibited using the use of DBPC with amounts less than 0.4 wt%, with a typical density of 0.870 kg·dm−3 (at 20 °C), a viscosity of 9.3 mm2·s−1 (at 40 °C) and 926 mm2·s−1 (at −30 °C), and a pour point at −48 °C [27]. The oxidation stability of the tested oil is declared to be 500 h at 120 °C.
The tested oil was aged in an accelerated manner in a Venticell laboratory oven (BMT Medical Technology, Brno, Czech Republic) with limited access to air. The oil was placed in 50 mL amber laboratory flasks with wide-mouth glass stoppers which remained closed during thermal aging. Based on our previous experience [25] and the IEC 60,216 standard [14], three testing temperatures (110, 120, and 130 °C) were chosen, and the exposure time varied from 24 to 2424 h for 110 °C, from 24 to 1656 h for 120 °C, and from 24 to 600 h for 130 °C.
Copper and Kraft paper in the form of a small piece of insulated transformer copper winding were used as a catalyst (see Figure 1) to simulate (as much as possible) a real environment in a transformer oil tank under laboratory conditions. The weight of the catalyst used was chosen to match the weight of the oil it was immersed in, i.e., the weight ratio between catalyst (copper and Kraft paper) and oil was chosen to be 1:1. The same ratio can be found, for example, in 110 kV distribution transformers.
Samples of oil, as well as copper and Kraft paper, were separately conditioned for 12 h at 110 °C. After this conditioning, copper and Kraft paper samples were placed as quickly as possible in the laboratory flasks, and the experiment started. All properties were then measured on oil samples in the delivered state (thermally untreated) and for each level of thermal aging on both the samples with and without the catalysts.
3.2. Method Description
The spectra of the tested oil in the UV-Vis range were recorded using a QE65 Pro Spectrometer in combination with a DH-2000-BAL UV-VIS-NIR light source and a 1 cm cuvette holder (Ocean Optics, Inc., Largo, FL, United States). Every oil sample was carefully placed in a 4.5 mL polymethyl methacrylate (PMMA) cuvette with an optical path of 10 mm (Kartell, Noviglio (MI), Italy) to avoid the formation of bubbles. UV-Vis spectra were acquired in the absorbance mode over the range from 350 to 600 nm. One sample taken from the flask was analyzed for each level of thermal aging during the UV-Vis measurement. Infrared spectra of the tested mineral oil were recorded by a Nicolet 380 spectrometer (Thermo Fisher Scientific, Waltham, MA, United States) in transmission mode at a resolution of 1 cm−1. All spectra were acquired by the coaddition of 32 scans in the frequency range 400–4000 cm−1 in a BaF2 cell with a thickness of 1 mm, and 3 mL of oil was used for each test. Three oil samples were analyzed for each level of thermal aging (i.e., measurement frequency, n = 3). All measurements were carried out under controlled laboratory conditions at a temperature of 22 °C and relative humidity of 50%.
4. Results
4.1. Changes in the UV-Vis Region of the Electromagnetic Spectrum
It is generally known that thermo-oxidative aging of oil causes a gradual change in its coloration and increases the concentration of the dissolved decay products, such as peroxides, aldehydes, ketones, and organic acids [28]. These changes can be effectively analyzed via UV-Vis spectroscopy [22,23,24,25,28,29]. Figure 2 shows an example of the absorbance UV-Vis spectra recorded between 350 and 550 nm for samples of mineral oil aged at 110 °C for various times; the spectra of mineral oil aged both with (henceforth labeled as “C+”) and without catalysts (henceforth labeled as “C−”) are shown.
The intensity of the recorded UV-Vis spectra increases with increasing the concentration of the dissolved decay products, as well as products that are insoluble in the oil, which contribute to sludge formation and affect the color of the oil. It is also evident from Figure 2 that UV-Vis spectroscopy does not provide very high resolution and sensitivity during the initial stages of the thermo-oxidative aging process because new oils are almost transparent, and therefore, no absorbance occurring in the visible region can be detected [24,30]. On the other hand, UV-Vis offers very precise results for higher aging levels, which are already accompanied by a change in the oil color. For a visual comparison of these changes, Figure 2 is also supplemented with a color scale in the form of a cut-out photograph of the real oil samples at a given stage of thermal aging at 110 °C. In particular, this color scale effectively demonstrates the crucial role of catalysts in the acceleration of mineral oil thermo-oxidative aging. The increasing concentration of dissolved decay products has an undeniable effect on the intensity of the change in oil color. However, it is also important to note that in cases where the color of the test oil is already very dark, it is necessary to dilute the test oil with new, nonaged oil. This fact may contribute to the overall error in measurement with UV-Vis spectroscopy. This necessity arose in the case of an aging temperature of 110 °C for C+ samples that were aged for at least 1848 h, which is also indicated in Figure 2.
Changes in the measured UV-Vis spectra can be further quantified in two ways: (i) integrating the area under the absorbance curve of the oil and, in this way, determining the so-called “relative content of dissolved decay” [28], or (ii) analyzing the change in the intensity of one of the local maxima of the UV-Vis spectrum. In our study, the latter method provided better data suitable for further processing. More precisely, the evaluation of the spectral maximum at a wavelength of 453.13 nm (henceforth referred to as “UV-Vis_λmax”) was proven to be advantageous as an observable parameter because it responded to the applied aging by a marked increase, as evident from Figure 3, and its change could be mathematically fitted very well, as explained below.
Experimentally observed trends in UV-Vis_λmax values were fitted to derive the endpoint criteria and to assess the remaining useful life of the tested mineral transformer oil. The goodness of fit between the observed data points and the values predicted by the mathematical model was assessed based on a calculation of the coefficient of determination (R2). A higher value of this coefficient represents a more accurate mathematical model [31]. In this respect, the mathematical fit using a cubic equation proved to be the most appropriate. As shown in Figure 3a,b, the calculated R2 values range from 0.986 to 0.996, which is sufficient for the subsequent derivation of the endpoint criterion for the UV-Vis_λmax parameter, as well as for quantifying the remaining lifetime of the tested mineral oil.
Considering that the endpoint criterion for UV-Vis_λmax is not standardized and has not been reported to date, it was necessary to derive it using one of the standardized measurement techniques. For this purpose, values measured for the same oil without the presence of any catalysts but under the same experimental conditions using the standardized dielectric dissipation factor (tan δ) measurements (published previously [26]) were used. In this earlier study, the measurement of tan δ was performed according to EN 60247 [32] and was repeated three times for each aging time and temperature. The tan δ measurement represents a traditional and proven technique, and is recognized by the professional community as a standard in the diagnostics of transformer insulation systems. Using this method and the results presented earlier [26], it is possible to validate not only the UV-Vis spectroscopy, but also the other methods that provide appropriate trends in the variables, and in this manner, easily determine when the oil reaches the true end of its technical life. However, this technique also has some disadvantages; for instance, the measurement is time-intensive, the results can be affected by the humidity, and the measuring procedure requires a fairly large volume of oil (at least 120 mL for one test).
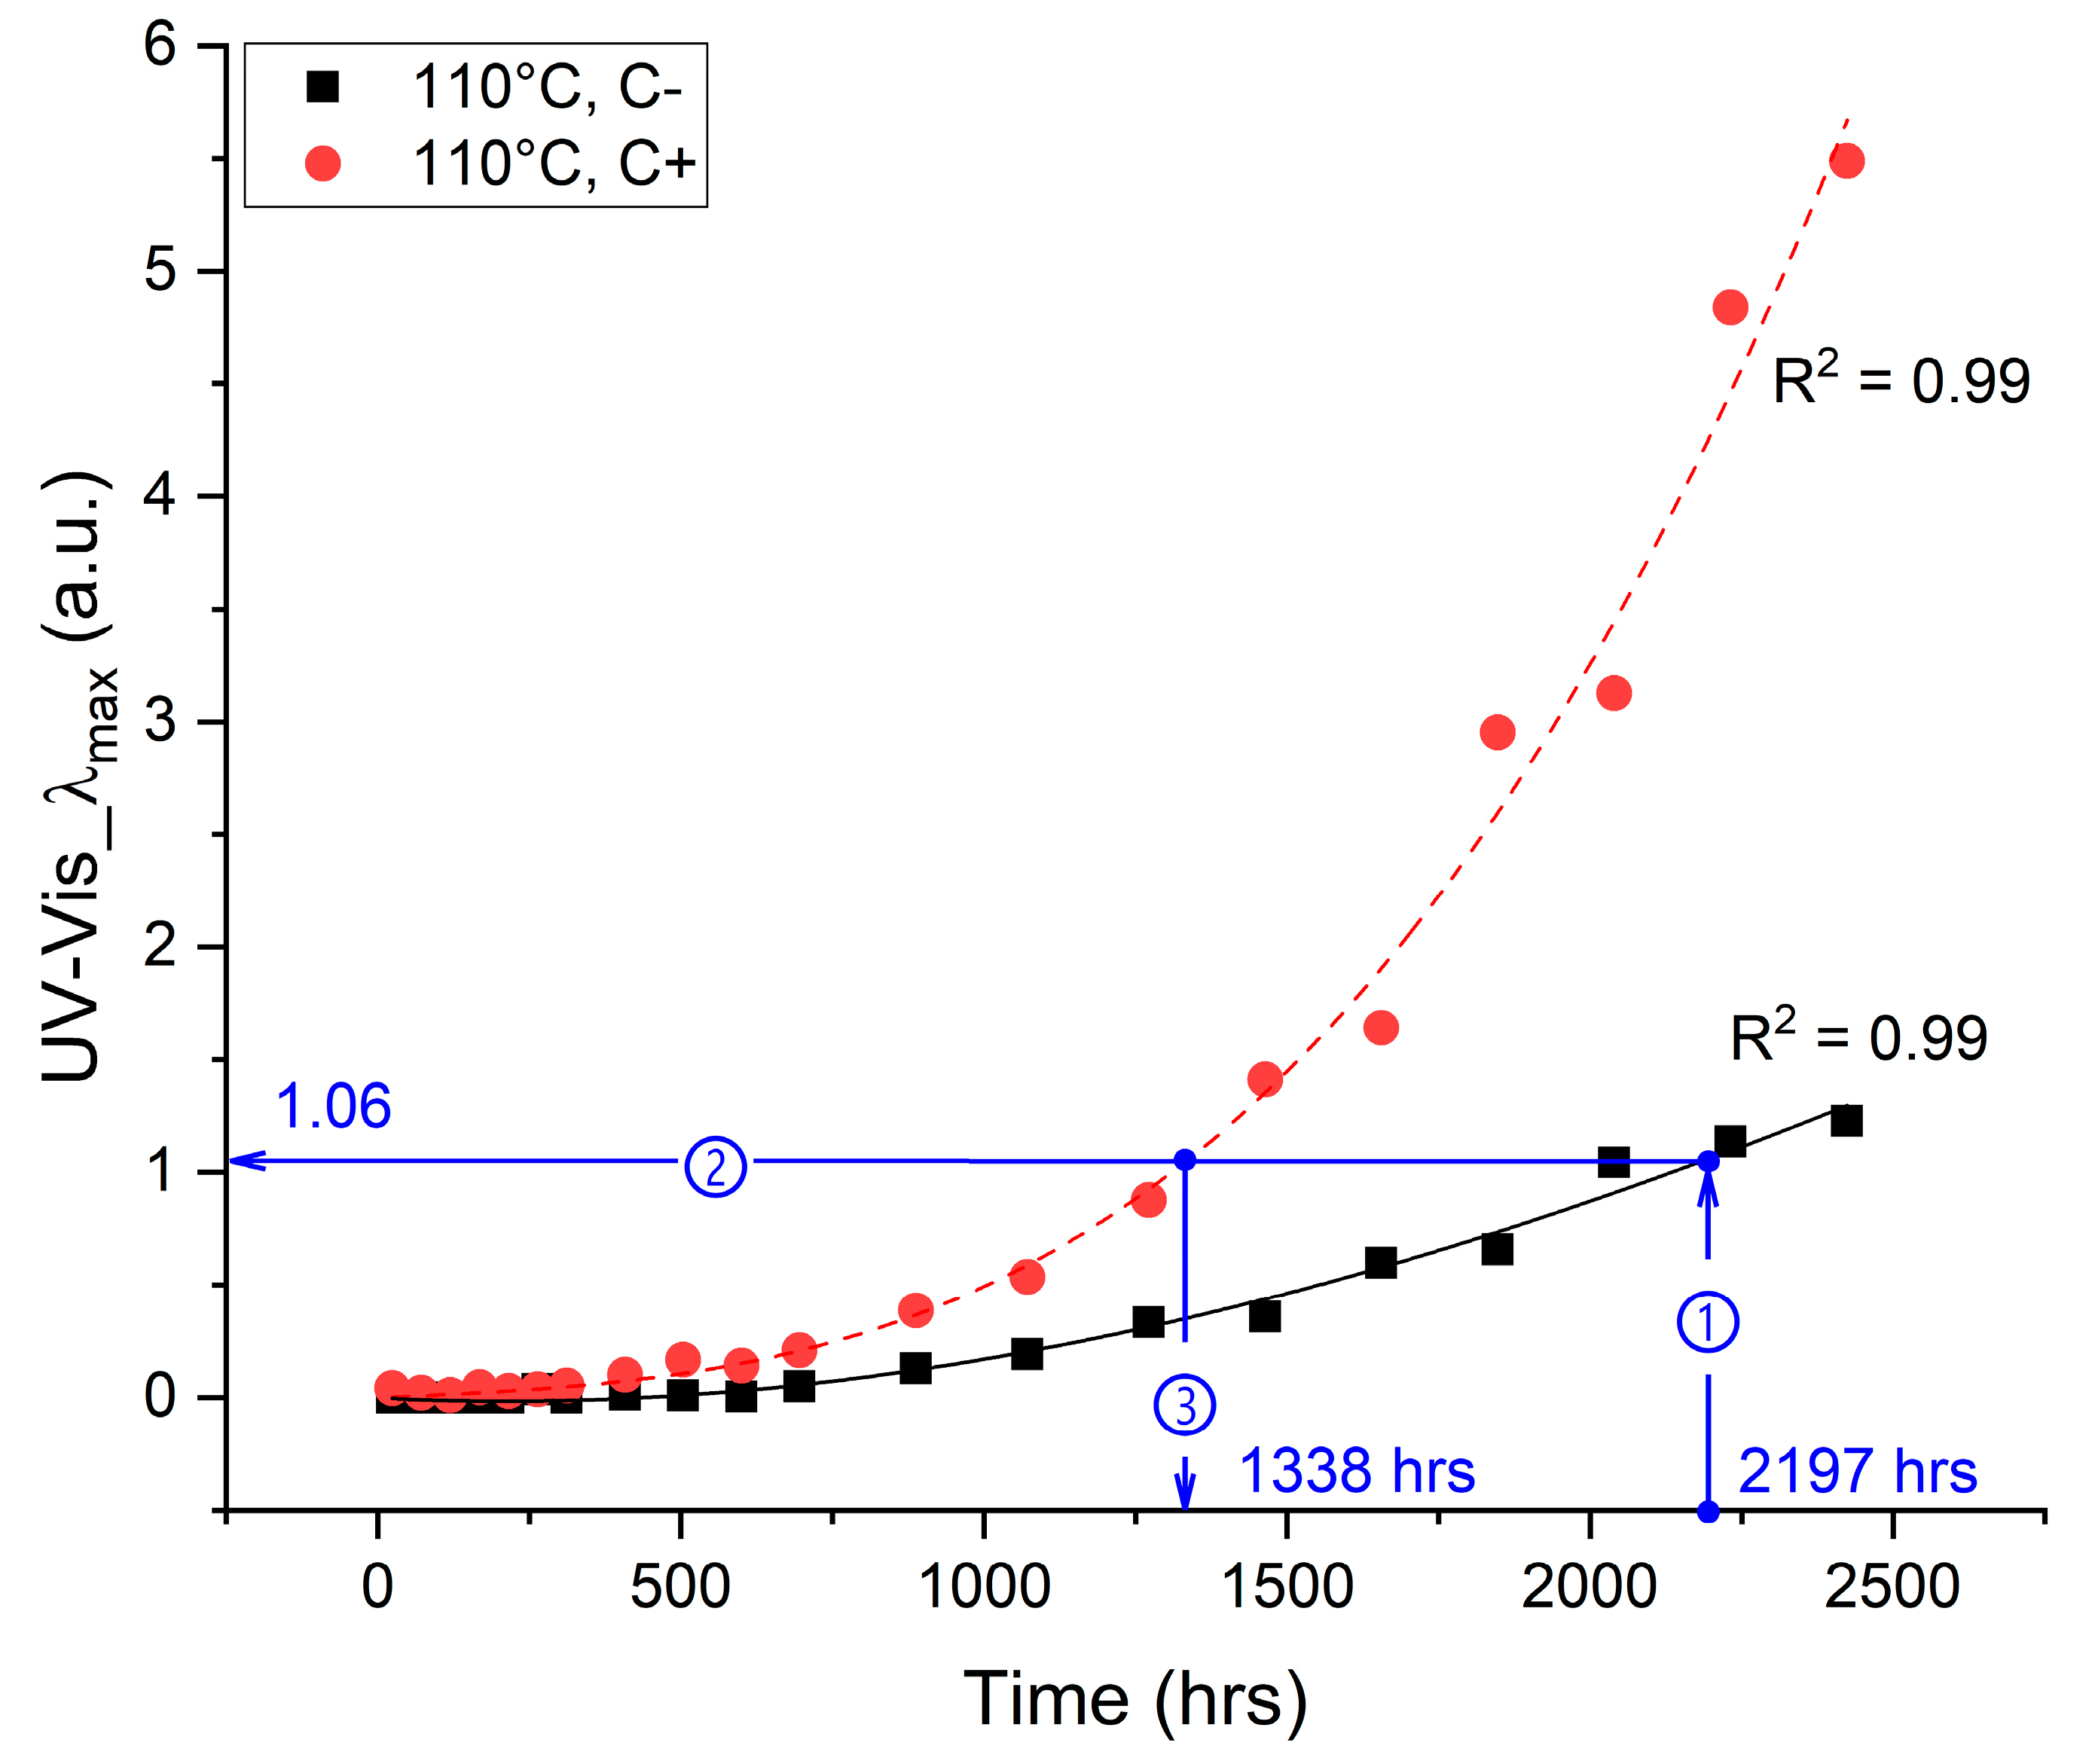
The study [26] provided three times to reach the endpoint criterion of tan δ (tan δ = 0.04) corresponding to the three temperatures of thermo-oxidative aging used: 2197 h at 110 °C, 1177 h at 120 °C, and 556 h at 130 °C. Hence, it was possible to derive the endpoint criterion for UV-Vis_λmax indirectly using these times according to the process outlined in Figure 4, which demonstrates this procedure for a temperature of 110 °C. The actual values of the endpoint criterion for UV-Vis_λmax and times to achieve these criteria for C+ samples were then calculated by solving the cubic equations using Cardano formulas. This procedure led to three slightly different endpoint criteria corresponding to three different temperatures of thermo-oxidative aging, as shown in Table 1. This table also summarizes the fitting parameters of the cubic equations and the times used to achieve each endpoint criterion. From these times, it was possible to quantify how much catalysts reduced the lifetime of the test oil from the perspective of UV-Vis spectroscopy. This parameter is referred to as “Reduction in lifetime” in Table 1, and means the percentage reduction in lifetime for oil-containing catalysts (C+) compared to oil without catalysts (C−). As observed from Table 1, depending on the aging temperature used, the reduction in oil lifetime by catalysts ranged from 35 to 45%. The temperature dependence of these values may indicate a nonlinear process of sludge formation in the oil. Nevertheless, the overall high values of oil lifetime reduction, as quantified by UV-Vis spectroscopy, point to the dominant catalytic role of the copper and Kraft paper in the aging process of the transformer insulation system, and in this respect, confirm the recent conclusions of Hao et al. [14]. The obtained results also demonstrate the advantage of using UV-Vis spectroscopy for the quantification of oil discoloration, i.e., for instance, for the accurate and fast quantification of the color scale shown in Figure 2.
4.2. Changes in the IR Region of the Electromagnetic Spectrum
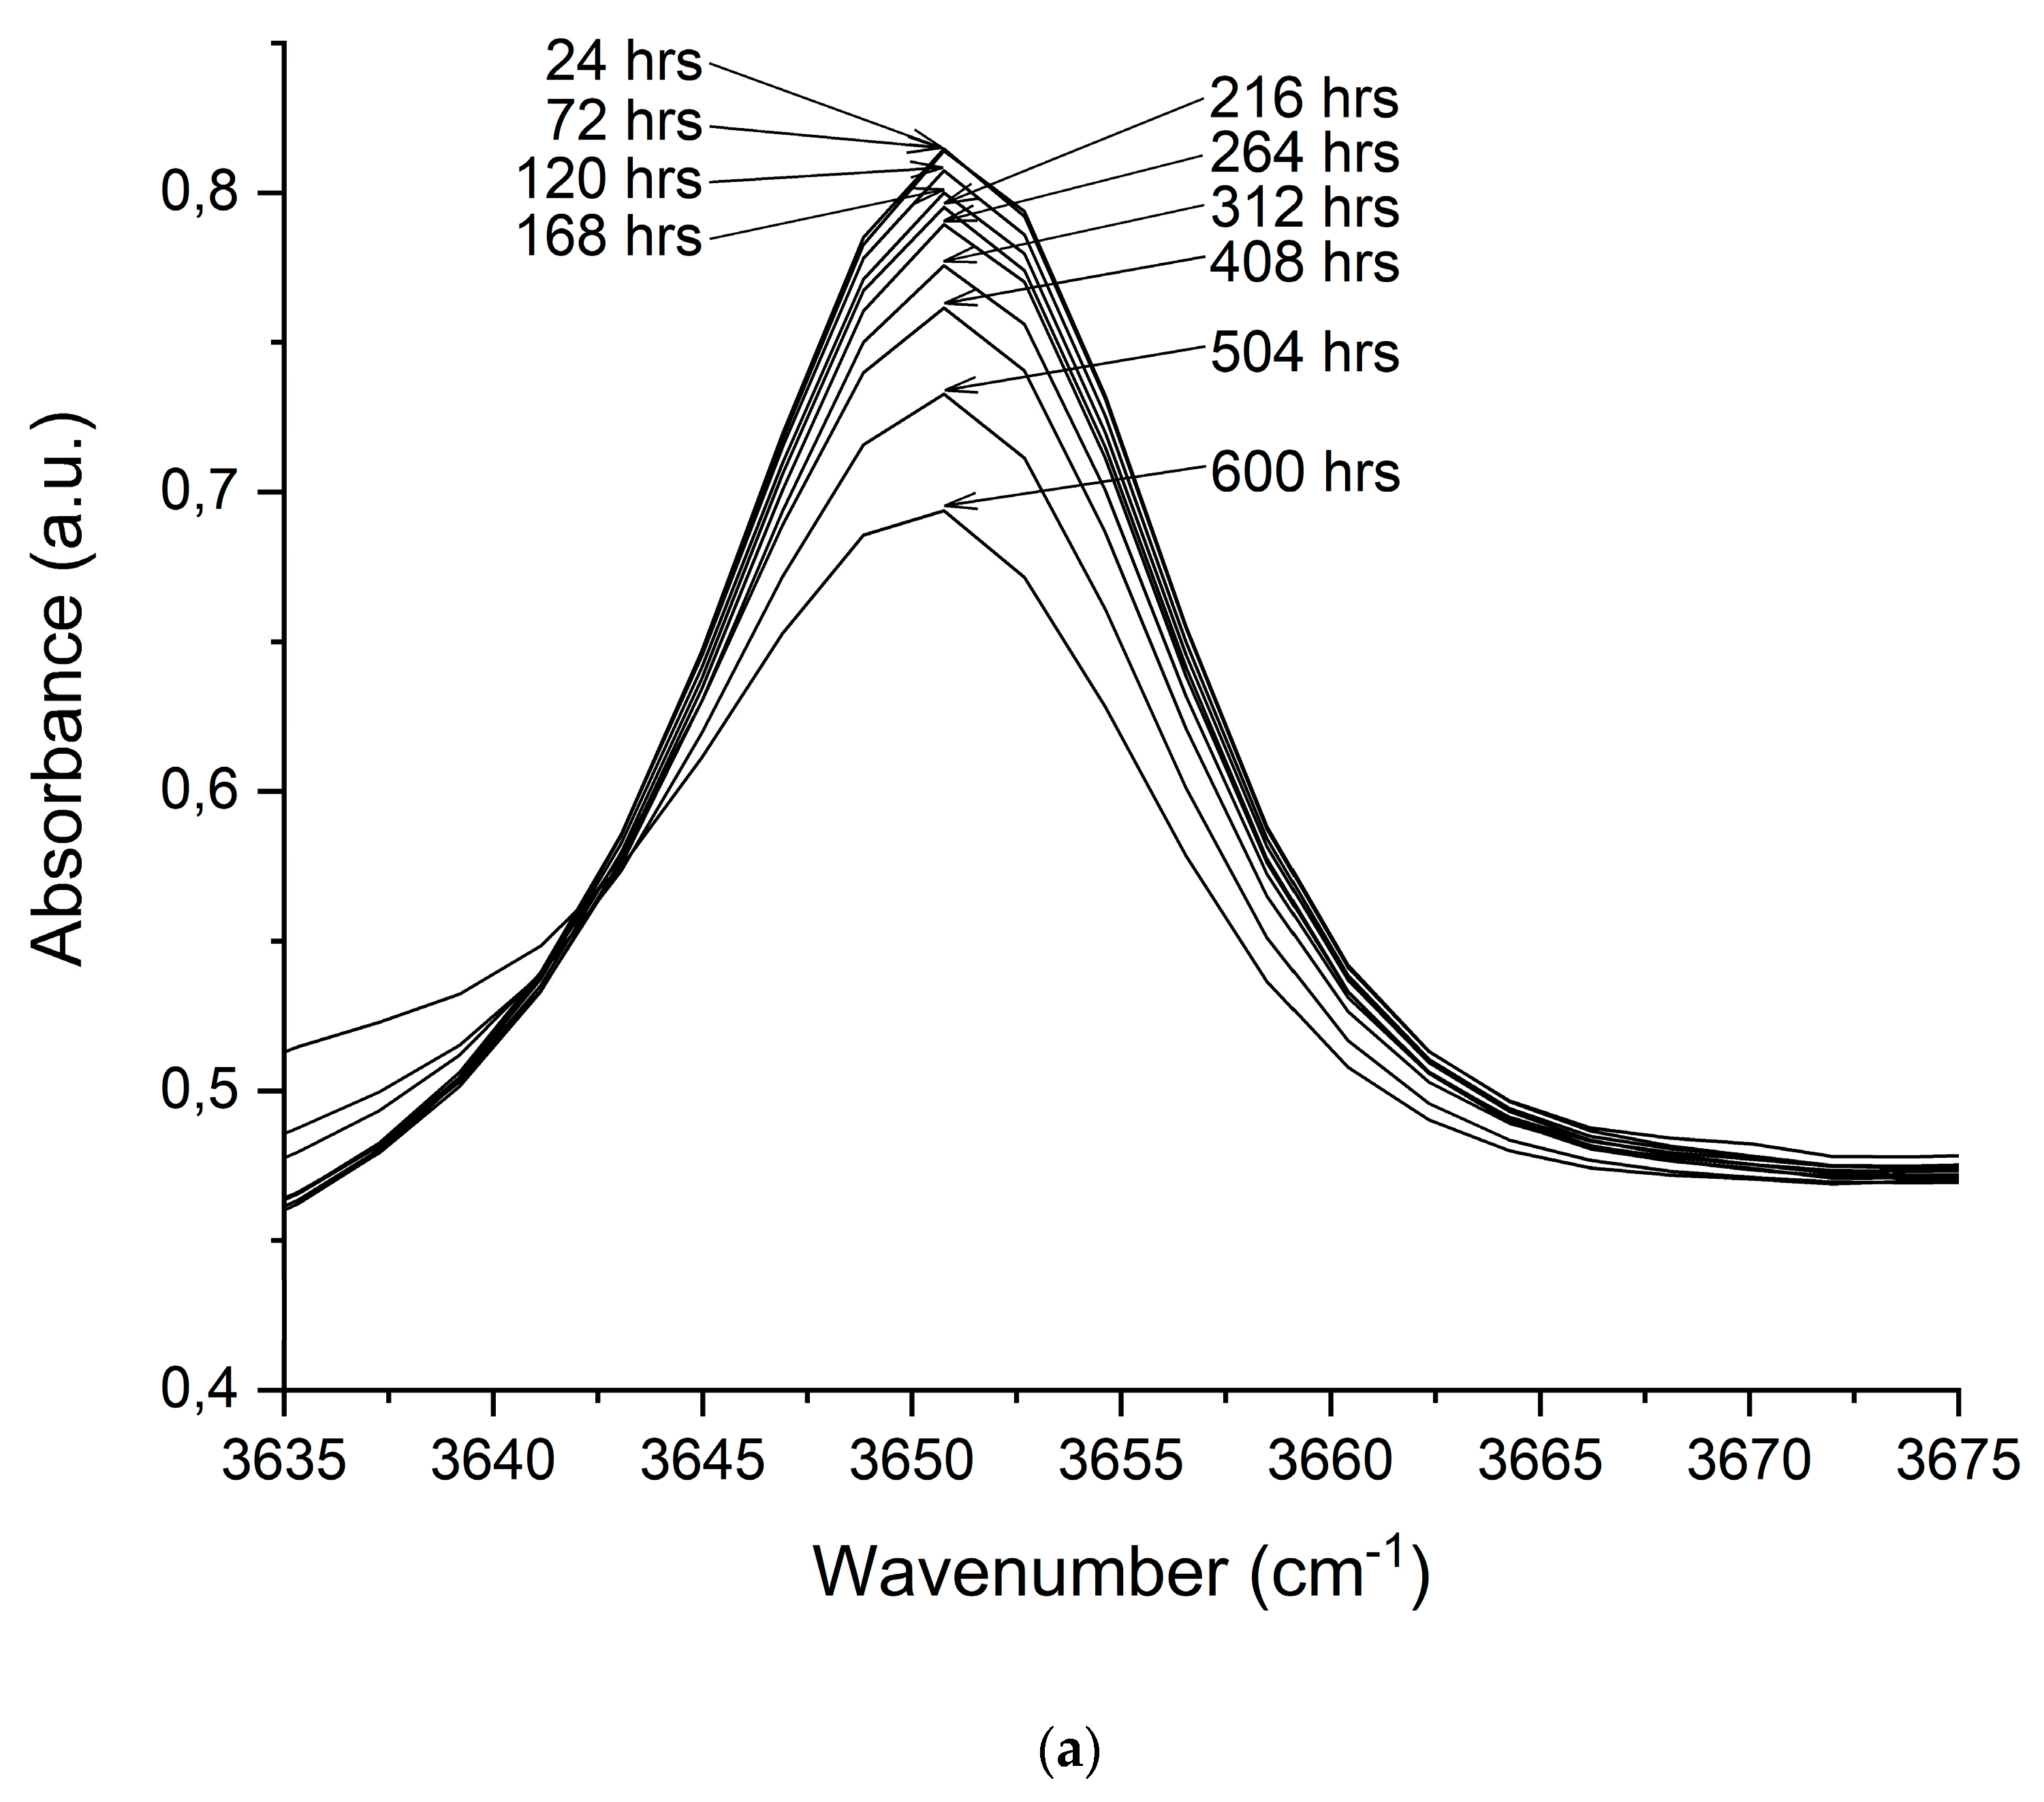
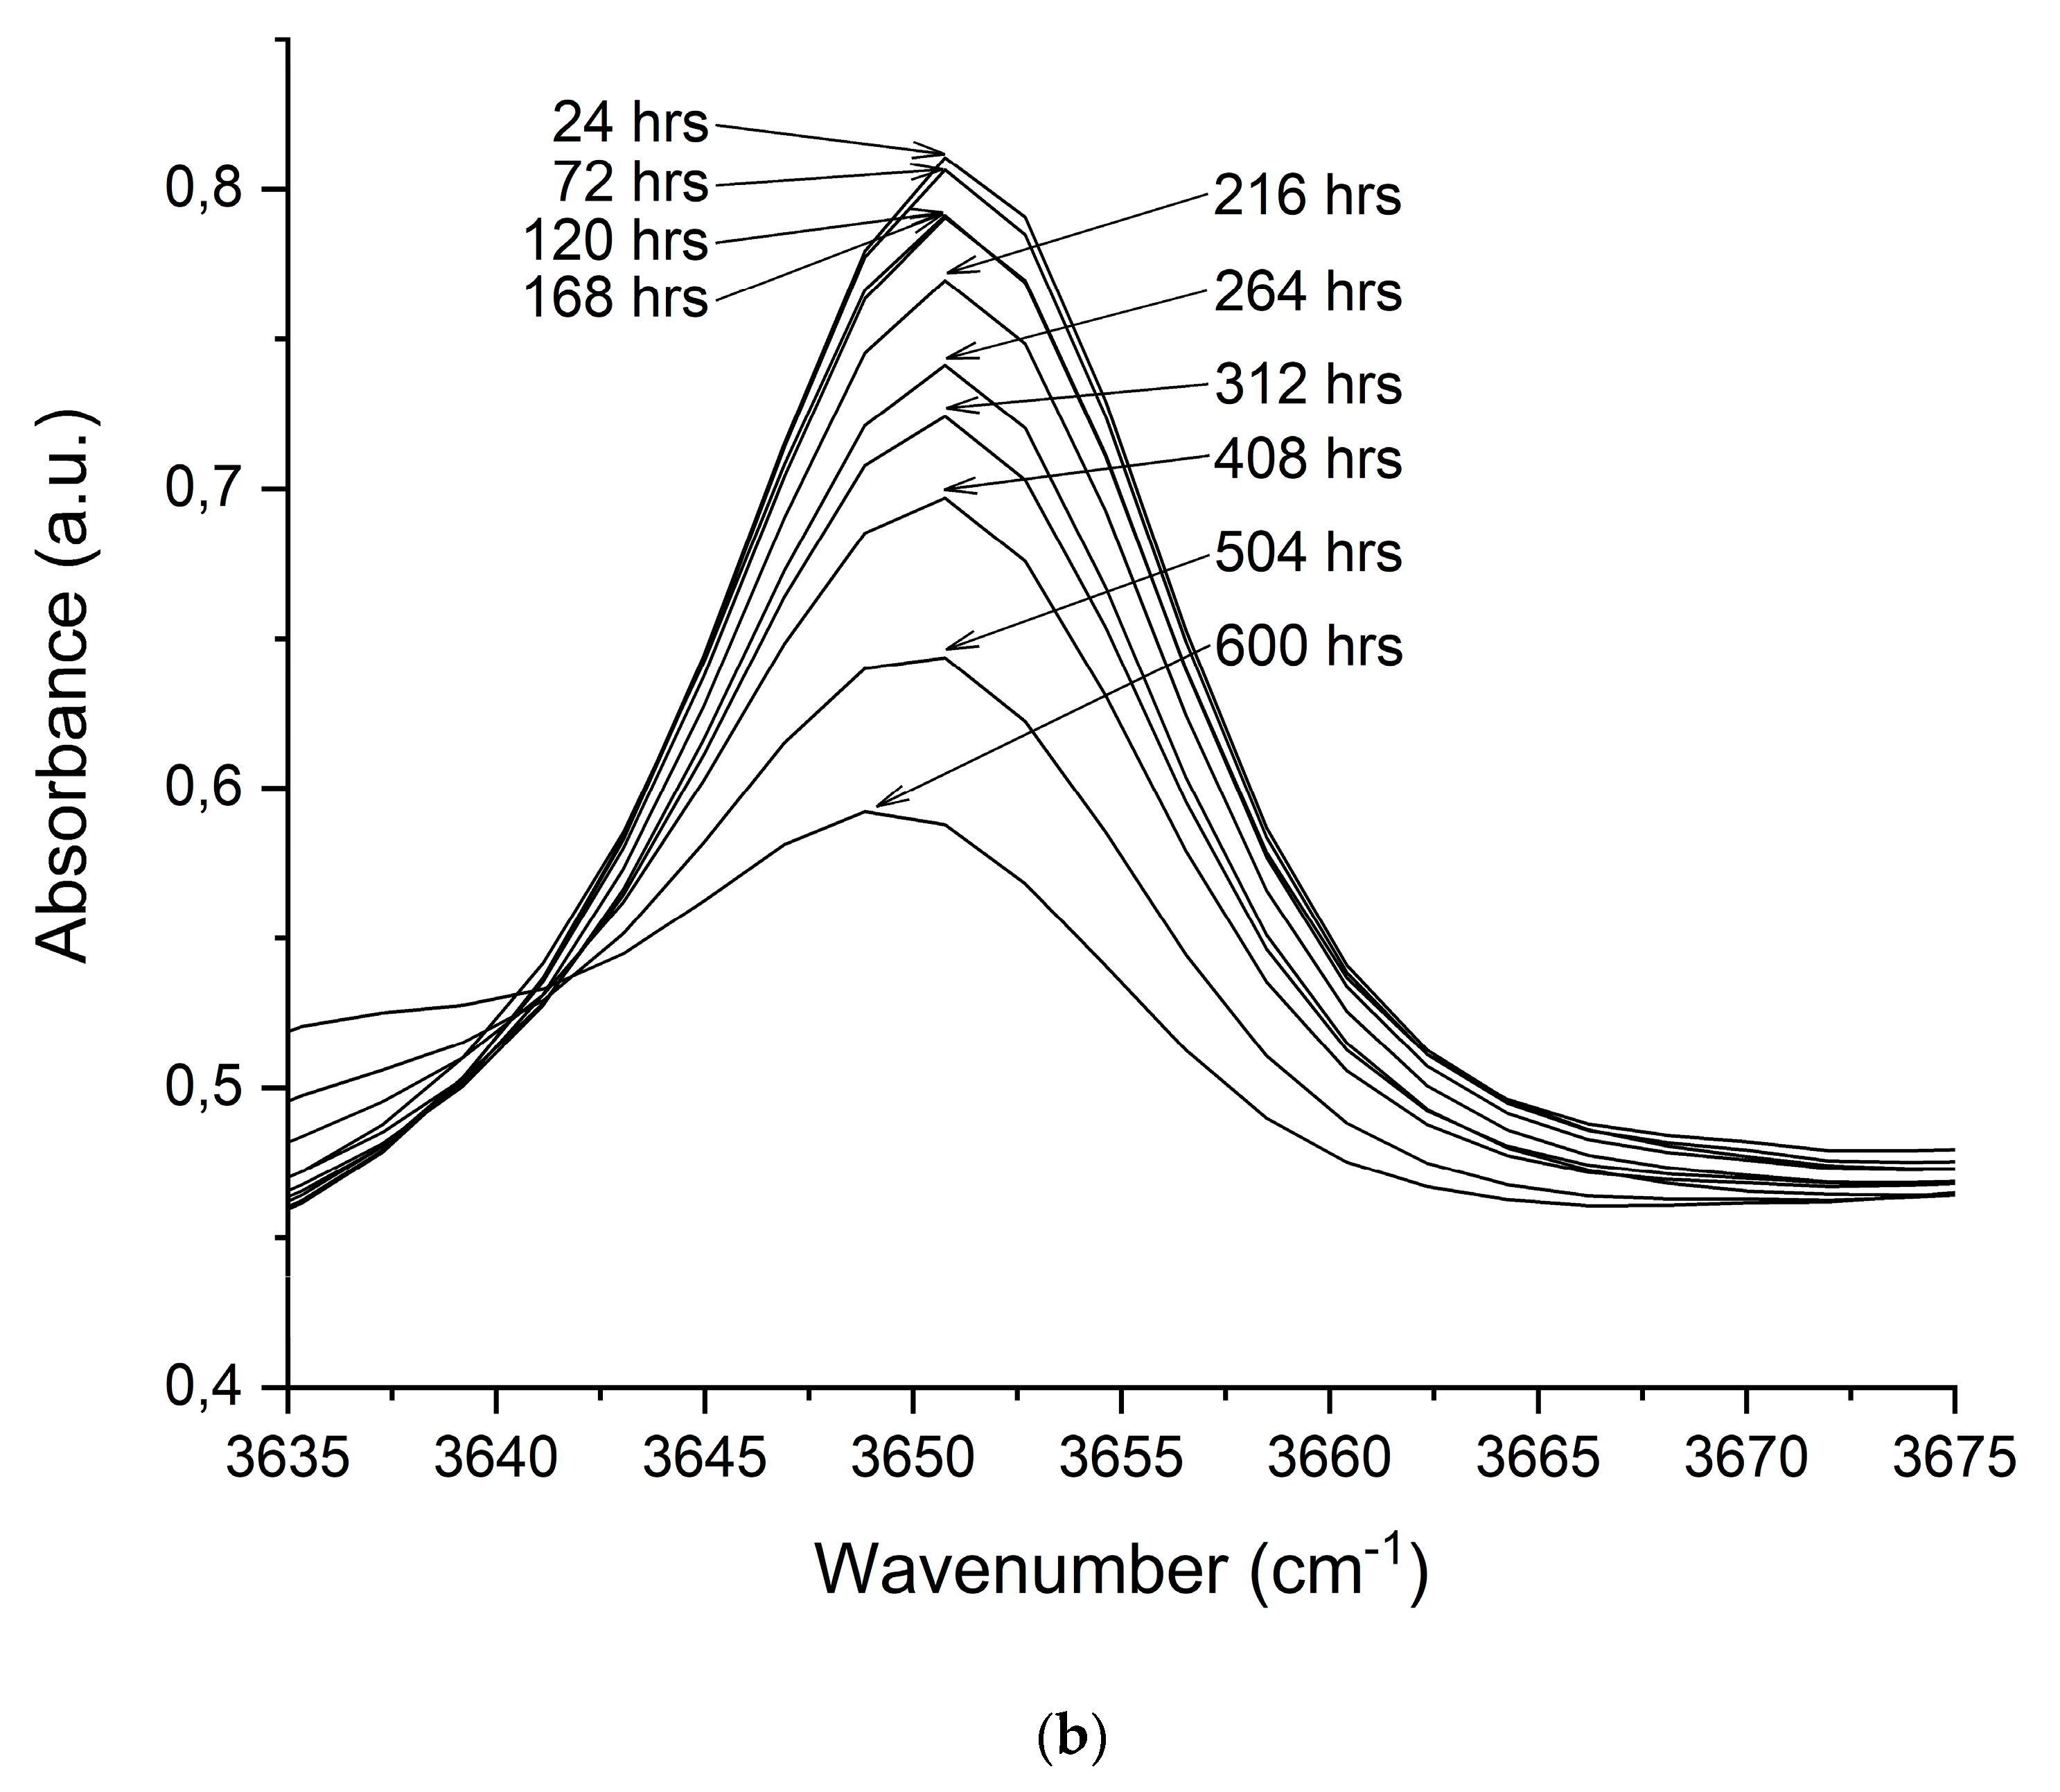
When evaluating the aging process of inhibited mineral oils, one of the best-established and most frequently used methods is the analysis of changes in the IR spectral range from 3600 to 3700 cm−1 [26]. In this region of the spectrum, a strong absorption band related to a low-temperature antioxidant with a maximum absorbance at 3650 cm−1 can be found. This sharp peak occurs due to the stretch vibration of a nonhydrogen-bonded O–H [33]. It is generally known that the gradual depletion of the total amount of antioxidant during the aging of the mineral oil results in a gradual decrease in the intensity of the spectral band at 3650 cm−1 [34,35,36]. This finding was the main reason why attention was focused only on this region of IR spectra in this study. As an example of the observed changes in the intensity of the spectral band 3650 cm−1, the recorded FT-IR spectra for oil aged at 130 °C in the presence and absence of catalysts are shown in Figure 5. It can be seen that FT-IR has satisfactory sensitivity, even for a lower degree of aging of the oil, because it is analyzing a gradual decrease in the concentration of the antioxidant present and not the color of the oil, which changes mainly during the later stages of aging.
In contrast, the change in the absolute values of absorbance at 3650 cm−1 during aging is not very high and may affect the measurement accuracy, e.g., absorbance decreased only from 0.815 to 0.694 for C− and from 0.811 to 0.592 for C+ during aging at 130 °C in times ranging from 24 to 600 h (see Figure 5). Therefore, in these cases, FT-IR measurements should be repeated several times for each level of aging, and only the calculated average of the recorded values should be further evaluated. Another approach is to use multivariate statistical methods for processing the measured spectra, such as principal component analysis (PCA) [37]. Such methods make it possible to quantify even very small changes in the measured spectra. Nevertheless, three oil samples were analyzed for each level of thermal aging in this study; this procedure proved to be sufficient and exhibited the desired trends in absorbance at 3650 cm−1, as shown in Figure 6.
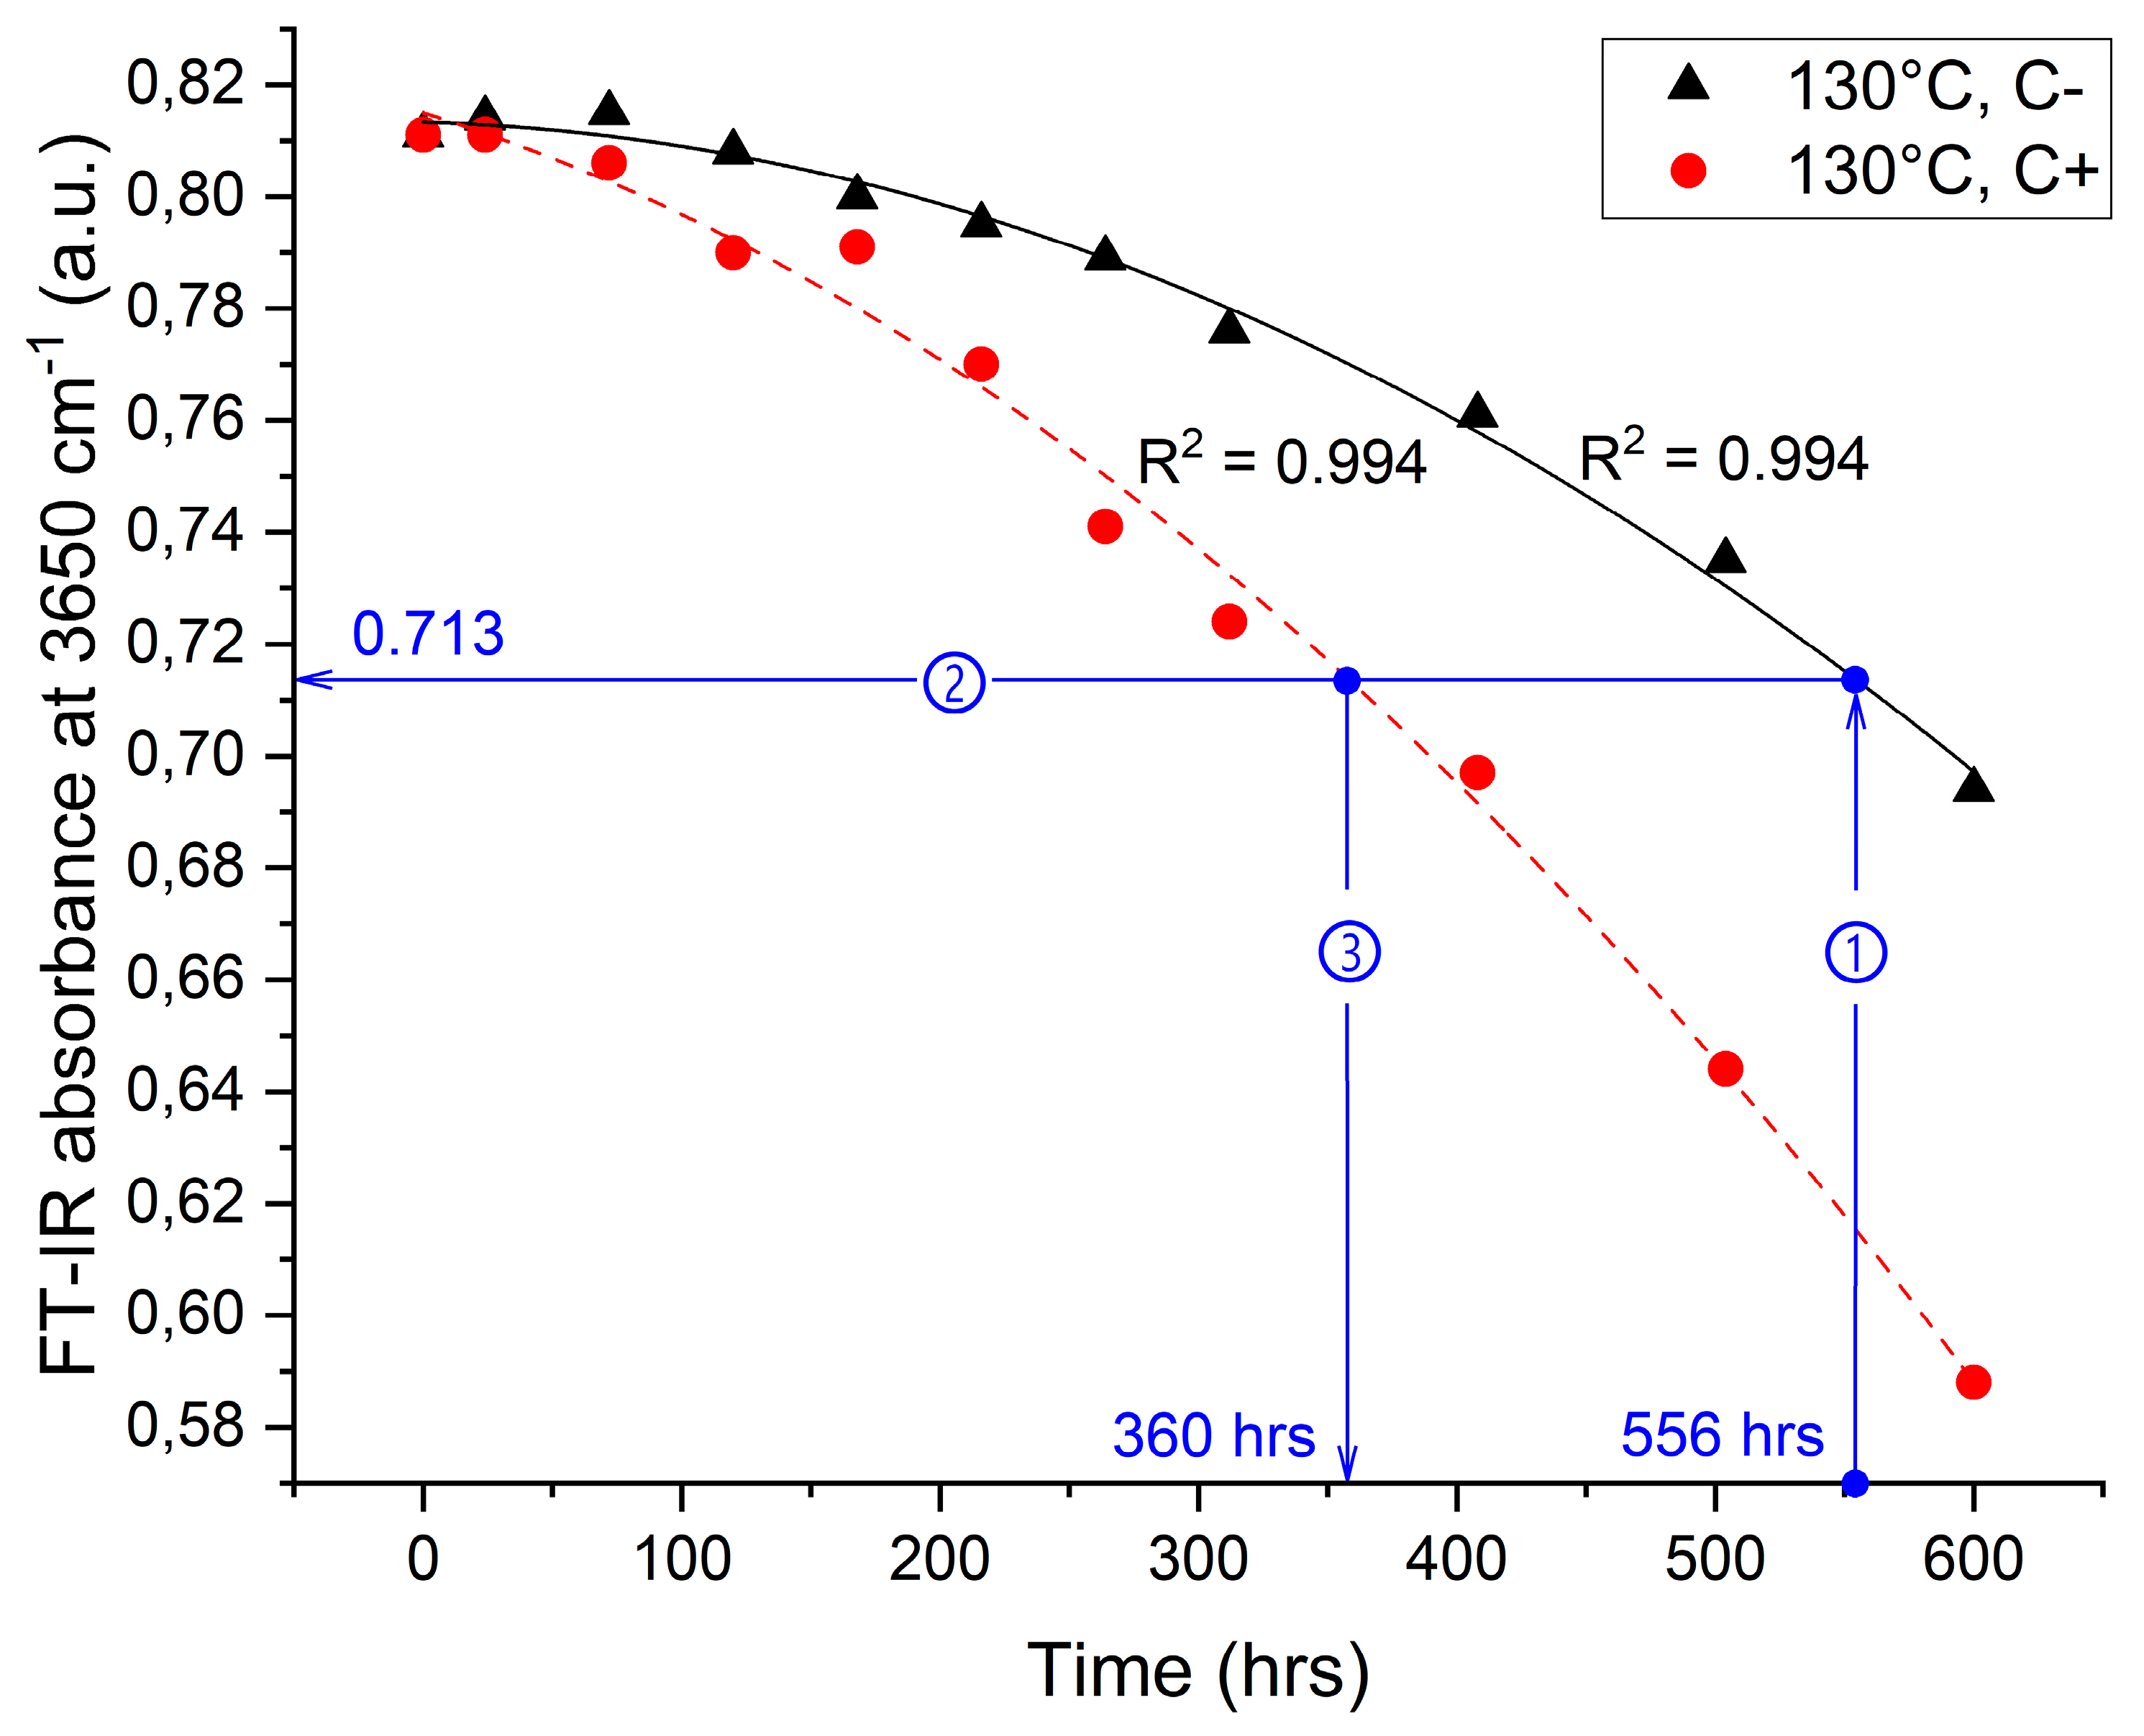
As previously described, in the case of UV-Vis spectroscopy, experimentally observed trends were mathematically fitted, but in this case, it was more advantageous to use a simple quadratic function for this purpose. As shown in Figure 6a,b, the resulting R2 values range from 0.989 to 0.994, which is sufficient for the indirect derivation of the endpoint criterion (see detailed discussion related to testing the significance of R2 using values of the two-tailed test criterion, e.g., in [38]), as well as for quantifying the remaining lifetime of the tested oil using FT-IR. The same times were used to achieve the tan δ criterion as those previously used in the case of UV-Vis spectroscopy. This procedure is outlined in Figure 7, and a summary of the fitting and calculated parameters for FT-IR is provided in Table 2. As can be observed from Table 2, the degree of reduction in the oil lifetime quantified by FT-IR is in the range 35 ± 0.5% for each aging temperature used. From these results, it can be concluded with a high degree of certainty that the rate of reduction in the low-temperature antioxidant concentration is temperature independent within the studied temperature range.
5. Discussion
The causes of changes in the monitored parameters described in the previous chapter are various chemical reactions accompanying the process of thermal-oxidative aging of mineral oils in power transformers. This process is primarily accelerated by the presence of an oxidant (dissolved oxygen) and is highly heterogeneous. In particular, mineral oils are mixtures of linear saturated hydrocarbons (paraffins), cyclic saturated hydrocarbons (naphthenes), aromatic hydrocarbons, and small amounts of nonhydrocarbons (sulfur, nitrogen, and oxygen combined with carbon and hydrogen) [39,40], whereas the selected oil may contain thousands of different types of paraffinic, naphthenic, and aromatic hydrocarbon molecules [40]. According to the amount ratios of basic types of hydrocarbons, and subsequently, according to the presence of specific chemical substances, the reactions that occur during thermo-oxidation of oil differ [39]. Chemical reactions may also vary significantly depending on the type of mineral oil (e.g., based on the production process and intended for the defined application) and on the environment of actual usage. Many factors influence the continuity and interlacing of ongoing chemical reactions. Elevated temperature, high voltage [39], and the presence of impurities, including dissolved gases (not only oxygen), water, polar and ionic contaminants (traces of sulphate, sulphonates, furfural, etc.), and particulate solid contaminants (metals, metal oxides, fibers of cellulose, etc.) [40] contribute to thermo-oxidation in oil-filled transformers.
The basic description of the thermo-oxidation mechanism as a standard radical mechanism generally applied to hydrocarbon compounds (other types of oils, polymers, etc.) that is described in [8,41,42,43] is sufficient. Radical reactions occur gradually in the phases of initiation, propagation, chain branching, and termination of the standard thermo-oxidation mechanism. Several different types of radicals and other intermediate products are formed during this process. Alkyl and peroxy radicals are formed in the first stages. After that, hydroperoxides are formed and decomposed into alkoxy and hydroxy radicals during consequential radical reactions. The thermo-oxidative aging products of mineral oils are aldehydes, ketones, alcohols, water, carboxylic acids, peroxides, etc. [39,40]. The increasing concentrations primarily of aldehydes and ketones cause condensation reactions, which lead to the formation of low-molecular-weight oligomers and polymers. The result of the presence of these compounds is an increase in the oil viscosity [43], as well as a gradual change in the oil color from bright yellow to amber [10]. Describing the real thermo-oxidation of oil in a power transformer also requires consideration of the presence of Kraft paper (winding insulation), whose main component is cellulose. The main products of cellulose degradation in oil are furfural formed from formaldehyde, carbon oxides, and acetone; these degradation products may significantly influence the thermo-oxidation of the oil [44]. As mentioned, phenol-based antioxidants, often referred to as radical scavengers, are used to attenuate the thermo-oxidation of mineral oils. Phenols directly enter the radical reactions of the thermo-oxidation mechanism of the oil, and the reaction of free radicals with radical scavengers leads to the formation of stable chemical compounds up to a certain temperature [42]. The result of radical scavenger activity is a reduction in thermo-oxidation speed until the added amount of the radical scavenger in the oil is consumed.
As is evident from the achieved results, all the chemical processes discussed above significantly influenced the observable parameters measured by UV-Vis spectroscopy and Fourier transform infrared spectroscopy within a long-term experiment. Despite their different principles, both applied methods were able to detect and quantify the effect of catalysts on the lifetime of the tested mineral oil. Moreover, the two methods achieved comparable results. In more detail, while the UV-Vis technique produced a 35–45% reduction in the oil lifetime due to the catalysts, and this reduction was determined to be dependent on the aging temperature, the FT-IR method revealed a reduction of 35%, which was independent of the aging temperature.
In this respect, it is necessary to consider a different view of these methods on the aging process of the test oil. The UV-Vis technique assessing the change in color of the oil and its results are directly linked to the formation of sludge, which is predominant only during the later stages of the aging process; hence, the main disadvantage of this technique is its low sensitivity during the early stages of oil aging. In contrast, in the FT-IR analysis, attention was focused on the decrease in the spectral band corresponding to the low-temperature antioxidant present, and this technique showed a higher sensitivity during the early stages of oil aging compared to the UV-Vis technique. However, the disadvantage of FT-IR is the relatively small absolute change in the absorbance values at 3650 cm−1 during aging, which may reduce the sensitivity of the measurement.
Despite these disadvantages, the use of UV-Vis and FT-IR spectroscopies in the diagnosis of transformer oil is very promising, as it provides many advantages over traditional methods (e.g., over the aforementioned dielectric dissipation factor measurement), for instance, (i) considerably less oil is needed for analysis; (ii) the moisture content in the oil, which significantly affects measurement using traditional (electrical) methods, does not affect the measured parameters; (iii) the measurement is very fast compared to traditionally used methods (one test via UV-Vis or FT-IR took approximately 5 to 15 min in comparison with the 4 h needed for the dissipation factor measurement); and (iv) the sample preparation is very easy.
Author Contributions
Conceptualization, R.P. and P.H.; methodology, R.P.; validation, R.P., P.H., P.P., D.M. and P.K.; formal analysis, R.P., P.H. and P.P.; investigation, P.H., D.M., P.K. and P.P.; resources, R.P. and P.H.; data curation, R.P., P.H. and P.K.; writing—original draft preparation, R.P.; writing—review and editing, P.K.; visualization, R.P.; supervision, R.P.; project administration, R.P.; funding acquisition, R.P. All authors have read and agreed to the published version of the manuscript.
Funding
This research was funded by (i) the Ministry of Education, Youth and Sports of the Czech Republic under the project OP VVV Electrical Engineering Technologies with High-Level of Embedded Intelligence CZ.02.1.01/0.0/0.0/18_069/0009855; (ii) the Technology Agency of the Czech Republic, Project No. TE01020455; and (iii) the Student Grant Agency of the University of West Bohemia, grant No. SGS-2018-016 “Diagnostics and Materials in Electrical Engineering”.
Conflicts of Interest
The authors declare that they have no conflicts of interest to report.
References
- The Electric Power Research Institute. Considerations for a Power Transformer Emergency Spare Strategy for the Electric Utility Industry; EPRI: Palo Alto, CA, USA, 2014. [Google Scholar]
- Dumitran, L.M.; Setnescu, R.; Notingher, P.V.; Badicu, L.V.; Setnescu, T. Method for lifetime estimation of power transformer mineral oil. Fuel 2014, 117, 756–762. [Google Scholar] [CrossRef]
- Saha, T.K. Review of Modern Diagnostic Techniques for Assessing Insulation Condition in Aged Transformers. IEEE Trans. Dielectr. Electr. Insul. 2003, 10, 903–917. [Google Scholar] [CrossRef] [Green Version]
- Khayam, U.; Tsuchie, M.; Thein, M.; Hikita, M.; Saito, T. Study on Dissolved Gas Due Tue Thermally Degraded Insulating Paper in Transformer Oil. Procedia Technol. 2013, 11, 257–262. [Google Scholar]
- Kaplan, I.R.; Rasco, J.; Lu, S.-T. Chemical Characterization of Transformer Mineral-Insulating Oils. Environ. Forensics 2010, 11, 117–145. [Google Scholar] [CrossRef]
- Shiri, A.; Gholami, A.; Shoulaie, A. Investigation of the ambient temperature effects on transformer’s insulation life. Electr. Eng. 2011, 93, 193–197. [Google Scholar] [CrossRef]
- Yehye, W.A.; Rahman, N.A.; Ariffin, A.; Abd Hamid, S.B.; Alhadi, A.A.; Kadir, F.A.; Yaeghoobi, M. Understanding the chemistry behind the antioxidant activities of butylated hydroxytoluene (BHT): A review. Eur. J. Med. Chem. 2015, 101, 295–312. [Google Scholar] [CrossRef]
- Sanghi, R. Chemistry behind the life of a transformer. Resonance 2003, 8, 17–23. [Google Scholar] [CrossRef]
- Meshkatoddini, M.R. Aging Study and Lifetime Estimation of Transformer Mineral Oil. Am. J. Eng. Appl. Sci. 2008, 1, 384–388. [Google Scholar] [CrossRef] [Green Version]
- Loiselle, L.; Fofana, I.; Hume, D. Influence of Transformer Oil Decay Products on its Thermal Conductivity. In Proceedings of the 31st International Thermal Conductivity Conference (ITCC) and the 19th International Thermal Expansion Symposium (ITES), Chicoutimi, QC, Canada, 26–30 June 2011; pp. 1–10. [Google Scholar]
- Kalantar, A.; Levin, M. Factors affecting the dissolution of copper in transformer oils. Lubr. Sci. 2008, 20, 223–240. [Google Scholar] [CrossRef]
- Amimoto, T.; Nagao, E.; Tanimura, J.; Toyama, S.; Fujita, Y.; Kawarai, H.; Yamada, N. Identification of affecting factors of copper sulfide deposition on insulating paper in oil. IEEE Trans. Dielectr. Electr. Insul. 2009, 16, 265–272. [Google Scholar] [CrossRef]
- The International Council on Large Electric Systems. Technical brochure CIGRE WG A2-32. In Copper Sulphide in Transformer Insulation; CIGRE: Paris, France, 2009. [Google Scholar]
- Hao, J.; Liao, R.; Yang, L.; Gao, S.; Liao, Q.; Gao, J. Copper Catalytic Effect on the Thermal Deterioration and Surface Morphology Performance of Transformer Oil—Paper Insulation. IEEJ Trans. Electr. Electron. Eng. 2018, 13, 373–381. [Google Scholar] [CrossRef]
- International Electrotechnical Commission. IEC 60216 Guide for the Determination of Thermal Endurance Properties of Electrical Insulating Materials; Parts 1–7; IEC: Geneva, Switzerland, 2002. [Google Scholar]
- Darveniza, M.; Saha, T.K.; Hill, D.J.T.; Le, T.T. Investigations into effective methods for assessing the condition of insulation in aged power transformers. IEEE Trans. Power Deliv. 1998, 13, 1214–1223. [Google Scholar] [CrossRef]
- Taslak, E.; Arikan, O.; Fadil, C.; Kalenderli, O. Analyses of the insulating characteristics of mineral oil at operating conditions. Electr. Eng. 2018, 100, 321–331. [Google Scholar] [CrossRef]
- Abdi, S.; Boubakeur, A.; Haddad, A.; Harid, N. Influence of Artificial Thermal Aging on Transformer Oil Properties. Electr. Power Compon. Syst. 2011, 39, 1701–1711. [Google Scholar] [CrossRef]
- Wang, X.; Tang, C.; Huang, B.; Hao, J.; Chen, G. Review of Research Progress on the Electrical Properties and Modification of Mineral Insulating Oils Used in Power Transformers. Energies 2018, 11, 487. [Google Scholar] [CrossRef] [Green Version]
- Sikorski, W.; Walczak, K.; Przybylek, P. Moisture Migration in an Oil-Paper Insulation System in Relation to Online Partial Discharge Monitoring of Power Transformers. Energies 2016, 9, 1082. [Google Scholar] [CrossRef] [Green Version]
- Leong, S.Y.; Ker, P.J.; Jamaludin, M.Z.; Nomanbhay, S.M.; Ismail, A.; Abdullah, F.; Looe, H.M.; Lo, C.K. UV-Vis Spectroscopy : A New Approach for Assessing the Color Index of Transformer Insulating Oil. Sensors 2018, 18, 2175. [Google Scholar] [CrossRef] [Green Version]
- Fofana, I.; Bouaicha, A.; Farzaneh, M.; Sabau, J.; Bussieres, D.; Robertson, E.B. Decay products in the liquid insulation of power transformers. IET Electr. Power Appl. 2010, 4, 177–184. [Google Scholar] [CrossRef]
- Fofana, I.; Bouaicha, A.; Farzaneh, M. Characterization of aging transformer oil—Pressboard insulation using some modern diagnostic techniques. Eur. Trans. Electr. Power 2011, 21, 1110–1127. [Google Scholar] [CrossRef]
- Hadjadj, Y.; Fofana, I.; Sabau, J.; Briosso, E. Assessing Insulating Oil Degradation by Means of Turbidity and UV/Vis Spectrophotometry Measurements. IEEE Trans. Dielectr. Electr. Insul. 2015, 22, 2653–2660. [Google Scholar] [CrossRef]
- Godinho, M.S.; Blanco, M.R.; Gambarra Neto, F.F.; Lião, L.M.; Sena, M.M.; Tauler, R.; de Oliveira, A.E. Evaluation of transformer insulating oil quality using NIR, fluorescence, and NMR spectroscopic data fusion. Talanta 2014, 129, 143–149. [Google Scholar] [CrossRef] [PubMed]
- Polansky, R.; Prosr, P.; Vik, R.; Moravcova, D.; Pihera, J. Comparison of the mineral oil lifetime estimates obtained by differential scanning calorimetry, infrared spectroscopy, and dielectric dissipation factor measurements. Thermochim. Acta 2017, 647, 86–93. [Google Scholar] [CrossRef]
- Nynas AB High Grade Nytro Lyra X—High Performance Insulating Oil. Available online: https://www.nynas.com/en/product-areas/transformer-oils/oils/nytro-lyra-x/ (accessed on 24 July 2019).
- ASTM International. ASTM D6802-02 Test Method for Determination of the Relative Content Of Dissolved Decay Products in Mineral Insulating Oils by Spectrophotometry; ASTM: West Conshohocken, PA, USA, 2010. [Google Scholar]
- Hadjadj, Y.; Fofana, I.; Jalbert, J. Insulating Oil Decaying Assessment by FTIR and UV-Vis Spectrophotometry Measurements. In Proceedings of the 2013 Annual Report Conference on Electrical Insulation and Dielectric Phenomena, Shenzhen, China, 20–23 October 2013; pp. 1310–1313. [Google Scholar]
- ASTM International. ASTM D1934—95 Standard Test Method for Oxidative Aging of Electrical Insulating Petroleum Oils by Open-Beaker Method; ASTM: West Conshohocken, PA, USA, 2012. [Google Scholar]
- Snedecor, G.W.; Cochran, W.G. Statistical Methods, 8th ed.; Iowa State University Press: Ames, IA, USA, 1989; ISBN 0813815614. [Google Scholar]
- International Electrotechnical Commission. Insulating Liquids—Measurement of Relative Permittivity, Dielectric Dissipation Factor (tan d) and d.c. Resistivity; EN 60247:2004; IEC: Geneva, Switzerland, 2004. [Google Scholar]
- Yadav, L.D.S. Organic Spectroscopy; Springer: Dordrecht, The Netherlands, 2005; ISBN 978-94-017-2508-8. [Google Scholar]
- Bley, T.; Pignanelli, E.; Schütze, A. Multi-channel IR sensor system for determination of oil degradation. J. Sens. Sens. Syst. 2014, 3, 121–132. [Google Scholar] [CrossRef]
- Zakharich, M.P.; Zaitsev, I.I.; Komar, V.P.; Nikonovich, F.N.; Ryzhkov, M.P.; Skornyakov, I.V. Analysis of Transformer Oil Using IR Analyzers. J. Appl. Spectrosc. 2001, 68, 61–65. [Google Scholar] [CrossRef]
- Hao, J.; Liao, R.; Liang, S.; Yang, L.; Zhu, M. Choice of antioxidants and their synergistic effect study towards new insulation oil. In Proceedings of the 2009 IEEE 9th International Conference on the Properties and Applications of Dielectric Materials, Harbin, China, 19–23 July 2009; pp. 53–56. [Google Scholar]
- Prosr, P.; Polanský, R.; Pihera, J.; Hahn, P. Classification of Insulating Liquids Thermal Treatment Using Infrared Spectroscopy and Multivariate Statistical Method. In Proceedings of the 37th Electrical Insulation Conference, Calgary, AB, Canada, 16–20 June 2019; pp. 291–294. [Google Scholar]
- Polanský, R.; Prosr, P.; Čermák, M. Determination of the thermal endurance of PCB FR4 epoxy laminates via thermal analyses. Polym. Degrad. Stab. 2014, 105, 107–115. [Google Scholar] [CrossRef]
- Rabelo Neto, R.C.; Lima, D.O.; Pinheiro, T.D.S.; Almeida, R.F.; Castro Dantas, T.N.; Dantas, M.S.G.; Araújo, M.A.S.; Cavalcante, C.L.; Azevedo, D.C.S. Thermo-Oxidative Stability of Mineral Naphthenic Insulating Oils: Combined Effect of Antioxidants and Metal Passivator. Ind. Eng. Chem. Res. 2004, 43, 7428–7434. [Google Scholar] [CrossRef]
- Sierota, A.; Rungis, J. Electrical insulating oils. I. Characterization and pre-treatment of new transformer oils. IEEE Electr. Insul. Mag. 1995, 11, 8–20. [Google Scholar] [CrossRef]
- Maleville, X.; Faure, D.; Legros, A.; Hipeaux, J.C. Oxidation of mineral base oils of petroleum origin: The relationship between chemical composition, thickening, and composition of degradation products. Lubr. Sci. 1996, 9, 1–60. [Google Scholar] [CrossRef]
- Mortier, R.M.; Fox, M.F.; Orszulik, S.T. Chemistry and Technology of Lubricants; Springer: New York, NY, USA, 2010; ISBN 978-1-4020-8662-5. [Google Scholar]
- Migdal, C.A.; Wardlow, A.B.; Ameye, J.L. Oxidation and the Testing of Turbine Oils; ASTM International: West Conshohocken, PA, USA, 2008; ISBN 978-0-8031-3493-5. [Google Scholar]
- Miyagi, K.; Oe, E.; Yamagata, N. Evaluation of Aging for Thermally Upgraded Paper in Mineral Oil. J. Int. Counc. Electr. Eng. 2011, 1, 181–187. [Google Scholar] [CrossRef] [Green Version]
Figure 1.
Piece of transformer winding used as a catalyst.

Figure 2.
UV-Vis spectra for mineral oil aged at 110 °C (a) without and (b) with catalysts.

Figure 3.
Evaluation of UV-Vis_λmax for oil samples aged at constant temperatures for various aging times (a) without (C−) and (b) with catalysts (C+).
Figure 3.
Evaluation of UV-Vis_λmax for oil samples aged at constant temperatures for various aging times (a) without (C−) and (b) with catalysts (C+).
Figure 4.
Aging temperature 110 °C—an example of the indirect derivation of the endpoint criteria for UV-Vis_λmax.
Figure 4.
Aging temperature 110 °C—an example of the indirect derivation of the endpoint criteria for UV-Vis_λmax.

Figure 5.
FT-IR spectra between 3635 and 3675 cm−1 for mineral oil aged at 130 °C (a) without and (b) with catalysts.
Figure 5.
FT-IR spectra between 3635 and 3675 cm−1 for mineral oil aged at 130 °C (a) without and (b) with catalysts.


Figure 6.
Evaluation of the FT-IR absorbance at 3650 cm−1 for oil samples aged at constant temperatures for various aging times (a) without (C−) and (b) with catalysts (C+).
Figure 6.
Evaluation of the FT-IR absorbance at 3650 cm−1 for oil samples aged at constant temperatures for various aging times (a) without (C−) and (b) with catalysts (C+).
Figure 7.
Aging temperature of 130 °C—an example of the indirect derivation of the endpoint criteria for FT-IR absorbance at 3650 cm−1.
Figure 7.
Aging temperature of 130 °C—an example of the indirect derivation of the endpoint criteria for FT-IR absorbance at 3650 cm−1.


Table 1.
UV-Vis spectroscopy—summary of the fitting and calculated parameters of the mineral oil aged with (C+) and without (C−) catalysts.
Table 1.
UV-Vis spectroscopy—summary of the fitting and calculated parameters of the mineral oil aged with (C+) and without (C−) catalysts.
| Temperature (°C) | Catalysts (Yes/No) | Fitting Parameters (y = ax3 + bx2 + cx) | Endpoint Criterion (a.u.) | Time to Criterion (Hours) | Reduction in Lifetime (%) | |||
|---|---|---|---|---|---|---|---|---|
| a | b | c | R2 | |||||
| 110 | No | 3.82 × 10⁻¹⁰ | −1.06 × 10⁻⁸ | 1.22 × 10⁻⁴ | 0.988 | 1.06 | 2197 | 39.1 |
| Yes | −2.17 × 10⁻¹¹ | 3.30 × 10⁻⁷ | −1.38 × 10⁻⁴ | 0.991 | 1338 | |||
| 120 | No | −1.15 × 10⁻⁹ | 3.94 × 10⁻⁶ | −1.22 × 10⁻³ | 0.996 | 2.15 | 1177 | 35.3 |
| Yes | 1.31 × 10⁻⁹ | 4.31 × 10⁻⁶ | −1.22 × 10⁻³ | 0.995 | 762 | |||
| 130 | No | 5.90 × 10⁻⁹ | 5.21 × 10⁻⁶ | −1.08 × 10⁻³ | 0.986 | 2.02 | 556 | 44.8 |
| Yes | −3.96 × 10⁻⁹ | 3.85 × 10⁻⁵ | −4.86 × 10⁻³ | 0.995 | 307 | |||
Table 2.
FT-IR—summary of the fitting and calculated parameters of the mineral oil aged with (C+) and without (C−) catalysts.
Table 2.
FT-IR—summary of the fitting and calculated parameters of the mineral oil aged with (C+) and without (C−) catalysts.
| Temperature (°C) | Catalysts (Yes/No) | Fitting Parameters (y = ax2 + bx) | Endpoint Criterion (a.u.) | Time to Criterion (Hours) | Reduction in Lifetime (%) | ||
|---|---|---|---|---|---|---|---|
| a | b | R2 | |||||
| 110 | No | −8.71 × 10⁻⁸ | −1.25 × 10⁻⁵ | 0.989 | 0.763 | 2197 | 34.5 |
| Yes | −2.14 × 10⁻⁸ | −1.98 × 10⁻⁵ | 0.990 | 1439 | |||
| 120 | No | −3.84 × 10⁻⁸ | −2.06 × 10⁻⁵ | 0.990 | 0.735 | 1177 | 35.3 |
| Yes | −9.18 × 10⁻⁸ | −2.55 × 10⁻⁵ | 0.993 | 761 | |||
| 130 | No | −3.01 × 10⁻⁷ | −1.27 × 10⁻⁵ | 0.994 | 0.713 | 556 | 35.3 |
| Yes | 3.94 × 10⁻⁷ | −1.41 × 10⁻⁴ | 0.994 | 360 | |||
© 2020 by the authors. Licensee MDPI, Basel, Switzerland. This article is an open access article distributed under the terms and conditions of the Creative Commons Attribution (CC BY) license (http://creativecommons.org/licenses/by/4.0/).
Share and Cite
MDPI and ACS Style
Polanský, R.; Hahn, P.; Kadlec, P.; Moravcová, D.; Prosr, P. Quantifying the Effect of Catalysts on the Lifetime of Transformer Oil. Appl. Sci. 2020, 10, 1309. https://doi.org/10.3390/app10041309
AMA Style
Polanský R, Hahn P, Kadlec P, Moravcová D, Prosr P. Quantifying the Effect of Catalysts on the Lifetime of Transformer Oil. Applied Sciences. 2020; 10(4):1309. https://doi.org/10.3390/app10041309
Chicago/Turabian StylePolanský, Radek, Pavel Hahn, Petr Kadlec, Daniela Moravcová, and Pavel Prosr. 2020. "Quantifying the Effect of Catalysts on the Lifetime of Transformer Oil" Applied Sciences 10, no. 4: 1309. https://doi.org/10.3390/app10041309
Note that from the first issue of 2016, this journal uses article numbers instead of page numbers. See further details here.