Exploring the Evolution of Drought Characteristics in Balochistan, Pakistan
by
 , , , and
Shoaib Jamro
1,* ,
,
Falak Naz Channa
1,
Ghulam Hussain Dars
1,
Kamran Ansari
1 and
Nir Y. Krakauer
2,*
1
U.S.-Pakistan Center for Advanced Studies in Water, Mehran University of Engineering and Technology, Jamshoro, Sindh 76090, Pakistan
2
Department of Civil Engineering and NOAA-CREST, City College of New York, New York, NY 10031, USA
*
Authors to whom correspondence should be addressed.
Appl. Sci. 2020, 10(3), 913; https://doi.org/10.3390/app10030913
Submission received: 29 December 2019
/
Revised: 18 January 2020
/
Accepted: 21 January 2020
/
Published: 31 January 2020
Abstract
:In the wake of a rapidly changing climate, droughts have intensified, in both duration and severity, across the globe. The Germanwatch long-term Climate Risk Index ranks Pakistan among the top 10 countries most affected by the adverse effects of climate change. Within Pakistan, the province of Balochistan is among the most vulnerable regions due to recurring prolonged droughts, erratic precipitation patterns, and dependence on agriculture and livestock for survival. This study aims to explore how the characteristics of droughts have evolved in the region from 1902–2015 using 3-month and 12-month timescales of a popular drought index, the Standardized Precipitation Evapotranspiration Index (SPEI). The region was divided into six zones using Spatial “K”luster Analysis using Tree Edge Removal (SKATER) method, and run theory was applied to characterize droughts in terms of duration, severity, intensity, and peak. The results of the non-parametric Mann–Kendall trend test applied to SPEI indicate prevailing significant negative trends (dryer conditions) in all the zones. Balochistan experienced its most severe droughts in the 1960s and around 2000. The effects of climate change are also evident in the fact that all the long duration droughts occurred after 1960. Moreover, the number of droughts identified by 3-month SPEI showed a significant increase after 1960 for all six zones. The same trend was found in the 12-month SPEI but for only three zones.
1. Introduction
Of all the hazards that wreak havoc across the globe, droughts are perhaps the least understood and the most damaging [1]. Caused primarily by an anomaly in the natural rainfall pattern of a region, droughts have evolved considerably in recent decades due to climate change, which has led to changes in the hydrometeorological processes throughout the Earth. Global warming has caused the average surface temperatures to increase, leading to changes in rainfall patterns, increased evapotranspiration, and shifting cropping patterns [2].
One factor that makes studying droughts so problematic is that no single definition exists for drought [3]. This creeping phenomenon, as it has been called due to its slow onset, means different things to different water users. For a reservoir manager, a drought might occur when the water level in the reservoir drops below certain thresholds. For a meteorologist, it might be the departure of rainfall from the long-term average for a region. For a farmer, it might be the depletion of soil moisture such that it no longer supports the growth of crops. Droughts have been categorized into different types depending on which stage in the hydrometeorological cycle the effects are felt.
Meteorological drought may be defined as a shortfall of precipitation as compared to the long-term average for that region. Agricultural, or soil moisture, drought is said to occur when the soil moisture depleted to an extent where it is not enough to support the healthy growth of crops and vegetation. Hydrological drought occurs typically over a longer period, when the water flows in streams and rivers drop below the long-term average. When drought causes adverse impacts on society, it is said to be a socio-economic drought [3]. Recently, groundwater drought is also being discussed as a new type of drought, which is identified by a shortage in groundwater.
To monitor and study the propagation of droughts, researchers have developed various indices. Edossa et al. [4] employed the self-calibrated Palmer Drought Severity Index (PDSI) [5] to explore the characteristics of meteorological and hydrological droughts in South Africa. Focusing on the quantification of drought duration and severity, Byun and Wilhite [6] introduced the Effective Drought Index (EDI), which requires daily precipitation data. Numerous studies have made use of another popular drought index, the Standardized Precipitation Index (SPI) [7], to study the characteristics of droughts in various parts of the world [8,9,10,11,12]. An upgrade to SPI is the Standardized Precipitation Evapotranspiration Index (SPEI) introduced by Vincente-Serrano et al. [13] in 2010. The calculation procedure is similar to that of SPI except that SPEI also uses potential evapotranspiration as an input, in addition to precipitation. Therefore, SPEI reflects the effects of temperature on droughts, and so is more suitable for drought monitoring in a changing climate. There have been various studies conducted that show the efficiency of SPEI as an index to monitor and characterize droughts [14,15,16,17,18,19,20,21,22]. SPEI has also been documented to be a suitable indicator for monitoring droughts in Pakistan [14,23].
Pakistan has been ranked among the top 10 countries severely affected by the adverse impacts of climate change [24]. The main hazards in Pakistan are floods and droughts. Balochistan province is among the most vulnerable to droughts due to its arid climatology, high exposure, and low adaptiveness [25]. A study [10] used SPI to characterize droughts in Balochistan from 1975 to 2010. It concluded that more than 70% of the meteorological stations demonstrated negative trends in precipitation after applying the Mann–Kendall test. However, the period chosen for this study does not provide a complete picture of the evolution of droughts throughout the 20th century. Furthermore, SPI does not reflect the changes in evaporative demand occurring due to warming. Therefore, in this study, we have used SPEI as the drought index and extended the study period to 1902–2015. This study also aims to extend the Pakistan-wide work of Jamro et al. [26], which concluded that central Balochistan, along with Sindh, is the most vulnerable area to droughts and requires further investigation.
In the current study, SPEI at 3-month and 12-month timescales has been used to characterize droughts after regionalizing Balochistan into six zones. Finally, trend analysis has been carried out to identify any trends present in the SPEI time series, and drought characteristics, of the different zones.
2. Materials and Methods
2.1. Meteorological Data
The drought index chosen for this study is the Standardized Precipitation Evapotranspiration Index (SPEI) [13]. It can be considered an advanced version of the popular drought indicator, the Standardized Precipitation Index (SPI) [7,27], as it incorporates the effect of temperature when modeling droughts. SPI assumes either that precipitation has much higher variability than other climatic parameters affecting droughts, such as potential evapotranspiration (PET) and temperature, or that the other climatic parameters are stationary. However, in the context of global warming, assuming temperature to be stationary might lead to misleading conclusions. Therefore, SPEI is better suited for drought assessment, especially under a changing climate where the effect of rising temperatures is significant in drought development [28,29]. SPEI is based on the calculation of a monthly climatic water balance, which is determined by subtracting PET from precipitation [13,30]. However, it does have limitations of its own. These include more data requirements than SPI and sensitivity to the calculation method of PET.
The calculation of SPEI is similar to that of SPI [31] in that the cumulated water balance (for SPEI versus precipitation for SPI) for n months is standardized to yield SPEI for different timescales. For example, SPEI at a 1-month timescale indicates a normalized water balance for that month as compared to the long-term average for the same month. Similarly, the 12-month SPEI denotes the normalized water balance for the preceding year in comparison to the long-term yearly average.
The Global SPEI Database, SPEIbase (version 2.5.1), contains monthly SPEI at timescales of 1–48 months and a spatial resolution of 0.5° for the time period 1901–2015 [32]. The Global SPEI Database is based on gridded monthly precipitation and reference evapotranspiration from the University of East Anglia Climate Research Unit (CRU) (version TS 3.24.01) [33]. The PET is calculated using the Penman–Monteith method. The water balance is transformed to an approximately normal distribution after fitting to its time-series a three-parameter distribution (log-logistic distribution) using the unbiased probability-weighted moments method [30]. SPEI at 3-month and 12-month timescales were acquired from the SPEIbase to evaluate the characteristics of droughts of seasonal and yearly timescales, respectively.
2.2. Study Area
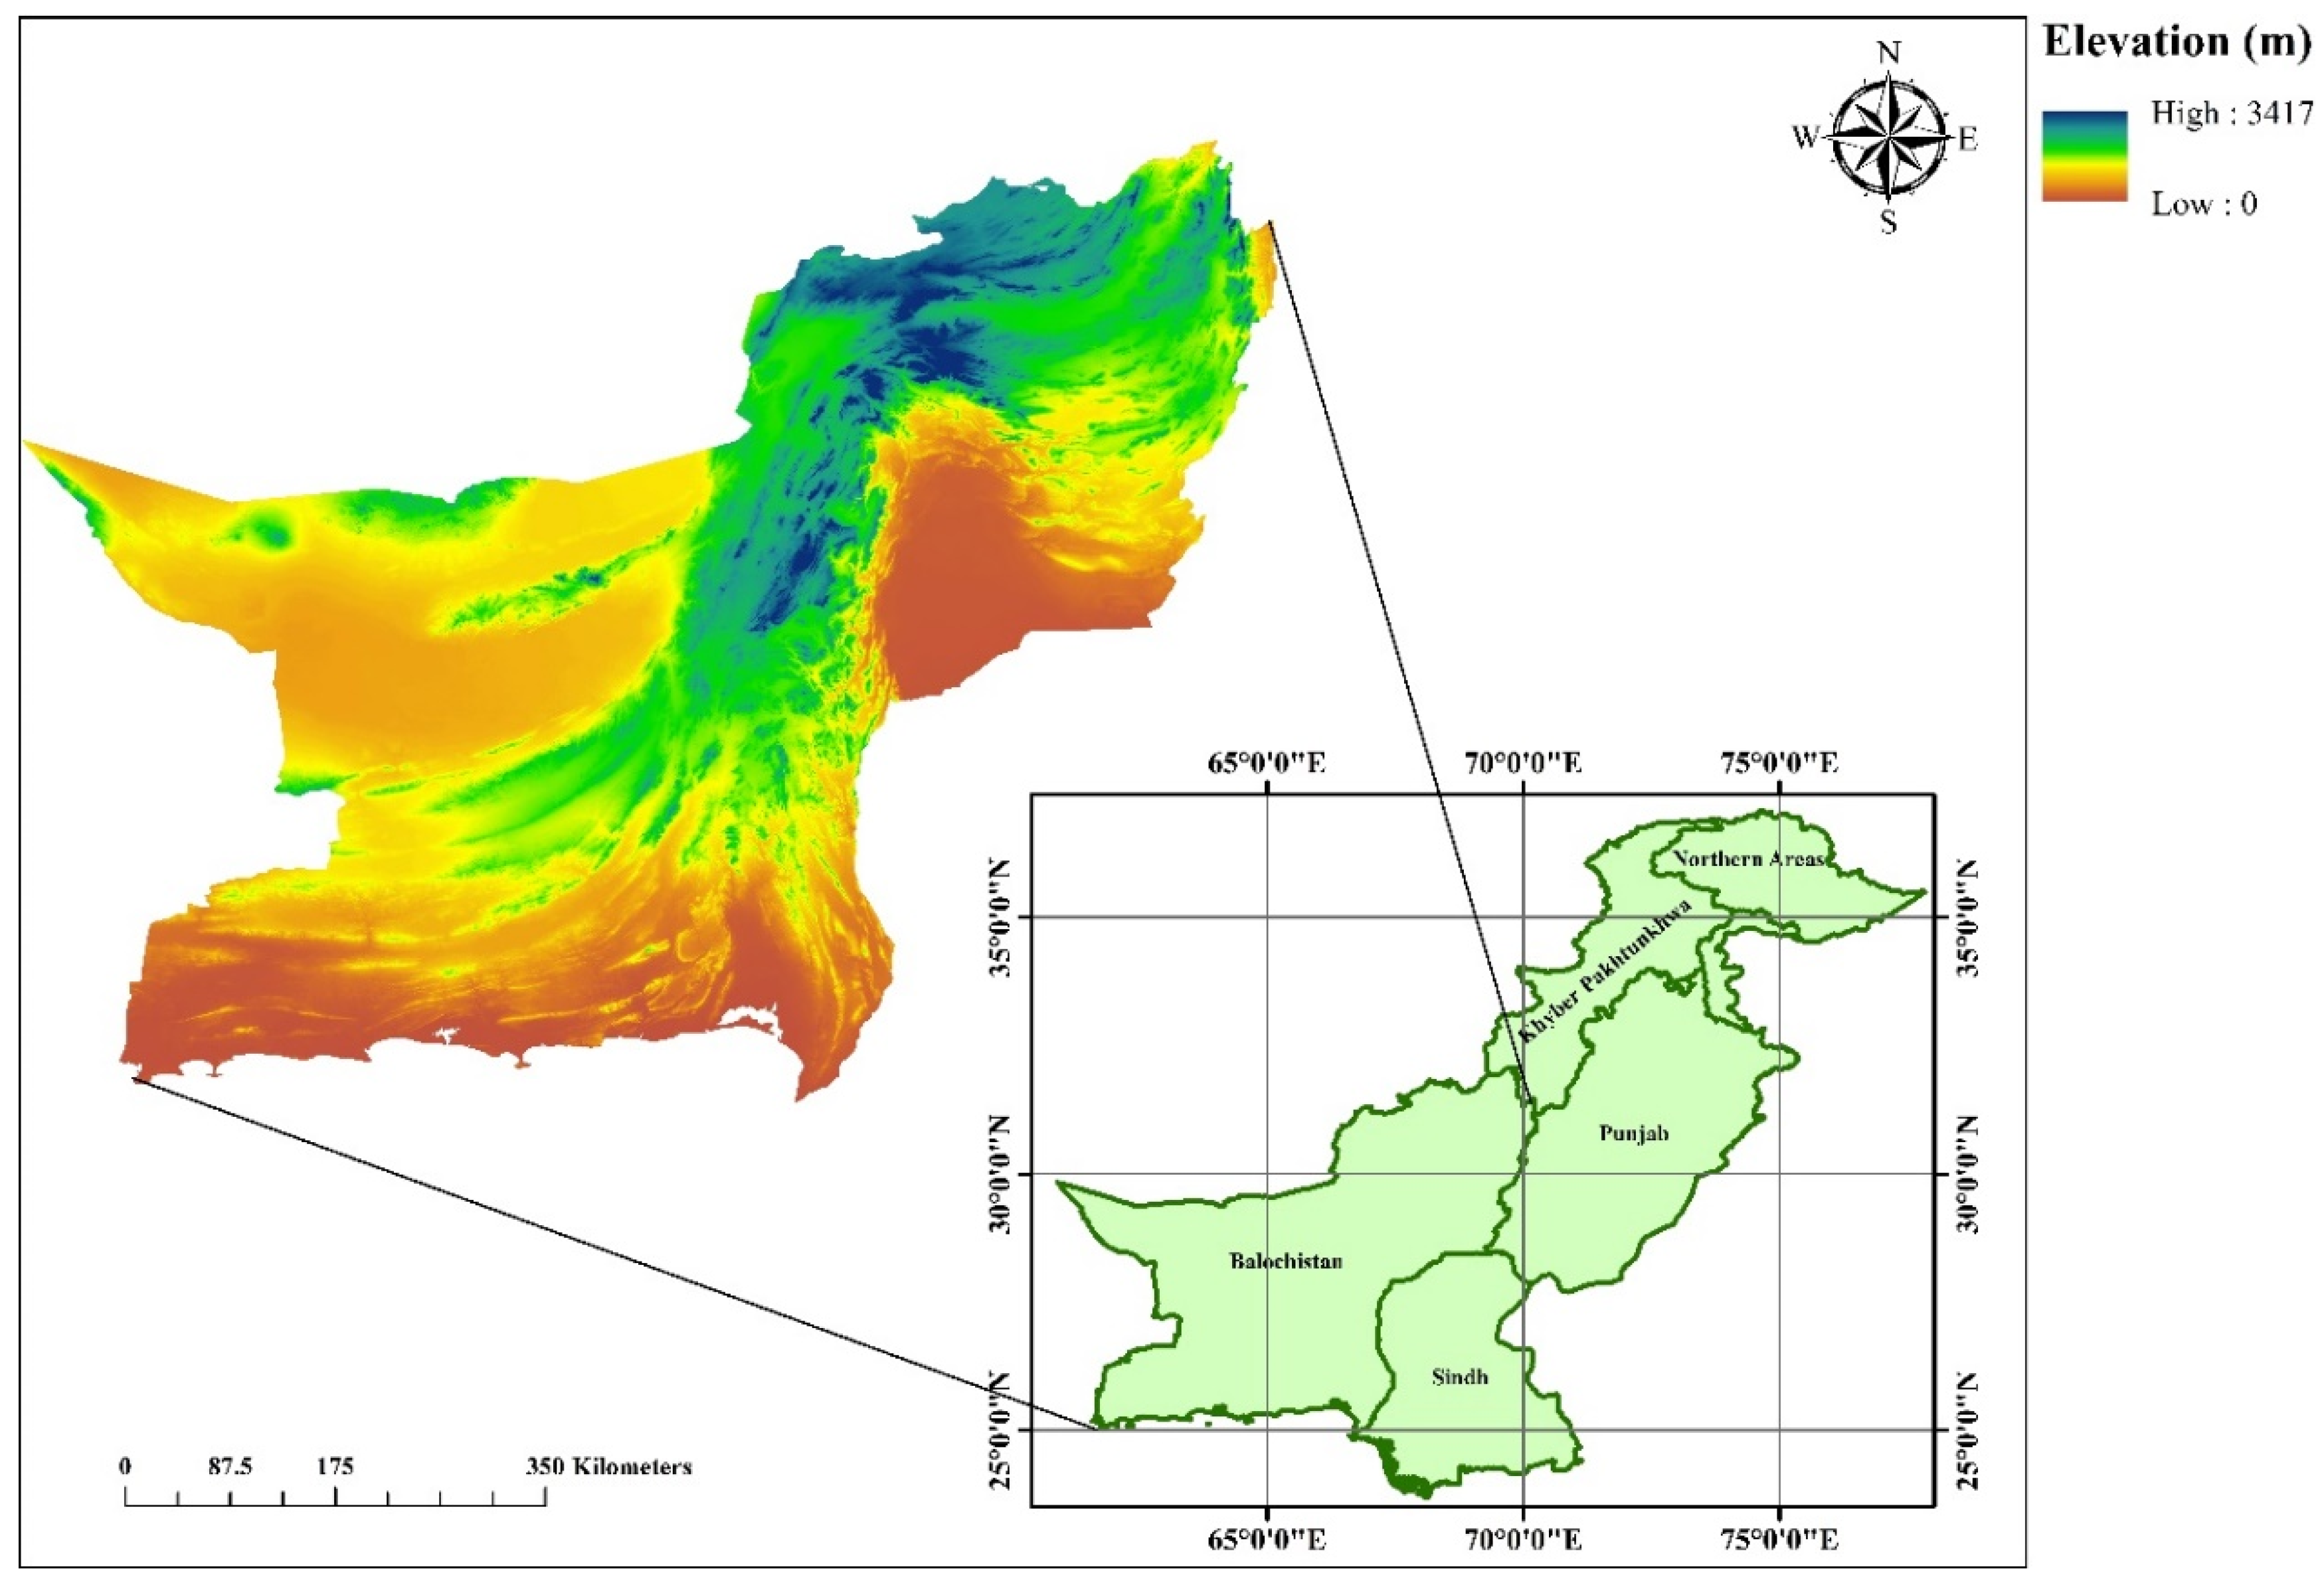
Balochistan (Figure 1) is the largest province of Pakistan, covering about 44% of its total landmass [34]. It is located between longitudes 71° and 61° E and latitudes 32° and 25° N. Its southern border includes about two-thirds of the coastline of Pakistan [35]. As it is in the arid zone, slight disturbances in climatic parameters lead to devastating consequences in the shape of flash floods and droughts [36]. The annual rainfall across Balochistan, on average, is less than 250 mm, characterizing it as an arid region. Balochistan is usually categorized into four geographical zones: northern uplands, lower highlands, plains, and deserts [37]. There is a considerable variation in temperature across the province. The northern uplands are characterized by warm summers and cold winters, whereas the winters in the northern districts of the lower highlands are usually extremely cold. However, summers are dry and hot. The plains and deserts get extremely hot in the summers, with temperatures reaching as high as 50 °C.
2.3. Drought Regionalization
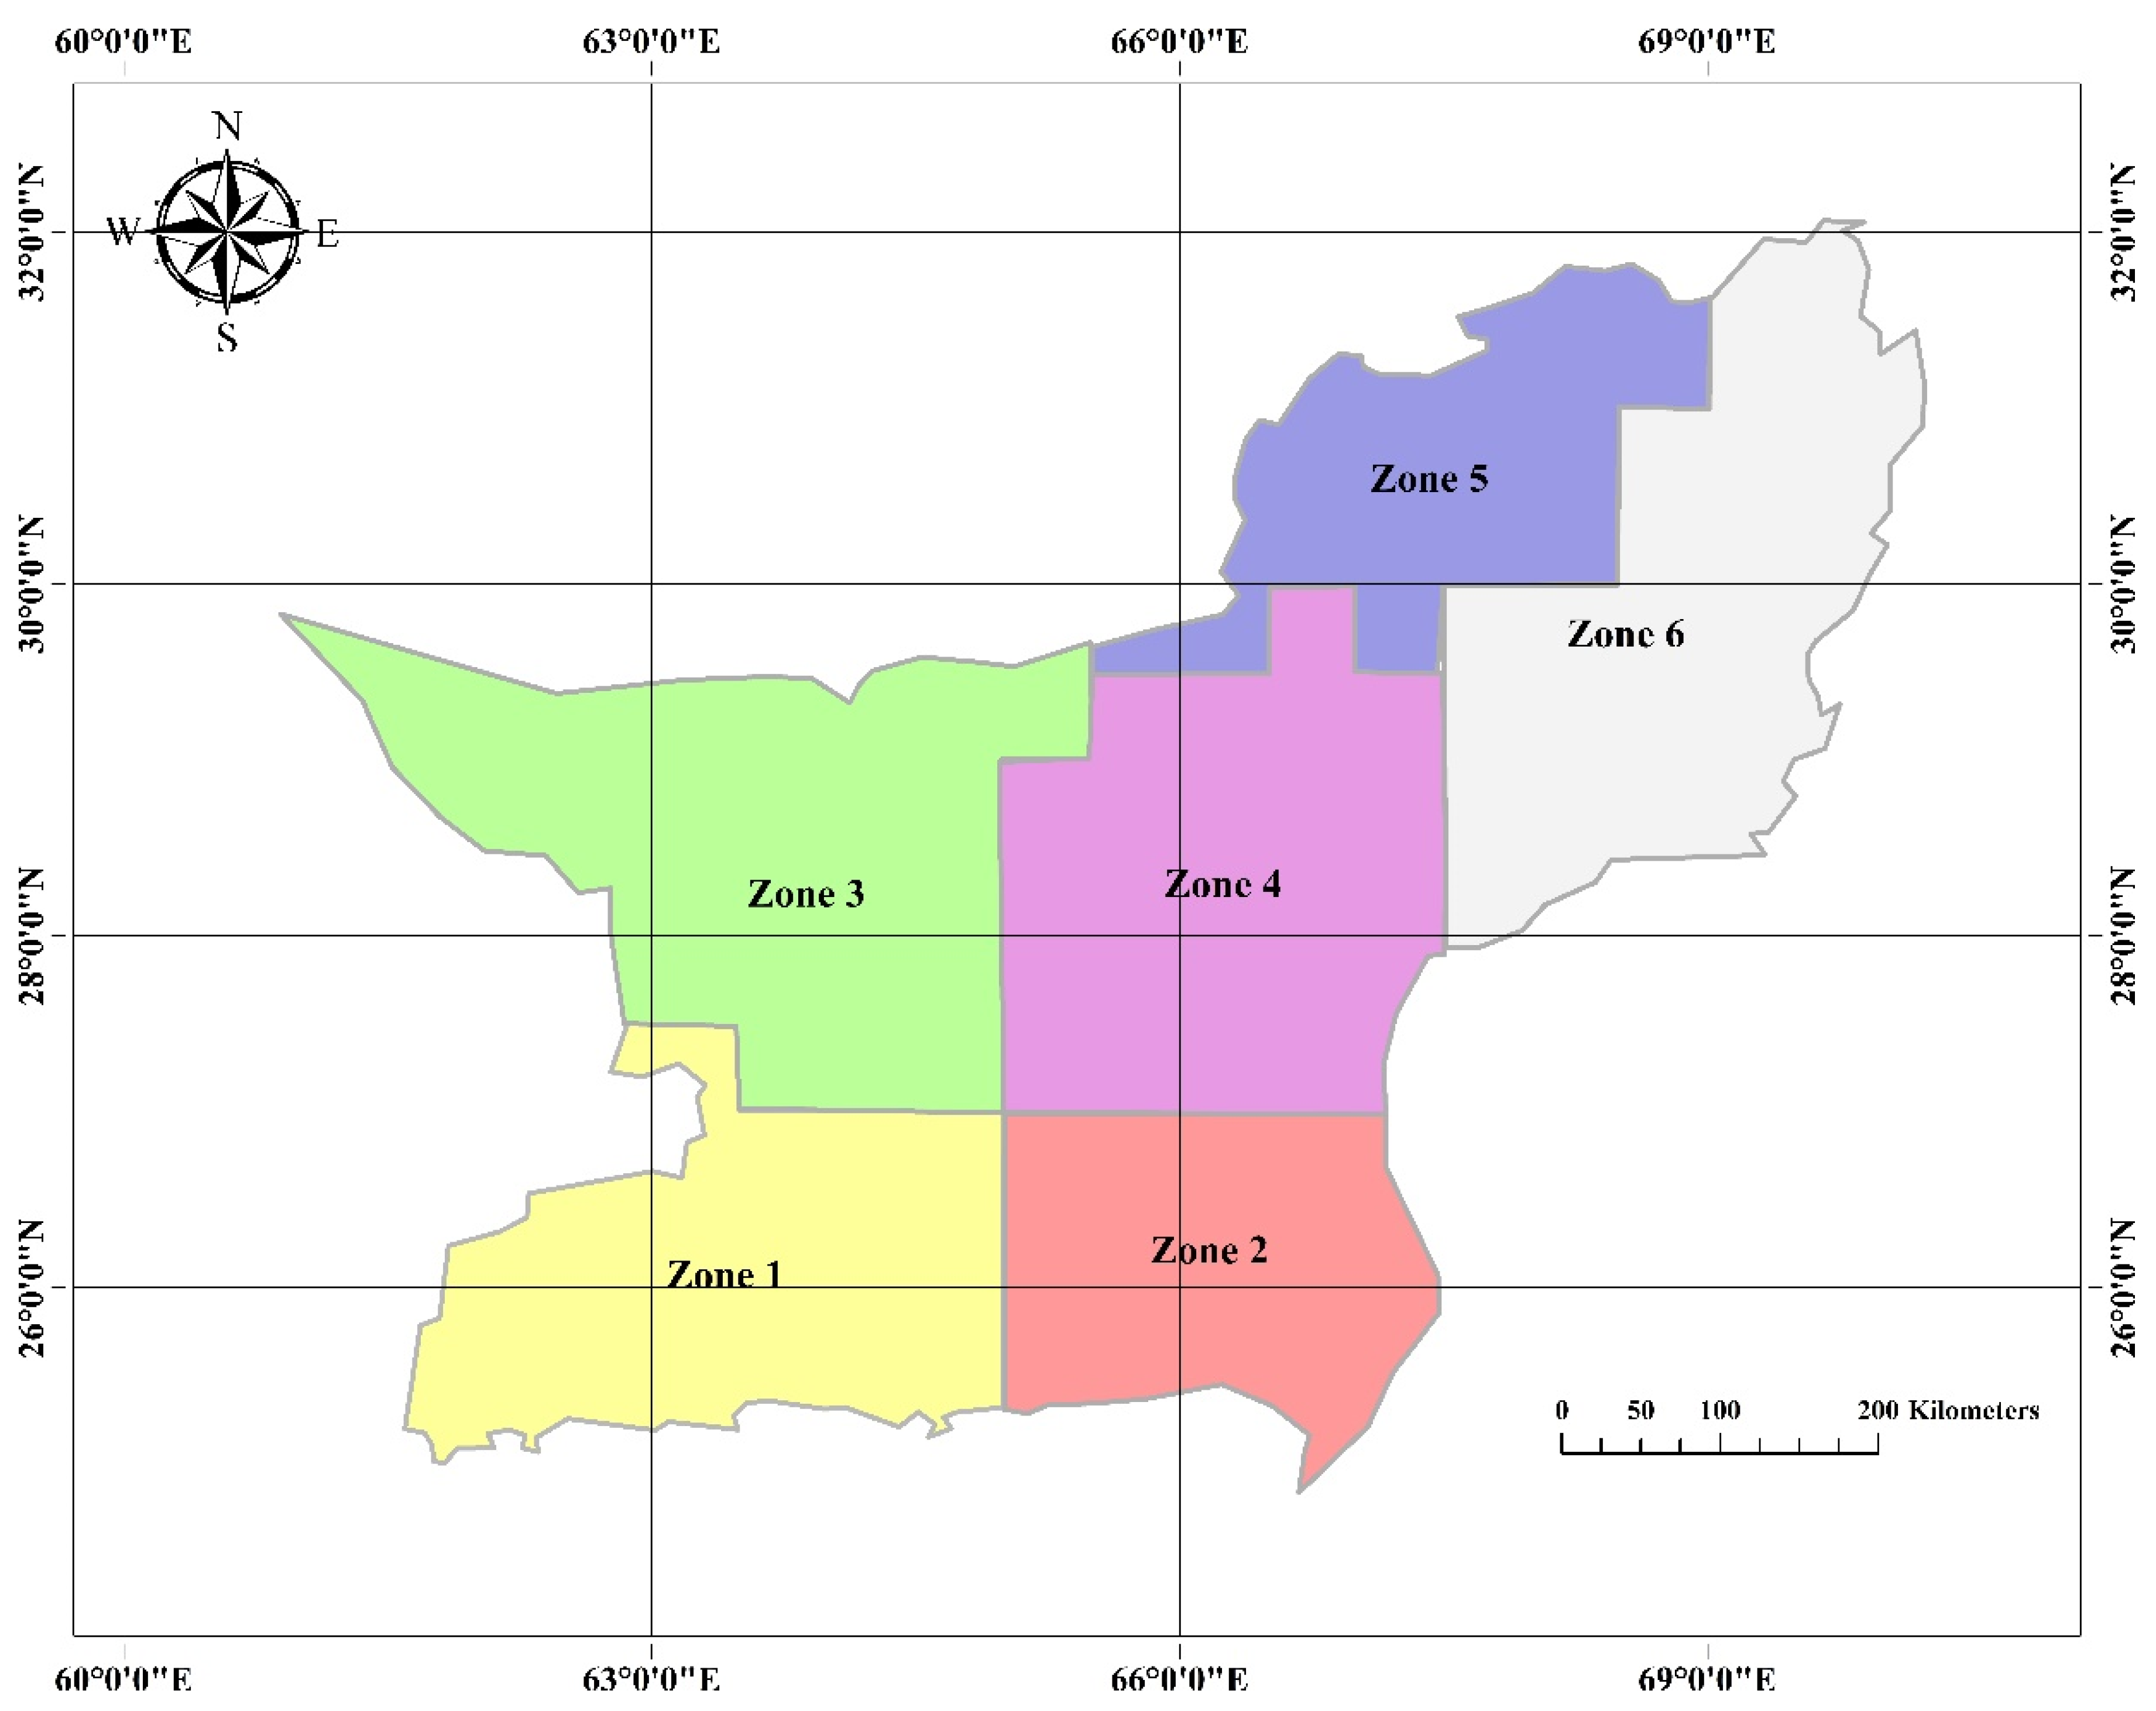
Regionalization is a popular technique used in hydrology to group stations into clusters showcasing similar behavior when comparing a certain attribute. The regionalization of droughts has been carried out in this study using a Spatial “K”luster Analysis using Tree Edge Removal (SKATER) algorithm [18,26,38] to divide Balochistan into six regions having a similar behavior of SPEI. A 24-month SPEI was used to cluster the 124 grid cells in Balochistan into six spatially contiguous regions, as this timescale was found to reflect the climate of Balochistan better than other timescales of SPEI.
The SKATER method “combines the use of a minimum spanning tree with combinational optimization techniques” [38,39]. It is based on graph theory and it represents objects as vertices, whereas the relationships among the objects are represented by the edges. The relationships are based upon the attribute of interest, which in this case is the time series of SPEI. The relationships among the vertices are quantified by assigning a certain weight to each edge, which is proportional to the dissimilarity measure between the vertices it joins. SKATER uses Prim’s algorithm [40] to construct a Minimum Spanning Tree (MST), which is a connected graph with no circuits where the vertices are connected by an exclusive path and the edges have the minimum weight.
After Balochistan was divided into six spatially contiguous zones, 3-month and 12-month SPEI were calculated for each grid cell. All the cells falling in a certain zone were averaged to obtain the SPEI for that zone.
2.4. Drought Characterization
To identify the droughts, run theory was employed [41]. It identifies runs based on a certain threshold. A run is a portion of a time series where all the values of the indicator are below a specified threshold. Various thresholds have been used in the literature for identifying droughts. Tian and Quiring [20] used the objective SPEI drought threshold in Oklahoma, which was −0.7. Liu et al. [18] and Jamro et al. [26] used −0.5 as their chosen thresholds. Since this study is an extension of Jamro et al. [26], when the SPEI crossed the −0.5 mark, a drought was said to occur (Figure 2). Following the identification of drought events, each drought was then characterized in terms of duration, severity, intensity, and peak (Figure 3) [15]. The Drought Duration (DD) is the number of months between the start and the end of a drought event. Drought Severity (DS) is the sum of all the values of SPEI during a drought event. Drought Intensity (DI) is DS divided by DD for the drought event. Drought Peak (DP) is the lowest value of SPEI reached during the drought event.
2.5. Drought Trends and Evolution
The identification of statistically significant trends in SPEI and drought characteristics has been carried out using the non-parametric Mann–Kendall trend test [42] and Sen’s slope. The Mann–Kendall calculation involves the subtraction of a trend estimate [43] from the time series.
This test has been recommended by the World Meteorological Organization (WMO) to be conducted in climatology studies due to its allowance for missing values, low sensitivity to outliers, and no requirements for the sample to conform to a certain distribution [15]. Sen’s slope is another non-parametric test which is usually run to estimate the true slope of trends found to be significant by the Mann–Kendall trend test [44,45]. The Mann–Kendall trend test is applied at a significance level of 0.05, and Sen’s slope is used to estimate the magnitude of the slope.
To study the evolution of drought characteristics from 1902 to 2015, two types of analyses were carried out. First, the Mann–Kendall trend test was applied to the entire time series of SPEI and drought characteristics. Secondly, the study period was divided into two parts, with one being pre-1960 and the other post-1960. Then, descriptive statistics were calculated for each time period. The division was undertaken to isolate the effects of climate change, which is widely reported to have been accelerated since the 1960s [46,47].
3. Results
3.1. Drought Regionalization
The SKATER technique applied to Balochistan created six contiguous zones based on the similarity of 24-month SPEI time series (Figure 4). The zones produced reflect the climatology of this region.
3.2. 3-Month and 12-Month SPEI Time Series
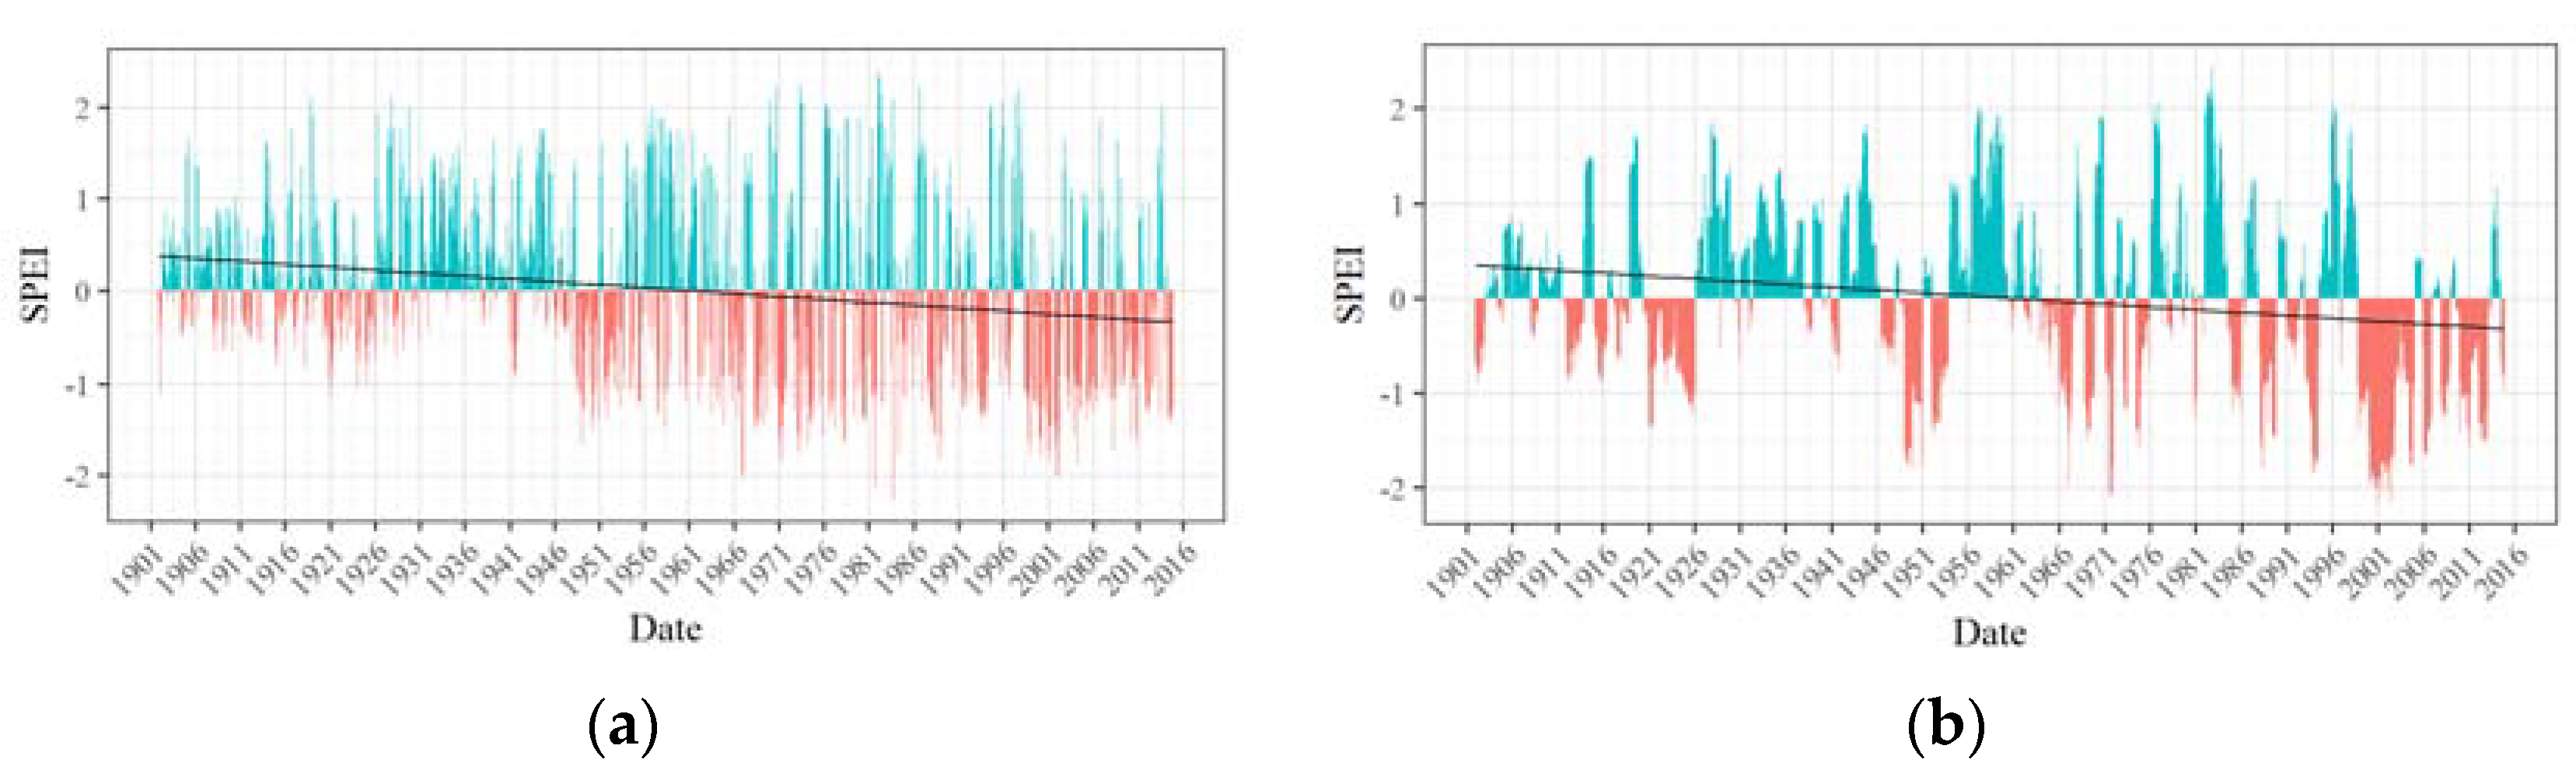
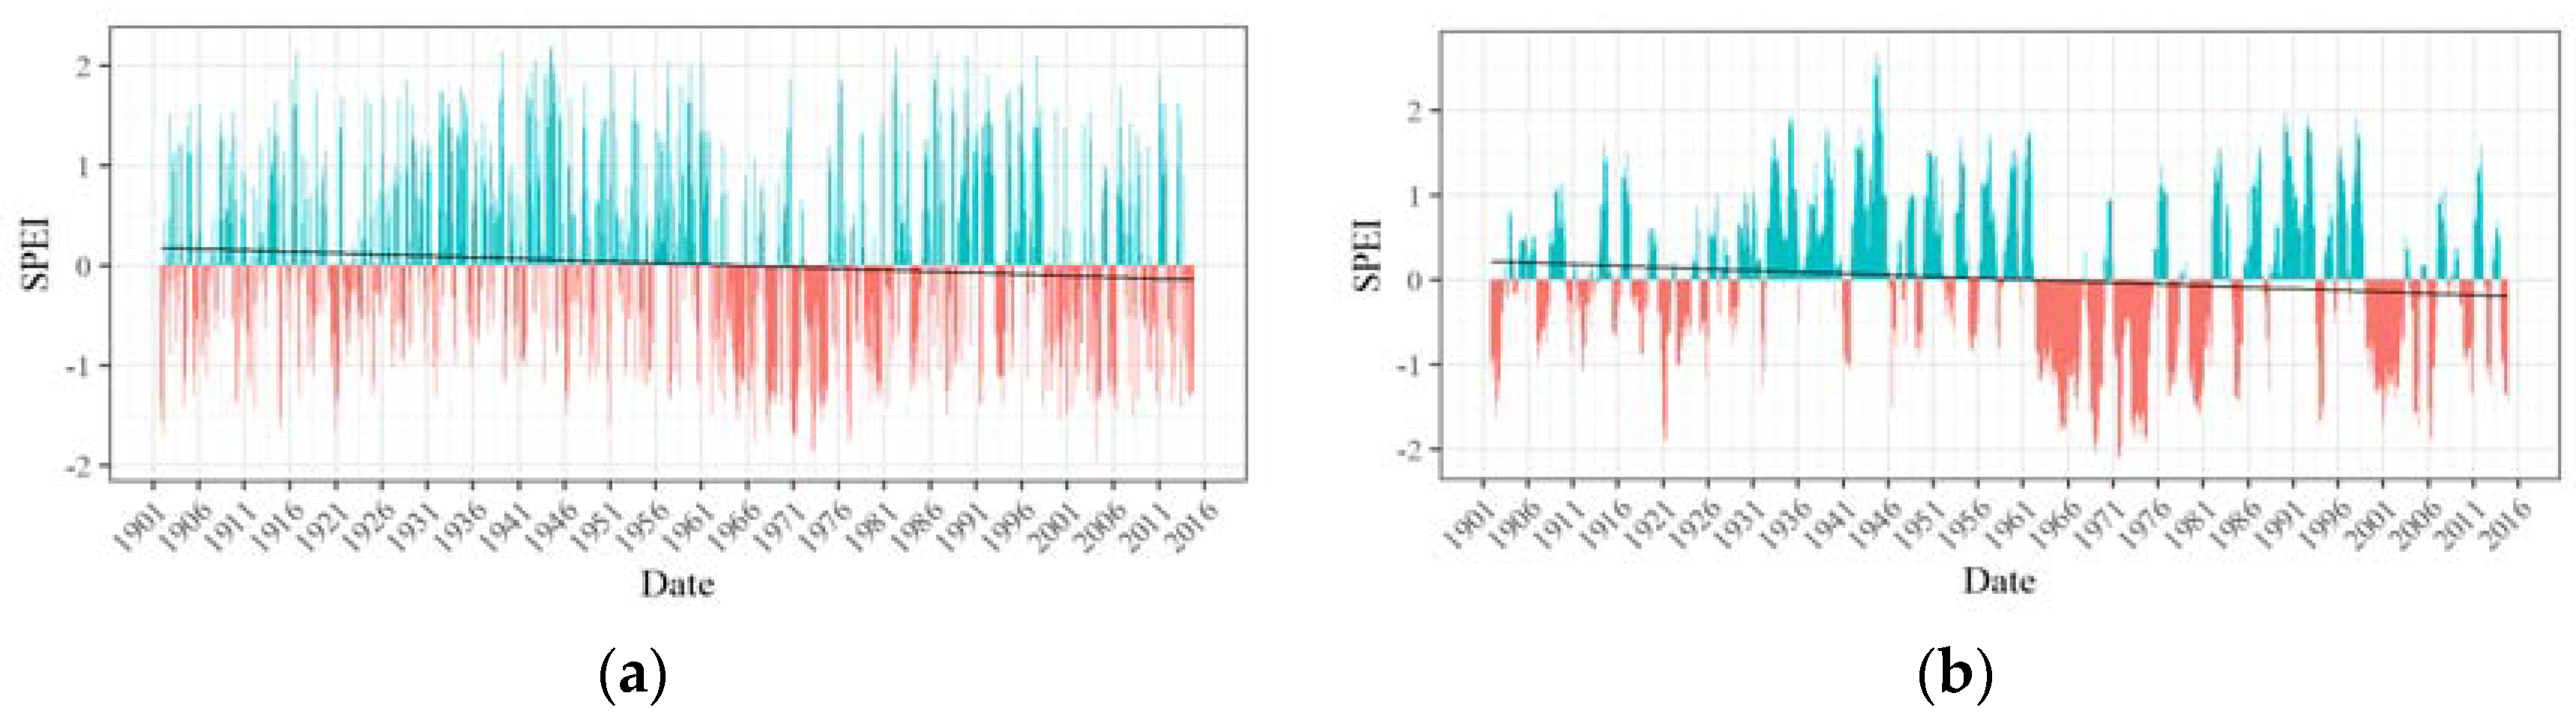
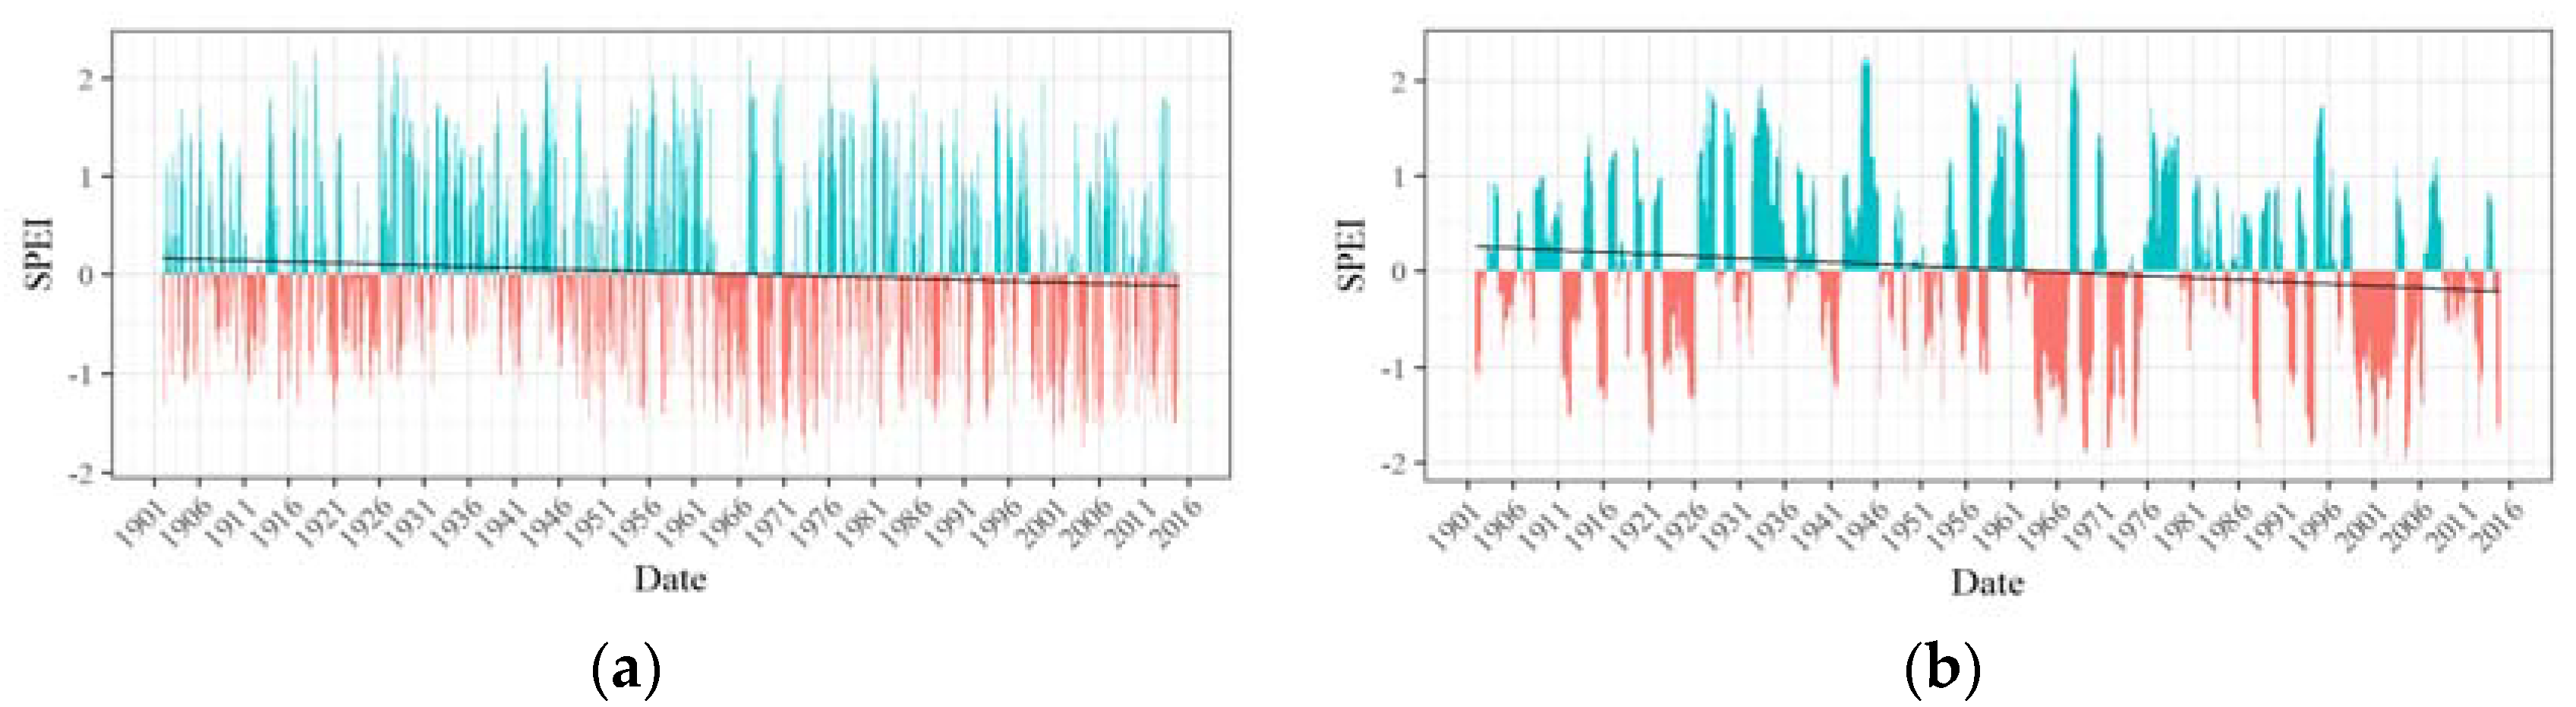
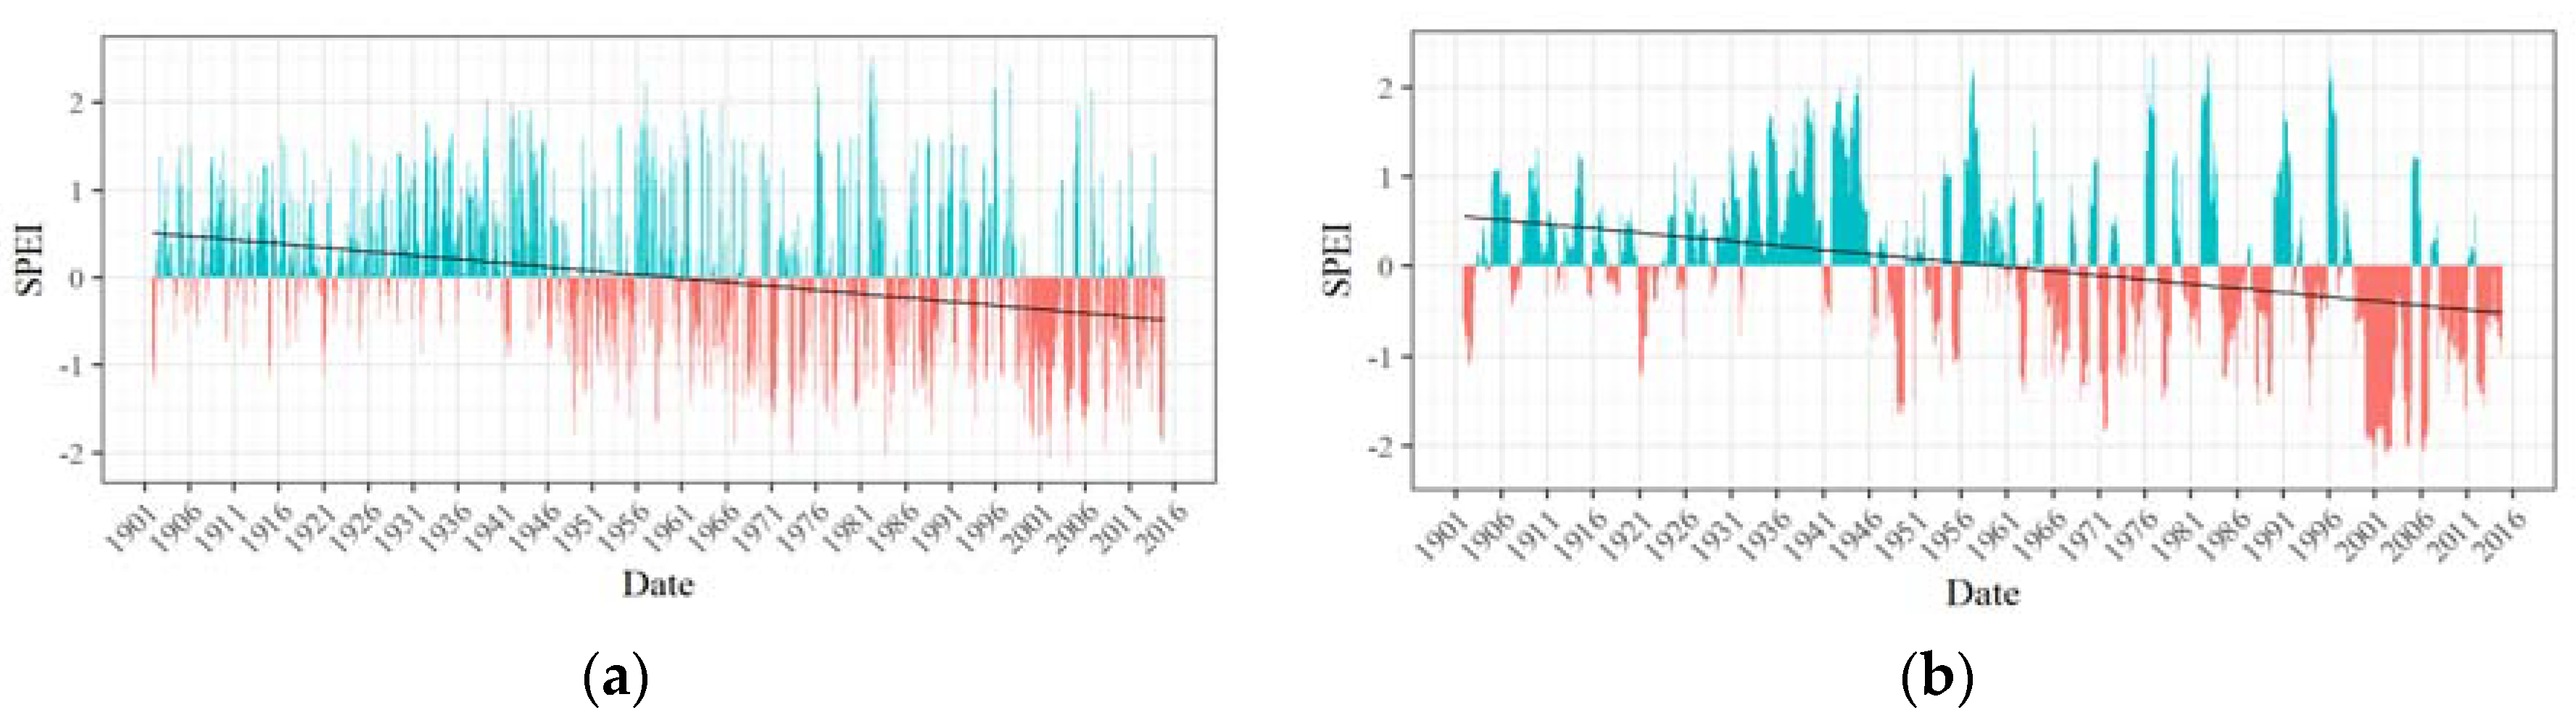
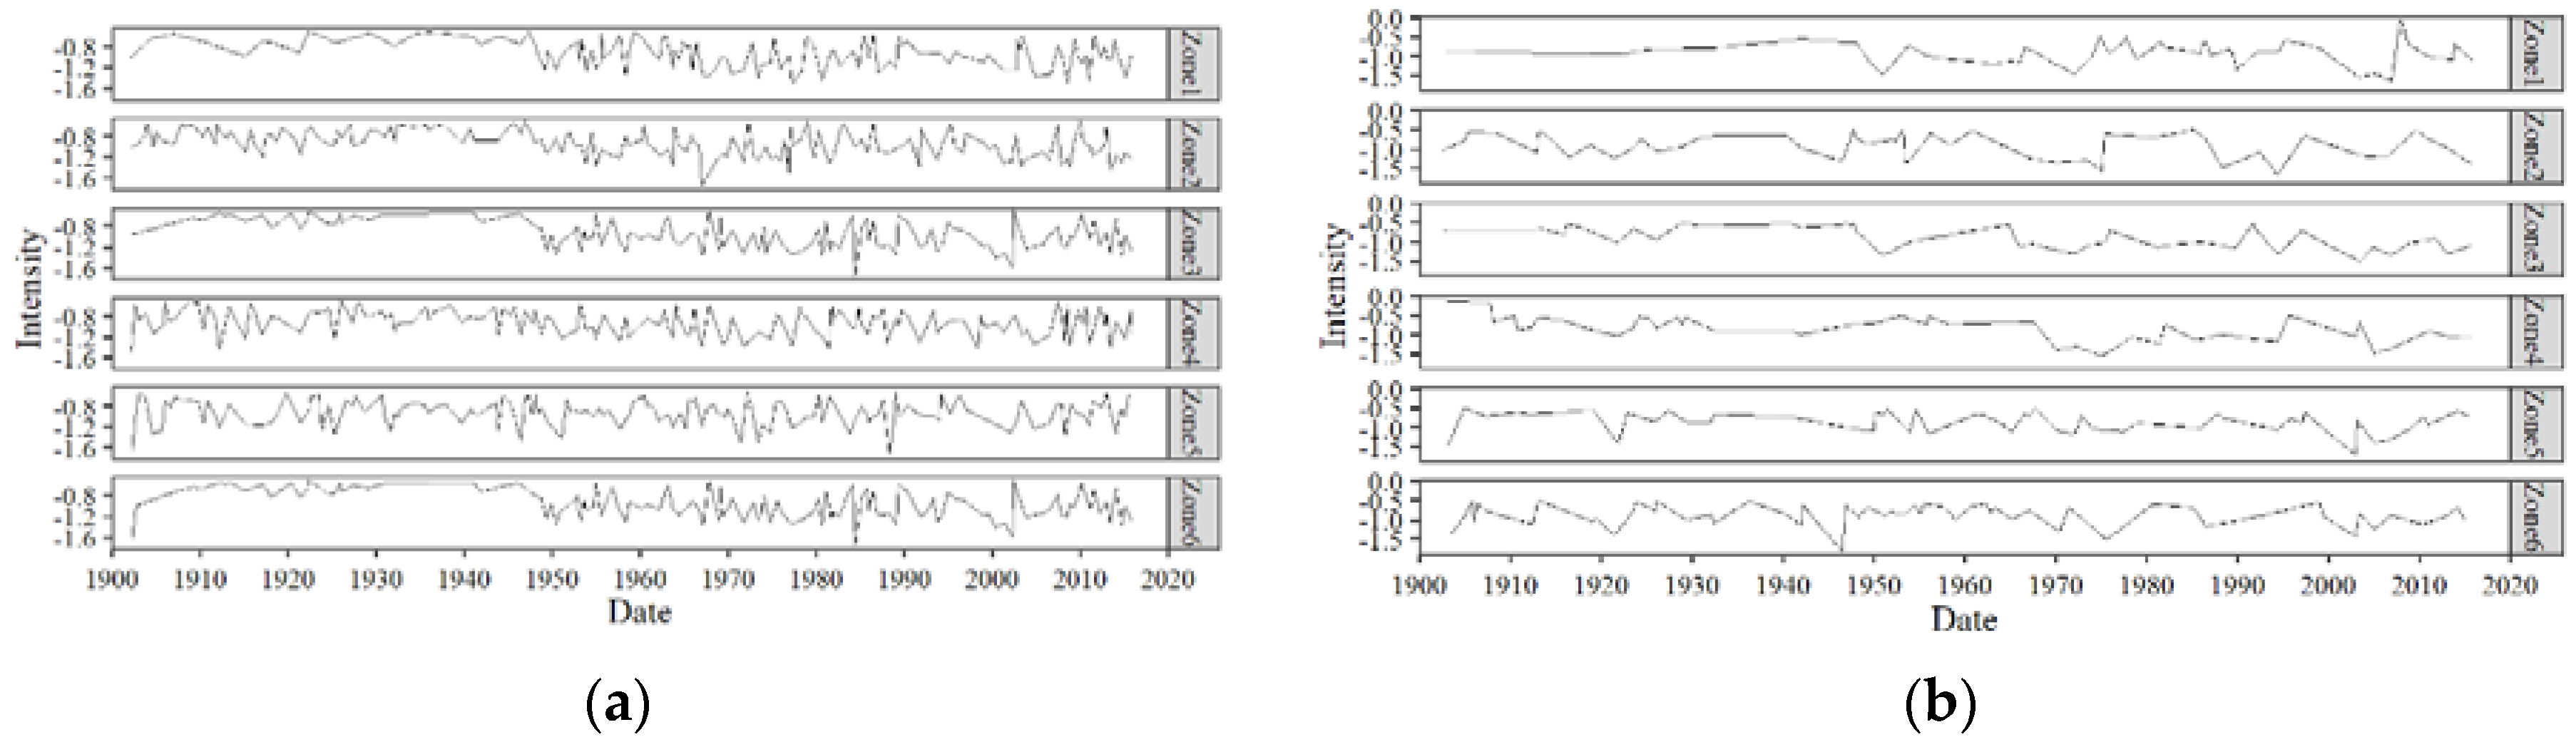
Having identified six spatially contiguous zones showing similar behavior of drought, SPEI time series were developed for each zone. Figure 5, Figure 6, Figure 7, Figure 8, Figure 9 and Figure 10 display the 3-month and 12-month SPEI time series for individual zones for the period of 1902–2015. The 3-month SPEI provides us with a seasonal picture of drought, reflecting short duration meteorological droughts, whereas the 12-month SPEI sheds light on long-duration, persistent hydrological droughts in the region. The blue bars represent the positive values of SPEI, whereas, the negative values of SPEI is shown by the red bars. The least-squares regression line has also been plotted, and it is worth noting that it has a negative slope for all the zones. This suggests that the average SPEI has decreased over the study period. The distinction between wet and dry periods is much more distinct in the 12-month SPEI time series as compared with the 3-month time series.
3.3. Drought Characterization
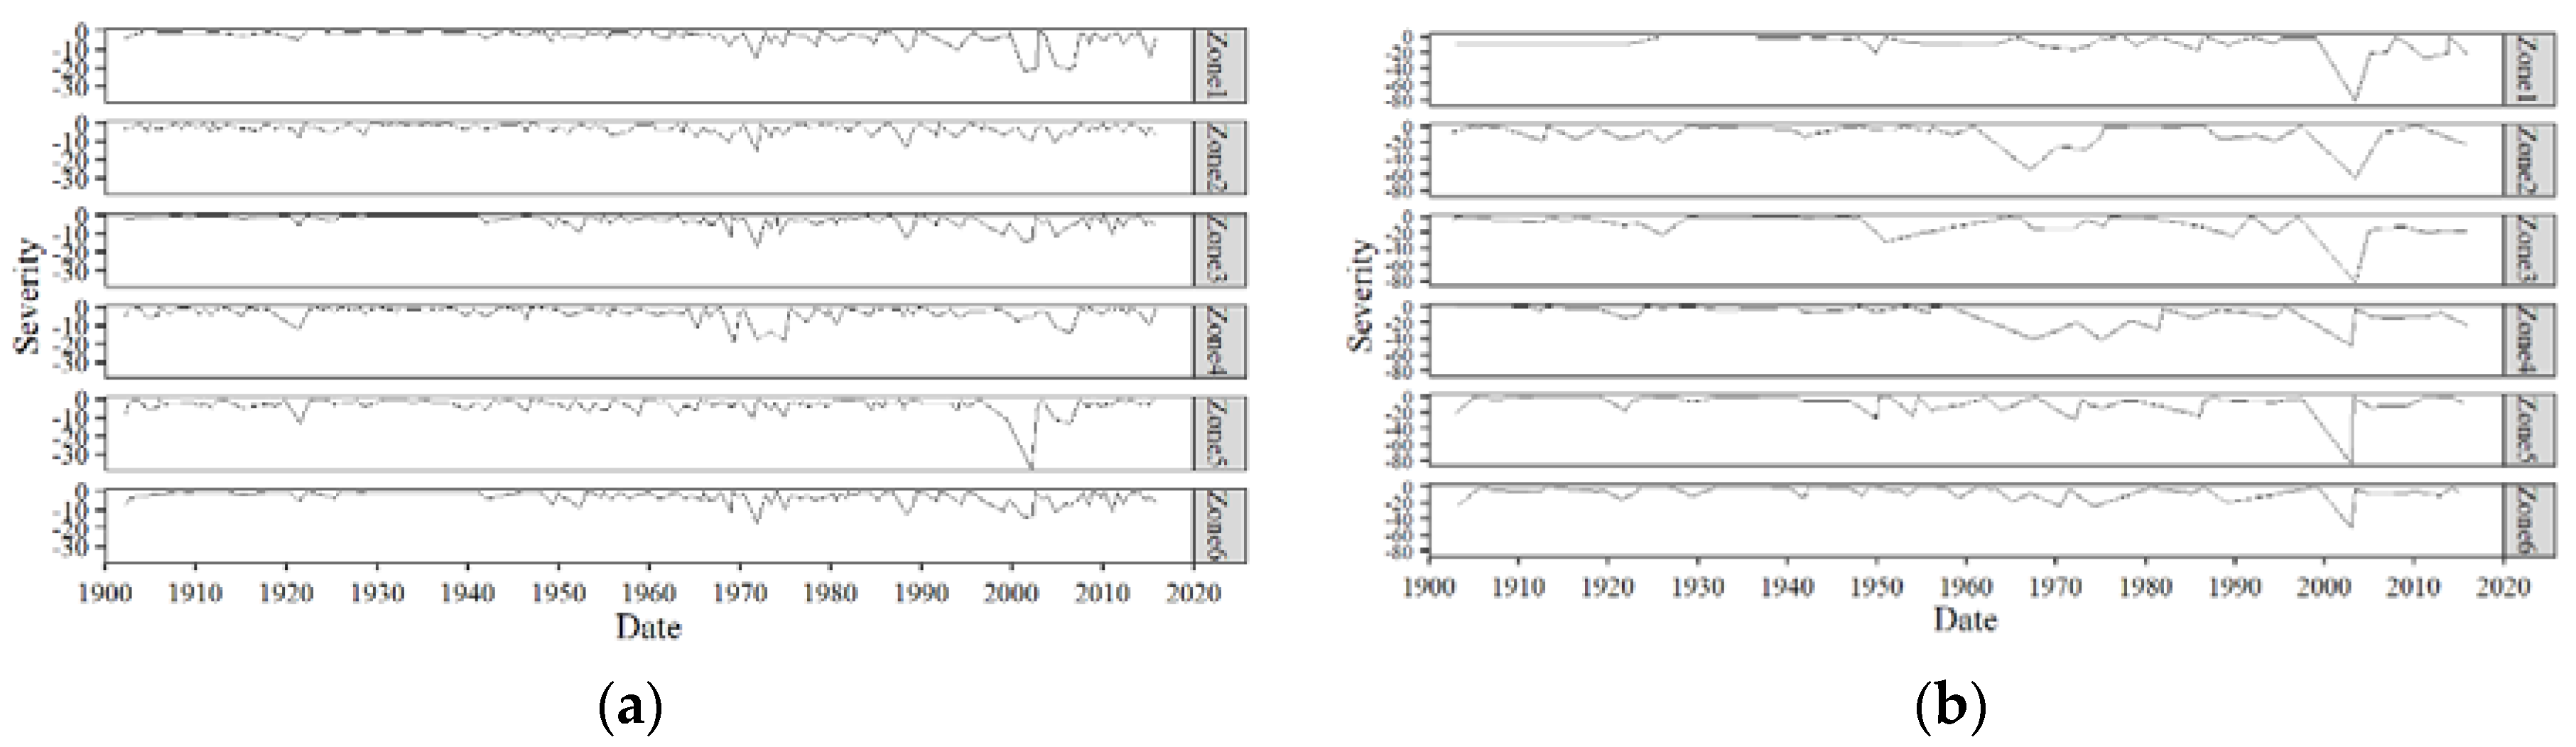
Run theory was applied to each zone’s SPEI time series with a threshold of −0.5. Then, drought events identified were characterized into duration, severity, intensity, and peak. The drought durations, severities, intensities, and peaks at 3 and 12-month SPEI time scales for each zone can be visualized in Figure 11, Figure 12, Figure 13 and Figure 14. The plots indicate drought termination times. A first look at Figure 11 reveals that all the zones have experienced droughts of variable durations throughout the study period. From Figure 11b, we can see that Zone 4 experienced the longest duration drought of all the zones, lasting 5 years. It started in July 1962 and ended in July 1967. This drought also affected Zone 2 for about 45 months. However, the most severe (Figure 12) drought in Balochistan’s history occurred in Zone 5 in the 2000s.
Another event that stands out is the severe (Figure 12) drought occurring in all the zones roughly from 1998 to 2002 [48,49]. Both of these droughts have been reported extensively in the literature [50]. The drought occurring in 1998–2002 was experienced across vast areas of South Asia, including Western India and most of Pakistan. This particular drought is believed to have been caused by an El Nino event that started developing in 1997 in the Pacific Ocean [25]. Figure 13 and Figure 14 show the intensities and peaks of all the drought events that occurred in each zone. Although the duration and severity graphs seem to be showing similar patterns, the same is not true for the intensities and peaks of the droughts. Therefore, the longest or most severe drought does not necessarily mean the drought with the most intensity or peak. The lowest (worst) peak SPEI occurred on January 2003 in Zone 5. This was also the most intense drought.
3.4. Drought Evolution
Table 1 and Table 2 display the results of the Mann–Kendall trend analysis applied to 3-month and 12-month SPEI time series, along with the drought characteristics. The p-value for the SPEI of all the zones is less than 0.05 with negative tau and Sen’s slope values. This suggests that the whole province of Balochistan is experiencing increasing dryness. Nevertheless, Zone 5 has experienced the most change in its 3-month SPEI time series, while Zone 1 encountered the same for its 12-month SPEI time series. This is evident when comparing the magnitude of Sen’s slope for each zone. Comparing Table 1 and Table 2, we note that there are nearly twice the characteristics having non-statistically significant trends in 12-month analysis when compared with the results of 3-month analysis. This is understandable in view of the 12-month SPEI reflecting accumulated conditions over a longer period than the 3-month SPEI, so the effective number of independent data in the time series is less.
Moreover, the duration is seen to be increasing with time in all the zones. However, the increase in duration is not statistically significant in Zones 2, 3, and 4 for 3-month SPEI and in Zones 1, 2, 4, and 5 for 12-month SPEI. Similarly, severity, intensity, and peak are also decreasing in all the zones, as indicated by the negative values of the respective Sen slopes. However, trends in none of these characteristics are statistically significant in Zone 3 for the 3-month SPEI and in Zones 1 and 2 for the 12-month SPEI. Additionally, duration and severity show no statistically significant trend in Zone 5, whereas intensity and peak show no statistically significant trend in Zone 6 for the 12-month SPEI. From 1902 to 2015, for the 12-month SPEI, Zone 4 saw the most change in duration, severity, and intensity, whereas, for the 12-month SPEI, Zone 1 witnessed the most change in severity and intensity, as opposed to Zone 5, which noted the most change in duration and peak.
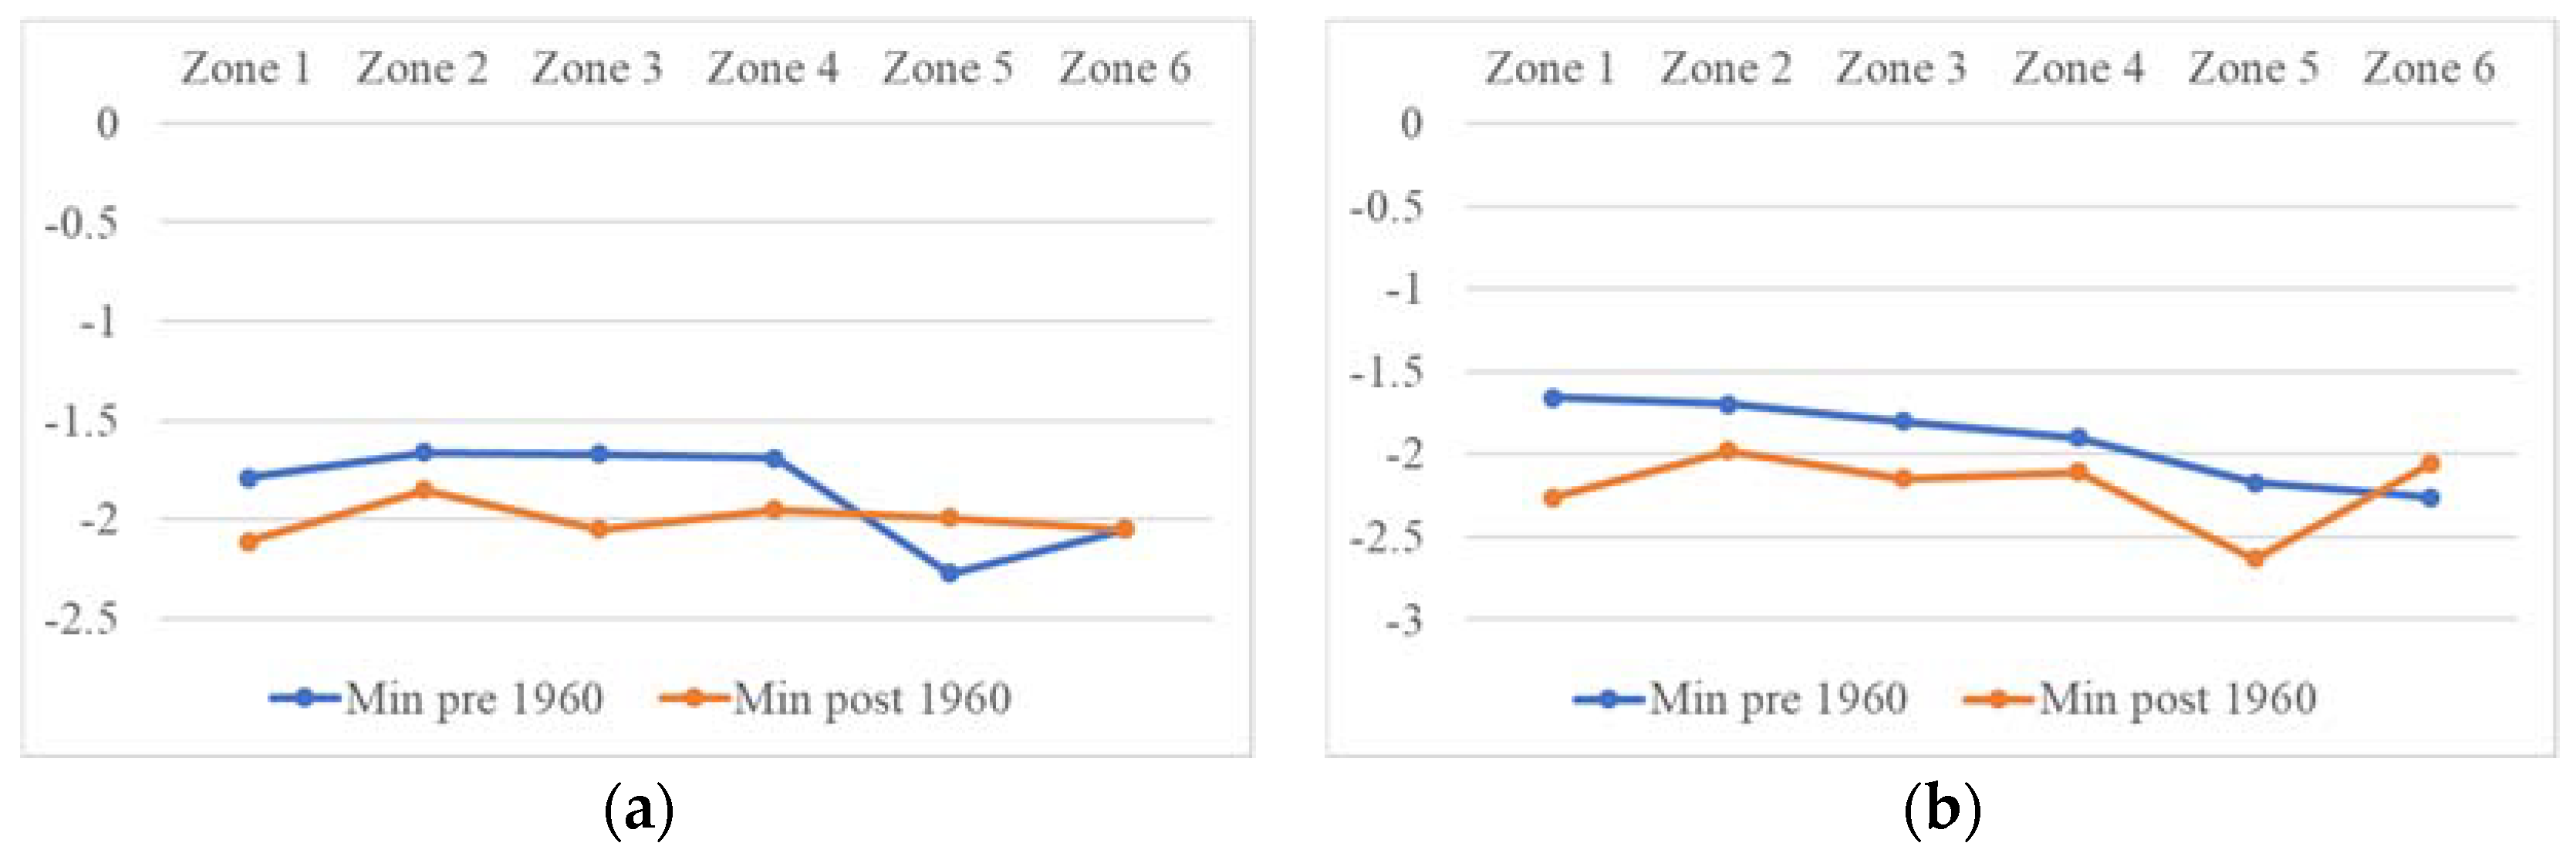
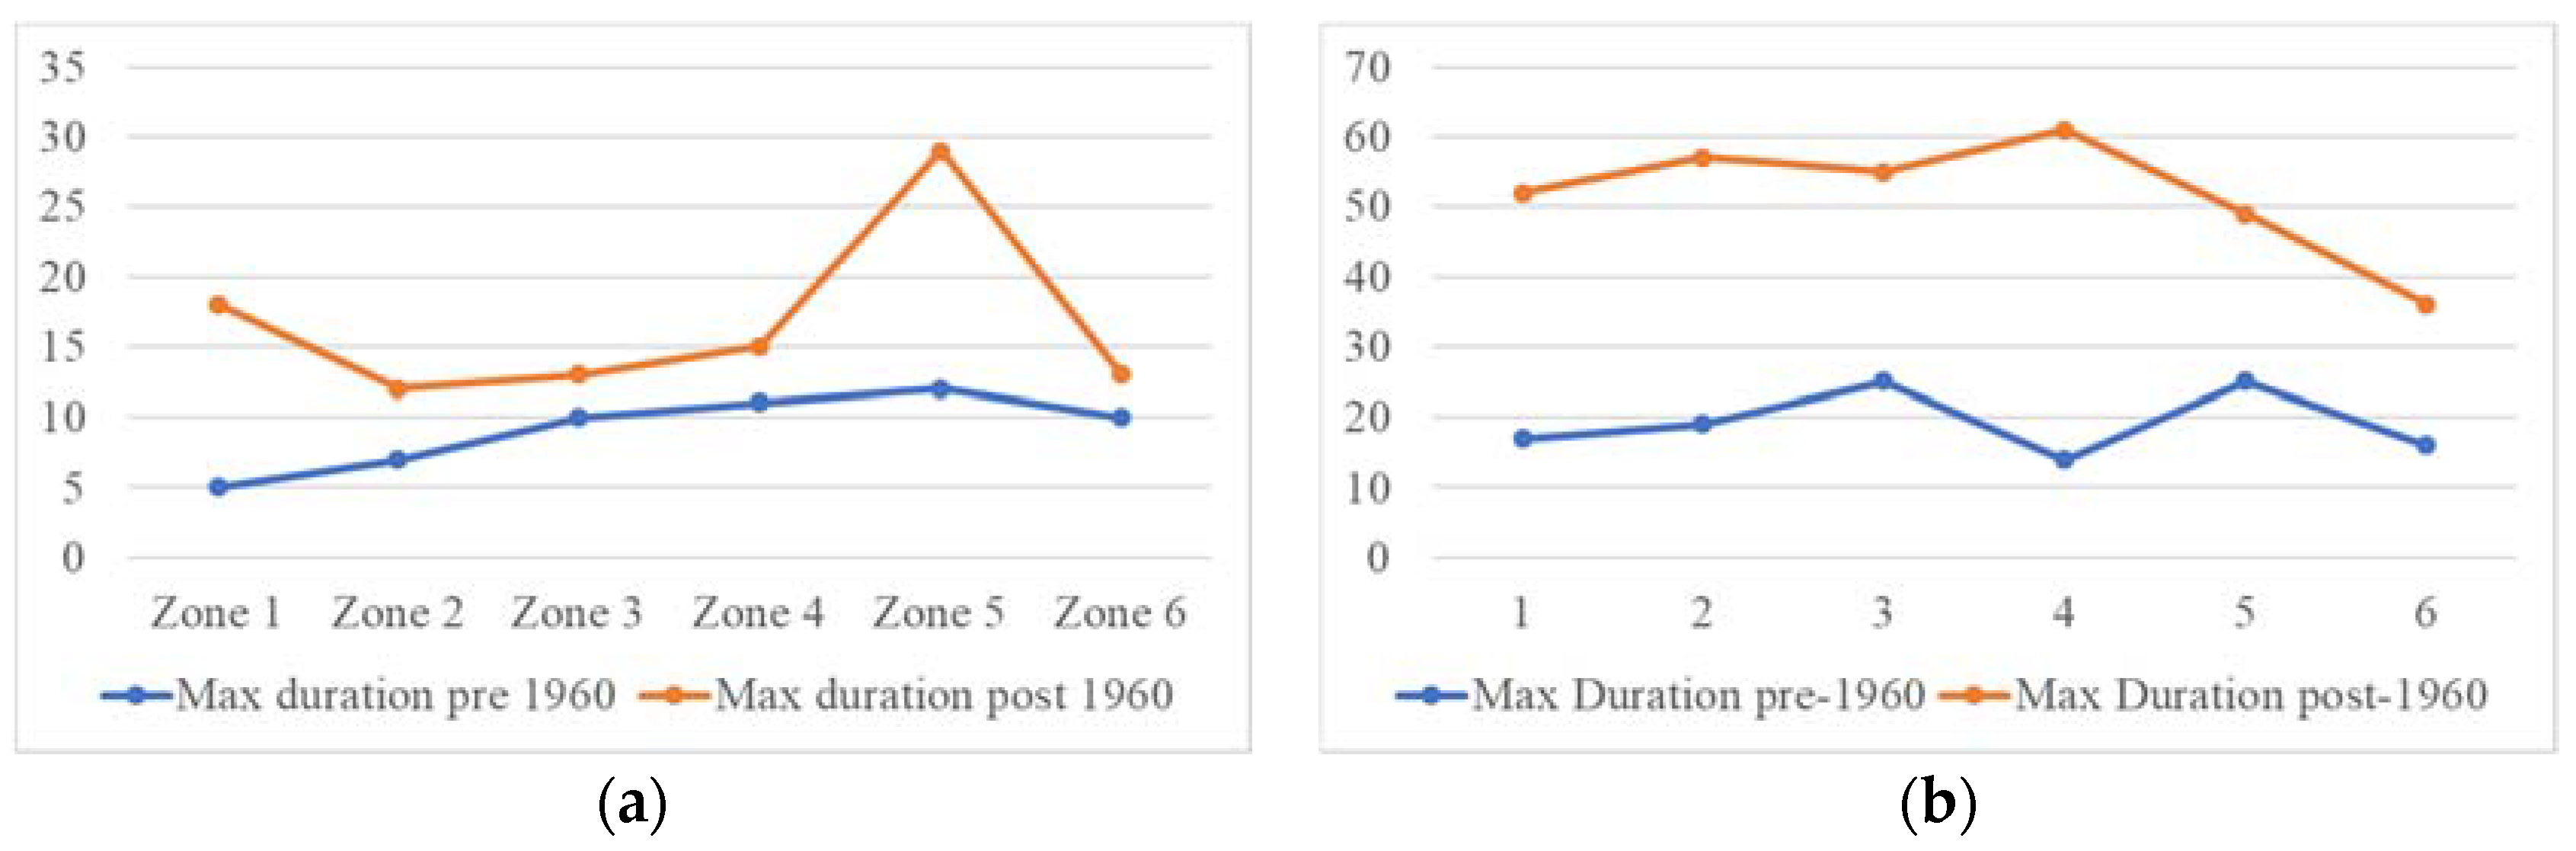
Following the trend analysis for the entire period, the time series were divided in the year 1960. Figure 15 displays the total drought count, pre-1960 and post-1960 drought count for 3-month and 12-month SPEI. According to the 3-month SPEI, a larger number of droughts occurred after 1960 in all the zones (Figure 15a). The 12-month SPEI showed that the majority of the droughts occurred after 1960 in Zones 1, 3 and 5. Additionally, all the long duration droughts that occurred in Balochistan were experienced after the 1960s (Figure 16). The most severe droughts also occurred after the 1960s in all the zones (Figure 17). The 3-month SPEI indicated that apart from Zone 4, the most intense droughts occurred after 1960 (Figure 18a). According to the 12-month SPEI, the most intense droughts occurred after 1960 in all the zones, except for Zone 6. As for the droughts with the lowest peak SPEI, all the zones except for Zone 5 experienced them after 1960 (Figure 19). The results from this analysis support the hypothesis that global changes in climate are worsening droughts in the region of Balochistan. The duration, severity, intensity, and peak are all aggravating.
4. Discussion
Based on the regionalization technique, six spatially contiguous zones were created in the province of Balochistan. A 24-month SPEI time series was used for regionalizing the study area. The zones produced not only reflect the climatology of the region, but the first four zones are also similar to the divisional boundaries of Balochistan.
The results of this study are consistent with the existing literature. Ashraf and Routray [10] conducted a study in 2015 in which they assessed the spatio-temporal characteristics of droughts in Balochistan using SPI as an indicator for the period of 1975–2010. They concluded that negative trends in precipitation exist in more than 70% of the climatic stations at both annual and seasonal scale. The only anomaly that was observed was at Ziarat station, which lies in Zone 5 in this study and showed a statistically significant positive trend in spring. Furthermore, Adnan [14] concluded, based on climatic data from 1951 to 2015, that the annual evapotranspiration and maximum temperature in Balochistan showed a statistically significant positive increasing trend at a confidence interval of 95%. Coupled with other detrimental effects, the trend toward dryness may eventually lead to the desertification of the entire region [35].
Furthermore, the findings of this study also complement the results of global research focusing on the effects of climate change on droughts. Li et al. [51] reported a dramatic increase in drought-affected areas in South Asia in the late 1990s and early 2000s. As identified in this study, the drought of 1998–2002 was among the worst that the entire region of Balochistan faced. It occurred due to an El Nino that started to develop in 1997 in the Pacific Ocean. They also concluded that the Drought Risk Index (DRI), defined by combining the effects of drought severity, frequency, crop yield, and extent of irrigation, in South Asia is expected to increase by up to 97.6% by the year 2050.
5. Conclusions
This study furthers the research carried out by Jamro et al. [26] by analyzing the evolution of drought characteristics in Balochistan from 1902 to 2015 using SPEI, based on the gridded dataset provided by CRU, as an indicator of drought. The SKATER algorithm was first applied to the study area to regionalize it into six spatially contiguous zones. The resulting zones reflect the climatology of the region. Run theory was applied to 3-month and 12-month SPEI time series to identify and characterize droughts in terms of duration, severity, intensity, and peak. Moreover, the Mann–Kendall test was carried out to identify any statistically significant trends in the SPEI time series, as well as in the drought characteristics. Additionally, the study area was divided into two periods, pre-1960 and post-1960. Then, descriptive statistics were calculated for each zone. This was done to segregate the effects of climate change, which are believed to have accelerated in the 1960s.
The main conclusions from this study are the following. SKATER is a useful technique to regionalize droughts, as it takes into account the spatial contiguity of the dataset. Additionally, all of the zones in Balochistan show a trend toward decreasing SPEI (increasing dryness). This may indicate intensified droughts in the future, and worsening aridity and desertification. Zone 5 experienced the most change in 3-month and 12-month SPEI from 1902 to 2015. In general, all of the drought characteristics seem to be worsening with time in all of the zones, although not all the changes are statistically significant. The worst droughts that affected the whole of Balochistan occurred in the mid-1960s and around 2000. Zone 4 witnessed the longest duration drought of all the zones, which lasted for almost 5 years in the mid-1960s.
This study has limitations, including using only a single type of drought indicator: SPEI. To understand drought in a holistic manner, it is pertinent to employ an interdisciplinary approach. The effects on the ecosystem and society need to be taken into account to come up with effective policies. A social aspect of this research would have greatly validated the results of this study. This direction will be our future course of action.
Author Contributions
All authors have read and agree to the published version of the manuscript. Conceptualization and methodology, S.J., F.N.C., G.H.D., K.A. and N.Y.K.; software and visualization, S.J. and F.N.C.; formal analysis, S.J., and F.N.C.; writing—original draft preparation, S.J.; writing—review and editing, S.J., F.N.C., G.H.D., K.A. and N.Y.K.
Funding
N.Y.K. was supported by the United States Agency for International Development through the U.S.–Pakistan Center for Advanced Studies in Water (USPCAS-W) and by the National Oceanic and Atmospheric Administration Educational Partnership Program with Minority-Serving Institutions—Cooperative Science Center for Earth System Sciences and Remote Sensing Technologies under the Cooperative Agreement Grant No. NA16SEC4810008. In addition, the authors would like to acknowledge the financial support for this study from the USPCAS-W, Mehran University of Engineering and Technology, Jamshoro, Pakistan established with the grant of United States Agency for International Development (USAID). The contents are the sole responsibility of the authors and do not necessarily reflect the views of USPCAS-W, USAID, or the Governments of the United States or Pakistan.
Conflicts of Interest
The authors declare no conflict of interest.
References
- Panagoulia, D.G.; Dimou, G. Definitions and effects of droughts. Div. Water Resour. 1998, 7, 2–5. [Google Scholar]
- Dars, G.H.; Najafi, M.R.; Qureshi, A.L. Assessing the Impacts of Climate Change on Future Precipitation Trends Based on Downscaled CMIP5 Simulations Data. Mehran Univ. Res. J. Eng. Technol. 2017, 36, 385–394. [Google Scholar] [CrossRef] [Green Version]
- Mishra, A.K.; Singh, V.P. A review of drought concepts. J. Hydrol. 2010, 391, 202–216. [Google Scholar] [CrossRef]
- Edossa, D.C.; Woyessa, Y.E.; Welderufael, W.A. Spatiotemporal analysis of droughts using self-calibrating Palmer’s Drought Severity Index in the central region of South Africa. Theor. Appl. Clim. 2016, 126, 643–657. [Google Scholar] [CrossRef]
- Palmer, W.C. Meteorological Drought; US Department of Commerce; Weather Bureau: Melbourne, Australia, 1965; p. 58.
- Byun, H.R.; Wilhite, D.A. Objective quantification of drought severity and duration. J. Clim. 1999, 12, 2747–2756. [Google Scholar] [CrossRef]
- Thomas, M.B.; Nolan, D.J.; John, K. The Relationship of Drought Frequency and Duration to Time Scales. In Proceedings of the 8th Conference on Applied Climatology, Anaheim, CA, USA, 17–22 January 1993; Volume 17, pp. 179–183. [Google Scholar]
- Gocic, M.; Trajkovic, S. Spatiotemporal characteristics of drought in Serbia. J. Hydrol. 2014, 510, 110–123. [Google Scholar] [CrossRef]
- Dabanlı, İ.; Mishra, A.K.; Şen, Z. Long-term spatio-temporal drought variability in Turkey. J. Hydrol. 2017, 552, 779–792. [Google Scholar] [CrossRef]
- Ashraf, M.; Routray, J.K. Spatio-temporal characteristics of precipitation and drought in Balochistan Province, Pakistan. Nat. Hazards 2015, 77, 229–254. [Google Scholar] [CrossRef]
- Haroon, M.A.; Zhang, J.; Yao, F. Drought monitoring and performance evaluation of MODIS-based drought severity index (DSI) over Pakistan. Nat. Hazards 2016, 84, 1349–1366. [Google Scholar] [CrossRef]
- Xie, H.; Ringler, C.; Zhu, T.; Waqas, A. Droughts in Pakistan: A spatiotemporal variability analysis using the Standardized Precipitation Index. Water Food Secur. Chall. Pak. 2016, 38, 116–127. [Google Scholar] [CrossRef]
- Vicente-Serrano, S.M.; Beguería, S.; López-Moreno, J.I. A multiscalar drought index sensitive to global warming: The standardized precipitation evapotranspiration index. J. Clim. 2010, 23, 1696–1718. [Google Scholar] [CrossRef] [Green Version]
- Adnan, S. Spatio-Temporal Distribution of Drought and its Characteristics over Pakistan. Ph.D. Thesis, Commission on Science and Technology for Sustainable Development in the South University, Islamabad, Pakistan, 2016. [Google Scholar]
- Guo, H.; Bao, A.; Liu, T.; Jiapaer, G.; Ndayisaba, F.; Jiang, L.; Kurban, A.; De Maeyer, P. Spatial and temporal characteristics of droughts in Central Asia during 1966–2015. Sci. Total Environ. 2018, 624, 1523–1538. [Google Scholar] [CrossRef] [PubMed]
- Krakauer, N.Y.; Lakhankar, T. Trends in Drought over the Northeast United States. Water 2019, 11, 1834. [Google Scholar] [CrossRef] [Green Version]
- Potop, V.; Boronean, C. Observed evolution of drought episodes assessed with the Standardized Precipitation Evapotranspiration Index (SPEI) over the Czech Republic. EGU Gen. Assem. 2012, 14, 10010. [Google Scholar]
- Liu, X.; Wang, S.; Zhou, Y.; Wang, F.; Li, W.; Liu, W. Regionalization and Spatiotemporal Variation of Drought in China Based on Standardized Precipitation Evapotranspiration Index (1961-2013). Adv. Meteorol. 2015, 2015, 18. [Google Scholar] [CrossRef] [Green Version]
- Tan, C.; Yang, J.; Li, M. Temporal-spatial variation of drought indicated by SPI and SPEI in Ningxia Hui Autonomous Region, China. Atmosphere 2015, 6, 1399–1421. [Google Scholar] [CrossRef] [Green Version]
- Tian, L.; Quiring, S.M. Spatial and temporal patterns of drought in Oklahoma (1901–2014). Int. J. Climatol. 2019, 39, 3365–3378. [Google Scholar] [CrossRef]
- Dayal, K.S.; Deo, R.C.; Apan, A.A. Investigating drought duration-severity-intensity characteristics using the standardized precipitation-evapotranspiration index: Case studies in drought-prone southeast Queensland. J. Hydrol. Eng. 2018, 23, 1–16. [Google Scholar] [CrossRef]
- Deo, R.C.; Salcedo-Sanz, S.; Carro-Calvo, L.; Saavedra-Moreno, B. Drought Prediction with Standardized Precipitation and Evapotranspiration Index and Support Vector Regression Models; Elsevier: Amsterdam, The Netherlands, 2018; ISBN 9780128120576. [Google Scholar]
- Khan, M.I.; Liu, D.; Fu, Q.; Faiz, M.A. Detecting the persistence of drying trends under changing climate conditions using four meteorological drought indices. Meteorol. Appl. 2018, 25, 184–194. [Google Scholar] [CrossRef]
- Eckstein, D.; Künzel, V.; Schäfer, L.; Winges, M. Global Climate Risk Index 2020. Bonn Ger. 2019, 9. [Google Scholar]
- Sheikh, M.M. Drought management and prevention in Pakistan. Sci. Vis. 2001, 7, 117–131. [Google Scholar]
- Jamro, S.; Dars, G.H.; Ansari, K.; Krakauer, N.Y. Spatio-temporal variability of drought in Pakistan using standardized precipitation evapotranspiration index. Appl. Sci. 2019, 9, 4588. [Google Scholar] [CrossRef] [Green Version]
- McKee, T.B.; Doesken, N.J.; Kleist, J. Drought Monitoring with Multiple Time Scales; American Meteorological Society: Dallas, TX, USA, 1995; pp. 233–236. [Google Scholar]
- Andujar, E.; Krakauer, N.Y.; Yi, C.; Kogan, F. Ecosystem Drought Response Timescales from Thermal Emission versus Shortwave Remote Sensing. Adv. Meteorol. 2017, 2017, 10. [Google Scholar] [CrossRef] [Green Version]
- Hameed, M.; Ahmadalipour, A.; Moradkhani, H. Apprehensive drought characteristics over Iraq: Results of a multidecadal spatiotemporal assessment. Geosciences 2018, 8, 58. [Google Scholar] [CrossRef] [Green Version]
- Beguería, S.; Vicente-Serrano, S.M.; Reig, F.; Latorre, B. Standardized precipitation evapotranspiration index (SPEI) revisited: Parameter fitting, evapotranspiration models, tools, datasets and drought monitoring. Int. J. Climatol. 2014, 34, 3001–3023. [Google Scholar] [CrossRef] [Green Version]
- Guttman, N.B. Accepting the standardized precipitation index: A calculation algorithm. J. Am. Water Resour. Assoc. 1999, 35, 311–322. [Google Scholar] [CrossRef]
- Beguería, S.; Latorre, B.; Reig, F.; Vicente-Serrano, S.M. sbegueria/SPEIbase: Version 2.5.1. Glob. SPEI Database 2017. [Google Scholar]
- Harris, I.; Jones, P.D.; Osborn, T.J.; Lister, D.H. Updated high-resolution grids of monthly climatic observations—the CRU TS3.10 Dataset. Int. J. Climatol. 2014, 34, 623–642. [Google Scholar] [CrossRef] [Green Version]
- The World Bank. Pakistan—Balochistan Economic Report: From Periphery to Core (Vol. 2): Full Report; The World Bank: Washington, WA, USA, 2008; Volume II. [Google Scholar]
- BUITEMS. UNDP Drought Risk Assessment in the Province of Balochistan; BUITEMS: Quetta, Pakistan, 2015; p. 87. [Google Scholar]
- Zaman, Q.U.; Rasul, G. Agro-Climatic Classification of Pakistan. Q. Sci. Vis. 2004, 9, 59–66. [Google Scholar]
- About Balochistan—Government of Balochistan. Available online: www.balochistan.gov.pk/index.php?option=com_content&view=article&id=37&Itemid=783 (accessed on 20 December 2019).
- Assunção, R.M.; Neves, M.C.; Câmara, G.; Da Costa Freitas, C. Efficient regionalization techniques for socio-economic geographical units using minimum spanning trees. Int. J. Geogr. Inf. Sci. 2006, 20, 797–811. [Google Scholar] [CrossRef]
- Lage Palmieri, J.; Assunção, R.M.; Reis, E.A. A Minimal Spanning Tree Algorithm Applied to Spatial Cluster Analysis. Electron. Notes Discrete Math. 2001, 7, 162–165. [Google Scholar] [CrossRef]
- Jungnickel, D. Graphs, Networks and Algorithms; Springer: Berlin/Heidelberg, Germany, 1999. [Google Scholar]
- Yevjevich, V. An objective approach to definitions and investigations of continental hydrologic droughts. J. Hydrol. 1969, 7, 353. [Google Scholar]
- Kendall, M.G. Rank Correlation Methods; Griffin: Oxford, UK, 1948. [Google Scholar]
- Sen, P.K. Estimates of the Regression Coefficient Based on Kendall’s Tau. J. Am. Stat. Assoc. 1968, 63, 1379–1389. [Google Scholar] [CrossRef]
- da Silva, R.M.; Santos, C.A.G.; Moreira, M.; Corte-Real, J.; Silva, V.C.L.; Medeiros, I.C. Rainfall and river flow trends using Mann–Kendall and Sen’s slope estimator statistical tests in the Cobres River basin. Nat. Hazards 2015, 77, 1205–1221. [Google Scholar] [CrossRef]
- Joshi, N.; Gupta, D.; Suryavanshi, S.; Adamowski, J.; Madramootoo, C.A. Analysis of trends and dominant periodicities in drought variables in India: A wavelet transform based approach. Atmos. Res. 2016, 182, 200–220. [Google Scholar] [CrossRef]
- Pakistan Weather Portal History of Drought in Pakistan—In Detail. Available online: https://pakistanweatherportal.com/2011/05/08/history-of-drought-in-pakistan-in-detail/ (accessed on 19 September 2019).
- Durrani, Z.K. Lessons for Pakistan from Droughts in the Past. Available online: https://cscr.pk/explore/themes/energy-environment/lessons-pakistan-droughts-past/ (accessed on 20 July 2018).
- Centre, N.D.M. Drought Bulletin of Pakistan July-September 2019; Pakistan Meteorological Department: Islamabad, Pakistan, 2019.
- Baines, P.G.; Folland, C.K. Evidence for a rapid global climate shift across the late 1960s. J. Clim. 2007, 20, 2721–2744. [Google Scholar] [CrossRef] [Green Version]
- Lamb, H. Climate in the 1960’s Changes in the World’s Wind Circulation Reflected in Prevailing Temperatures, Rainfall Patterns and the Levels of the African Lakes. Geograohic. J. 1966, 132, 183–212. [Google Scholar] [CrossRef]
- Li, Y.; Ye, W.; Wang, M.; Yan, X. Climate change and drought: A risk assessment of crop-yield impacts. Clim. Res. 2009, 39, 31–46. [Google Scholar] [CrossRef]
Figure 1.
Elevation map of Balochistan.

Figure 2.
Classification of the Standardized Precipitation Evapotranspiration Index (SPEI).
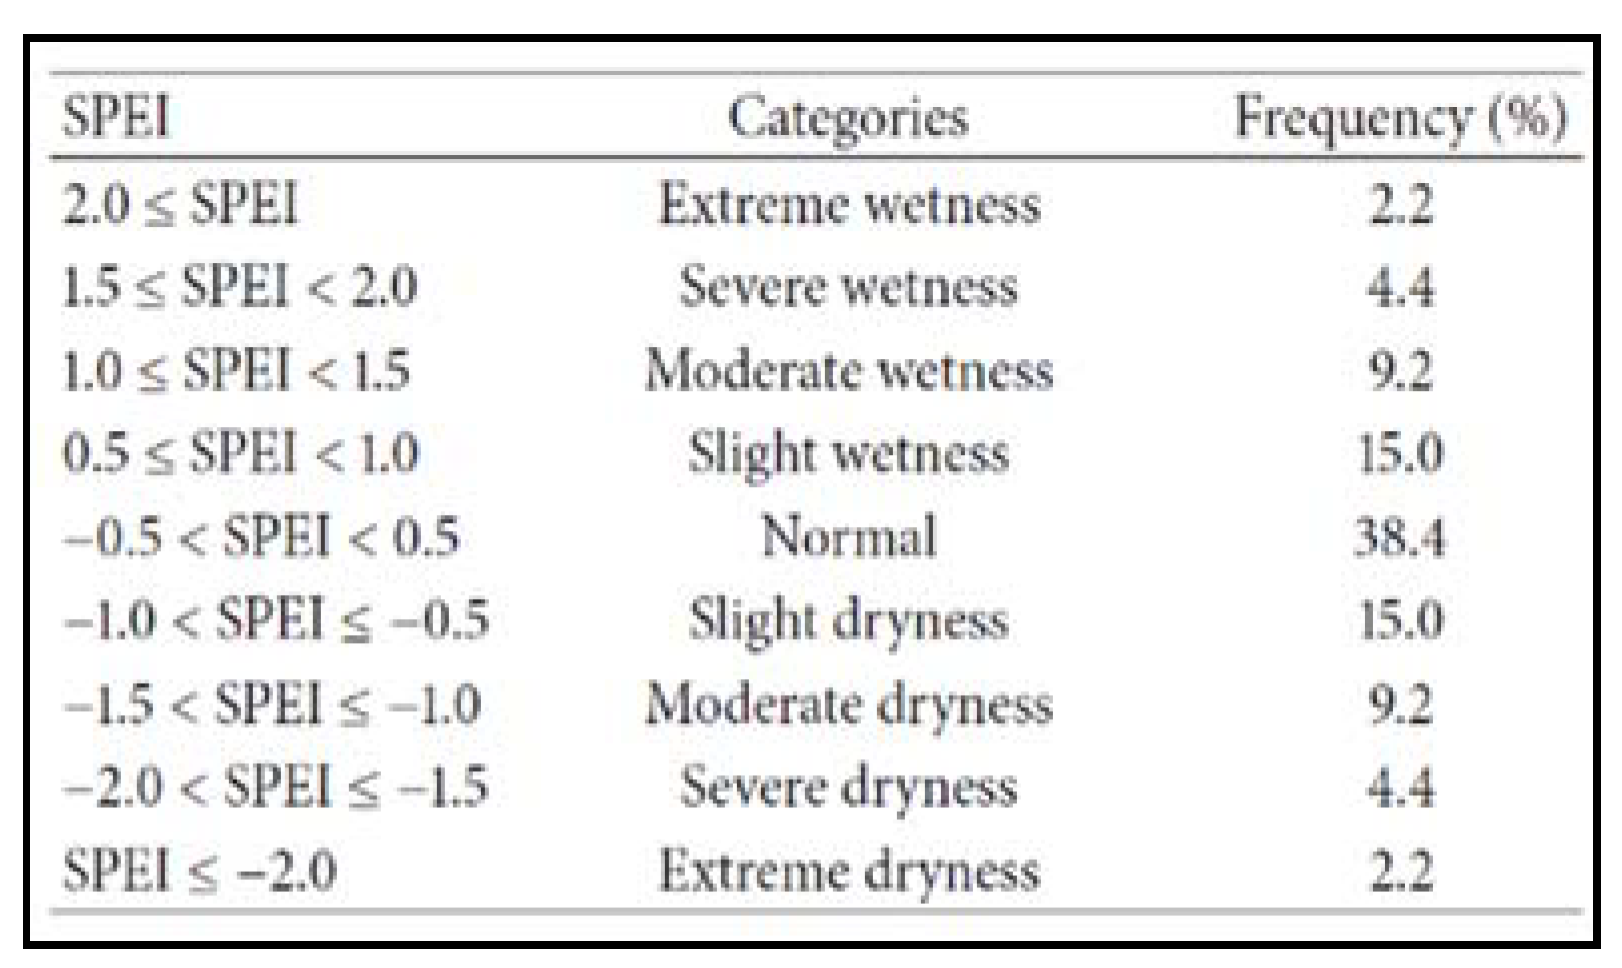
Figure 3.
Drought characteristics extracted by the run theory.

Figure 4.
Homogeneous zones produced after running Spatial “K”luster Analysis using Tree Edge Removal (SKATER).
Figure 4.
Homogeneous zones produced after running Spatial “K”luster Analysis using Tree Edge Removal (SKATER).

Figure 5.
(a) 3-month and (b) 12-month SPEI time series of Zone 1.

Figure 6.
(a) 3-month and (b) 12-month SPEI time series of Zone 2.

Figure 7.
(a) 3-month and (b) 12-month SPEI time series of Zone 3.
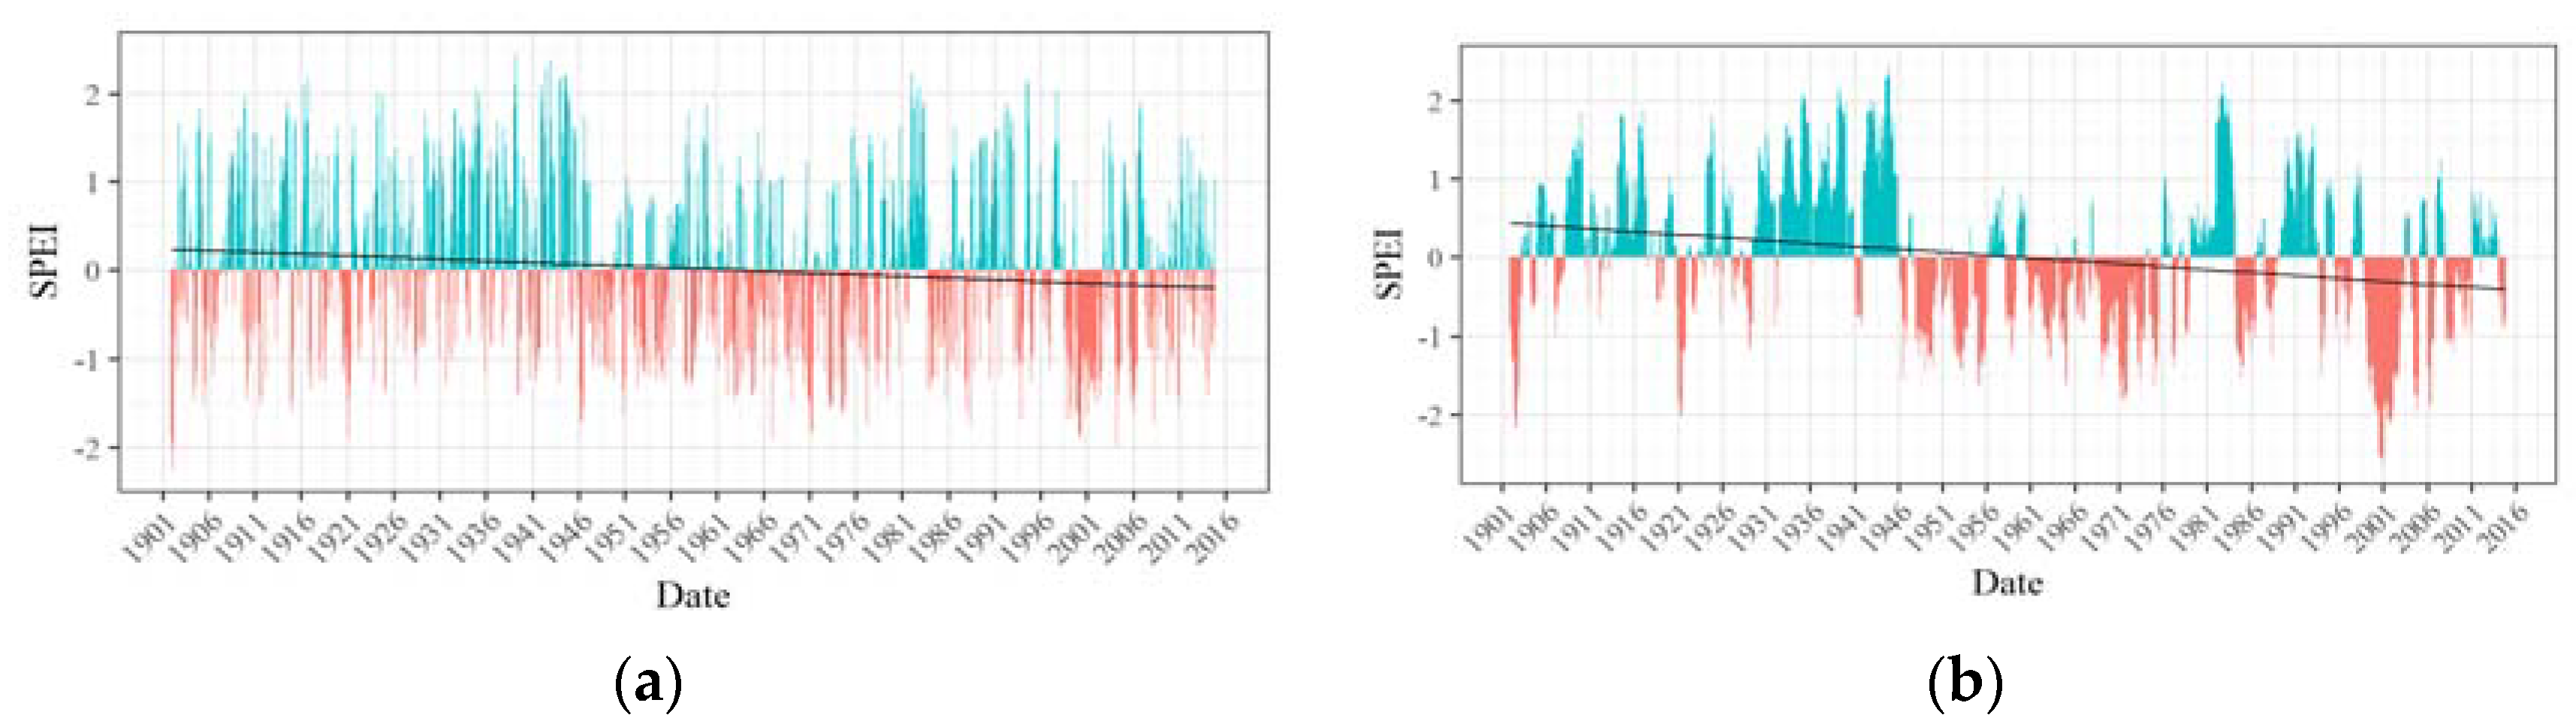
Figure 8.
(a) 3-month and (b) 12-month SPEI time series of Zone 4.

Figure 9.
(a) 3-month and (b) 12-month time series of Zone 5.

Figure 10.
(a) 3-month and (b) 12-month SPEI time series of Zone 6.
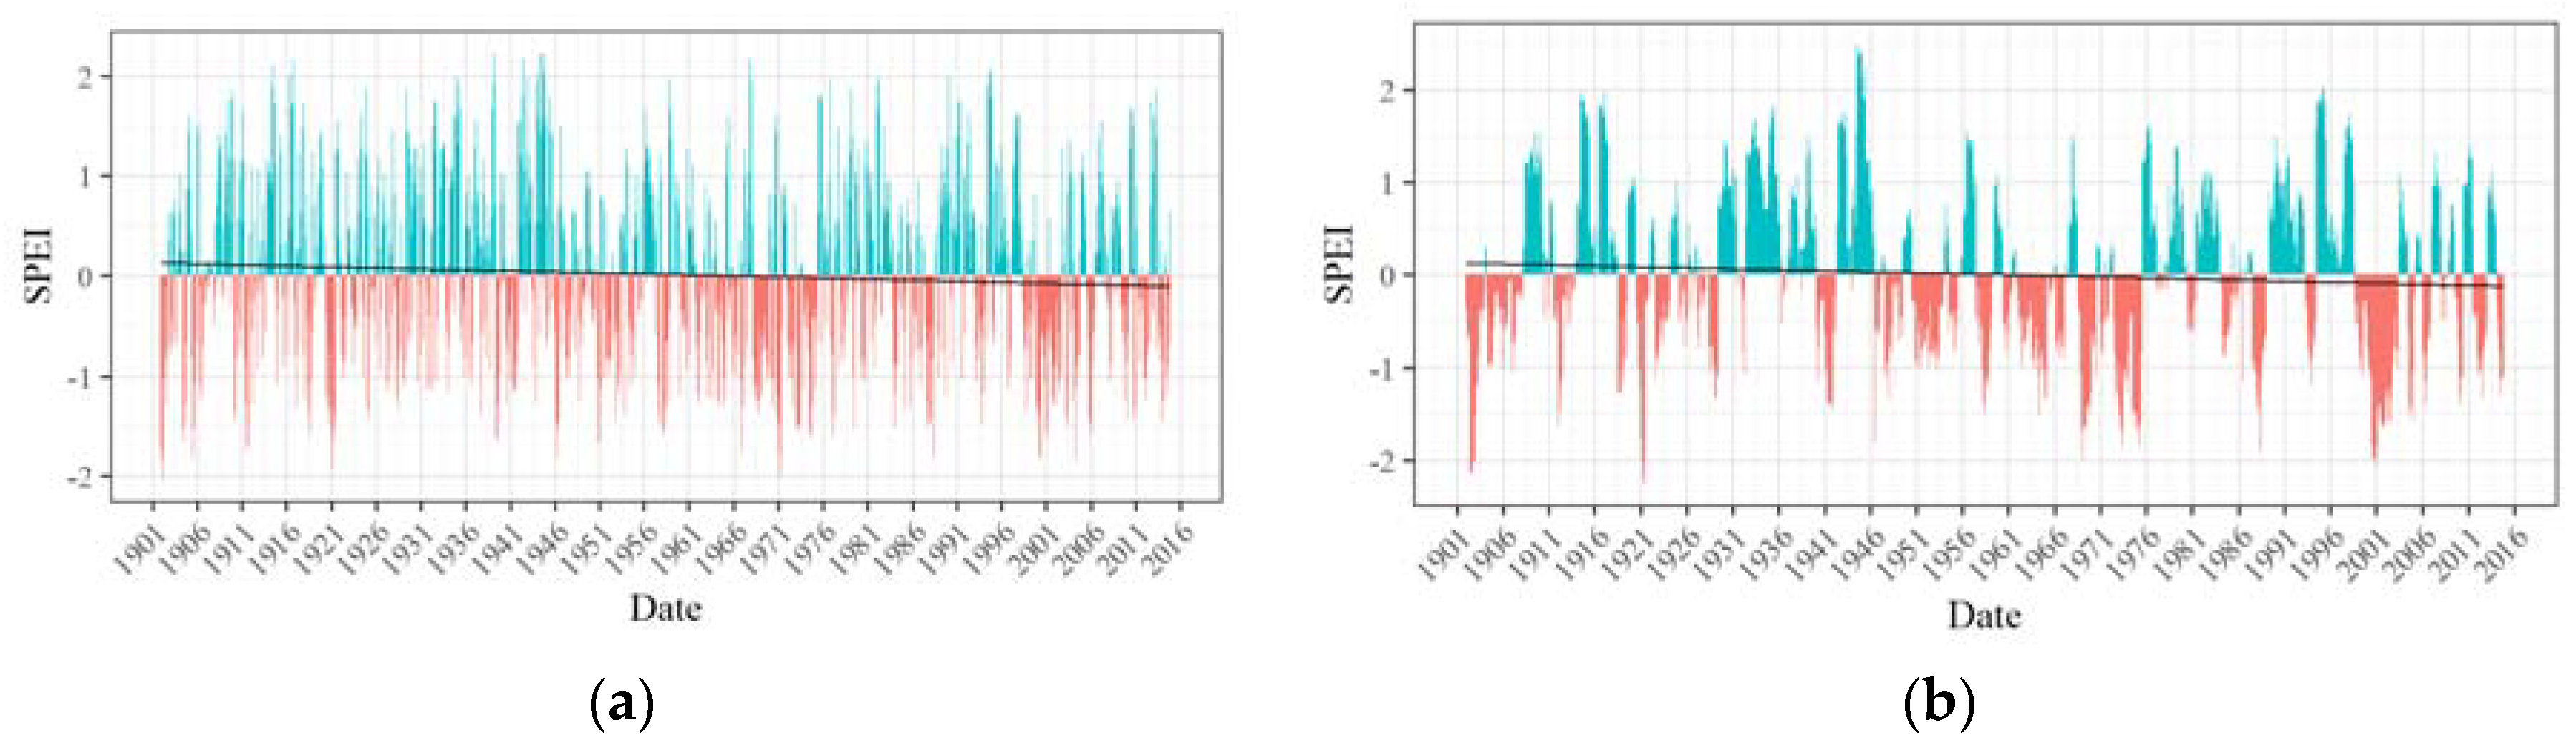
Figure 11.
(a) 3-month and (b) 12-month durations of droughts.
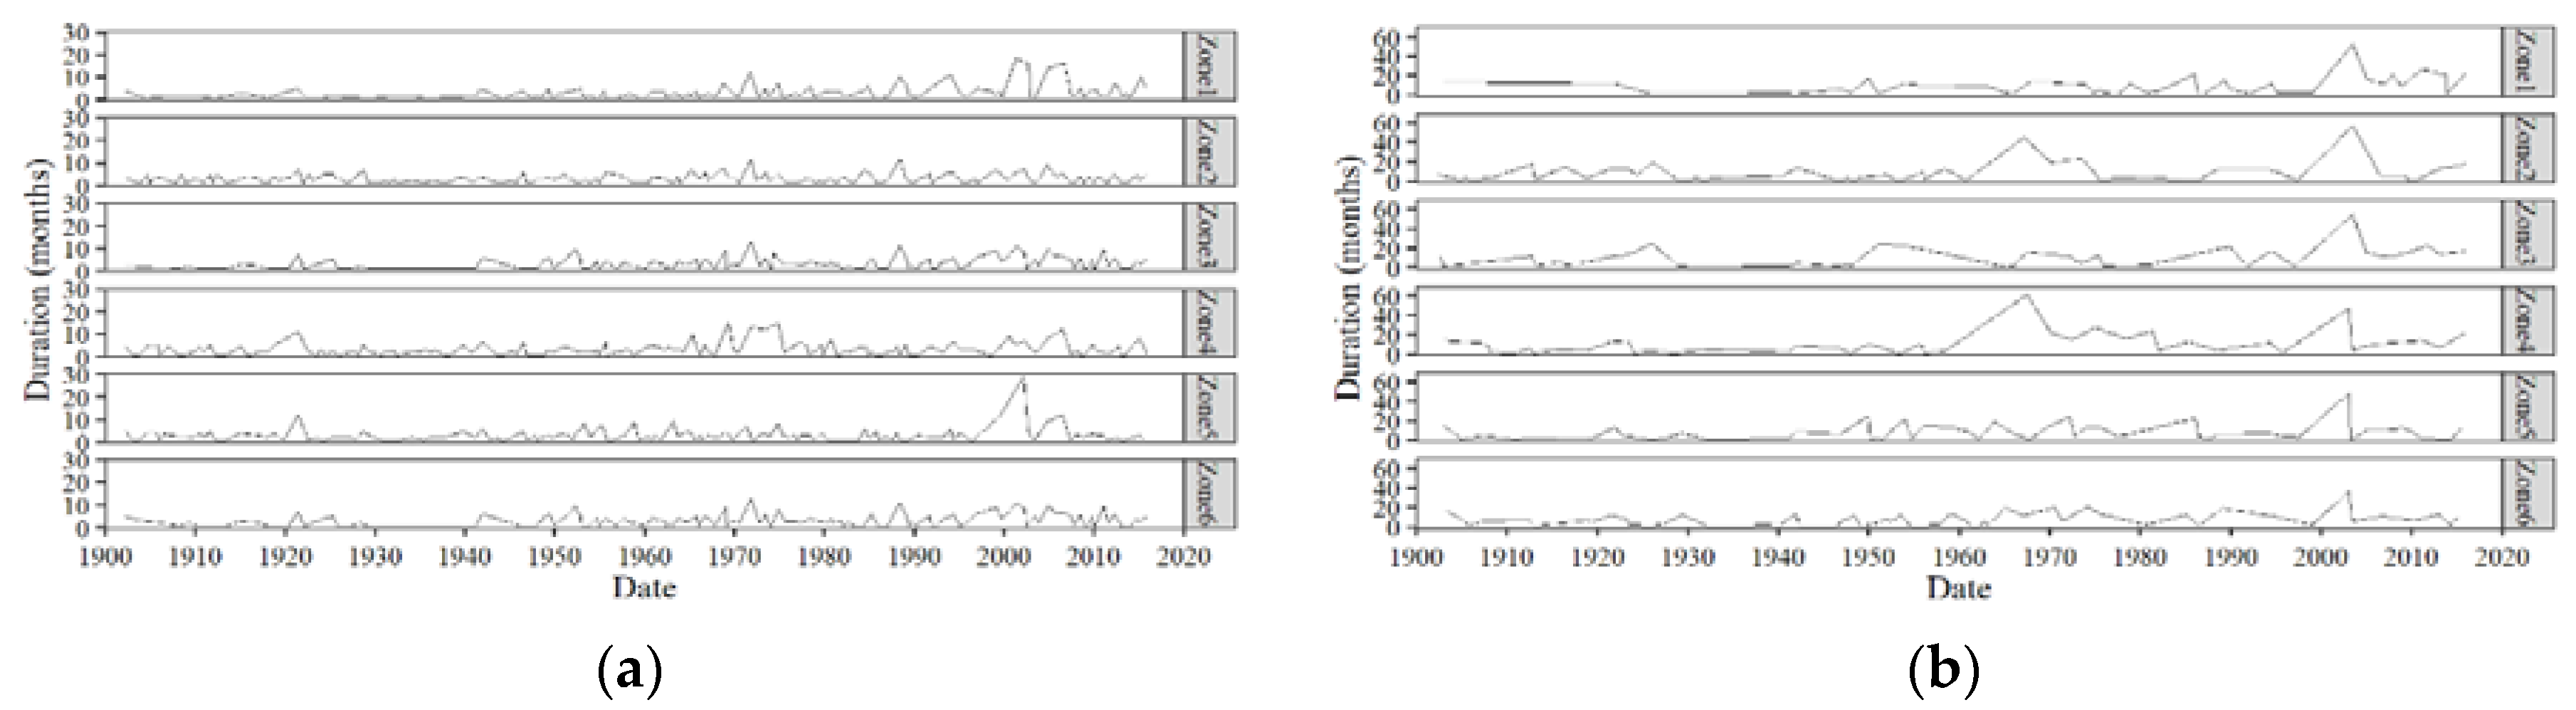
Figure 12.
(a) 3-month and (b) 12-month severity of droughts.

Figure 13.
(a) 3-month and (b) 12-month intensity of droughts.

Figure 14.
(a) 3-month and (b) 12-month peak of droughts.
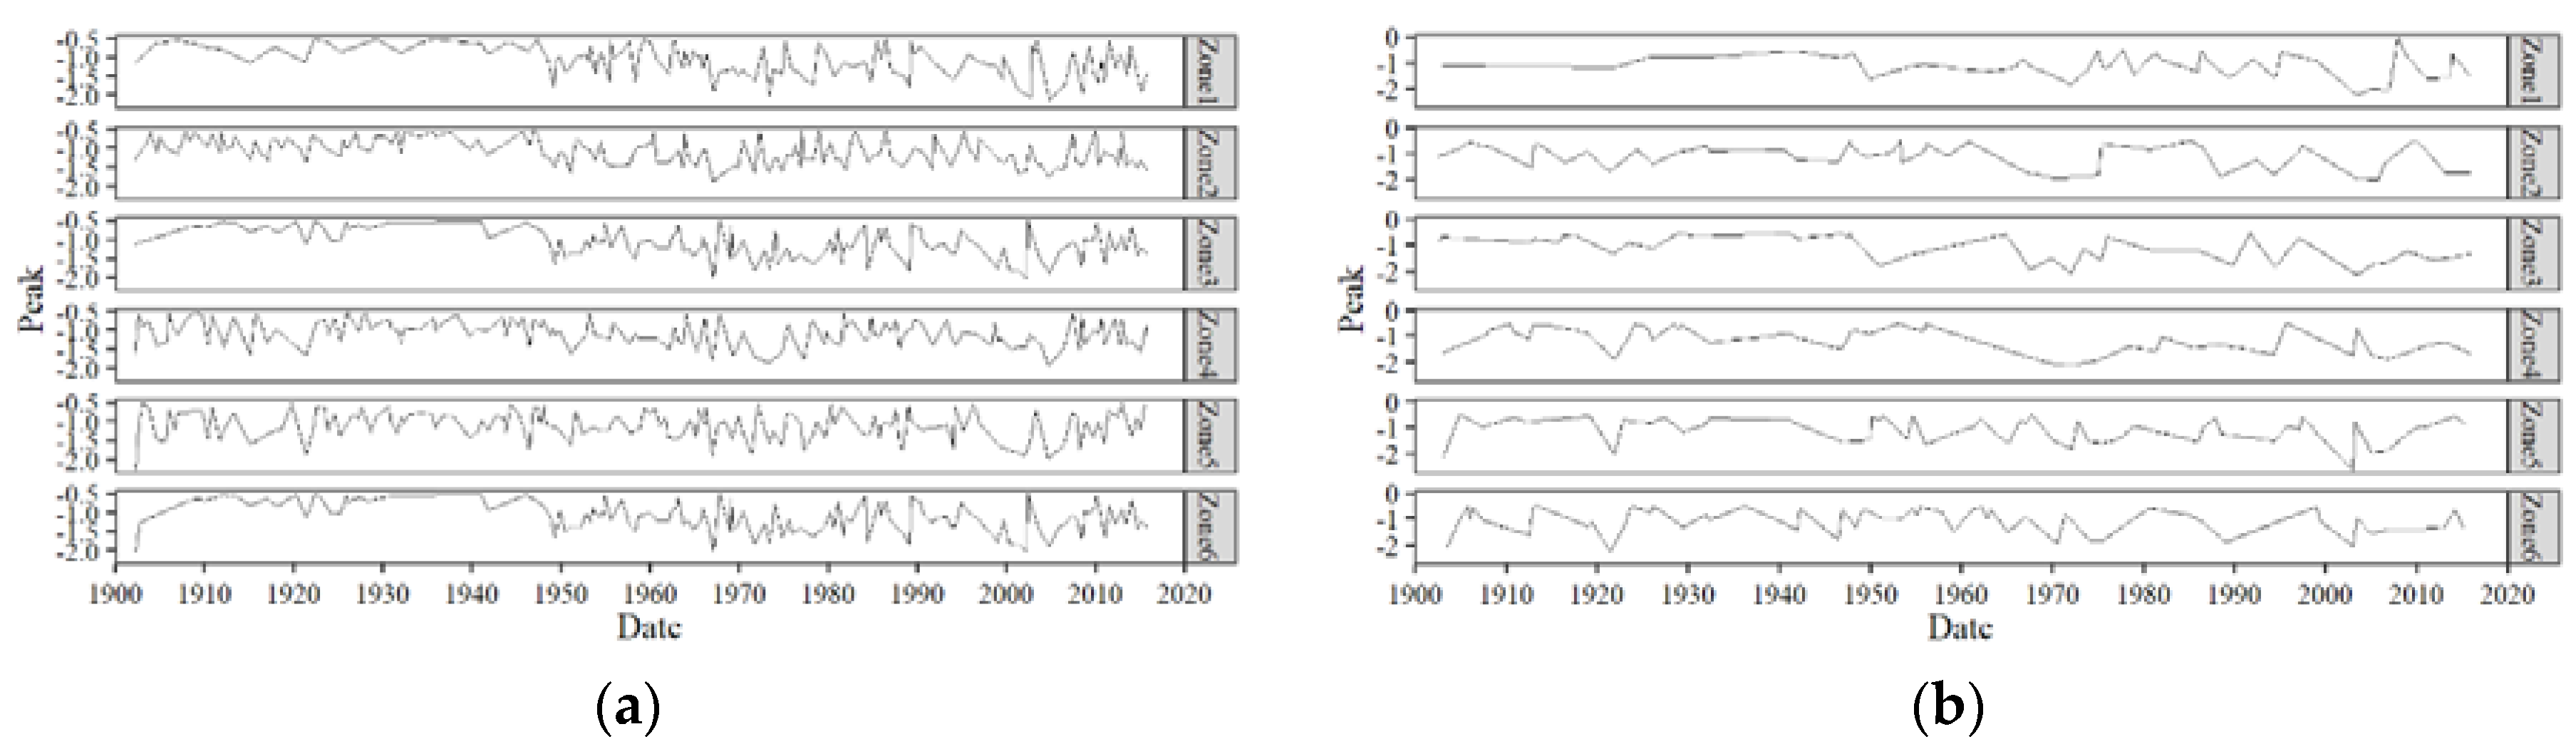
Figure 15.
(a) 3-month and (b) 12-month SPEI drought counts.
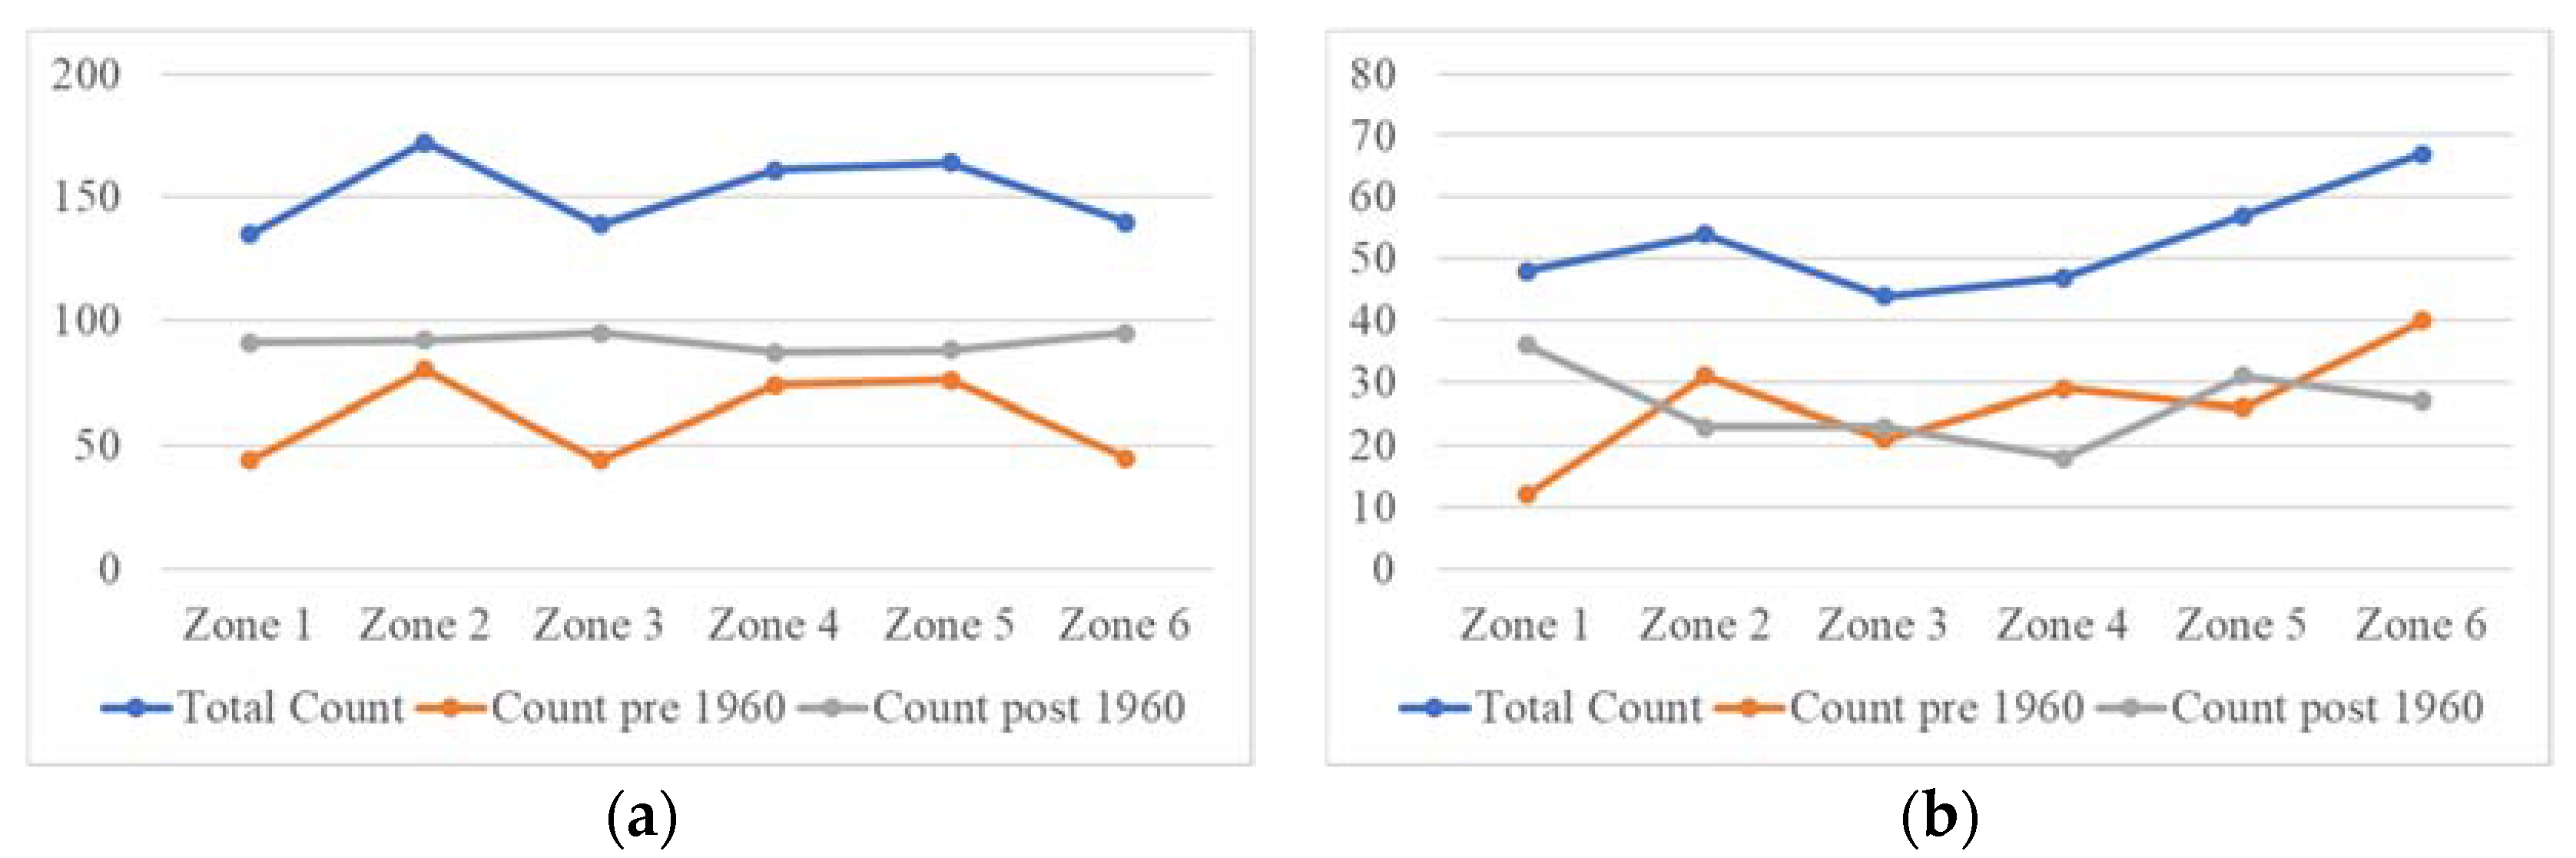
Figure 16.
(a) 3-month and (b) 12-month SPEI maximum drought duration.

Figure 17.
(a) 3-month and (b) 12-month SPEI minimum drought severity.
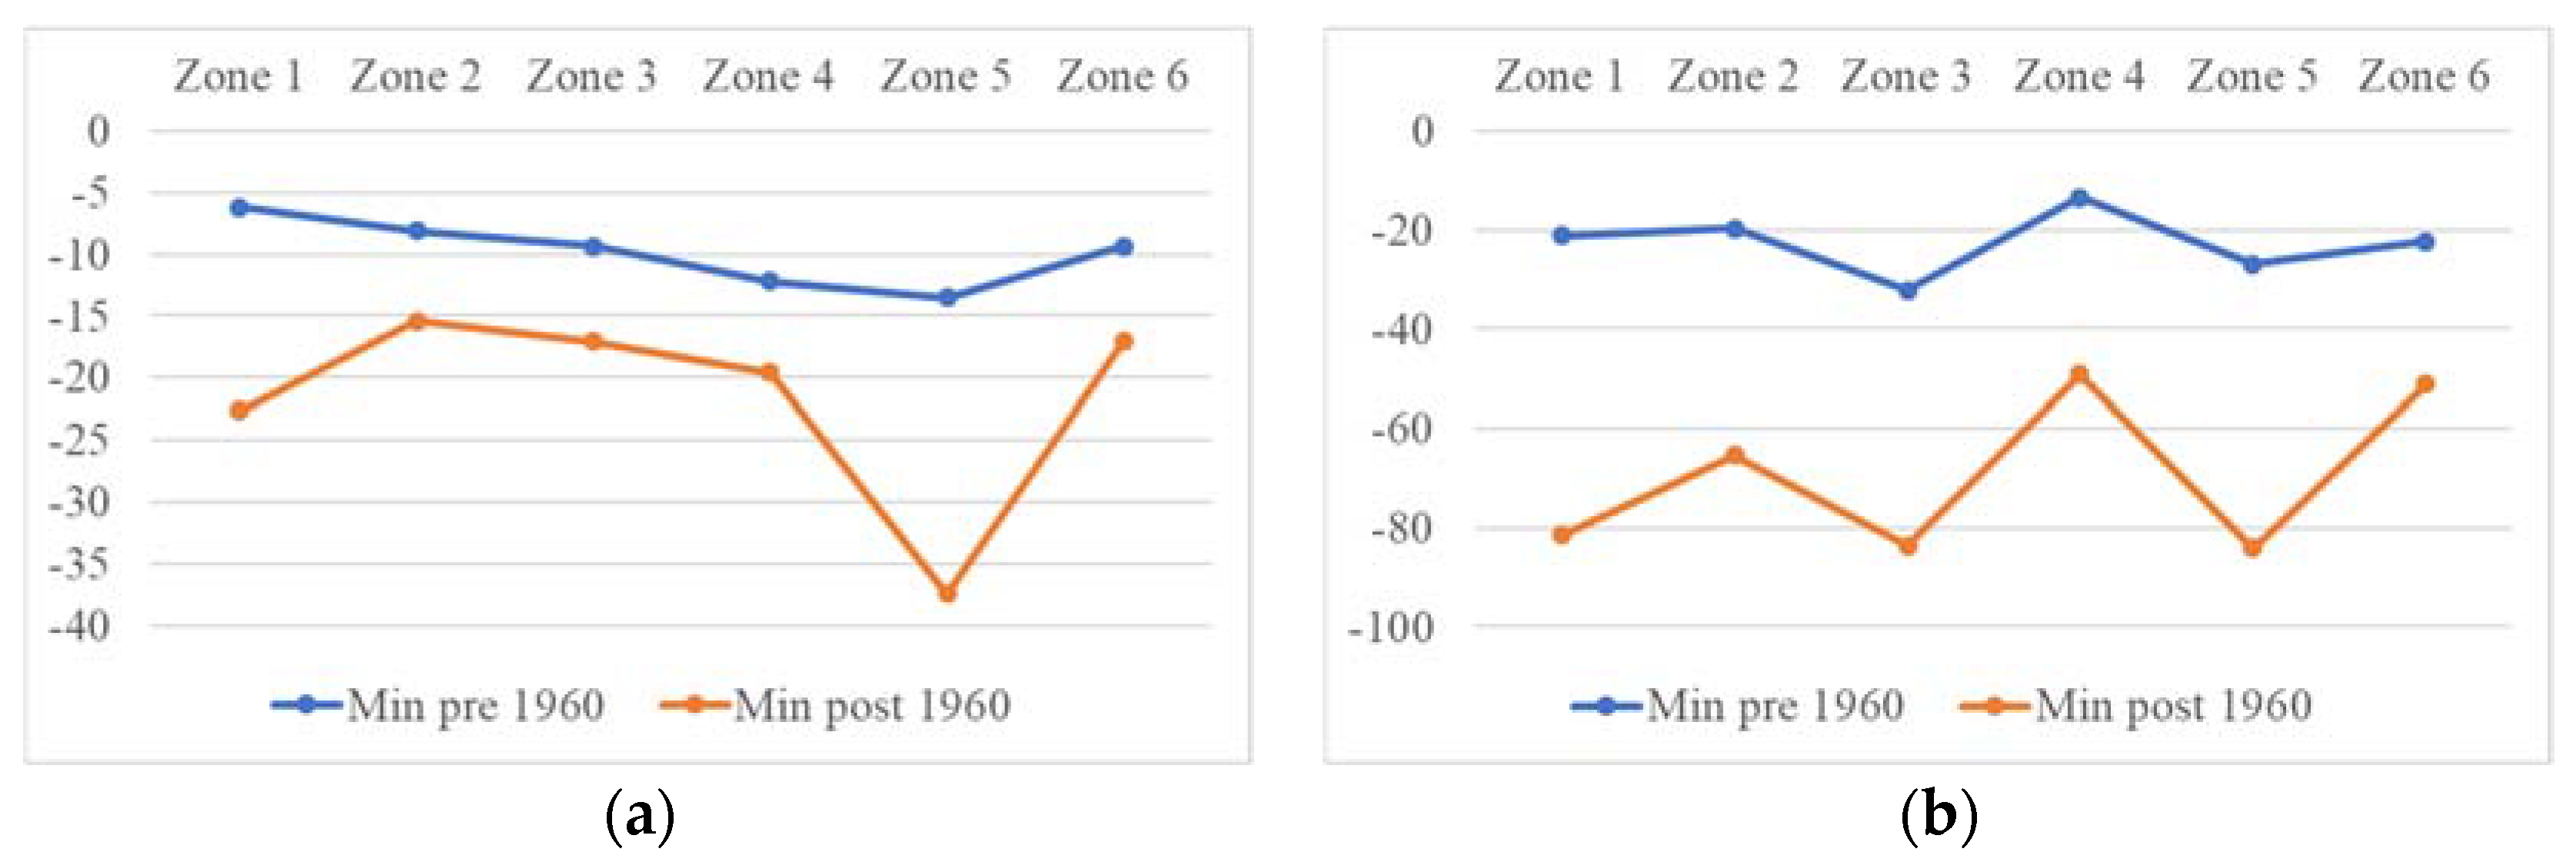
Figure 18.
(a) 3-month and (b) 12-month SPEI minimum drought intensity.
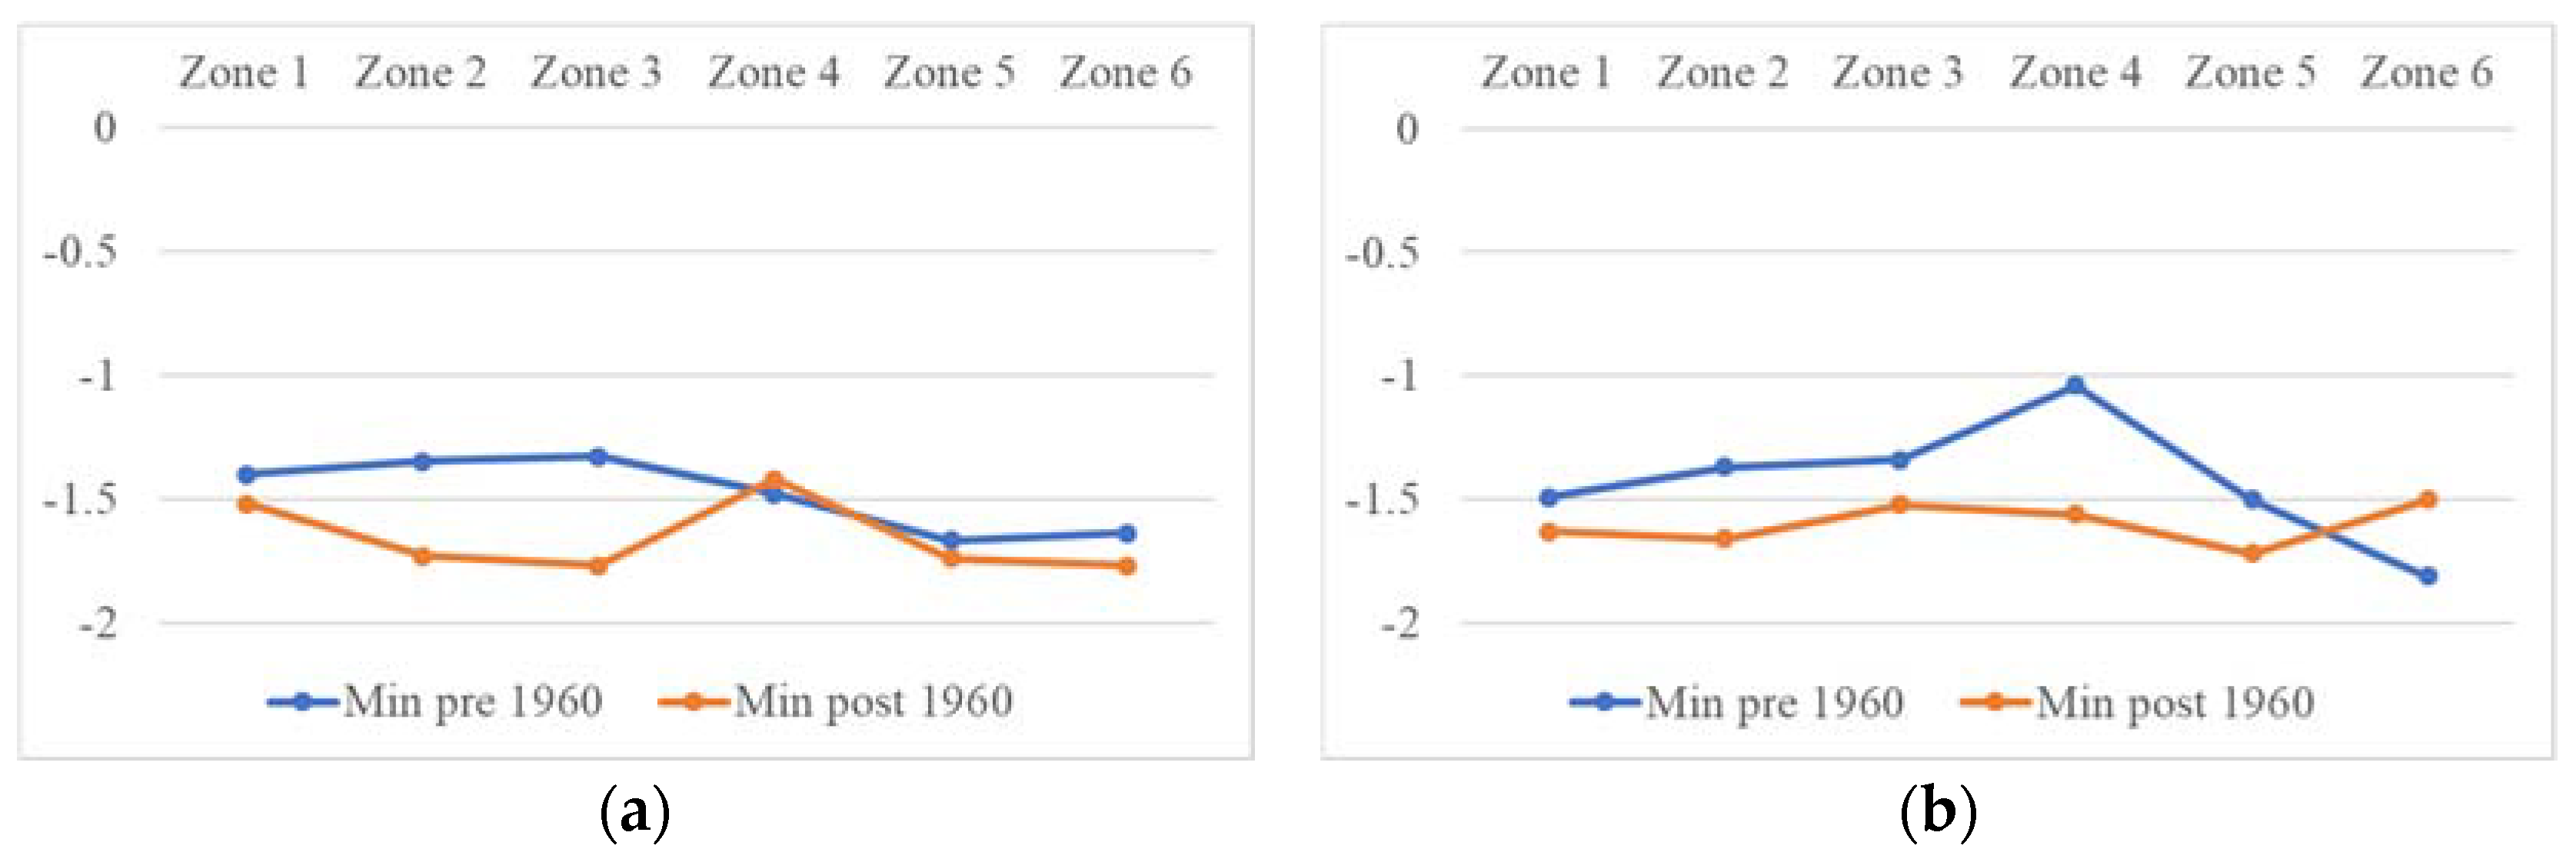
Figure 19.
(a) 3-month and (b) 12-month SPEI minimum drought peak.

Table 1.
Mann–Kendall test results for 3-month SPEI.
| Mann–Kendall Test Results for 3-Month SPEI | ||||
|---|---|---|---|---|
| p-Value | Tau | Sen’s Slope | ||
| Zone 1 | SPEI | 1.41 × 10⁻¹⁹ | −1.63 × 10⁻¹ | −6.15 × 10⁻⁴ |
| Duration | 7.83 × 10⁻³ | 1.49 × 10⁻¹ | 0.00 | |
| Severity | 2.52 × 10⁻⁴ | −2.13 × 10⁻¹ | −1.23 × 10⁻² | |
| Intensity | 5.66 × 10⁻⁶ | −2.64 × 10⁻¹ | −2.79 × 10⁻³ | |
| Peak | 2.00 × 10⁻⁵ | −2.48 × 10⁻¹ | −3.77 × 10⁻³ | |
| Zone 2 | SPEI | 3.94 × 10⁻⁵ | −7.42 × 10⁻² | −2.76 × 10⁻⁴ |
| Duration | 1.20 × 10⁻¹ | 8.15 × 10⁻² | 0.00 | |
| Severity | 2.27 × 10⁻² | −1.23 × 10⁻¹ | −5.42 × 10⁻³ | |
| Intensity | 1.97 × 10⁻³ | −1.67 × 10⁻¹ | −1.43 × 10⁻³ | |
| Peak | 6.78 × 10⁻⁴ | −1.83 × 10⁻¹ | −2.09 × 10⁻³ | |
| Zone 3 | SPEI | 1.26 × 10⁻⁶ | −8.75 × 10⁻² | −3.33 × 10⁻⁴ |
| Duration | 6.06 × 10⁻¹ | 2.67 × 10⁻² | 0.00 | |
| Severity | 3.43 × 10⁻¹ | −5.06 × 10⁻² | −1.85 × 10⁻³ | |
| Intensity | 1.67 × 10⁻¹ | −7.37 × 10⁻² | −6.22 × 10⁻⁴ | |
| Peak | 1.22 × 10⁻¹ | −8.24 × 10⁻² | −1.01 × 10⁻³ | |
| Zone 4 | SPEI | 3.83 × 10⁻⁴ | −6.41 × 10⁻² | −2.43 × 10⁻⁴ |
| Duration | 2.81 × 10⁻¹ | 5.45 × 10⁻² | 0.00 | |
| Severity | 1.72 × 10⁻² | −1.24 × 10⁻¹ | −5.82 × 10⁻³ | |
| Intensity | 2.71 × 10⁻⁸ | −2.89 × 10⁻¹ | −2.36 × 10⁻³ | |
| Peak | 8.11 × 10⁻⁸ | −2.79 × 10⁻¹ | −3.17 × 10⁻³ | |
| Zone 5 | SPEI | 5.41 × 10−38 | −2.33 × 10⁻¹ | −8.12 × 10⁻⁴ |
| Duration | 5.03 × 10⁻³ | 1.61 × 10⁻¹ | 0.00 | |
| Severity | 5.44 × 10⁻⁴ | −2.04 × 10⁻¹ | −1.20 × 10⁻² | |
| Intensity | 1.62 × 10⁻⁴ | −2.23 × 10⁻¹ | −2.31 × 10⁻³ | |
| Peak | 3.26 × 10⁻⁵ | −2.45 × 10⁻¹ | −3.90 × 10⁻³ | |
| Zone 6 | SPEI | 1.44 × 10⁻² | −4.41 × 10⁻² | −1.67 × 10⁻⁴ |
| Duration | 1.87 × 10⁻² | 1.32 × 10⁻¹ | 0.00 | |
| Severity | 9.11 × 10⁻⁴ | −1.92 × 10⁻¹ | −1.06 × 10⁻² | |
| Intensity | 2.33 × 10⁻⁵ | −2.45 × 10⁻¹ | −2.62 × 10⁻³ | |
| Peak | 1.12 × 10⁻⁴ | −2.24 × 10⁻¹ | −3.44 × 10⁻³ | |
| Statistically significant at 95% confidence interval | ||||
| Not statistically significant | ||||
Table 2.
Mann–Kendall test results for 12-month SPEI.
| Mann–Kendall Test Results for 12-Month SPEI | ||||
|---|---|---|---|---|
| p-Value | Tau | Sen’s Slope | ||
| Zone 1 | SPEI | 4.62 × 10−42 | −2.45 × 10⁻¹ | −8.53 × 10⁻⁴ |
| Duration | 8.22 × 10⁻² | 1.72 × 10⁻¹ | 7.69 × 10⁻² | |
| Severity | 1.47 × 10⁻¹ | −1.45 × 10⁻¹ | −5.41 × 10⁻² | |
| Intensity | 7.29 × 10⁻¹ | −3.55 × 10⁻² | −1.18 × 10⁻³ | |
| Peak | 2.23 × 10⁻¹ | −1.22 × 10⁻¹ | −5.62 × 10⁻³ | |
| Zone 2 | SPEI | 1.86 × 10⁻⁸ | −1.02 × 10⁻¹ | −3.86 × 10⁻⁴ |
| Duration | 7.00 × 10⁻¹ | 3.63 × 10⁻² | 0.00 | |
| Severity | 6.87 × 10⁻¹ | −3.84 × 10⁻² | −6.78 × 10⁻³ | |
| Intensity | 4.38 × 10⁻¹ | −7.34 × 10⁻² | −2.18 × 10⁻³ | |
| Peak | 3.25 × 10⁻¹ | −9.29 × 10⁻² | −3.98 × 10⁻³ | |
| Zone 3 | SPEI | 1.33 × 10⁻¹⁵ | −1.44 × 10⁻¹ | −5.31 × 10⁻⁴ |
| Duration | 6.00 × 10⁻² | 1.96 × 10⁻¹ | 1.18 × 10⁻¹ | |
| Severity | 2.29 × 10⁻² | −2.39 × 10⁻¹ | −1.95 × 10⁻¹ | |
| Intensity | 9.42 × 10⁻⁴ | −3.47 × 10⁻¹ | −1.18 × 10⁻² | |
| Peak | 3.70 × 10⁻³ | −3.04 × 10⁻¹ | −1.81 × 10⁻² | |
| Zone 4 | SPEI | 6.19 × 10⁻⁶ | −8.16 × 10⁻² | −3.13 × 10⁻⁴ |
| Duration | 1.32 × 10⁻² | 2.49 × 10⁻¹ | 1.54 × 10⁻¹ | |
| Severity | 1.61 × 10⁻³ | −3.19 × 10⁻¹ | −2.35 × 10⁻¹ | |
| Intensity | 4.60 × 10⁻⁴ | −3.54 × 10⁻¹ | −1.21 × 10⁻² | |
| Peak | 1.02 × 10⁻² | −2.60 × 10⁻¹ | −1.63 × 10⁻² | |
| Zone 5 | SPEI | 6.78 × 10⁻²⁰ | −1.65 × 10⁻¹ | −6.26 × 10⁻⁴ |
| Duration | 1.49 × 10⁻¹ | 1.31 × 10⁻¹ | 4.00 × 10⁻² | |
| Severity | 1.28 × 10⁻¹ | −1.39 × 10⁻¹ | −4.77 × 10⁻² | |
| Intensity | 2.81 × 10⁻² | −2.01 × 10⁻¹ | −3.98 × 10⁻³ | |
| Peak | 4.37 × 10⁻² | −1.84 × 10⁻¹ | −7.01 × 10⁻³ | |
| Zone 6 | SPEI | 1.16 × 10⁻² | −4.56 × 10⁻² | −1.69 × 10⁻⁴ |
| Duration | 2.68 × 10⁻² | 1.81 × 10⁻¹ | 3.64 × 10⁻² | |
| Severity | 2.80 × 10⁻² | −1.84 × 10⁻¹ | −3.72 × 10⁻² | |
| Intensity | 3.63 × 10⁻¹ | −7.64 × 10⁻² | −1.62 × 10⁻³ | |
| Peak | 1.24 × 10⁻¹ | −1.29 × 10⁻¹ | −3.94 × 10⁻³ | |
| Statistically significant at 95% confidence interval | ||||
| Not statistically significant | ||||
© 2020 by the authors. Licensee MDPI, Basel, Switzerland. This article is an open access article distributed under the terms and conditions of the Creative Commons Attribution (CC BY) license (http://creativecommons.org/licenses/by/4.0/).
Share and Cite
MDPI and ACS Style
Jamro, S.; Channa, F.N.; Dars, G.H.; Ansari, K.; Krakauer, N.Y. Exploring the Evolution of Drought Characteristics in Balochistan, Pakistan. Appl. Sci. 2020, 10, 913. https://doi.org/10.3390/app10030913
AMA Style
Jamro S, Channa FN, Dars GH, Ansari K, Krakauer NY. Exploring the Evolution of Drought Characteristics in Balochistan, Pakistan. Applied Sciences. 2020; 10(3):913. https://doi.org/10.3390/app10030913
Chicago/Turabian StyleJamro, Shoaib, Falak Naz Channa, Ghulam Hussain Dars, Kamran Ansari, and Nir Y. Krakauer. 2020. "Exploring the Evolution of Drought Characteristics in Balochistan, Pakistan" Applied Sciences 10, no. 3: 913. https://doi.org/10.3390/app10030913
Note that from the first issue of 2016, this journal uses article numbers instead of page numbers. See further details here.