1. Introduction
It is evident that initiatives such as the German paradigm of “Industry 4.0” or some other similar ones all around the world are having a deep impact on the manufacturing sector, and thus are reshaping the industry. The development of such paradigms is accelerating the development and deployment of advanced ITC-related technologies [
1], transforming many aspects, such as the industrial workforce and the way they develop their tasks. Even though customer-centric and demand-driven production is moving forward through the progress of industrial automation, the need for a better and more empowered human workforce is more demanding than ever. The next human workforce should have new and more powerful tools that allow them to improve their decision-making processes, to more easily adapt to changing production conditions and to adopt strategies for continuous training. Along with the development of the Industry 4.0 paradigm appears the concept of Operator 4.0 [
2]. This concept is driven by several objectives, such as to simplify the day-to-day work, while improving efficiency and autonomy by focusing on added value tasks, all in a comfortable and healthy working environment. This paper proposes a new system based on augmented reality (AR) for assisting operators during manual assembly of electronic components. As mentioned before, a customer-centric oriented and personalized production requires continuous changes in production lines. The electronics sector is not an exception in this regard. This industry has many automated processes for the assembly of electronic components for electronic boards, also known as printed circuit boards (PCB), but there are also many manual assembly stages along the production lines. Operators perform the monotonous task of board assembly over considerable periods of time; therefore, they are likely to experience fatigue and distractions. Furthermore, the low profile needed for this task favors rotation of personnel, which is undesirable because new employees take a certain amount of time to adapt. As a consequence, manual processes have the highest error ratio of the production process; electronic manufacturers have identified the necessity of improving these processes as a key point. Therefore, This paper proposes a system which aims to reduce assembly errors and adaptation times for new employees while increasing operator comfort, confidence and assembling speed by means of AR.
This paper is structured as follows:
Section 2 describes the current state of the art related works with the application of augmented reality to the manufacturing sector. In
Section 3, we show our approach to assist the operators during the manual assembly of electronic components.
Section 4 outlines the results of a usability test we carried out with several operators using the proposed approach.
Section 5 discusses the proposed approach and shows how a significant and positive impact has been achieved in the production line evaluated. Finally,
Section 6 gives some conclusive remarks and also mentions some future research directions for improving the next generation of the system.
2. Related Work
Visual Computing technologies (including augmented reality) will be key enabling technologies for the smart factories of the future [
1]. These technologies have demonstrated good capacities for empowering human operators when performing industrial tasks by providing tools that assist them and improve their comfort and performance [
3]. Consequently, the research community has focused on these technologies and several related approaches have been proposed [
4]. Next, we mention a few AR works applied to the manufacturing sector.
Augmented reality has been extensively used in many industrial processes, such as maintenance operations [
5]. Some of these solutions [
6,
7,
8,
9,
10,
11] are oriented toward assembly tasks, in which an AR technology provides virtual instructions in order to guide the operators. In those solutions, the virtual content is shown in a screen, forcing the operators to constantly change the attention between the physical workspace and the screen. As stated by [
12], switching attention between two sources during a maintenance task (for example, between the documentation and the workspace when using a traditional paper based instructions, or between a screen and the workspace) might cause a high cognitive load, which translates into greater probability of errors and an increase of the task completion time. On the contrary, projection based augmented reality (also cited as spatial augmented reality (SAR) [
13] in a broader meaning, or just projection mapping) projects the virtual data directly in the physical space. This approach allows the operator to have their hands free and is considered an enabling technology to face the challenge of supporting operators performing tasks [
14]. Attracted by these advantages, several SAR works have been developed for industrial environments [
15,
16,
17,
18,
19]. Most of these works are focused on providing guidance to the operators, without verifying if the task is correct or not. To face that, [
20] proposes an AR system that also verifies the operator task by comparing the status of every step along the maintenance procedure, represented by a captured image, with a reference virtual 3D representation of the expected status, which is converted to an image as well by rendering the virtual 3D data using the tracked real camera location.
Moreover, as more and more visual computing solutions are integrated into industrial shop floors, the complexity of communication and interaction across different peripherals and industrial devices increases. Nonetheless, [
21] has recently proposed a middleware architecture that enables communication and interaction across different technologies without manual configuration or calibration.
From the works cited above, only [
6,
11] deal with PCBs and are focused on a similar domain to our work. However, they only address the part of offering augmented instructions on the screen (without projection). Additionally, compared to all the works cited, our work combines the best characteristics of each of them. Thus, our work has the following strong points:
The proposed system verifies if the operator has performed the operation correctly.
Instructions are simple, so there is no need to create the multimedia content that is projected. The authoring effort is minimized to only set the position of each component in the reference board.
The projection is done on a flat surface, so the calibration step has been simplified to be easy, fast and automatic (the user only has to put the calibration pattern in the workspace).
The proposed system uses advanced visualization techniques (flickering) to deal with reflections when projecting on PCBs.
The proposed system supports dynamic projection; i.e., the projection is updated in real time when the PCB is moved.
A normal RGB camera is used; no depth information is required.
3. Proposed Method
This paper proposes a SAR system to guide and assist operators during the process of assembling electronic components. This system performs real-time checking of the state of a PCB; i.e., checks presence or absence of electronic components, by means of computer vision techniques. It offers visual information about which component should be assembled and whether previous assemblies have been correctly done. This work is based on [
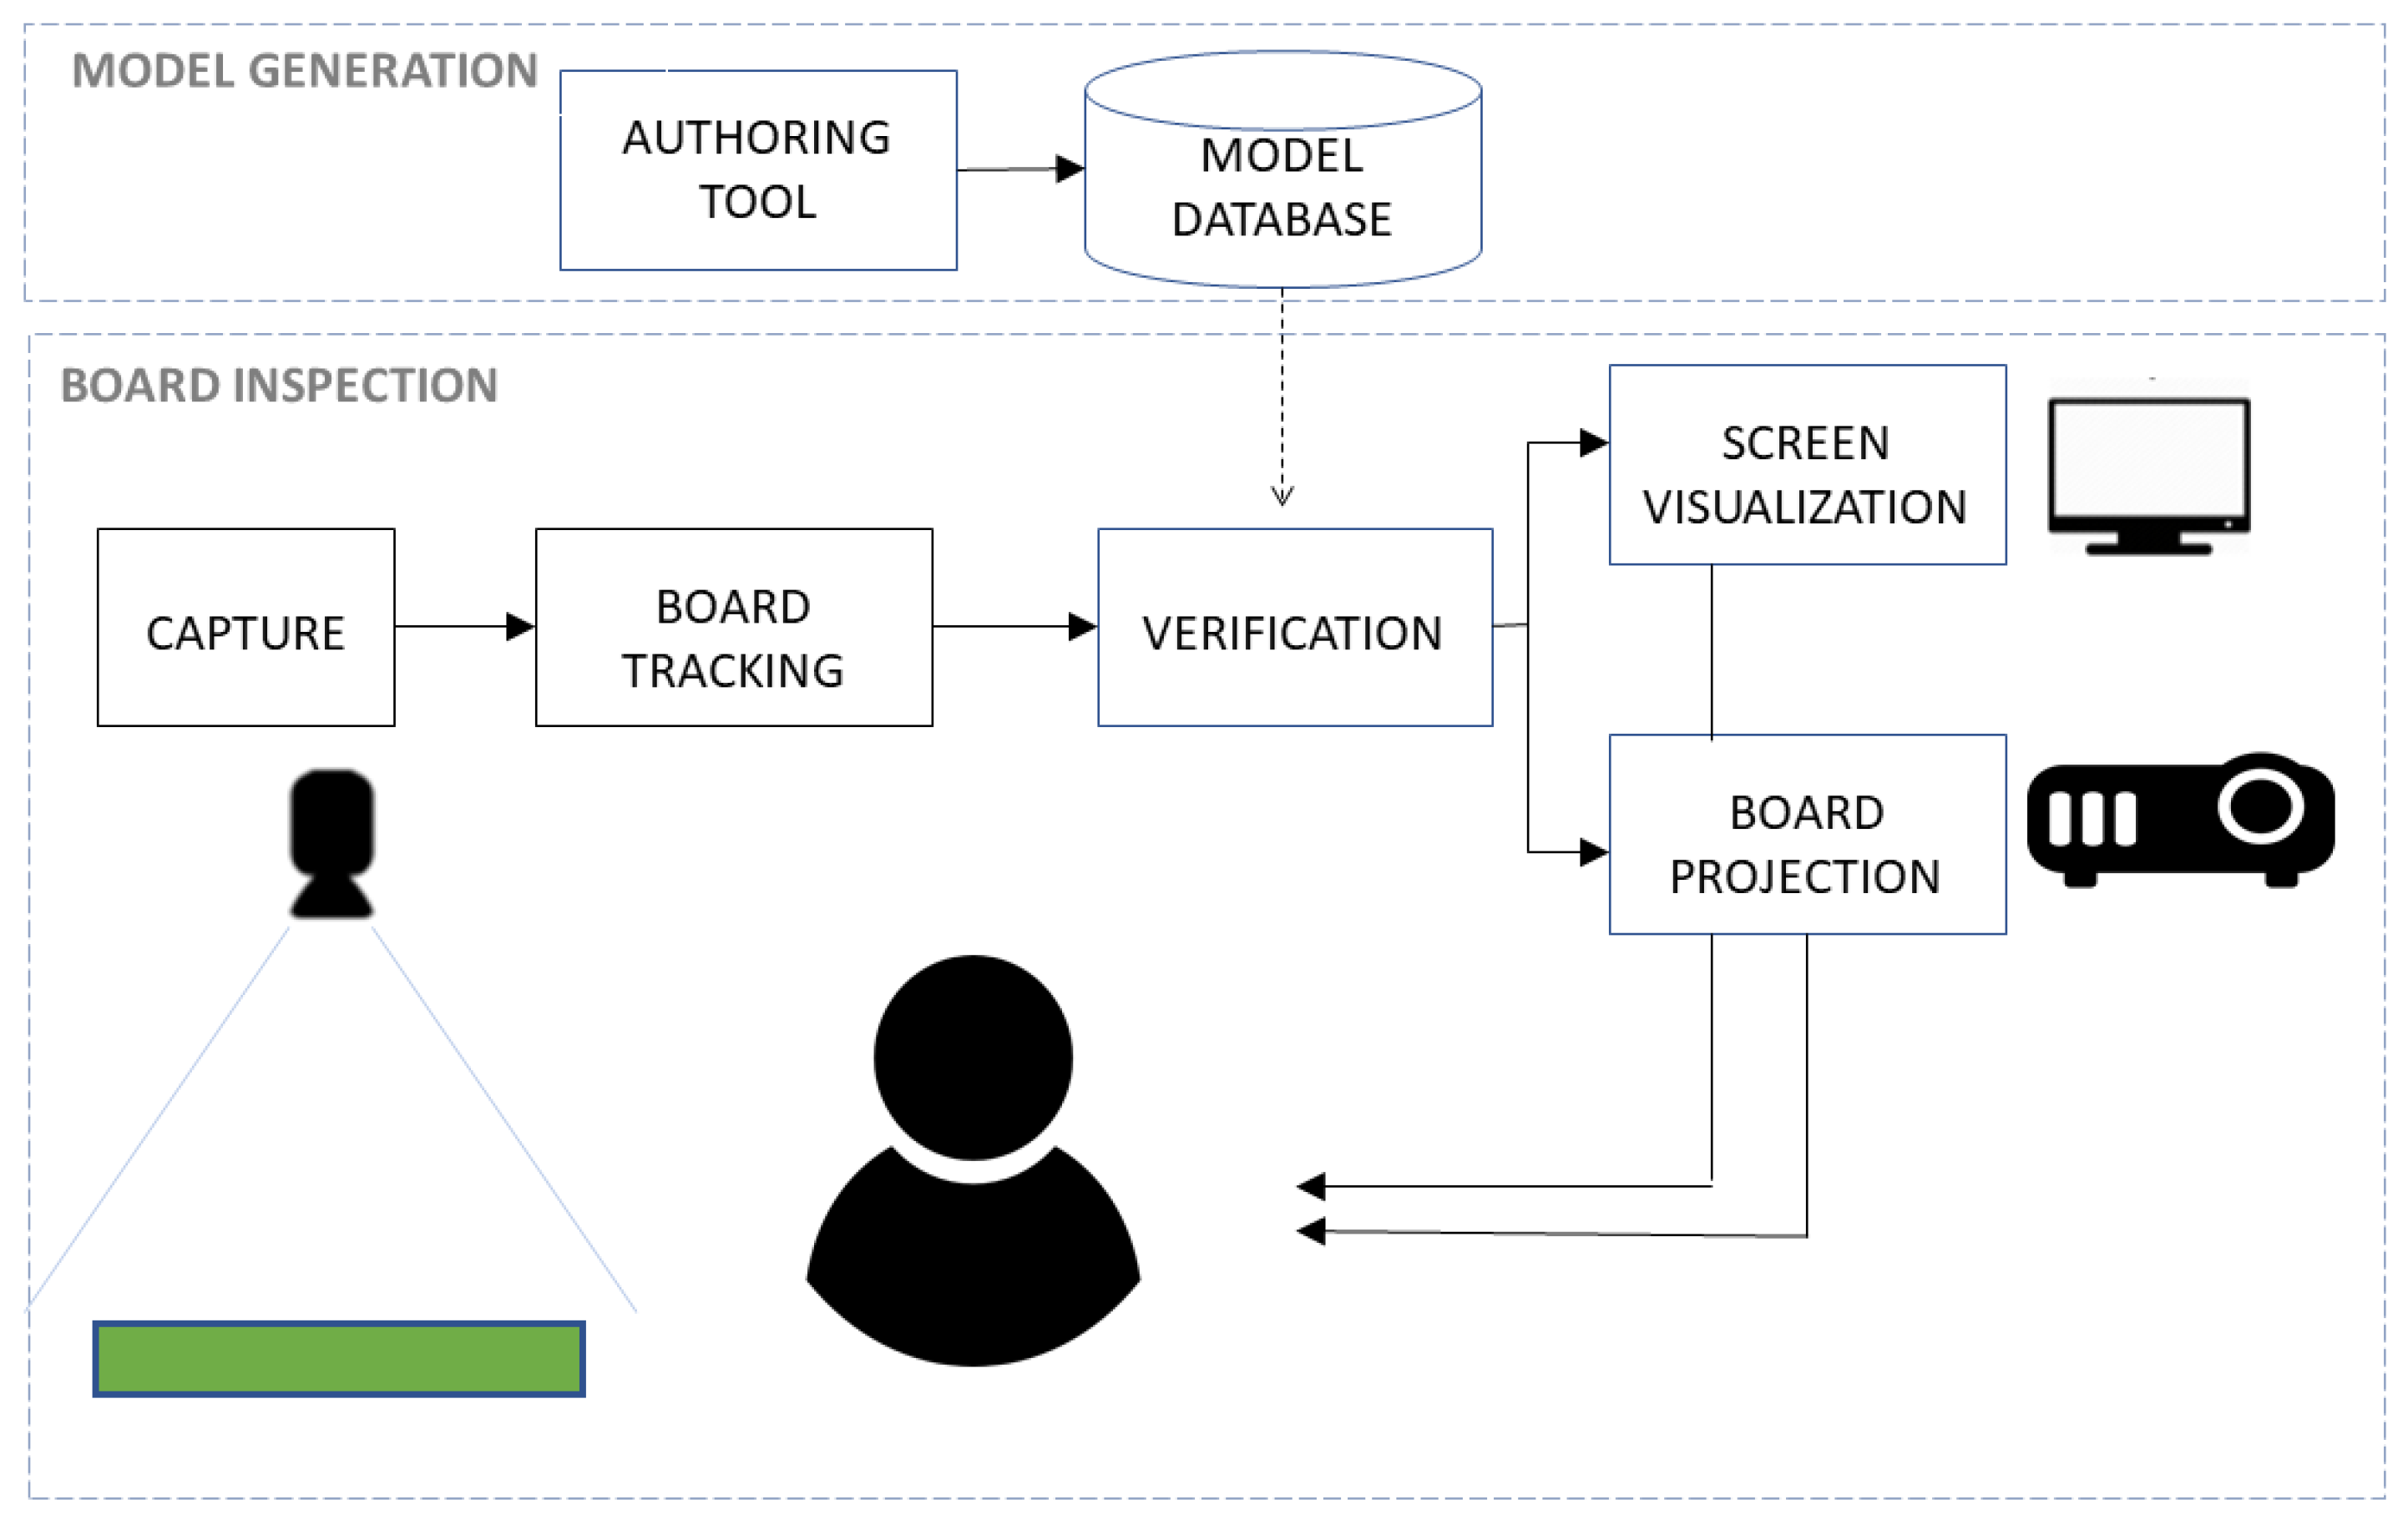
22], but with the improvement that the virtual content is directly projected on the PCB using projection mapping techniques. In the following sections we provide a brief description of the SAR system that we rely on and give a detailed explanation of the components newly-added to the aforementioned system. The system has two work modes, one consists of the model generation (during an offline phase) and the other consists of the real-time board inspection and operator guiding (during an online phase); see
Figure 1. We explain each component in the following subsections.
3.1. Setup
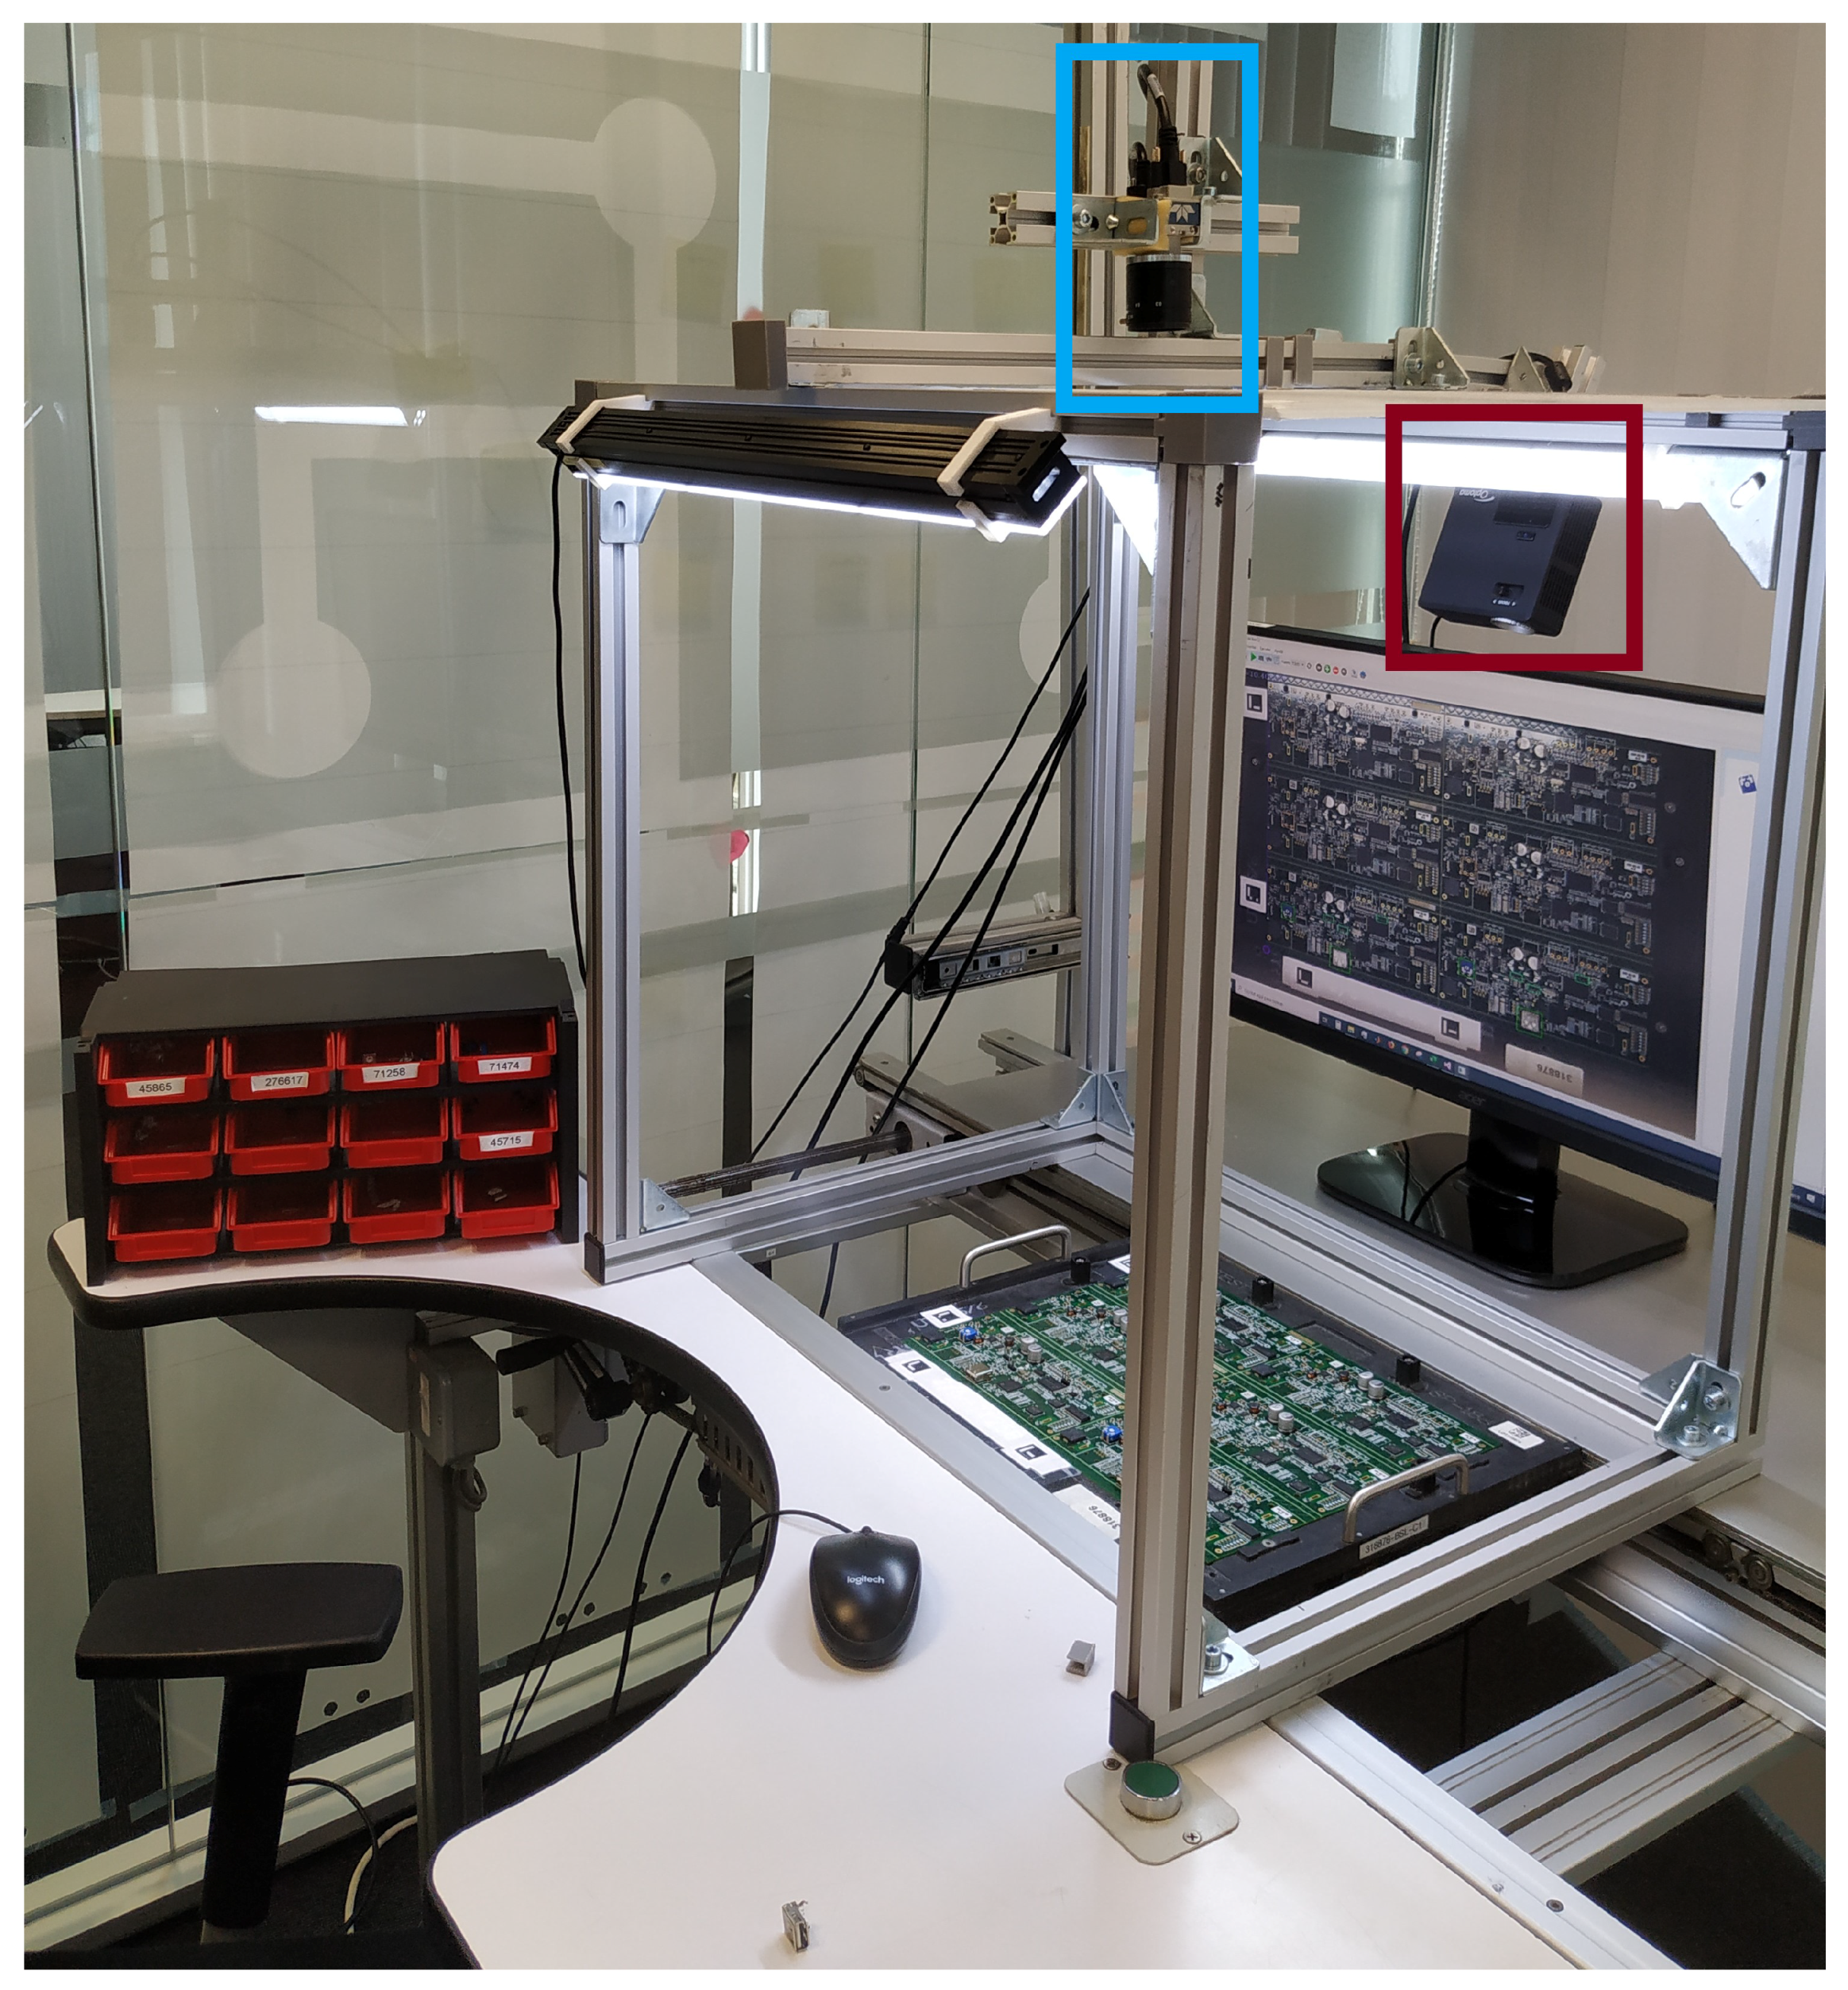
The proposed system consists of four different parts: an illumination system, a 2D high-resolution image acquisition setup, a screen and a projector (see
Figure 2). The illumination system, the camera and the projector must be located at sufficient height in order to not disturb the operator during manual operation. Given user experiences and comments, the minimum ergonomic height settled on was 600 mm. A 12 mega-pixel camera is at the center of the illumination system, at a height of 700 mm. This positioning, combined with the optical lens, offers a field of view of 500 × 420 mm. A PCB’s maximum size was established to 320 × 400 mm, which is covered by the proposed setup.
The projector model used is conventional, more specifically, an Optoma ML750e, which uses LED technology and has a light output of 700 lumens. It is not a very powerful projector, but it has proven to be sufficient (
Section 3.6.2), and, in return, thanks to its small dimensions, it has allowed us to achieve a fairly compact setup. It is positioned next to the camera, covering all the field of view of the camera.
The screen is in front of the operator, hopefully at the most ergonomic position. The screen shows the outputs and feedback of the proposed system. It is a complementary visualization, since this output is also shown directly on the board using the projector.
3.2. Authoring Tool
The main goal of this tool is to generate models which are able to distinguish between the presence and absence of electronic components in the board. This tool is intended to be used before board inspection in case there are any components unknown to the system. In this case, an operator with correct access rights will use this tool to generate the model for this specific component.
The component catalog is immense, of the order of 10,000 different components, which it is being constantly updated. Furthermore, these components present huge variations in their characteristics such as size, shape, texture and color. In order to tackle this problem, [
22] proposed a one-classifier-per-component approach and the definition of a training phase that only needs a single image of a minimum number of components to generate a model. This training phase can be divided into different stages: segmentation, image generation and training.
Segmentation: In this stage the operator takes an image of the new referenced component, selecting a foamy material with chromatic contrast to the background. The operator has to place a set of components with the same reference almost covering all the camera field of view. Experiments show that five well distributed components are enough to capture the prospective distortion of the camera. When the capture is ready, the segmentation process starts. The first step consists of applying a rough or an approximate segmentation. After this process, a more accurate segmentation is carried out using GrabCut algorithm [
23] for improving component segmentation result.
Image generation: To get a high performance classifier, a substantial number of image samples that include as much component variability as possible, is necessary. In [
22], the authors propose generating synthetic images of the components and different backgrounds by applying geometric and photo-metric transformations. This step ensures the robustness of trained classifiers during operation.
Training: In order to generate the classification model from the generated set of images, the first part is to extract the relevant features from these images. The images of this dataset have a huge variety in terms of background; some of them are totally uniform, while others have numerous pinholes and tracks. For this reason, global features obtained from the whole image should be used instead of focusing on local keypoints. Once features are extracted, a classifier is trained with them, in order to to discriminate between components and background, and it is saved in a database.
In [
22], a study is conducted which compares the accuracy of different combinations of features and classifiers. Training and validation were performed with artificially generated images, whereas testing was performed with real images taken with the proposed setup ensuring performance in real environments. This study was conducted using 21 different components chosen in order to cover a big spectrum of components, ranging from multi-colored big components to uniform small components. In conclusion, a combination of color histograms, histogram Of gradients (HOG) and local binary patterns (LBPs) were chosen as features. Along with a radial-basis function support vector machine (RBF-SVM) as the classifier, this combination achieved more than 90% accuracy in validation and testing. Furthermore, this combination was assured to have low computation time; that is enough for a real-time application.
3.3. Board Tracking
As the proposed system uses the image captured by the camera to recognize components, it is essential to avoid distortions in the image due to the camera lens. It is therefore necessary to calibrate the camera, i.e., to know the intrinsic camera parameters, before or prior to using the system. In our system, we propose to use the well known Zhang’s camera calibration algorithm [
24]. This calibration process only needs to be done once, and it allows us to calculate the compensation that has to be applied to each image captured by the camera to avoid distortions.
During the component assembly phase, the boards have a non-fixed position, having one degree of freedom for horizontal displacement. They have also different sizes, shapes and colors due to the mounting boards and used materials. Owing to a component’s position being referred to via the bottom-left corner of the board, the use of some markers is proposed with the final purpose of tracking the board position. In this system, the ArUco markers are used [
25].
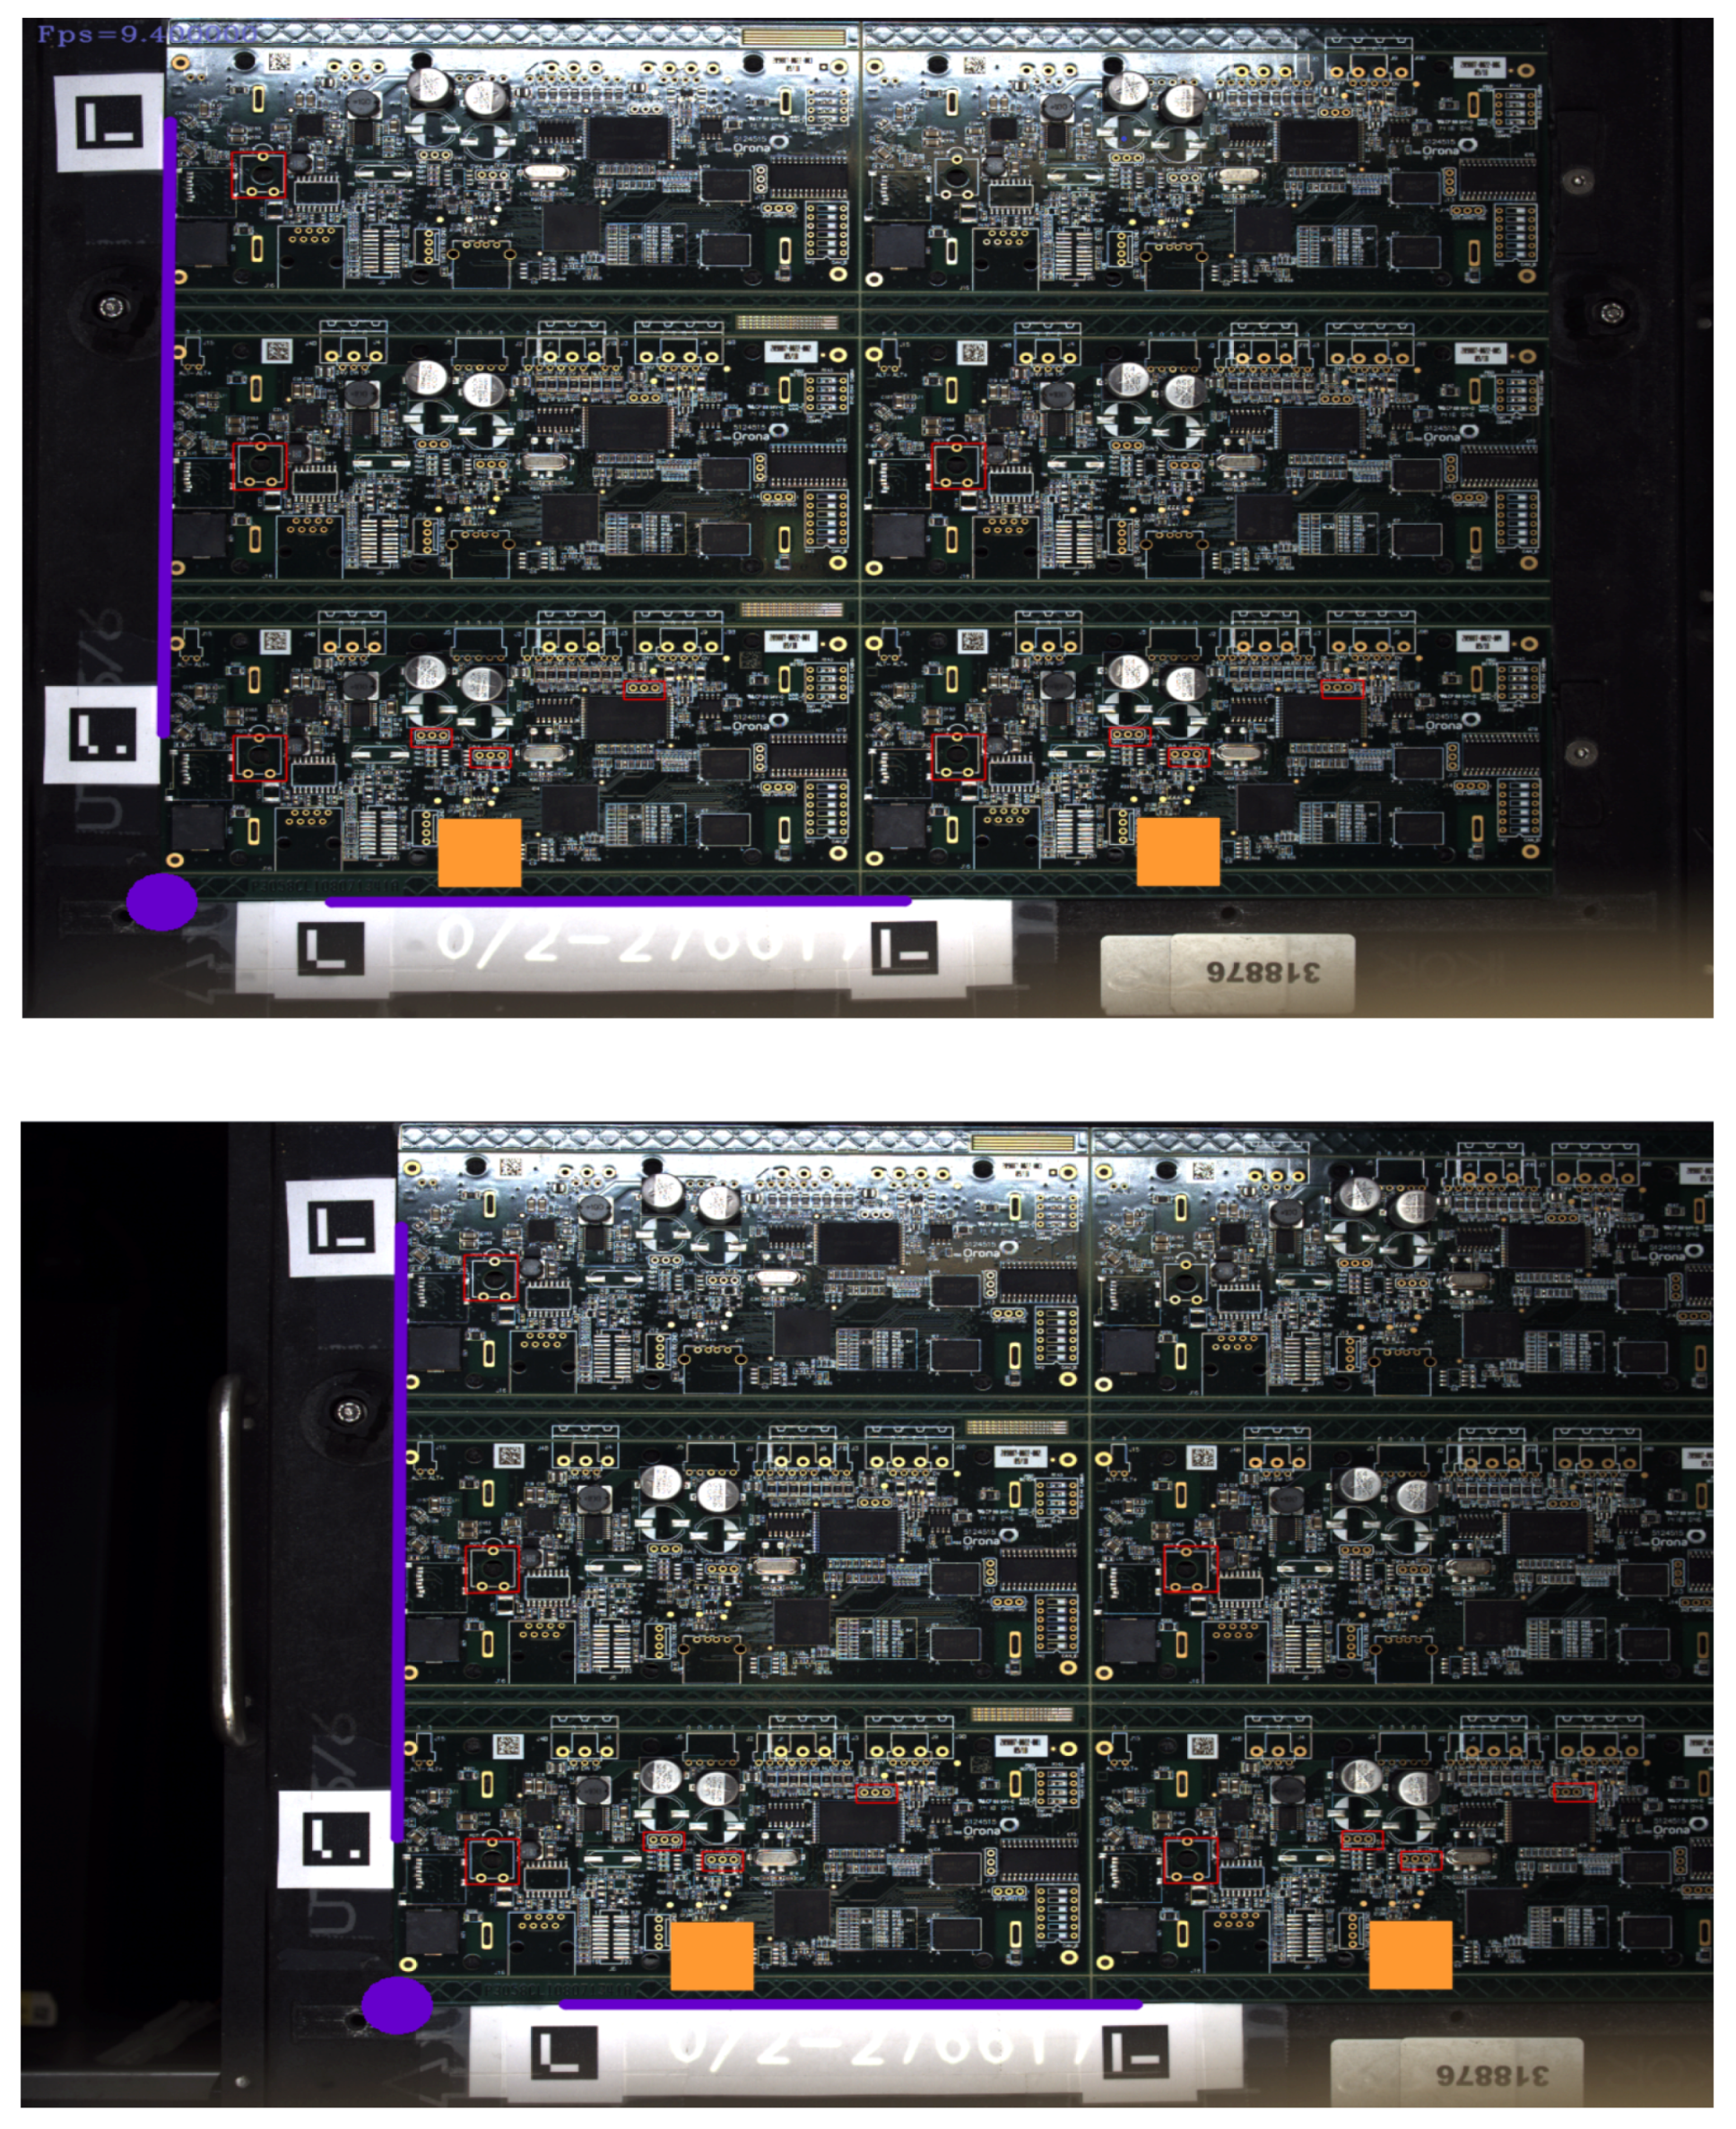
Two ArUco markers are placed to locate the vertical board position, an other two ArUco markers are placed to locate the horizontal board position. During the assembly, the operator might occlude the horizontal markers, but if it happens, the system assumes the previously captured horizontal marks positions as current positions (temporal coherence assumption). The corner of the board is calculated by intersecting the vertical line and the horizontal line referenced to the markers; see
Figure 3. This corner is necessary to obtain the reference system of the PCB, and therefore, to locate component positions. If vertical line calculation is not possible, the component inspection stops. Thus, visible vertical markers are necessary to track correctly the board.
3.4. Verification
In this step, the main goal is to verify the presence of the components on the board.
First, the assembly region of each components should be located. A list of component relative coordinates with respect to the board corner is feed to the system, and because the board corner is already located, the assembly regions can be situated in the image. This coordinate list is created by the quality engineer during the design process of the board using the manufacturing execution system (MES) of the company.
A further step is to calculate the detection probability of each component, using the cropped image of the assembly region. The classification models of the board components are loaded from the model database. Then, for each cropped image, the selected combination of features is extracted and feed to the classification model, an RBF-SVM in this case.
The output of the model is a probability for the analyzed image crop of the component. A high value of this probability represents component presence, whereas low probability means absence. Note that a larger region usually provides a stronger response than smaller region because it has more borders, texture, colors, etc. To adjust this response, a threshold calculated proportionally using the region size is given. This operation minimizes false positives.
When these values are obtained, the output is visualized on the screen and on the board. The visualization strategy is explained in the next section.
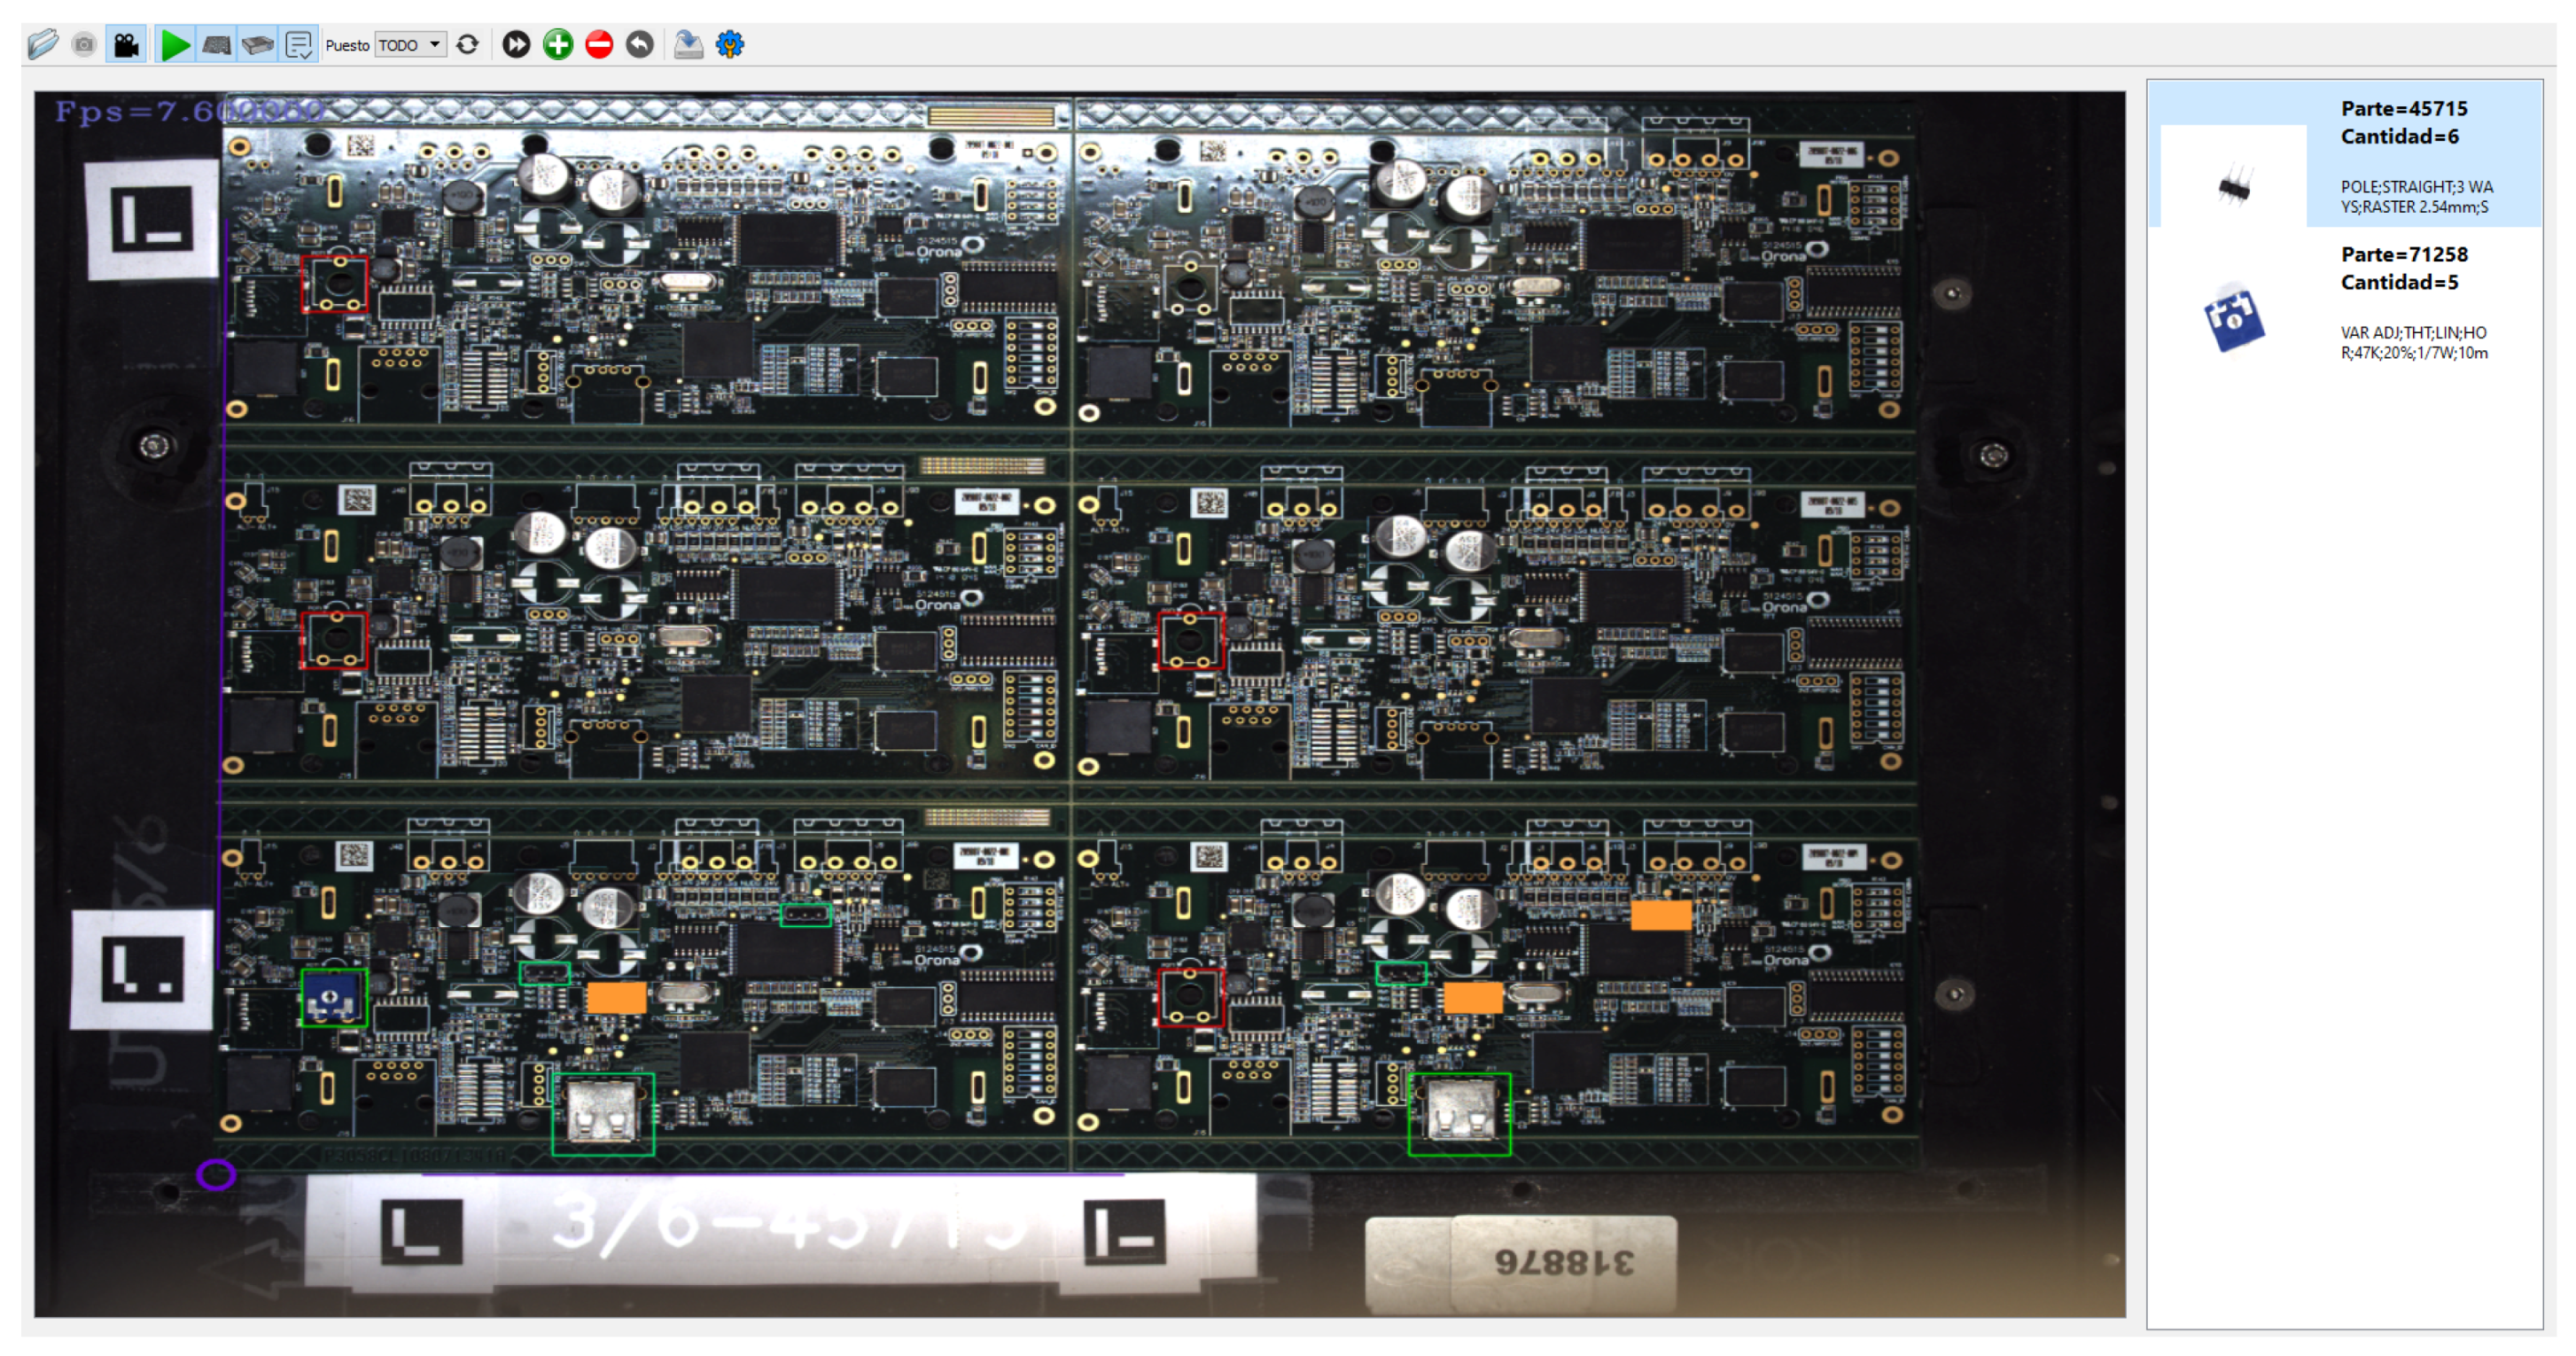
3.5. Screen Visualization
With the verification output, the region location is highlighted in the screen by a rectangle; if the component is mounted, the rectangle is green, whereas if it is not mounted, the color is red. The current group of components to be mounted is highlighted with a blinking orange solid rectangle in the visualization. On the right side of the screen, the reference and image of the component to be mounted are shown; see
Figure 4.
3.6. Projection Mapping
The main problem of screen based visualization is that the operator has to constantly check the state of the assembly on the screen, switching attention between the board and screen. A more ergonomic solution is obtained when the projector is used to visualize this output directly onto the PCB. This improves the posture of the worker and increases the assembly speed and quality, since the operator does not have to look up to receive work-instructions.
Apart from offering assistance in a conventional screen, the proposed system also provides guidance by projecting relevant virtual content directly onto the PCB. However, to project content in the desired place and with an adequate degree of immersion, it is first necessary to calibrate the camera–projector pair.
3.6.1. Camera–Projector Calibration
To project virtual content adequately in a physical space, we must calibrate the setup; i.e., find a geometric transformation that adapts the virtual data to the shape of the projection surface. This transformation can be fixed manually by modifying the position or shape of the virtual content until the projection gives the desired results, which is a laborious and expensive process that requires technical skills. However, in those cases where there is also a camera in the setup, the camera–projector calibration, i.e., finding the correct geometric transformation, can be calculated automatically. The projector can emit a pattern that is captured and recognized by the camera and which can be used to estimate the transformation that moves content from the camera’s coordinate system to the projector’s coordinate system. Additionally, when an object is recognized in the camera image and the camera pose is known, i.e., the position and orientation respect to the object is known (
Section 3.3), we have the transformation that relates the object and camera coordinate systems. Thus, since the virtual content is defined in the same coordinate system as the object, its projection can be calculated using the chain rule. In this work, we have followed this methodology to calibrate the camera–projector pair. We propose to place a planar checkerboard in the physical space, and the projector projects a complete gray code sequence. This structured-light sequence can be decoded, so that each pixel of the camera is associated with a projector row and column. Therefore, since the 3D coordinates of the checkerboard corners and their 2D positions (pixels) in the camera and projectors images are known, a traditional stereo calibration method can be applied to solve the three-dimensional camera–projector relationship (see [
26]). Nonetheless, in our setup, the projection surface is a plane (a PCB), and it is always parallel to the camera image plane, so we have simplified the camera–projector relationship to 2D. We have modified the [
26] implementation to estimate a 2D homography that represents the camera–projector relationship. Although this simplification can be inaccurate for more complex projection surfaces, it offers good results for planar surfaces and simplifies the calibration process. In the original calibration version [
26], a structured-light sequence must be captured from several points of view, but in our simplified version, only one point of view is required. Therefore, our simplified and not optimized version only takes approximately 85 s to do the calibration (50 s to project and capture the gray code sequence and 35 s to decode the patterns and to estimate the homography). Nevertheless, this time is not usually critical, since the calibration process is only executed once when the setup is built. Likewise, the setup must be recalibrated when there is a change in the camera, the projector or the projection surface.
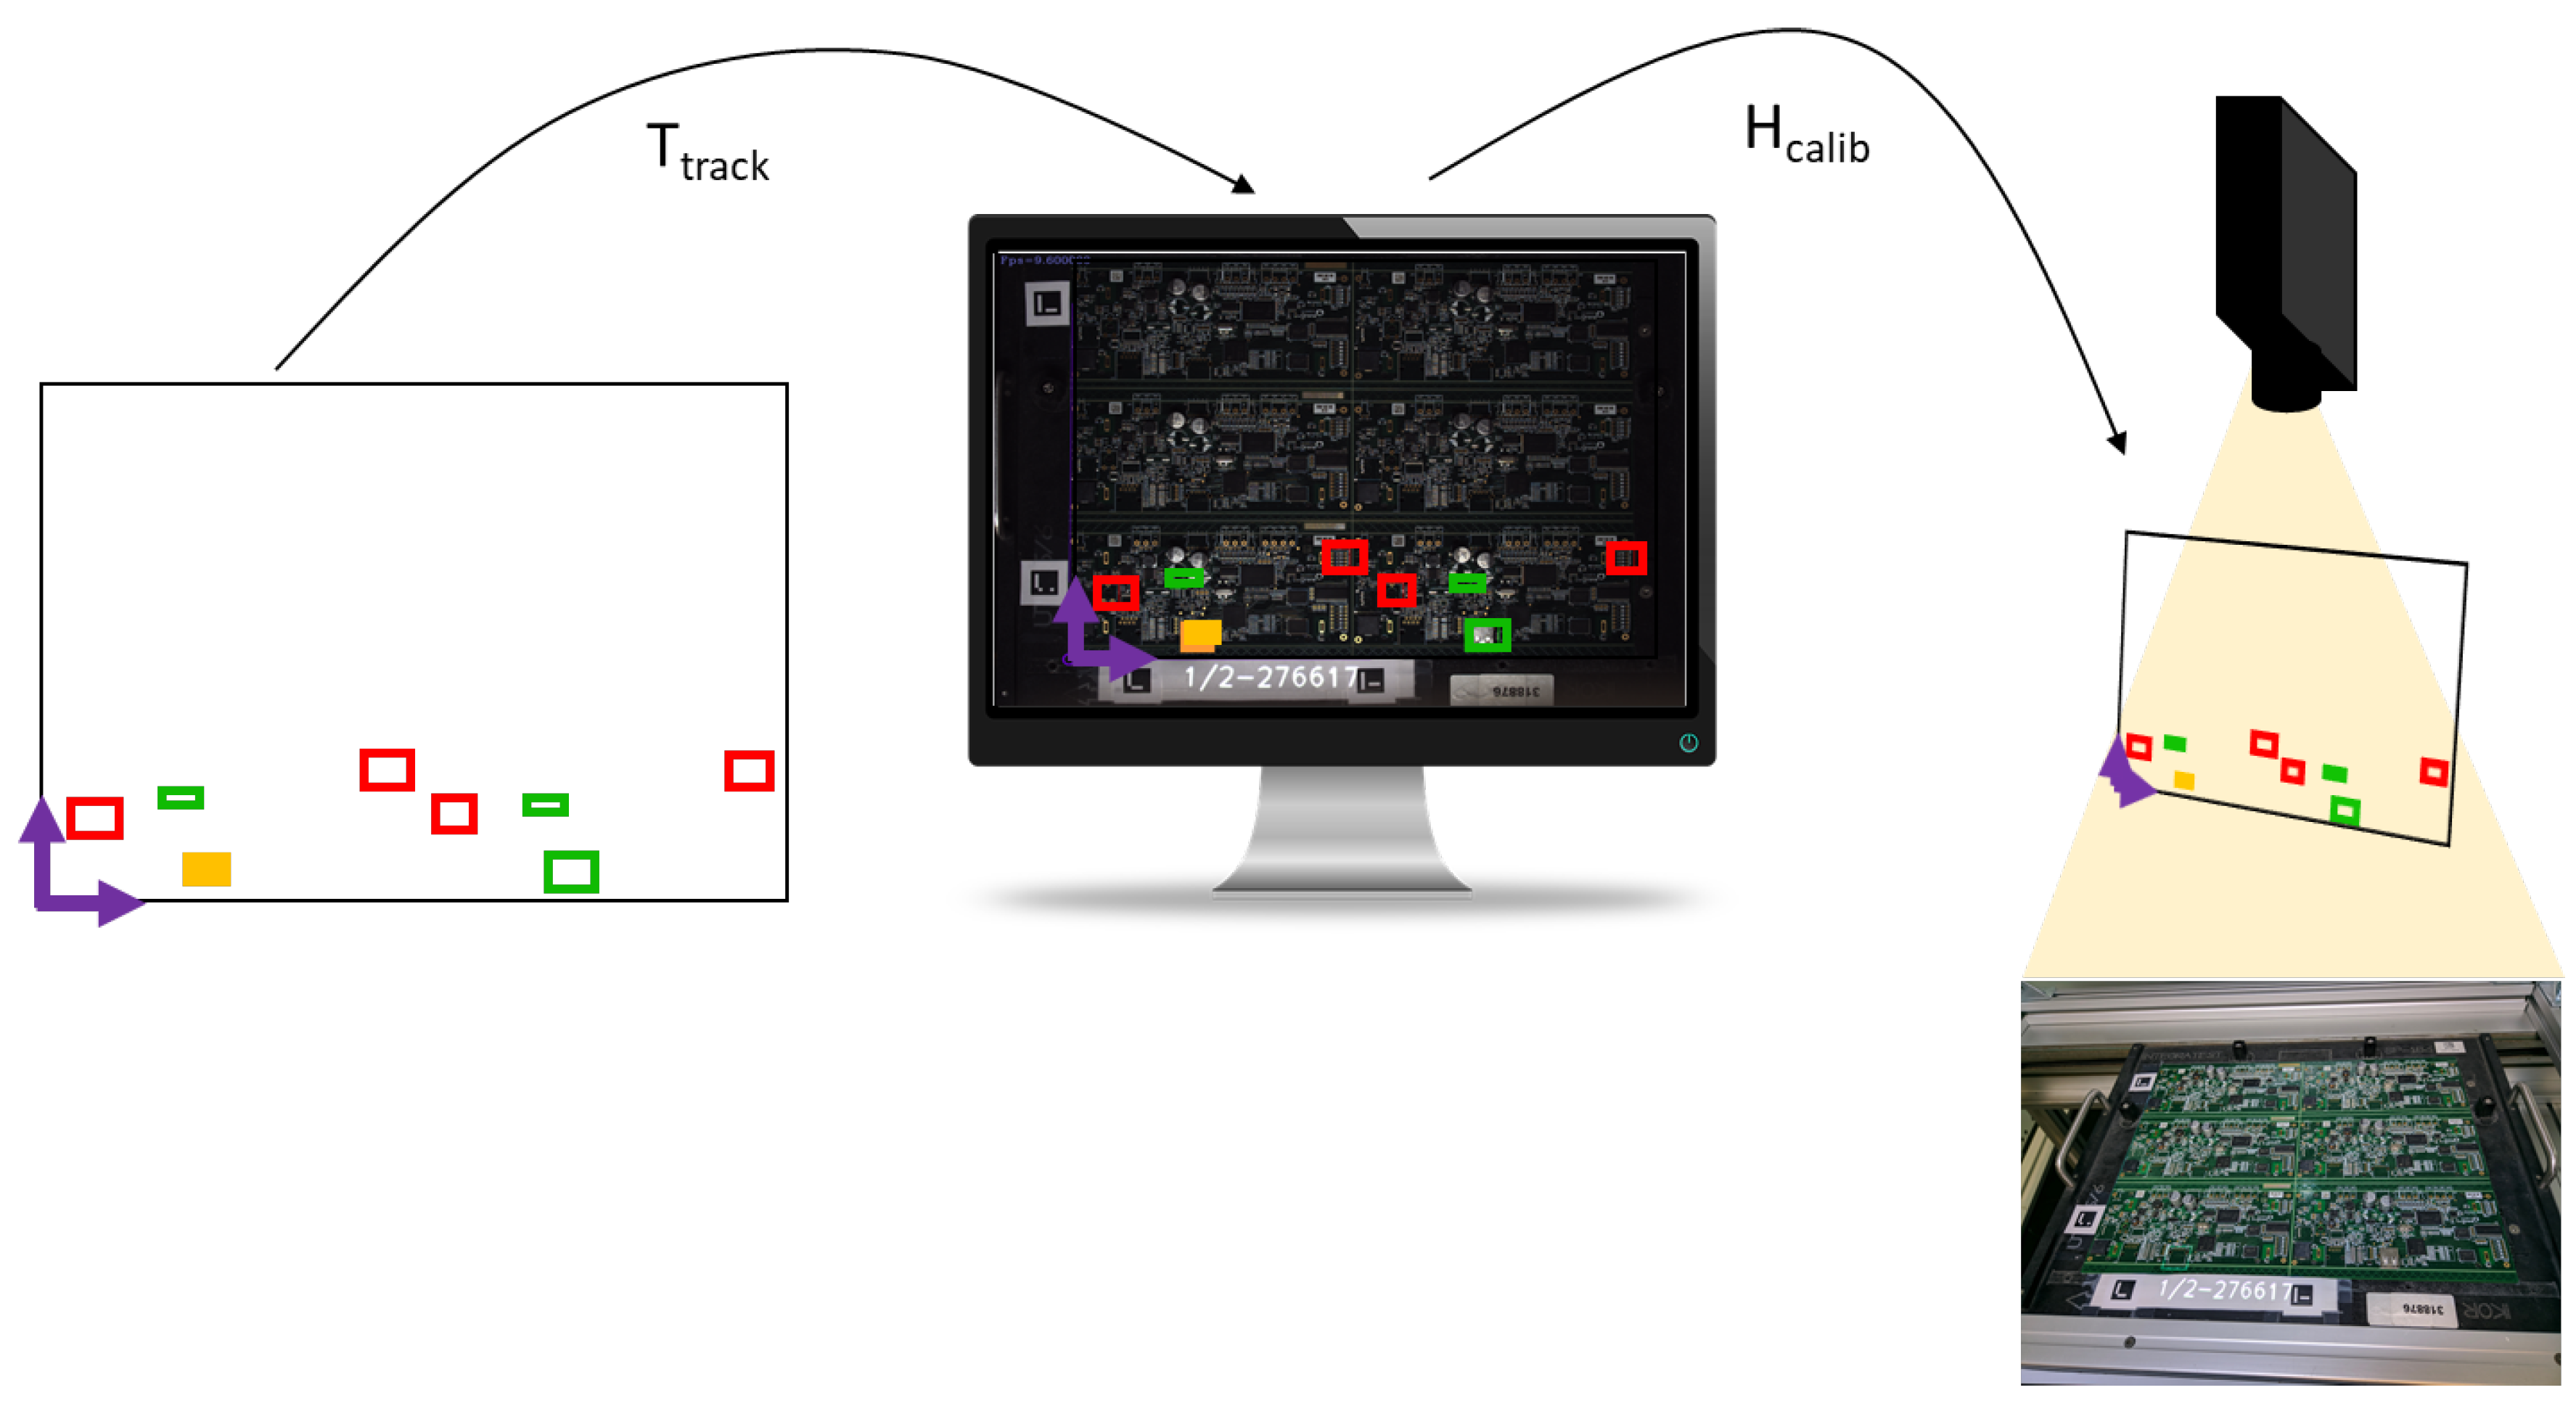
3.6.2. Virtual Content Projection
In the proposed projection mapping pipeline (
Figure 5), as stated in the previous subsection, first, the virtual content is transferred to the camera image using the camera tracking data (
,
Section 3.3), which creates the view that is displayed in the screen. Then, this content, which is already referenced with respect to the camera image coordinate system, is again transformed using the camera–projector calibration (
,
Section 3.6.1) to the projector image area that is subsequently projected. Thus, to project any content, we define its location in the reference 2D coordinate system of the board and then we apply the chain rule, which can be represented conceptually by
.
In our application, we decided to project the following information (
Figure 6), which answers three simple questions that are very useful for operators:
“Where?”: The place where the operator has to assemble the current electronic component, which is highlighted with the projection of a white flicking rectangle.
“What?”: The reference number of the electronic components that must be assembled in the current step.
“How many?”: The number of the current electronic components that have already been assembled regarding the total number to be assembled. A fraction “” is projected, where i is the number of current components already assembled from the total of j.
The projection of “What?" and “How many?" is located at the border frame (
Figure 6), outside the electronic board, as this area is not used for anything and it offers good visibility. The projection of “Where?" on the other hand, is superimposed on the real position that corresponds to the inside the electronic board (
Figure 6). This was not an appropriate area to get good contrast due to the material of the PCB and the limited power of the projector that was used, so we opted to flick the projection to capture the operator’s visual attention, and, consequently, improve its visibility. This has been proven as a good solution, since the result of the usability test was positive (
Section 4). A sample of the system performance can be seen in the
Supplementary Video S1.
4. Usability Test
With the aim of evaluating the benefits of the AR extension compared to the previous system, a system usability scale (SUS) survey was made, which compares the usability between the two systems. On one hand, the original system presented in [
22], where instructions are only displayed on the screen. On the other hand, the proposed system, where instructions are displayed both in the screen and on the board directly via the projector. SUS survey is a ten-item scale test giving a global view of subjective assessments of usability [
27], which is used as a standard survey for usability tests.
The proposed test consists of mounting the same PCB with the aid of both solutions, the original and the proposed ones, wherein every mounted process is timed and the number of mounting errors is measured. Finally, the SUS test was completed.
A total of 21 people were surveyed. They were between 20–45 years old; there were 15 men and six women, one of them color-blind. They did not have any experience in PCB assembly. This was done in order to emulate a newcomer to the production line, since rotation of personnel is common. The test was performed in a laboratory where a replica of the manufacturing production workspace was located.
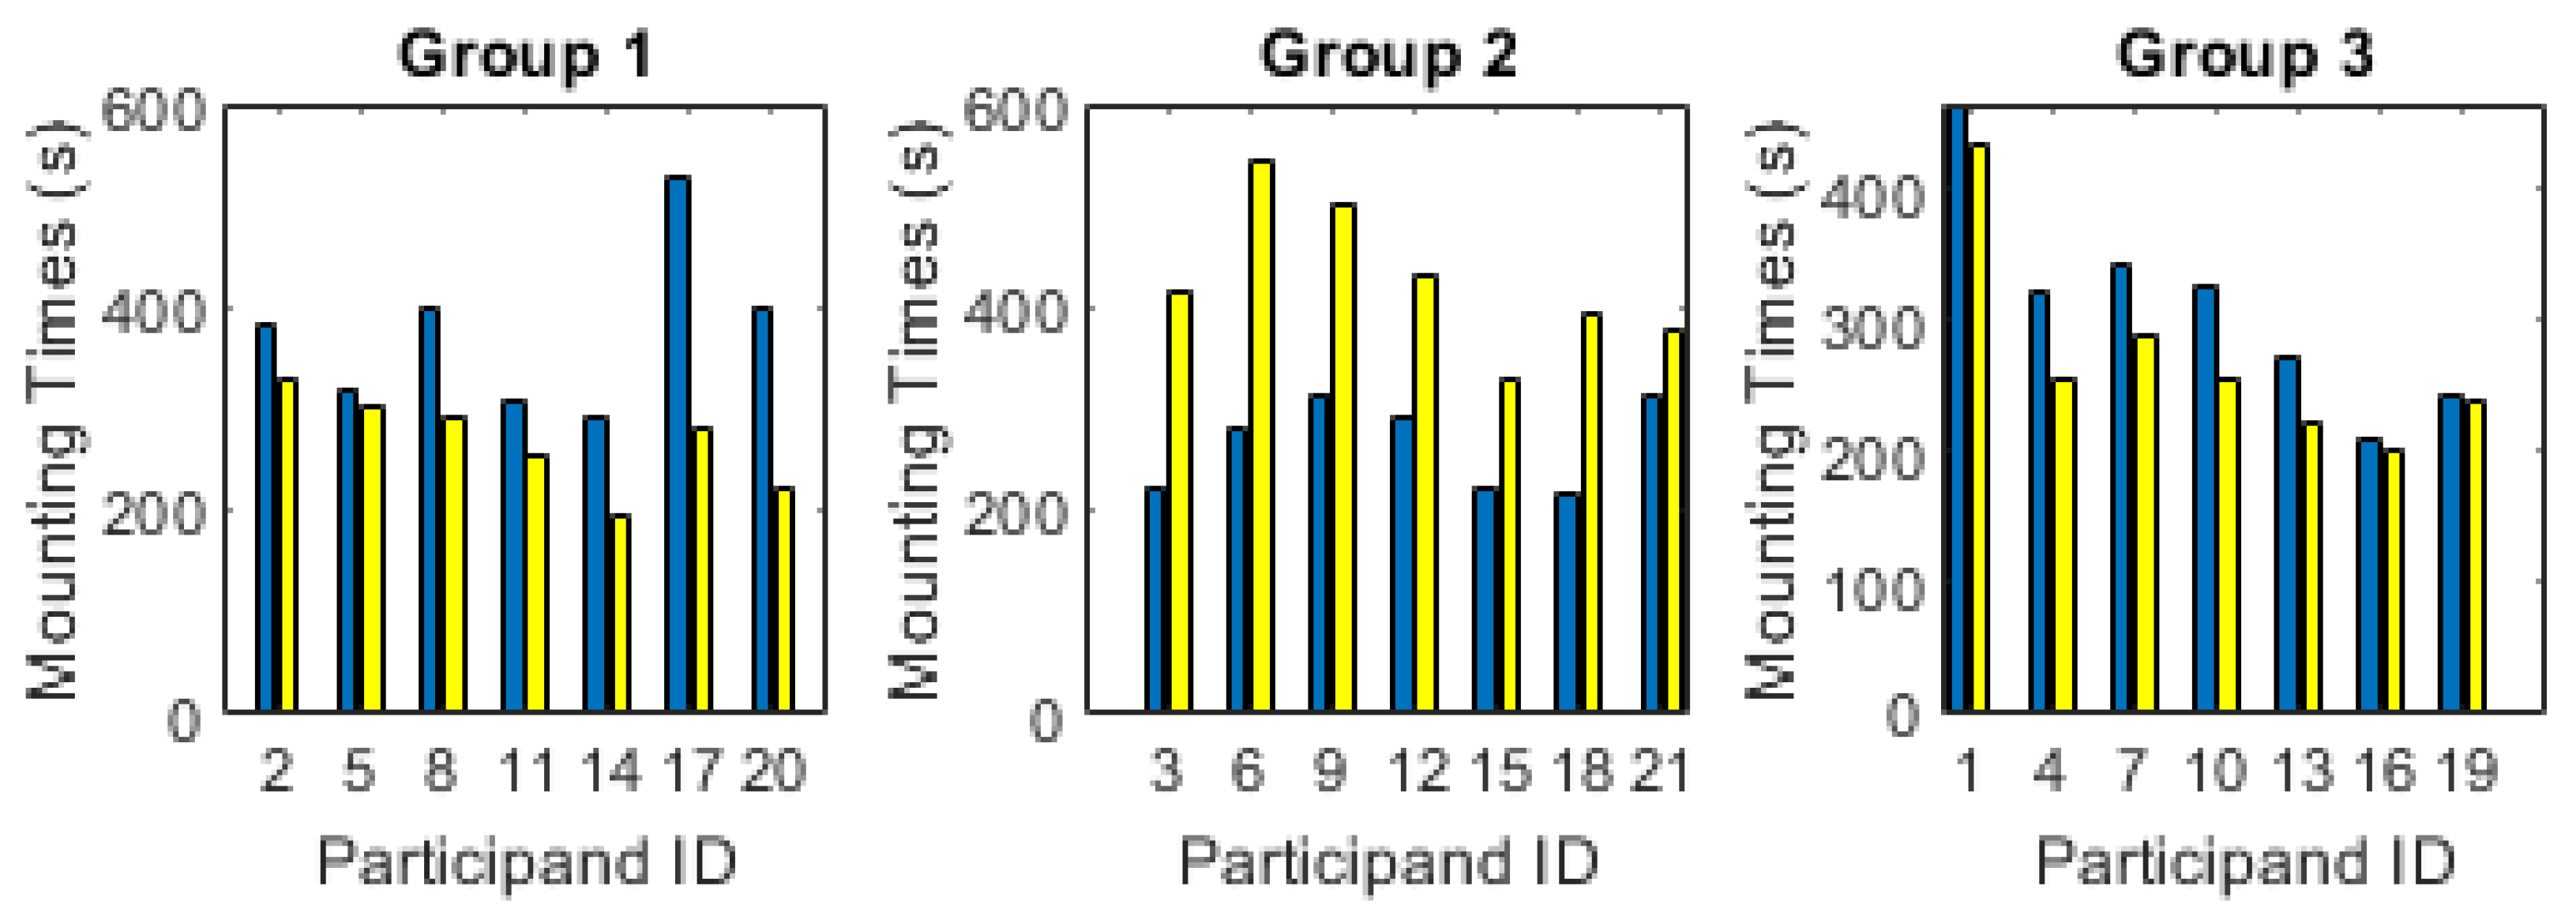
They were divided into three groups: seven participants for each group. Group 1 used the original system in the first place and later the proposed one. Contrarily, Group 2 used the proposed system first and original system second. Groups 1 and 2 did not have any experience mounting the electronic board; thus, it was fair to assume that the first mounting would take longer than the second, as the users had more experience for the second mounting. For this reason, Group 3 was created. This group had already mounted the PCB using a different solution, so they already had some knowledge of the PCB when using both processes. This grouping was done in order to measure time efficiency among processes, but it did not have any impact from the usability point of view.
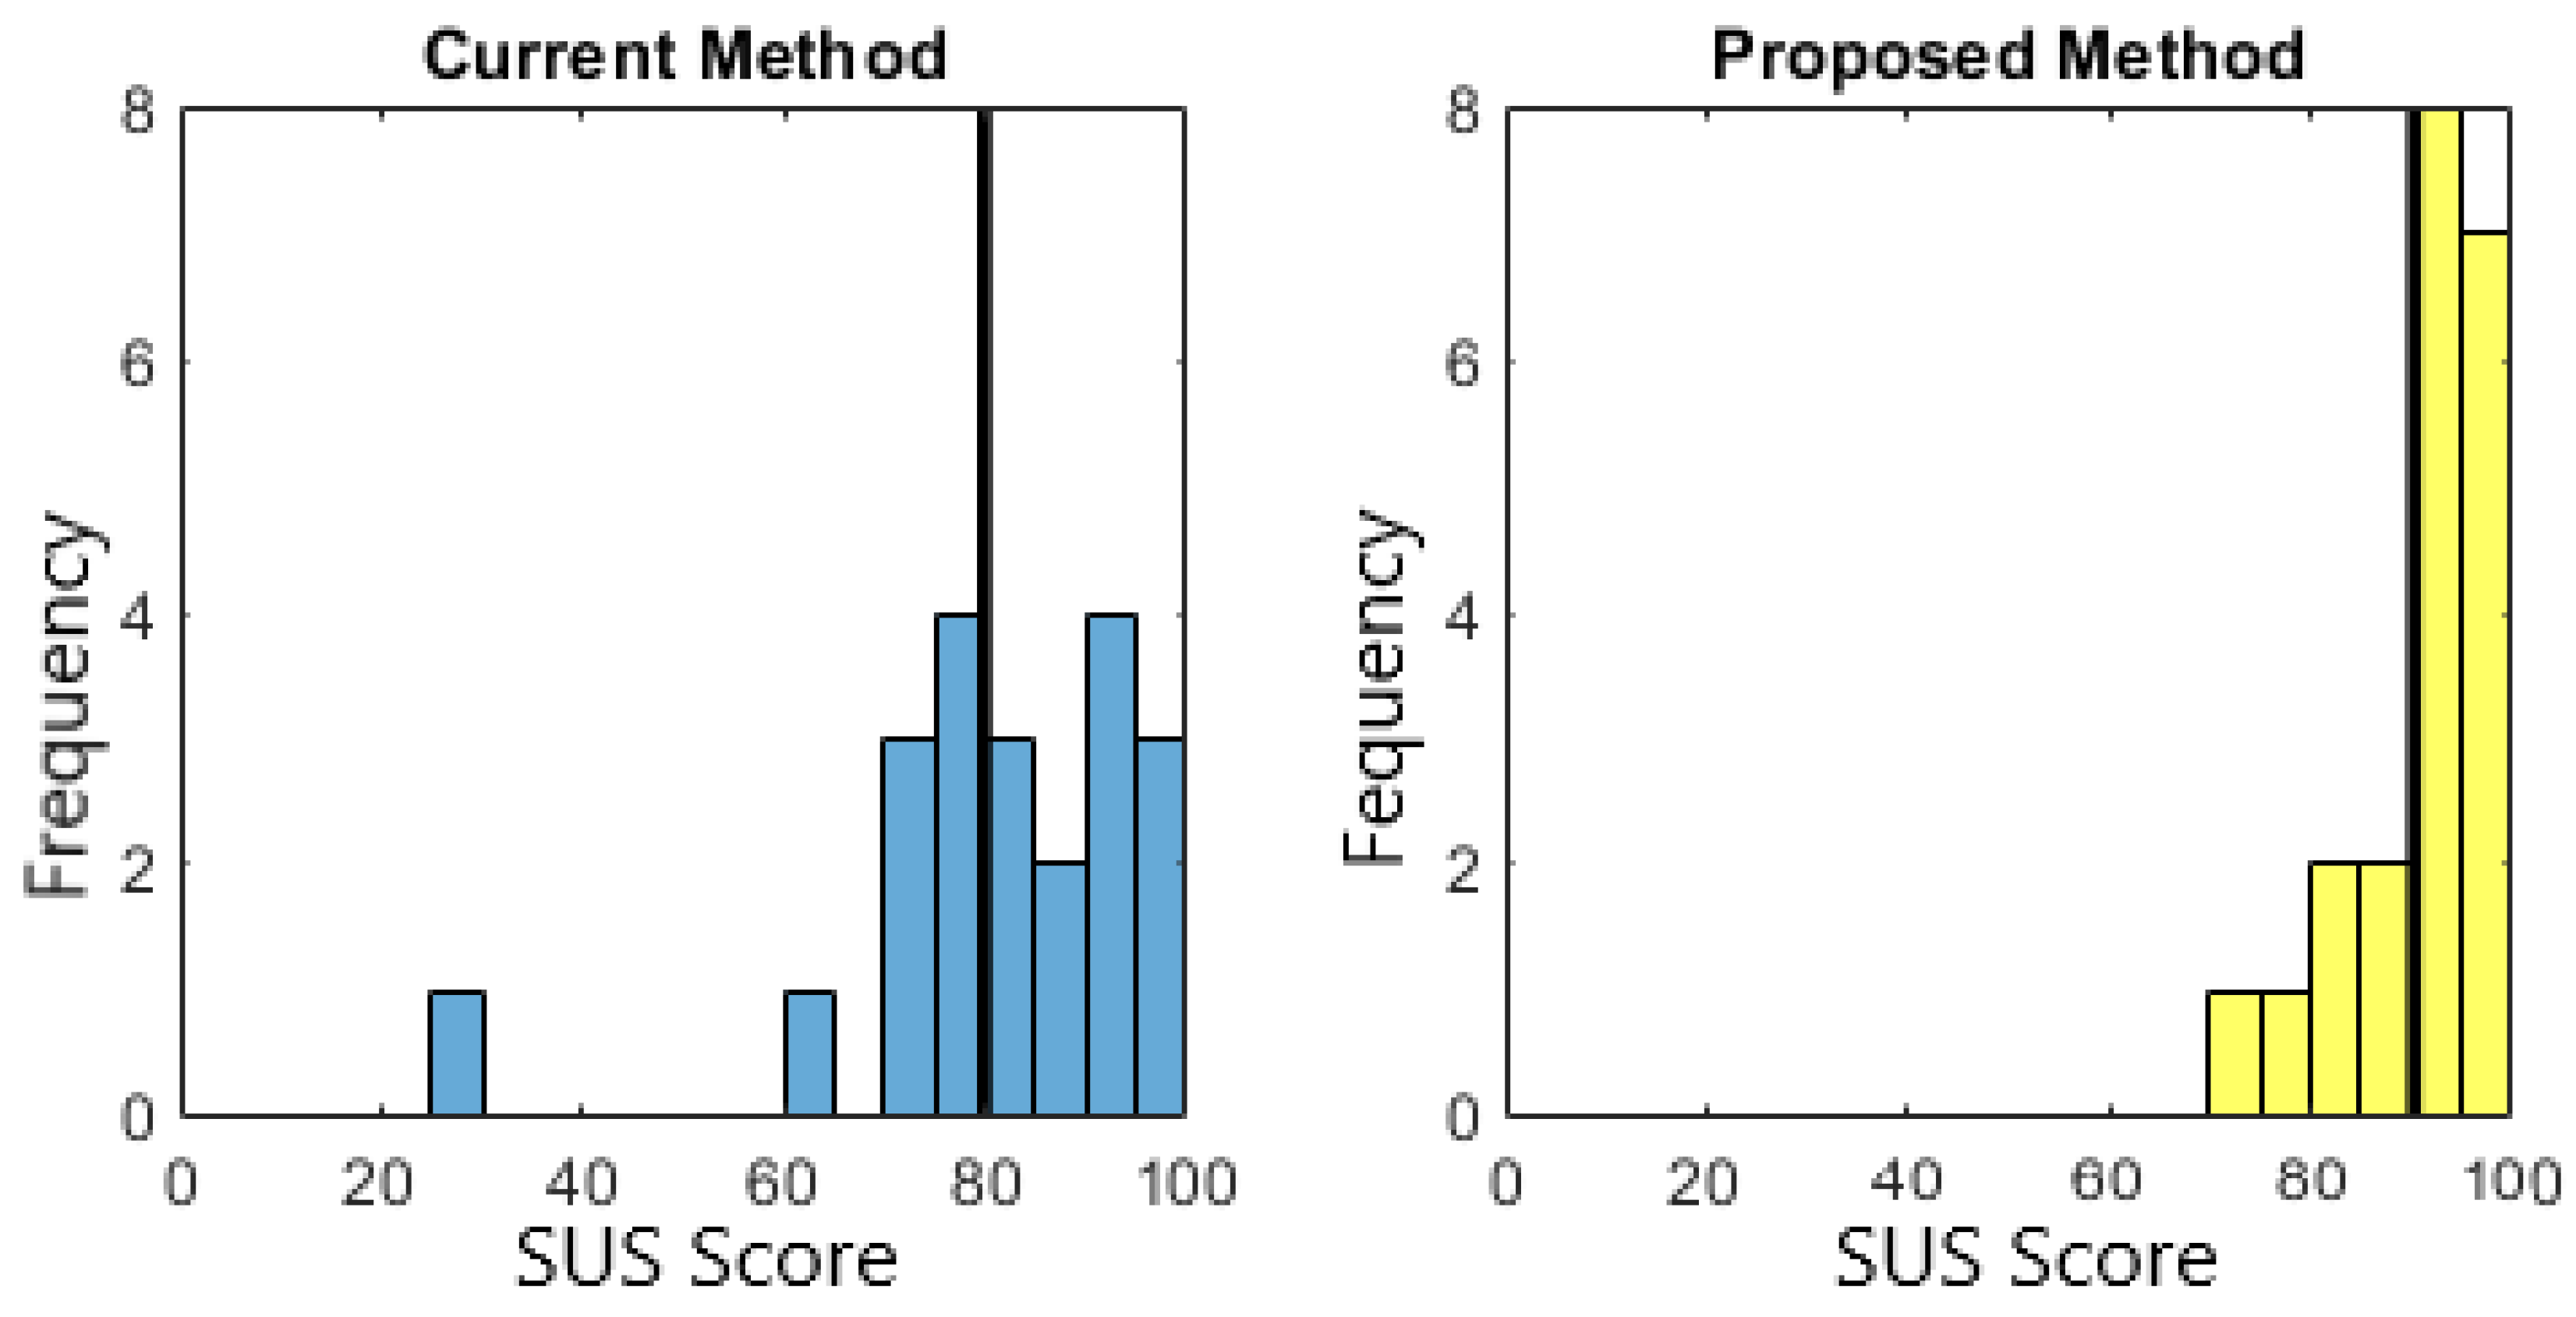
Figure 7 displays the SUS scores. The higher the score, the more usable the systems is. The systems achieved average values of 80 and 90 out of 100, respectively. Although a SUS score interpretation is not straightforward, Bangor et al. [
28] concluded that any system above 68 can be considered usable; he also proposed an adjective scale, where a mean SUS score of around 70 is considered good, one around 85.5 is considered excellent and one around 90.9 is referred as the best imaginable. Thus, both systems are highly usable, but the use of augmented reality is preferable.
As mentioned, mounting times were measured in order to get some objective insights about system efficiency; see
Figure 8. As predicted, for Groups 1 and 2, the first mounting was usually the more time consuming one. However, for Group 3, where participants started both mountings with the same experience, the proposed solution yielded lower mounting times for all participants. In addition, the feedback provided by the two systems prevented the users from making any errors.
These results show that the AR system is even faster and more comfortable than the previous system. From the users’ comments, it can be deduced that both velocity and comfort are increased because the user only needs to look and focus on the board, instead of changing their focus between screen and board, thereby helping the operator to maintain the same posture. Moreover, the direct projection onto the board allows the operator to find placing location easier, saving operational time and reducing placement errors. The system was also validated by experienced workers of the manufacturing company, who also pointed out the enhancement provided by the projection mapping. In [
22], the usability of the only-screen system is compared with the traditional system used by the manufacturer; the system proposed achieved a much higher satisfaction levels than the traditional system. Therefore, the AR extension is also much more usable than the traditional system.
5. Discussion
We propose to use direct projection in the workspace for improving user satisfaction and at the same time reducing assembly errors. The previous section shows that operators actually find the system more usable, feel more secure with it and require less time to do their tasks. A further advantage is that operators requires less training time, as the system gives assistance throughout the assembly. Moreover, this system allows the production managers to have traceability of the most complex components or PCBs to be assembled. This enables them to take further measures for ensuring operator satisfaction while also optimizing production because of the reduction of potential errors.
To guarantee that the projection-based solution is effective, the illumination conditions of the workspace have to be considered. The ambient light cannot be strong, so that the light emitted by the projector is predominant and the projected content is shown with contrast and sharpness. A balance must be achieved between a valid ambient light for object detection (electronic components in our case) and light that does not defeat the visibility of the projector. Similarly, it is preferable to work on non-specular surfaces, so that no brightness is generated that hinders the visibility of the projection. In our scenario, we had to deal with this difficulty, since PCBs are specular, and therefore, we had to use more sophisticated visualization techniques to capture the operator’s attention (flickering).
In the use case presented in this paper (assembly small electronic components in a PCB) we have not had problems with hidden areas of projection. These areas appear when an object that is in the workspace and in front of the projector has large dimensions and occludes the area behind it. Thus, the rays emitted by the projector cannot reach this area, and therefore, it is not possible to project content in this zone. To solve this limitation, a multiprojector configuration should be used.
6. Conclusions and Future Work
Despite the improvements in the last few decades, the use of augmented reality in industry has not been extended yet due to several reasons, including ergonomics, visual fatigue, content creation, the lack of IT infrastructure, etc. [
29]. In fact, ergonomics is the main obstacle for AR glasses; thus, projection based AR systems have been positioned as the alternative because they project data directly in the workspace, leaving the operator’s hands free and avoiding discomfort due to motion sickness or vergence-accommodation conflicts [
14].
The fast adoption of new, advanced ITC-related technologies such as cloud computing and augmented reality by the manufacturing sector is having a real positive impact in several terms, such as increasing flexibility, productivity and efficiency. In this paper, we propose integrating an AR system to support operators during the manual assembly of electronic components for improving workers’ ability to adapt to very variable production conditions. Our results show that, compared with the old procedure, with the new system the operators generate less errors, especially when they face a new PCB they have not assembled before. In addition, they feel more comfortable because they know that there is an additional system that ensures that their work is being done correctly. In the future, we plan to implement some additional features, such as one to verify the polarity; i.e., the orientations of some components. Also, we plan to evaluate the impact of using deep learning approach for recognizing components in order to increase robustness against severe illumination changes.
Author Contributions
Conceptualization, I.S. and I.B.; Formal analysis, M.O.; Funding acquisition, D.A. and L.Q.; Investigation, M.O. and H.A.; Methodology, I.S.; Resources, D.A.; Software, M.O., H.A. and I.S.; Validation, F.A.S.; Writing–original draft, H.A.; Writing–review and editing, M.O. and F.a.S. All authors have read and agreed to the published version of the manuscript.
Funding
We would like also to thanks to SPRI agency for founding the SIRA applied research project under the Hazitek 2018 calls, where the research described in this paper was carried on.
Acknowledgments
We would like to thank the expert operators of Ikor for doing the user evaluation tests. We also thank Sara Garcia for her help in generating multimedia content.
Conflicts of Interest
The authors declare no conflict of interest.
References
- Posada, J.; Toro, C.; Barandiaran, I.; Oyarzun, D.; Stricker, D.; De Amicis, R.; Pinto, E.B.; Eisert, P.; Döllner, J.; Vallarino, I. Visual Computing as a Key Enabling Technology for Industrie 4.0 and Industrial Internet. IEEE Comput. Graph. Appl. 2015, 35, 26–40. [Google Scholar] [CrossRef] [PubMed]
- Romero, D.; Stahre, J.; Wuest, T.; Noran, O.; Bernus, P.; Fast-Berglund, Å.; Gorecky, D. Towards an operator 4.0 typology: A human-centric perspective on the fourth industrial revolution technologies. In Proceedings of the International Conference on Computers and Industrial Engineering (CIE46), Tianjin, China, 29–31 October 2016. [Google Scholar]
- Segura, A.; Diez, H.; Barandiaran, I.; Arbelaiz, A.; Álvarez, H.; Simões, B.; Posada, J.; García-Alonso, A.; Ugarte, R. Visual computing technologies to support the Operator 4.0. Comput. Ind. Eng. 2018. [Google Scholar] [CrossRef]
- De Lacalle, L.N.L.; Posada, J. Special Issue on New Industry 4.0 Advances in Industrial IoT and Visual Computing for Manufacturing Processes. Appl. Sci. 2019, 9, 4323. [Google Scholar] [CrossRef] [Green Version]
- Palmarini, R.; Erkoyuncu, J.; Roy, R.; Torabmostaedi, H. A systematic review of augmented reality applications in maintenance. Robot. Comput.-Integr. Manuf. 2018, 49, 215–228. [Google Scholar] [CrossRef] [Green Version]
- Hahn, J.; Ludwig, B.; Wolff, C. Augmented reality-based training of the PCB assembly process. In Proceedings of the 14th International Conference on Mobile and Ubiquitous Multimedia, Linz, Austria, 30 November–2 December 2015; Volume 46, pp. 395–399. [Google Scholar]
- Sanna, A.; Manuri, F.; Lamberti, F.; Member, S.; Paravati, G.; Pezzolla, P. Using handheld devices to support augmented reality-based maintenance and assembly tasks. In Proceedings of the IEEE International Conference on Consumer Electronics, Las Vegas, NV, USA, 9–12 January 2015; pp. 178–179. [Google Scholar]
- Wang, X.; Ong, S.K.; Nee, A. Real-virtual components interaction for assembly simulation and planning. Robot. Comput.-Integr. Manuf. 2016, 41, 102–114. [Google Scholar] [CrossRef]
- Webel, S.; Engelke, T.; Peveri, M.; Olbrich, M.; Preusche, C. Augmented Reality Training for Assembly and Maintenance Skills. BIO Web Conf. 2011, 1, 00097. [Google Scholar] [CrossRef] [Green Version]
- Yuan, M.; Ong, S.K.; Nee, A. Augmented reality for assembly guidance using a virtual interactive tool. Int. J. Prod. Res. 2008, 46, 1745–1767. [Google Scholar] [CrossRef]
- InspectAR. Available online: https://www.inspectar.com (accessed on 10 December 2019).
- Neumann, U.; Majoros, A. Cognitive, performance, and systems issues for augmented reality applications in manufacturing and maintenance. In Proceedings of the IEEE 1998 Virtual Reality Annual International Symposium, Atlanta, GA, USA, 14–18 March 1998; pp. 4–11. [Google Scholar]
- Bimber, O.; Raskar, R. Spatial Augmented Reality Merging Real and Virtual Worlds; A.K. Peters: Natick, MA, USA, 2005. [Google Scholar]
- Posada, J.; Zorrilla, M.; Dominguez, A.; Simões, B.; Eisert, P.; Stricker, D.; Rambach, J.; Dollner, J.; Guevara, M. Graphics and Media Technologies for Operators in Industry 4.0. IEEE Comput. Graph. Appl. 2018, 38, 119–132. [Google Scholar] [CrossRef] [PubMed]
- Alvarez, H.; Lajas, I.; Larrañaga, A.; Amozarrain, L.; Barandiaran, I. Augmented reality system to guide operators in the setup of die cutters. Int. J. Adv. Manuf. Technol. 2019, 103, 1543–1553. [Google Scholar] [CrossRef]
- Kern, J.; Weinmann, M.; Wursthorn, S. Projector-based Augmented Reality for quality inspection of scanned objects. ISPRS Ann. Photogramm. Remote Sens. Spat. Inf. Sci. 2017, IV-2/W4, 83–90. [Google Scholar] [CrossRef] [Green Version]
- Korn, O.; Funk, M.; Schmidt, A. Design Approaches for the Gamification of Production Environments: A Study Focusing on Acceptance. In Proceedings of the 8th ACM International Conference on Pervasive Technologies Related to Assistive Environments, Corfu, Greece, 1–3 July 2015; pp. 1–7. [Google Scholar]
- Rodriguez, L.; Quint, F.; Gorecky, D.; Romero, D.; Siller, H.R. Developing a Mixed Reality Assistance System Based on Projection Mapping Technology for Manual Operations at Assembly Workstations. Procedia Comput. Sci. 2015, 75, 327–333. [Google Scholar] [CrossRef] [Green Version]
- Sand, O.; Büttner, S.; Paelke, V.; Röcker, C. smARt. Assembly—Projection-Based Augmented Reality for Supporting Assembly Workers. In Proceedings of the 8th International Conference Virtual, Augmented and Mixed Reality, Toronto, ON, Canada, 17–22 July 2016; pp. 643–652. [Google Scholar]
- Manuri, F.; Pizzigalli, A.; Sanna, A. A State Validation System for Augmented Reality Based Maintenance Procedures. Appl. Sci. 2019, 9, 2115. [Google Scholar] [CrossRef] [Green Version]
- Simões, B.; De Amicis, R.; Barandiaran, I.; Posada, J. X-Reality System Architecture for Industry 4.0 Processes. Multimodal Technol. Interact. 2018, 2, 72. [Google Scholar] [CrossRef] [Green Version]
- Ojer, M.; Serrano, I.; Saiz, F.; Barandiaran, I.; Gil, I.; Aguinaga, D.; Alejandro, D. Real-Time Automatic Optical System to Assit Operator in the Assembling of Electronic Components. Int. J. Adv. Manuf. Technol. 2019, in press. [Google Scholar]
- Rother, C.; Kolmogorov, V.; Blake, A. “GrabCut“: Interactive Foreground Extraction Using Iterated Graph Cuts. ACM Trans. Graph. 2004, 6, 309–314. [Google Scholar] [CrossRef]
- Zhang, Z. A flexible new technique for camera calibration.
- Romero Ramirez, J.; Muñoz Salinas, R.; Medina Carnicer, R. Speeded up detection of squared fiducial markers. Image Vis. Comput. 2018, 76, 38–47. [Google Scholar] [CrossRef]
- Moreno, D.; Taubin, G. Simple, Accurate, and Robust Projector-Camera Calibration. In Proceedings of the Second International Conference on 3D Imaging, Modeling, Processing, Visualization and Transmission, Zurich, Switzerland, 13–15 October 2012; pp. 464–471. [Google Scholar]
- Brooke, J. SUS: A quick and dirty usability scale. Usability Eval. Ind. 1996, 189, 4–7. [Google Scholar]
- Bangor, A.; Kortum, P.; Miller, J. Determining What Individual SUS Scores Mean: Adding an Adjective Rating Scale. J. Usabitily Stud. 2009, 4, 114–123. [Google Scholar]
- Martinetti, A.; Marques, H.; Singh, S.; Dongen, L. Reflections on the Limited Pervasiveness of Augmented Reality in Industrial Sectors. Appl. Sci. 2019, 9, 3382. [Google Scholar] [CrossRef] [Green Version]
© 2020 by the authors. Licensee MDPI, Basel, Switzerland. This article is an open access article distributed under the terms and conditions of the Creative Commons Attribution (CC BY) license (http://creativecommons.org/licenses/by/4.0/).


 ,
, 


