Abstract
The reliability in data collection is essential in Smart Farming supported by the Internet of Things (IoT). Several IoT and Fog-based works consider the reliability concept, but they fall short in providing a network’s edge mechanisms for detecting and replacing outliers. Making decisions based on inaccurate data can diminish the quality of crops and, consequently, lose money. This paper proposes an approach for providing reliable data collection, which focuses on outlier detection and treatment in IoT-based Smart Farming. Our proposal includes an architecture based on the continuum IoT-Fog-Cloud, which incorporates a mechanism based on Machine Learning to detect outliers and another based on interpolation for inferring data intended to replace outliers. We located the data cleaning at the Fog to Smart Farming applications functioning in the farm operate with reliable data. We evaluate our approach by carrying out a case study in a network based on the proposed architecture and deployed at a Colombian Coffee Smart Farm. Results show our mechanisms achieve high Accuracy, Precision, and Recall as well as low False Alarm Rate and Root Mean Squared Error when detecting and replacing outliers with inferred data. Considering the obtained results, we conclude that our approach provides reliable data collection in Smart Farming.
1. Introduction
The Internet of Things (IoT) has emerged as a suitable technology to collect and transmit data in different domains [1] ranging from agriculture [2], cities [3], and transportation [4] to smart-homes [5]. Reliability is necessary for data collection to guarantee the effectiveness of IoT-based services. Making decisions based on inaccurate data can negatively impact the quality of crops and, consequently, lead to losing money. Several failures affect IoT data collection: (i) random errors by lack of sensor reading repeatedly (e.g., scatter in the measured data), (ii) spurious reading (i.e., non-systematic reading errors) by a fake measure when some sporadic physical events happen (e.g., if a camera flash triggers when measuring light intensity); and (iii) systematic errors such as calibration, loading errors, and environmental errors [6]. These failures cause anomalies or outliers, avoiding reliability in data collection and the good decision-making of end-users (e.g., farmers).
In Smart Farming (SF), not all data go to the Cloud, nor do all applications operate in a Cloud style. Note that in developing countries the Internet connectivity is still constrained. Some data and applications must operate in the Fog Tier. For instance, SF applications can process data or deliver meaningful information to trigger rain and temperature alarms for crops that are too sensitive to climate variations. Thus, SF applications need to work with reliable data in the Fog Tier. These applications would not be useful to the farmer if they operate with unreliable data since it would cause the farming stakeholders to make wrong decisions that, in turn, would affect the yield and control of crops.
In the literature, Refs. [7,8,9,10,11,12,13,14] considered the reliability in IoT and IoT-based SF applications, but they did not exploit the capabilities provided by Fog Computing (FC) for accomplishing data reliability. FC provides computation, storage, and networking resources closer to end-devices, which allows facing the limitations of IoT applications supported in the Cloud Computing [15,16]. In developing countries, the SF applications that operate directly at Cloud suffer Internet constraints, outages, or connectivity issues. Such issues will not be present if a Fog Tier is used. Refs. [17,18,19,20,21,22,23,24,25] managed reliability in FC-based IoT by using optimization, self-adaptability, and redundancy techniques; these investigations did not include mechanisms for outliers detection and data inference for reliability purposes. Refs. [26,27,28] introduced methods to detect anomalies in datasets without considering an SF environment based on FC and IoT. Ref. [29] proposed mechanisms for detecting and handling outliers by interpolation; this work did not consider FC-and-IoT-based SF.
This paper proposes an approach intended to provide data collection reliability in Things-based SF, which focuses on outlier detection and treatment. Our proposal includes a conceptual Things-Fog-Cloud based architecture that incorporates mechanisms for detecting and treating outliers. The Failure Detection Mechanism (FDM) finds outliers in datasets by Machine Learning (ML) algorithms. The Failure Recovery Mechanism (FRM) replaces the identified outliers with data inferred by using interpolation techniques. Our approach is novel because there is no approach based on ML and interpolation techniques, to the best of our knowledge, aimed to provide data reliability to Things-Fog-Cloud-based SF applications that support decision-making to farming stakeholders. We evaluate our approach by deploying the three Tiers-based architecture in a Colombian coffee smart farm. We run the FDM and FRM mechanisms at the Fog Tier over this real implementation to perform the data reliability testing. The datasets used in the case study contain real information about the coffee crop temperature in different time scales (hour, day, and month) and, further, information about the data collection sensor technologies (Intel, Omicron, and Libelium). Results show our mechanisms achieve high Accuracy, Precision, and Recall as well as low False Alarm Rate (FAR) and Root Mean Squared Error (RMSE) when detecting and replacing outliers with inferred data. Considering the obtained results, we conclude that our approach provides reliable data collection in Smart Farming to support correct decision-making.
The main contributions of this paper are:
- An approach that introduces a Things-Fog-Cloud architecture that combines ML and Interpolation techniques to intelligently and automatically provide data reliability on SF applications.
- An ML-based mechanism for outlier detection in IoT-based Smart Farming data collection.
- An interpolation-based mechanism for replacing the outliers detected with inferred data.
- An extensive evaluation of the proposed approach by a case study involving real data collected in a network based on a Things-Fog-Cloud and deployed in a Colombian Smart Coffee Farm.
2. Related Work
Table 1 summarizes research works on reliability, which considers the involvement of IoT, FC, SF, mechanisms for outliers detection, and mechanisms for data recovery when outliers happen.

Table 1.
Related work.
Refs. [7,8,9,10,11,12,13,14] introduced IoT applications, mostly in SF domains. These works focus on deploying specific applications such as monitoring for greenhouses, a control system for watering crops, and a system to minimize the use of fertilizer and pesticides. Although they highlight reliability as an essential feature for IoT-based SF, they did not design their solutions from a reliability perspective. Refs. [17,18,19] managed reliability in FC-based IoT by using optimization, self-adaptability, and re-transmission techniques. Nevertheless, none of these works included failure data detection and data recovery mechanisms to provide reliability in SF scenarios. Refs. [20,21,22,23,24,25] introduced novel IoT-based SF applications using FC features, such as local processing, deploying control modules near the access network, minimizing the amount of data transferred to the cloud, and reducing delay. These works did not exploit the FC capabilities for data reliability improvement. Refs. [26,27,28] introduced mechanisms to detect anomalies in datasets. However, none of these works compared two or more methods for anomaly detection nor considered an SF environment based on FC and IoT. Ref. [29] proposed mechanisms for detecting and handling outliers by interpolation, but this work did not consider FC-and-IoT based-SF.
There is no approach based on ML and interpolation techniques, to the best of our knowledge, aimed to provide data reliability to IoT-Fog-Cloud-based SF applications that support decision-making to farming stakeholders. Our approach seeks to address the shortcomings mentioned above by introducing a Fog-based and reliability-oriented architecture that incorporates a mechanism for detecting outliers in data and another mechanism for handling them to offer reliable data. In addition, it is to highlight that our approach operated with data collected in a real SF scenario.
3. Approach for Reliable Data Collection in IoT-Based Smart Farming
This section introduces a motivation scenario, the proposed reliability-oriented and Fog-based architecture, the Failure Detection Mechanism, and the Failure Recovery Mechanism.
3.1. Motivation
Let us consider a Smart Coffee Farm as a scenario involving various IoT devices, such as network-connected weather stations and wireless sensors. These IoT devices collect significant and heterogeneous data about the environment and the coffee crop. These data are the primary input for IoT-based applications like data analysis to predict coffee production, traceability to track the coffee source, alarm to inform about variables out of normal ranges, and irrigation systems [30,31]. Since a coffee farmer makes decisions based on the information that applications provide, data supporting them must be reliable. For instance, if the weather variables’ monitoring system fails due to information loss during the data collection, the coffee production estimation may be inaccurate. This problem may affect farmers’ annual schedules, avoiding a suitable organization of resources, storage space, and recruitment. In addition, if a coffee quality variable gets outside the range of the standard parameters, such as pH levels at the fermentation phase, the coffee may not achieve exportation quality. This issue may cause the farmer to lose much money (approximately USD 1000 per hectare). Therefore, the data collection must be reliable, aiming to support the smart coffee farm proper operation.
Considering the above scenario, we argue that the Things-Fog-Cloud continuum requires new ways to ensure reliable delivery of data retrieved by IoT-based devices for guaranteeing the proper operation of applications located at the Fog and Cloud tiers. In this sense, the approach proposed in this paper is more full-fledged than the ones presented in Section 2 because it includes a reliability-oriented and Fog-based architecture that incorporates mechanisms for detecting outliers and inferring data to recovering from them in the data collection process.
3.2. Reliable Fog Computing-Based Architecture
A Fog hierarchical architecture includes three tiers called Cloud, Fog, and Things [32]. The Cloud Tier comprises one or more Data Centers for providing services that consume many computational resources (e.g., big data analysis). The Fog Tier includes Fog Nodes (FNs). An FN is any physical or virtual entity (e.g., routers, switches, wireless access points, video surveillance cameras, controllers, and servers) that improves the interaction between the Things Tier and Cloud Tier to enhance IoT-based services, such as data collection based on wireless sensors, tracking systems, and, in general, delay-sensitive applications. The Things Tier consists of IoT-enabled devices including sensor nodes. This Tier is responsible for interacting with the environment and sending data to the Fog Tier [33].
Figure 1 presents our Fog-based and reliability-oriented architecture. Unlike the traditional Fog-based architectures [34,35], our architecture separates the Fog Tier into two layers: categorizing resources in layers depending on domain requirements leads to improve IoT reliability by properly locating management services [36]. As making decisions with reliable data are pivotal for IoT-based applications, we locate FDM and FRM mechanisms in Layer 2 FN because it is closest to the IoT devices. In this way, we avoid applications running on upper Tiers operate with inaccurate data. Note that outliers in collected data can negatively impact statistical analysis and the accuracy in estimation and forecasting models of harvest, leading to making wrong decisions and, consequently, lost money. Then, Layer 2 FN comprises several edge computing nodes that collect data from IoT devices and host our reliability-targeted mechanisms. FDM is to detect outliers (see Section 3.3), while FRM is to infer correct values for replacing the detected outliers (see Section 3.4). Layer 1 includes Fog Controllers (FCs) to coordinate the network tiers and perform preliminary data analytic because they have more processing, storage, and networking resources than Layer 2 FN.
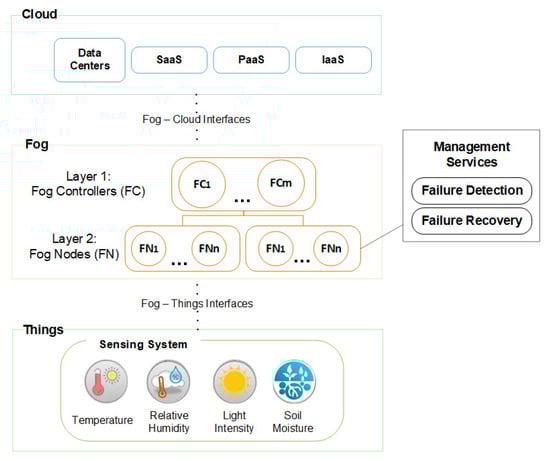
Figure 1.
Fog hierarchical architecture.
3.3. Failure Detection Mechanism
FDM aims at identifying and isolating outliers from correct data. These outliers can happen by failures, such as a sensor with a damaged battery and incorrect reading. The main benefits of detecting outliers in the Fog Tier are: characterizing normal and abnormal data for early treatment of outliers and ensuring data quality before using it in data analytics and forecasting applications. FDM receives data from sensors and identifies the data’s failures as outliers (i.e, an abnormal and extreme observation of data) using ML algorithms. FDM tags the outliers at the dataset. The dataset with these tagged outliers is the input to FRM.
FDM considers three well-known outlier detection techniques [37]: Clustering-based, Isolation-based, and Classification-based. Clustering-based approaches group similar data instances into clusters with the same behavior [38]. Data instances are identified as outliers if they do not belong to clusters or generate significantly smaller clusters than other ones. The dissimilarity measure between two data instances is the Euclidean distance. Isolation-based approaches focus on separating outliers from the rest of the data points instead of profiling normal ones [39]. Classification-based approaches learn a classification model using the set of data instances (training) and classify an unseen instance into one of the learned (normal/outlier) class (testing) [40].
For the Clustering-based approach, FDM uses the Density-Based Spatial Clustering of Applications with Noise (DBSCAN) due to it being a well-known and established grouping algorithm that does not need the desired number of clusters as K-means does [41]. DBSCAN groups the observations of a dataset into high and low-density clusters using a simplified minimum density level estimation based on distance radius named epsilon (esp), minimum points, and thresholds for the number of neighbors [42]. DBSCAN mainly needs two parameters: min_samples, and esp. With preliminary tests, we verify that varying the parameter min_samples does not affect the outliers detection performed by FDM due to the fact that we are considering the higher density cluster, such as the one with the correct values, and the other ones, such as clusters with outliers. The eps parameter controls the maximum distance between two samples. If eps is too small, FDM cannot cluster most data. If eps is too large, FDM can merge all clusters into a single one [43].
For the Isolation-based approach, we use the Isolation Forest (IF) algorithm that poses the ability to identify anomalies (outliers in our approach) from a dataset. This algorithm performs recursive random splits on attribute values’ generating trees [27] that can isolate any data point from the rest of the data. Random partitioning produces noticeably shorter paths for outliers. Hence, when a forest of random trees collectively produces shorter path lengths for particular samples, they have a high probability of being outliers [44]. For IF, the parameter of contamination defines the proportion of outliers in the dataset [44]. If the contamination is set too low than the real rate of outliers, the model will not detect them. If the parameter is set too high, the number of False Positives will increase.
For the Classification-based technique, we use the Support Vector Machine (SVM) to determine if an instance falling outside a boundary is an outlier [45]. SVM separates the data from different classes by fitting a hyperplane between them, which maximizes the separation [46]. In SVM, the parameter “nu” represents the fraction of outliers in the dataset. This parameter is analogous to the contamination parameter in IF. If nu is set up to a too low value than the actual number of outliers, the model will not detect all outliers. If it is set higher than the actual number of outliers, the model will detect false normal values as outliers.
3.4. Failure Recovery Mechanism
FRM infers data to replace outliers without losing significance in data, aiming to achieve reliability and, consequently, accurate models in IoT-based applications. Figure 2 depicts inputs and outputs in FRM. From a high-abstraction level, FRM operates as follows. It receives the dataset with the outliers tagged. Then, it removes and replaces them with data inferred by interpolation techniques. Finally, it delivers the corrected data to applications in the Things-Fog-Cloud continuum for further processing. These applications will be reliable regarding data due to the FDM and FRM operation.

Figure 2.
Data cleaning mechanisms to provide reliability.
FRM infers data to replace outliers by considering three algorithms: Cubic Spline, Linear, and Nearest Neighbor. Cubic Spline is an interpolation method that returns the straight line connecting data points with a polynomial function to obtain a continuous and smooth curve [47]. Linear interpolation is a curve fitting method using linear polynomials to construct new data points within the range of a discrete set of known data points [48]. Nearest Neighbor interpolation is a proximal interpolation method of multivariate interpolation in one or more dimensions used in image processing [49]. The Nearest Neighbor algorithm takes a rounded value of the expected position and finds the closest data value at the integer position [50].
4. Evaluation
We evaluate our approach as follows. Initially, we implemented and deployed the architecture introduced in Section 3.2 in a Colombian Coffee Smart Farm scenario. Then, we collected temperature datasets at the Colombian Coffee Smart Farm. After, we run the FDM and FRM at the Fog Tier of the mentioned architecture. Finally, we tested the proposed mechanisms’ effectiveness to deliver reliable data regarding Accuracy, Recall, Precision, FAR, F-Score, and RMSE.
4.1. Scenario
Figure 3 depicts the implemented and deployed architecture in a Colombian Coffee Smart Farm, introduced in Section 3.2. This network aims at providing reliable data for coffee farm services such as watering, fertilizing, harvesting, and forecasting production. The farmers make important decisions to increase their earnings based on the data collected and the information obtained by such services; the quality of historical data, such as temperature, is crucial to their Accuracy. Farmers need to trust in the information offered by services; therefore, it is pivotal to achieve high data reliability.

Figure 3.
Coffee smart farming.
The Things Tier includes devices such as sensors of temperature, humidity, light, and moisture. The sensors cover three hectares of a coffee crop, the coffee processing center, and the coffee storage center. In particular, this tier comprises: (i) a weather station Smart Agriculture PRO from Libelium-Waspmote Plug and Sense! [51] with external solar panels, which supports several radio technologies (ZigBee, Wi-Fi, 4G, SigFox, LoRaWAN) and sensors for monitoring soil moisture, solar radiation, atmospheric pressure, pluviometer, air temperature, and air humidity. This station covers all the three coffee farm hectares. (ii) a Datalog X-PRO from OMICRON [52] with an Internal rechargeable battery, which supports Wi-Fi, SigFox and 3G, and sensors for soil moisture, air temperature, and air humidity. This Omicron device operates in just one of the hectares of the coffee farm. (iii) sets of new low-cost sensor-tags from INTEL that support BlueTooth Low Energy, ZigBee, and Wi-Fi sensors for temperature and humidity. A set operates in each hectare of the coffee crop. The primary communication protocol used at the Things Tier was IEEE 802.11n (i.e., IEEE 802.11ax, IEEE 802.11 b, and IEEE 802.15.4) because it is the protocol supported by all the IoT devices deployed in the case study farm. Using IEEE 802.11 is not necessary to pay for a subscription, such as with SigFox or 3G/4G.
The Fog Tier includes an FN per hectare and a Fog Controller. In this case study, a single Fog Controller and three FNs were used due to the farm extension and the few IoT devices generating data. FN collects data from the Things Tier and runs FDM and FRM for providing reliable data to the Fog Controller; each FN functions on an ESP32 module and a Raspberry Pi 3 Model B with integrated Wi-Fi and Bluetooth connectivity. FNs are separated between 80 and 100 m (approximately) from each other. The Fog Controller Node runs on a Raspberry Pi 4 Model B that manages and processes the farm information. The Fog Tier communicates with the others using a REST-based services style by the HTTP protocol; it was necessary to use a standardized north interface that would allow simple interaction with the Cloud. This node sends aggregated information to the Private Cloud Tier that performs an in-depth analysis of the information provided by lower tiers via a Linux VPS server over Hyper-V. This server offers the following farm services: environmental variables monitoring, historic coffee production, production forecast, and IoT infrastructure management.
4.2. Coffee Smart Farming Datasets
We conduct evaluation experiments with three temperature datasets (Table 2). The first one, named “Per_Hour”, contains data collected with the Omicron device every minute and a half from 2:00 p.m. to 2:57 p.m. on 5 November 2019. The second dataset named “Per_Day” was generated from an Intel device collecting data every 5 min on 6 January 2020. The third dataset called “Per_Month” was formed by the Libelium weather station collecting data every two minutes (approximately) from 10th November to 10th December of 2019. For testing purposes, we included randomly 1%, 5%, and 10% of outliers in each of the three datasets above mentioned using the InterQuartile Range (IQR) [53], generating in total nine datasets. Three datasets “Per_Hour” with 24 instances collected by Omicron device with 1%, 5%, and 10% of outliers, respectively. Three datasets “Per_Day” with 288 instances collected by Intel device with 1%, 5%, and 10% of outliers, respectively. Three datasets “Per_Month” with 22,532 instances collected by Libelium device with 1%, 5%, and 10% of outliers, respectively. The datasets and codes used in this paper are located in [54].
Table 2.
Datasets for coffee smart farming.
Table 3 presents the structure of datasets mentioned above. The columns represent the features and the row their format. The first two features express the date and time in the human-readable and in Unix timestamp format, respectively. The third feature (value_temp) is the original temperature data in degrees Celsius collected by the Omicron, Intel, or Libelium devices. The fourth feature (Test_1) contains the temperature data, including the outliers randomly created.
Table 3.
Dataset structure.
4.3. Test Environment
We evaluate FDM and FRM in a virtual machine running a Ubuntu 64-bit operative system and using Python version 2.7.17 and R version 3.6.3 for the ML and Interpolation algorithms, respectively. In Python, we deploy a ML library by using scikit-learn [55]; in particular, DBSCAN from sklearn.cluster, IsolationForest from sklearn.ensemble, and OneClassSVM from sklearn.svm. In R [56], we deploy the following functions to interpolate: spline for Cubic Spline interpolation, approx for Linear interpolation, and loess.smooth for Nearest Neighbor interpolation. It is worth mentioning that we use the CRISP-DM methodology for the construction of the mechanisms [57]. This methodology consists of the following steps:
- Business understanding focuses on understanding the objectives and requirements from a business perspective (i.e., provide reliable data in SF).
- Data understanding takes care of the initial data collection and allows becoming familiar with the data (i.e., extract the datasets from the architecture deployed in our case study farm).
- Data preparation covers all the activities necessary to build the final dataset.
- During modeling, apply data mining techniques to our data, including the tunning of their parameters to achieve the best results (i.e., FDM and FRM construction).
- The model’s evaluation to determine if they are useful to the business needs.
- Deployment involves exploiting the models within a production environment (i.e., deployment of FDM and FRM in the Colombian coffee farm).
4.4. Performance Metrics
We evaluate FDM’s ability to identify outliers by using the metrics involved in the confusion matrix: Accuracy, Recall, Precision, FAR, and F-Score [58]. We use the classical metrics used by other works in the literature for evaluating ML algorithms and Interpolation techniques [28,37,59]. Table 4 presents the confusion matrix, the terms “positive” and “negative” refer to the classifier’s prediction (i.e., normal or outlier). The terms “true” and “false” refer to whether the prediction corresponds to the proper observation. The True Negative indicates the outliers detected correctly. False Positive denotes values classified as normal that were outliers. False Negative exposes outliers incorrectly identified. True Positive states the well-classified normal values. Accuracy is the proportion of normal and outlier values correctly classified among the total number of classifications (see Equation (1)). Accuracy answers the question: how many classifications of the algorithm were identified correctly? Recall refers to the percentage of total normal values classified correctly by the algorithm (see Equation (2)). Recall answers the question: how many instances of the algorithm were identified correctly? Precision is the fraction of normal values that are properly-identified among the instances classified as normal (see Equation (3)). Precision answers the question: how many instances of the algorithm were predicted correctly? F-Score is the harmonic mean of Precision and Recall (see Equation (4)). F-Score is best if there is a balance between Precision and Recall. False Alarm Rate is the percentage of falsely detected normal values of the instances classified as outliers (see Equation (5)). FAR answers the question: how many outliers of the algorithm were identified incorrectly?
Table 4.
Confusion matrix.
We evaluate FRM’s ability to infer data to replace outliers by using RMSE [60]. RMSE is a method of measuring the difference between values predicted by a model and their actual values. RMSE measures the amount of error between any two datasets. In this vein, we calculate the RMSE of the original temperature datasets versus the datasets interpolated to identify the most accurate technique. The less RMSE, the better the performance of the interpolation technique.
4.5. Failure Detection Evaluation—Results and Analysis
We conducted experiments with different datasets to evaluate, in terms of Accuracy, Recall, Precision, FAR, and F-Score, several candidate algorithms for realizing FDM; this mechanism tags the detected outliers and generates the tagged outliers dataset that is the FRM’s input. This evaluation aims at selecting an algorithm for carrying out FDM. In this sense, we define the best performance condition for the outliers detection algorithm: high Accuracy, high Precision, and low FAR. In particular, we vary the parameters from each algorithm described in Section 3.3 as follows: for DBSCAN, the eps (e) parameter from 0.1 to 0.8 (with min_samples set in 3); for IF, the contamination (c) parameter from 0 to 0.5; and, for SVM, the nu parameter from 0.01 to 0.1. We evaluated the algorithms using the datasets described in Table 2 aggregating to each of them 1%, 5%, and 10% of outliers.
Table 5 compares in the Per_Hour dataset the candidate algorithms for performing FDM. DBSCAN and IF obtained the same high performance in any outliers’ percentage, meaning that these algorithms can operate correctly with a small dataset and few outliers. SVM obtained the worst performance; in this dataset with 10% of outliers, this algorithm got 33% and 80% of FAR and Recall, respectively, which indicates that SVM did not find all the outliers and present many false positives. These results are because SVM ignores the spatial correlation of neighboring nodes, which makes the results of local outliers inaccurate [37].
Table 5.
Comparison Per_Hour dataset.
Table 6 compares in the Per_Day dataset the candidate algorithms for carrying out FDM. All evaluated algorithms’ performance decreased in this dataset (12 times bigger than the Per_Hour dataset). The three evaluated algorithms obtained their best performance in this dataset with 1% of outliers, confirming that they function well when operating with a small dataset and few outliers. Overall, DBSCAN obtained the best results for the evaluated metrics. However, note that this algorithm got 7% and 3.5% of FAR when operating with 5% and 10% of outliers in the dataset, respectively, meaning in the datasets mentioned, the outliers are closer to standard data (DBSCAN has problems to identify these types of outliers). SVM obtained excellent results in almost all evaluated metrics but slightly lower than DBSCAN did. In addition, FAR in SVM increased up to 6.9 when the dataset contains 10% of outliers. The IF algorithm got excellent results regarding Precision, F-Score, and FAR. However, its Accuracy and Recall are around 97% and 90% when this dataset contains 5% and 10% of outliers, respectively. This algorithm had problems with false positives.
Table 6.
Comparison Per_Day dataset.
Table 7 compares in the Per_Month dataset the candidate algorithms for performing FDM. All evaluated algorithms obtained excellent results regarding Accuracy, Recall, Precision, and F-Score. Accuracy and Precision in DBSCAN decreased slighter to 99.7% and 99.4% when the percentage of outliers moved from 5% and 10%, respectively. In this dataset, DBSCAN also had problems with false positives (FAR = 5.6 with 10% of outliers), indicating limitations to identify outliers closer to normal data. Regarding SVM, it is to highlight that its false positives increase when the percentage of outliers is equal to 10% (FAR = 7.09), which suggests inefficiency in classifying many outliers. FAR obtained by IF is perfect because the contamination parameter used was very close to the real percentage of outliers existing in the dataset; this is difficult to know in practice for an online operation.
Table 7.
Comparison Per_Month dataset.
Based on the results above, we consider DBSCAN as the best option for carrying out FDM. DBSCAN obtained an excellent performance for marking outliers over all the tests with a FAR lower than 6%, a perfect Recall and an Accuracy, Precision, and F-Score greater than 99% for the most extensive dataset. Furthermore, DBSCAN does not require a re-setting of the parameter eps when the outliers increase. Note that IF got the highest Precision and lowest FAR. However, the IF’s contamination parameter needs to be re-set when the outliers raise to keep high performance. The IF’s false negatives will increase significantly if the real number of outliers is lower than the contamination. In turn, the false positives of IF will increase when the actual number of outliers is higher than the contamination. This re-setting is unpractical because it is hard to know the percentage of outliers previous to the algorithm’s training.
4.6. Failure Recovery Evaluation—Results and Analysis
We conducted experiments with the datasets outputted by FDM for evaluating, regarding RMSE, several interpolation techniques that allow replacing the outliers with ’accurate’ data. Figure 4 shows that the Nearest Neighbor technique obtained the worst RMSE; Nearest Neighbor selects the nearest datum’s value without considering neighboring data values, which tends to increase noise, especially in the Per_Month dataset. From a conceptual perspective, the Cubic Spline should offer better results than the Linear [61]. Still, our experimental results indicate a lower RMSE with the Linear, which is due to the data points in our datasets are closely near (our data samples are measurements of temperature). Thus, the connection between each data point by a straight line allows for achieving high-accuracy interpolation.

Figure 4.
Comparison interpolation.
5. Conclusions and Future Work
This paper introduced an FC-based architecture approach that incorporates a mechanism for detecting outliers and another for inferring data intended to replace them. The evaluation demonstrated our approach’s effectiveness in a real network deployed in a Colombian Smart Coffee Farm. For the failure detection mechanism, we selected the DBSCAN algorithm due to it presenting an excellent performance for marking outliers over all the tests with a FAR lower than 6%, a perfect Recall as well as an Accuracy, Precision, and F-Score greater than 99% for the most extensive dataset. We selected the linear interpolation for the failure recovery mechanism because it infers data with low RMSE allowing for replacing the detected outliers properly. Considering the obtained results, we concluded that the proposed approach is suitable for providing reliability in the IoT-based Smart Farming data collection process and supports the correct decision-making.
Apart from that, our proposal falls behind in terms of power consumption analysis, architectures validation, or comparison, and optimal location of nodes per layer in the Fog Tier. As future work, we intend to involve more features into the dataset, such as humidity, pressure, and light. Furthermore, we plan to improve failure detection with the ability to differentiate outliers from events of interest.
Author Contributions
Conceptualization, A.I.M.-M. and O.M.C.R.; Methodology, A.I.M.-M. and O.M.C.R.; Software, A.I.M.-M.; Validation, A.I.M.-M. and O.M.C.R.; Formal analysis, A.I.M.-M.; Investigation, A.I.M.-M.; Resources, A.I.M.-M. and O.M.C.R.; Data curation, A.I.M.-M.; Writing—original draft preparation, A.I.M.-M. and O.M.C.R.; Writing—review and editing, A.I.M.-M. and O.M.C.R.; Visualization, A.I.M.-M.; Supervision, O.M.C.R.; Project administration, O.M.C.R.; and Funding acquisition, O.M.C.R. All authors have read and agreed to the published version of the manuscript.
Funding
The research of Professor Ph.D. Oscar Mauricio Caicedo was funding by the Universidad del Cauca. The research of the Eng. Ana Isabel Montoya-Munoz was funding by the project “Alternativas Innovadoras de Agricultura Inteligente para sistemas productivos agrícolas del departamento del Cauca soportado en entornos de IoT ID 4633-Convocatoria 04C-2018 Banco de Proyectos Conjuntos UEES-Sostenibilidad” of InnovAcción Cauca.
Acknowledgments
The authors thank Innovacción-Cauca (SGR-Colombia) under project “Alternativas Innovadoras de Agricultura Inteligente para sistemas productivos agrícolas del departamento del Cauca soportado en entornos de IoT ID 4633-Convocatoria 04C-2018 Banco de Proyectos Conjuntos UEES-Sostenibilidad”, the Telematics Engineering research Group (GIT) of the Universidad del Cauca, and TECNICAFÉ.
Conflicts of Interest
The authors declare no conflict of interest.
Abbreviations
The following abbreviations are used in this manuscript:
| IoT | Internet of Things |
| SF | Smart Farming |
| FC | Fog Computing |
| FN | Fog Node |
| FDM | Failure Detection Mechanism |
| FRM | Failure Recovery Mechanism |
| ML | Machine Learning |
| FAR | False Alarm Rate |
| RMSE | Root Mean Squared Error |
| WSN | Wireless Sensor Network |
| DBSCAN | Density-Based Spatial Clustering of Applications with Noise |
| IF | Isolation Forest |
| SVM | Support Vector Machine |
| eps | epsilon |
References
- Gubbi, J.; Buyya, R.; Marusic, S.; Palaniswami, M. Internet of Things (IoT): A vision, architectural elements, and future directions. Future Gener. Comput. Syst. 2013, 29, 1645–1660. [Google Scholar] [CrossRef]
- Talavera, J.M.; Tobón, L.E.; Gómez, J.A.; Culman, M.A.; Aranda, J.M.; Parra, D.T.; Quiroz, L.A.; Hoyos, A.; Garreta, L.E. Review of IoT applications in agro-industrial and environmental fields. Comput. Electron. Agric. 2017, 142, 283–297. [Google Scholar] [CrossRef]
- Arasteh, H.; Hosseinnezhad, V.; Loia, V.; Tommasetti, A.; Troisi, O.; Shafie-Khah, M.; Siano, P. Iot-based smart cities: A survey. In Proceedings of the 2016 IEEE 16th International Conference on Environment and Electrical Engineering (EEEIC), Florence, Italy, 7–10 June 2016; pp. 1–6. [Google Scholar]
- Sherly, J.; Somasundareswari, D. Internet of things based smart transportation systems. Int. Res. J. Eng. Technol. 2015, 2, 1207–1210. [Google Scholar]
- Stojkoska, B.L.R.; Trivodaliev, K.V. A review of Internet of Things for smart home: Challenges and solutions. J. Clean. Prod. 2017, 140, 1454–1464. [Google Scholar] [CrossRef]
- Mitchell, H.B. Multi-Sensor Data Fusion: An Introduction; Springer Science & Business Media: Berlin/Heidelberg, Germany, 2007. [Google Scholar]
- Kelly, S.D.T.; Suryadevara, N.K.; Mukhopadhyay, S.C. Towards the implementation of IoT for environmental condition monitoring in homes. IEEE Sens. J. 2013, 13, 3846–3853. [Google Scholar] [CrossRef]
- Kulau, U.; Rottmann, S.; Schildt, S.; Van Balen, J.; Wolf, L. Undervolting in real world WSN applications: A long-term study. In Proceedings of the 2016 International Conference on Distributed Computing in Sensor Systems (DCOSS), Washington, DC, USA, 26–28 May 2016; pp. 9–16. [Google Scholar] [CrossRef]
- Boncea, R.; Bacivarov, I. A System Architecture for Monitoring the Reliability of IoT. In Proceedings of the 15th International Conference on Quality and Dependability, Sinaia, Romania, 14–16 September 2016; pp. 143–149. [Google Scholar]
- Kang, B.; Choo, H. An experimental study of a reliable IoT gateway. ICT Express 2018, 4, 130–133. [Google Scholar] [CrossRef]
- Muangprathub, J.; Boonnam, N.; Kajornkasirat, S.; Lekbangpong, N.; Wanichsombat, A.; Nillaor, P. IoT and agriculture data analysis for smart farm. Comput. Electron. Agric. 2019, 156, 467–474. [Google Scholar] [CrossRef]
- Pahuja, R.; Verma, H.K.; Uddin, M. A Wireless Sensor Network for Greenhouse Climate Control; IEEE Pervasive Computing: Piscataway, NJ, USA, 2013; pp. 49–58. [Google Scholar]
- Natale, A.; Antognelli, S.; Ranieri, E.; Cruciani, A.; Boggia, A. A Novel Cleaning Method for Yield Data Collected by Sensors: A Case Study on Winter Cereals. In Proceedings of the International Conference on Computational Science and Its Applications, Cagliari, Italy, 1–4 July 2020; Springer: Cham, Switzerland, 2020; pp. 684–691. [Google Scholar]
- Ray, P.P. Internet of things for smart agriculture: Technologies, practices and future direction. J. Ambient Intell. Smart Environ. 2017, 9, 395–420. [Google Scholar] [CrossRef]
- Bonomi, F.; Milito, R.; Zhu, J.; Addepalli, S. Fog computing and its role in the internet of things. In Proceedings of the First Edition of the MCC Workshop on Mobile Cloud Computing, Helsinki, Finland, 17 August 2012; ACM: New York, NY, USA, 2012; pp. 13–16. [Google Scholar]
- Yi, S.; Hao, Z.; Qin, Z.; Li, Q. Fog computing: Platform and applications. In Proceedings of the 2015 Third IEEE Workshop on Hot Topics in Web Systems and Technologies (HotWeb), Washington, DC, USA, 12–13 November 2015; pp. 73–78. [Google Scholar]
- Elbamby, M.S.; Bennis, M.; Saad, W.; Latva-aho, M.; Hong, C.S. Proactive edge computing in fog networks with latency and reliability guarantees. EURASIP J. Wirel. Commun. Netw. 2018. [Google Scholar] [CrossRef]
- Huang, C.; Liu, D.; Ni, J.; Lu, R.; Shen, X. Reliable and privacy-preserving selective data aggregation for fog-based IoT. In Proceedings of the IEEE International Conference on Communications (ICC), Kansas City, MO, USA, 20–24 May 2018; pp. 1–6. [Google Scholar] [CrossRef]
- Wang, K.; Shao, Y.; Xie, L.; Wu, J.; Guo, S. Adaptive and Fault-tolerant Data Processing in Healthcare IoT Based on Fog Computing. IEEE Trans. Netw. Sci. Eng. 2018, 7, 263–273. [Google Scholar] [CrossRef]
- Carpio, F.; Jukan, A.; Martin Sanchez, A.I.; Amla, N.; Kemper, N. Beyond Production Indicators: A Novel Smart Farming Application and System for Animal Welfare. In Proceedings of the Fourth International Conference on Animal-Computer Interaction, Milton Keynes, UK, 21–23 November 2017; pp. 7:1–7:11. [Google Scholar] [CrossRef]
- Zamora-Izquierdo, M.A.; Santa, J.; Martínez, J.A.; Martínez, V.; Skarmeta, A.F. Smart farming IoT platform based on edge and cloud computing. Biosyst. Eng. 2019, 177, 4–17. [Google Scholar] [CrossRef]
- Taneja, M.; Jalodia, N.; Byabazaire, J.; Davy, A.; Olariu, C. SmartHerd management: A microservices-based fog computing–assisted IoT platform towards data-driven smart dairy farming. Softw. Pract. Exp. 2019, 49, 1055–1078. [Google Scholar] [CrossRef]
- Taneja, M.; Byabazaire, J.; Jalodia, N.; Davy, A.; Olariu, C.; Malone, P. Machine learning based fog computing assisted data-driven approach for early lameness detection in dairy cattle. Comput. Electron. Agric. 2020, 171, 105286. [Google Scholar] [CrossRef]
- Taneja, M.; Jalodia, N.; Malone, P.; Byabazaire, J.; Davy, A.; Olariu, C. Connected Cows: Utilizing Fog and Cloud Analytics toward Data-Driven Decisions for Smart Dairy Farming. IEEE Internet Things Mag. 2019, 2, 32–37. [Google Scholar] [CrossRef]
- Hsu, T.C.; Yang, H.; Chung, Y.C.; Hsu, C.H. A Creative IoT agriculture platform for cloud fog computing. Sustain. Comput. Informatics Syst. 2018. [Google Scholar] [CrossRef]
- Çelik, M.; Dadaşer-Çelik, F.; Dokuz, A.Ş. Anomaly detection in temperature data using DBSCAN algorithm. In Proceedings of the INISTA 2011—International Symposium on INnovations in Intelligent SysTems and Applications, Istanbul, Turkey, 15–18 June 2011; pp. 91–95. [Google Scholar] [CrossRef]
- Ding, Z.; Fei, M. An Anomaly Detection Approach Based on Isolation Forest Algorithm for Streaming Data Using Sliding Window. In Proceedings of the 3rd IFAC International Conference on Intelligent Control and Automation Science, IFAC, Chengdu, China, 2–4 September 2013; Volume 3, pp. 12–17. [Google Scholar] [CrossRef]
- Fawzy, A.; Mokhtar, H.M.; Hegazy, O. Outliers detection and classification in wireless sensor networks. Egypt. Inform. J. 2013, 14, 157–164. [Google Scholar] [CrossRef]
- Wahir, N.; Nor, M.; Rusiman, M.; Gopal, K. Treatment of outliers via interpolation method with neural network forecast performances. J. Phys. Conf. Ser. 2018, 995, 012025. [Google Scholar] [CrossRef]
- Corrales, D.C.; Corrales, J.C.; Figueroa-Casas, A. Towards detecting crop diseases and pest by supervised learning. Ing. Univ. 2015, 19, 207–228. [Google Scholar] [CrossRef]
- Pizzuti, T.; Mirabelli, G. The Global Track&Trace System for food: General framework and functioning principles. J. Food Eng. 2015, 159, 16–35. [Google Scholar] [CrossRef]
- Mukherjee, M.; Shu, L.; Wang, D. Survey of Fog Computing: Fundamental, Network Applications, and Research Challenges. IEEE Commun. Surv. Tutor. 2018, 20, 1826–1857. [Google Scholar] [CrossRef]
- Bendouda, D.; Rachedi, A.; Haffaf, H. An hybrid and proactive architecture based on SDN for Internet of Things. In Proceedings of the 2017 13th International Wireless Communications and Mobile Computing Conference (IWCMC), Valencia, Spain, 26–30 June 2017; pp. 951–956. [Google Scholar]
- Aazam, M.; Huh, E.N. Fog computing and smart gateway based communication for cloud of things. In Proceedings of the 2014 International Conference on Future Internet of Things and Cloud (FiCloud), Barcelona, Spain, 27–29 August 2014; pp. 464–470. [Google Scholar]
- Dastjerdi, A.V.; Gupta, H.; Calheiros, R.N.; Ghosh, S.K.; Buyya, R. Fog Computing: Principles, Architectures, and Applications. In Internet of Things: Principles and Paradigms; Morgan Kaufmann: San Mateo, CA, USA, 2016; pp. 1–26. [Google Scholar]
- Tang, B.; Chen, Z.; Hefferman, G.; Wei, T.; He, H.; Yang, Q. A hierarchical distributed fog computing architecture for big data analysis in smart cities. In Proceedings of the ASE BigData & SocialInformatics, Kaohsiung, Taiwan, 7–9 October 2015; pp. 1–6. [Google Scholar] [CrossRef]
- Abukhalaf, H.; Wang, J.; Zhang, S. Outlier Detection Techniques for Localization in Wireless Sensor Networks: A Survey. Int. J. Future Gener. Commun. Netw. 2015, 8, 99–114. [Google Scholar] [CrossRef]
- Castillo, E.F.; Gonzales, W.F.; López, I.D.; Figueroa, A.; Corrales, D.C.; Hoyos, M.G.; Corrales, J.C. Water quality warnings based on cluster analysis in Colombian river basins. Sist. Telemática 2015, 13, 9–26. [Google Scholar] [CrossRef]
- Domingues, R.; Filippone, M.; Michiardi, P.; Zouaoui, J. A comparative evaluation of outlier detection algorithms: Experiments and analyses. Pattern Recognit. 2018, 74, 406–421. [Google Scholar] [CrossRef]
- Liu, Y.; Wang, H.; Zhang, H.; Liber, K. A comprehensive support vector machine-based classification model for soil quality assessment. Soil Tillage Res. 2016, 155, 19–26. [Google Scholar] [CrossRef]
- Kriegel, H.P.; Kröger, P.; Sander, J.; Zimek, A. Density-based clustering. Wiley Interdiscip. Rev. Data Min. Knowl. Discov. 2011, 1, 231–240. [Google Scholar] [CrossRef]
- Schubert, E.; Sander, J.; Ester, M.; Kriegel, H.P.; Xu, X. DBSCAN revisited, revisited: Why and how you should (still) use DBSCAN. ACM Trans. Database Syst. 2017, 42, 19. [Google Scholar] [CrossRef]
- Ester, M.; Kriegel, H.P.; Sander, J.; Xu, X. A density-based algorithm for discovering clusters in large spatial databases with noise. In Proceedings of the 2nd International Conference on Knowledge Discovery and Data Mining, KDD, Portland, OR, USA, 2–4 August 1996; Volume 96, pp. 226–231. [Google Scholar]
- Liu, F.T.; Ting, K.M.; Zhou, Z.H. Isolation forest. In Proceedings of the 2008 Eighth IEEE International Conference on Data Mining, Pisa, Italy, 15–19 December 2008; pp. 413–422. [Google Scholar]
- Rajasegarar, S.; Leckie, C.; Palaniswami, M.; Bezdek, J.C. Quarter sphere based distributed anomaly detection in wireless sensor networks. In Proceedings of the 2007 IEEE International Conference on Communications, Glasgow, UK, 24–28 June 2007; pp. 3864–3869. [Google Scholar]
- Pradhan, A. Support Vector Machine—A survey. Int. J. Emerg. Technol. Adv. Eng. 2012, 2, 82–85. [Google Scholar]
- László, L. Cubic spline interpolation with quasiminimal B-spline coefficients. Acta Math. Hung. 2005, 107, 77–87. [Google Scholar] [CrossRef]
- Hazewinkel, M. Encyclopaedia of Mathematics: Volume 6: Subject Index—Author Index; Springer Science & Business Media: Berlin/Heidelberg, Germany, 2013. [Google Scholar]
- Rukundo, O. Nearest Neighbor Value Interpolation. arXiv 2012, arXiv:1211.1768. [Google Scholar]
- Klapetek, P. Basic Data Processing. In Quantitative Data Processing in Scanning Probe Microscopy, SPM Applications for Nanometrology; Elsevier Science: San Diego, CA, USA, 2013; pp. 55–80. [Google Scholar] [CrossRef]
- Libelium Waspmote Plug and Sense! Available online: http://www.libelium.com/products/plug-sense/technical-overview/ (accessed on 28 July 2020).
- DataLog X Pro. Available online: https://www.omicroning.co/es/datalog-x-pro.html (accessed on 28 July 2020).
- Dawson, R. How significant is a boxplot outlier? J. Stat. Educ. 2011, 19. [Google Scholar] [CrossRef]
- Reliable IoT-Agro: GitHub Repository. Available online: https://github.com/aimontoya07/Reliable_IoT-Agro/tree/master (accessed on 17 October 2020).
- Pedregosa, F.; Varoquaux, G.; Gramfort, A.; Michel, V.; Thirion, B.; Grisel, O.; Blondel, M.; Prettenhofer, P.; Weiss, R.; Dubourg, V.; et al. Scikit-learn: Machine Learning in Python. J. Mach. Learn. Res. 2011, 12, 2825–2830. [Google Scholar]
- Ozgur, C.; Colliau, T.; Rogers, G.; Hughes, Z.; Myer-Tyson, B. MatLab vs. Python vs. R. J. Data Sci. 2017, 15, 355–372. [Google Scholar]
- Wirth, R.; Hipp, J. CRISP-DM: Towards a standard process model for data mining. In Proceedings of the 4th International Conference on the Practical Applications of Knowledge Discovery and Data Mining, Manchester, UK, 11–13 April 2000; Springer: London, UK, 2000; pp. 29–39. [Google Scholar]
- Boutaba, R.; Salahuddin, M.A.; Limam, N.; Ayoubi, S.; Shahriar, N.; Estrada-Solano, F.; Caicedo, O.M. A comprehensive survey on machine learning for networking: Evolution, applications and research opportunities. J. Internet Serv. Appl. 2018, 9, 16. [Google Scholar] [CrossRef]
- Kamilaris, A.; Prenafeta-Boldú, F.X. Deep learning in agriculture: A survey. Comput. Electron. Agric. 2018, 147, 70–90. [Google Scholar] [CrossRef]
- Chai, T.; Draxler, R.R. Root mean square error (RMSE) or mean absolute error (MAE)?—Arguments against avoiding RMSE in the literature. Geosci. Model Dev. 2014, 7, 1247–1250. [Google Scholar] [CrossRef]
- Electrical and Computer Engineering ECE, University of Colorado Colorado Springs. ECE 1010 Problem Solving I, Chapter 6, Interpolation and Curve Fitting. Available online: http://www.eas.uccs.edu/~mwickert/ece1010/lecture_notes/1010n6a.PDF (accessed on 6 November 2020).
Publisher’s Note: MDPI stays neutral with regard to jurisdictional claims in published maps and institutional affiliations. |
© 2020 by the authors. Licensee MDPI, Basel, Switzerland. This article is an open access article distributed under the terms and conditions of the Creative Commons Attribution (CC BY) license (http://creativecommons.org/licenses/by/4.0/).