The Application of Seabed Silt in the Preparation of Artificial Algal Reefs
by
Zhaoyang Jiang
, 
Jiating Zhang
,
Zhaoyi Nie
,
Zhansheng Guo
,
Lixin Zhu
,
Wei Cong
,
Yuan Chen
and
Zhenlin Liang
* Marine College, Shandong University, Weihai 264209, China
*
Author to whom correspondence should be addressed.
Appl. Sci. 2020, 10(20), 7279; https://doi.org/10.3390/app10207279
Submission received: 17 September 2020
/
Revised: 14 October 2020
/
Accepted: 15 October 2020
/
Published: 17 October 2020
(This article belongs to the Special Issue Green Concrete for a Better Sustainable Environment II)
Abstract
:Large amounts of silt have been deposited on the seabed in China’s coastal areas due to intensive coastal development and marine raft aquaculture, which are the main causes of local marine environmental disasters. In this study, seabed silt was tested as a potential raw material for artificial reefs. The silt was mixed with cement in four proportions to create concrete specimens for use in silt artificial reefs (SARs). The compressive strength development and nutrient dissolution were examined in the SAR specimens. The hydration products of the SAR paste were investigated through X-ray diffraction (XRD), scanning election microscope (SEM), and differential scanning calorimetry (DSC) techniques. The results showed that the compression strength of the SAR specimens was inversely proportional to their seabed silt content. The SAR specimens were able to continuously dissolve nitrogen-containing nutrients. The presence of Ca(OH)2, commonly found in traditional concrete, was not detected, which may help improve the seaweed adhesion and biological effects of artificial reefs. The effective utilization of seabed silt could serve to restore and improve the marine ecological environment.
1. Introduction
An artificial algal reef (AAR), a type of artificial reef, is an underwater structure created to improve the environment for seaweed growth and increase the protection of fishery resources [1,2,3]. The many types of artificial reef material have different adhesive properties and biological effects [4,5]. In general, concrete is the most common material for AARs due to its stable structure, availability, and ease of modeling. Artificial reefs made of concrete can provide a substrate for seaweed attachment, which provides a habitat for the accumulation and growth of fish and food and shelter for invertebrates and crustaceans [6,7,8,9]. With the expanding application of artificial reefs around the world, a lot of recycled waste or low-value material is gradually being used to develop artificial reefs, with the aim of environmental protection and for economic reasons, including fly ash [10,11,12,13], blast furnace and steel slag [14,15,16], and shells [17,18,19,20]. AARs mixed with tidal sludge can continuously dissolve nutrients containing nitrogen and phosphorus into the surrounding water, an effect similar to slow-release fertilizer [3]. Concretes with bio-activators admixtures can improve marine colonization, and the pre-carbonation of cementitious materials accelerates the growth of microorganisms forming a biofilm by lowering the pH of the surface [21,22]. Therefore, the production of artificial reefs based on AAR concepts and technologies can save a lot of raw material and effectively consume waste, thus protecting land resources and the environment while avoiding the pollution caused by man-made waste disposal.
In recent decades, China’s coastal zone has experienced intense development and utilization. In particular, large numbers of aquaculture facilities such as fish cages and kelp or shellfish rafts have been set up in coastal waters to develop marine aquaculture. On the one hand, large quantities of bait and excrement from farmed objects are deposited on the seabed; on the other hand, large-scale aquaculture facilities hinder tidal movement and reduce the exchange efficiency of seawater, greatly changing the hydrodynamic patterns and sedimentary environment in the sea area [23,24]. The resulting sediments, combined with large amounts of silt brought by land soil erosion and continental runoff, have formed extensive silty seabed, which have semi-permanently changed the benthic environment of these seas. For example, in the marine aquaculture areas of Shuangdao Bay, Shandong Province, the silt layer is particularly thick. An anoxic layer can therefore easily form on the seabed, causing the large-scale death of benthic organisms, a major cause of environmental disasters in nearby seas [25]. If the seabed silt could be used as artificial reef material in the same way as tidal sludge, this would not only make full use of seabed waste to achieve green circulation but also improve and restore the coastal seabed environment. However, few studies relevant to this concept have been conducted.
In this study, seabed silt was used as a raw material and mixed with cement in four proportions to form concrete mixtures for the preparation of silt artificial reef (SAR) specimens. The compressive strength development of the SARs was then evaluated, and the hydration products and microstructure of the SAR paste were investigated by XRD, SEM, and differential scanning calorimetry (DSC) techniques. The aim of this study was to explore the feasibility of using seabed silt in the preparation of AARs and provide technical support and a scientific reference for the ecological restoration of the coastal seabed environment.
2. Materials and Methods
2.1. Materials
The seabed silt for this study was collected from the seabed in Shuangdao Bay, Shandong Province, which was black and slightly smelly, with a small amount of sand. Its physical and chemical characteristics are shown in Table 1. Pure water was mixed with silt and typical Portland cement, and the seawater was filtered. After the large-sized impurities such as shells and stones were picked out, the seabed silt was placed in a beaker and mixed with pure water. The silt was evenly stirred and left to stand for two days to allow layering to occur. The layered silt was then removed, dried at 90 ℃ for 24 h, ground, and repeatedly screened with 2 mm, 1.4 mm, and 1.0 mm aperture screens to obtain the raw materials of the silt with a pore size of less than 1 mm.
2.2. Specimen Preparation
The purpose of this study was to assess the feasibility of using seabed silt as a material for AARs. To determine the workability and mechanical properties of SARs, the four proportions of silt-to-cement for the specimens were set to 0.2:1, 0.4:1, 0.6:1, and 0.8:1, respectively, and named as M2, M4, M6, and M8. The water–cement ratio (water to total weight of silt and cement) was 0.44 for mixing. The mixture was then poured into molds (70 mm × 70 mm × 70 mm), compacted, and covered with plastic wrap for 24 h. The specimens were then demolded and cured in a moist chamber at 90–95% humidity and 20 ± 2 °C (standard curing) for 28 days.
2.3. Experimental Method
2.3.1. Compressive Strength Test
To test the mechanical properties of the SAR mixtures, three specimens from each of the four mixtures were prepared for compressive strength experiments. The compressive strength after 1, 4, 8, and 28 days was measured in accordance with the Chinese standard GB/T50081-2002 [26].
2.3.2. Dissolution Test
After curing for 28 days, five specimens were randomly selected from each mixture and placed separately in a 2 L beaker. The beakers were then filled with seawater and sealed with plastic wrap to reduce evaporation. Water samples were taken every 3 days for determination, and each sample was repeatedly tested 5 times. After each sampling, each beaker was topped up with seawater to its original volume to reduce experimental error. Ammonium salt and active phosphate content were used as measures of the nitrogen and phosphorus content dissolved from the SAR specimens into the water. In accordance with Chinese standard GB/T 12763.4-2007 [27], ammonium salt was determined by the indophenol blue method and active phosphate was determined by the phosphorus molybdenum blue method. At the end of the dissolution test, the pH of the solution in each beaker was measured with a handheld pH meter.
2.3.3. Microstructure Tests
XRD, SEM, and DSC analyses were performed to study the hydration products of the mixtures. Small pieces of SAR specimens were selected at 1, 8, and 28 days for the compressive strength test. The internal paste fragments were ground and screened with a 0.075 mm sieve, and the powder was obtained for XRD analysis. The XRD patterns were recorded with a Rigaku UltimaIV diffractometer (40 KV and 40 mA) using CuKα radiation (λ = 1.54052 Å) and a 0.02° step size over the 2θ collection.
Small samples were collected for SEM at 8 and 28 days for the compressive strength test. The samples were prepared and dried at above 90 °C. Before testing, the scanned sections of the samples were cleaned and coated with Pt film by a high-pressure ion sputter coater. The microstructure of the samples was then examined with a scanning electron microscope (NOVA NANOSEM 450, FEI, Hillsboro, OR, USA).
The DSC analysis was done at 28 days on a Diamond TG/DTA (Perkin Elmer, Waltham, MA, USA; http://www.perkinelmer.com) from room temperature to 1000 °C at a heating rate of 10 °C/min under an inert N2 atmosphere.
2.4. Statistical Method
In this article, Excel software was used for curve fitting and SPSS 13.0 for statistical analysis.
3. Results and Discussion
3.1. Compressive Strength
Figure 1 shows the compressive strength of the SAR specimens in different proportions at 1, 4, 8, and 28 days [14]. The compressive strength of the specimens showed an upward trend over the duration of the curing time, which conforms to the strength-change laws of concrete. With each increase in the proportion of silt in the mixture, the compressive strength decreased.
After curing for 28 days, the M2 specimen had the highest compressive strength, about 15.92 MPa, and the M8 specimen had the lowest compressive strength of about 10.62 MPa. According to the Chinese standard GB 50010-2010 [28], the compressive strength of each mixture specimen was between C15 and C20. In general, the compressive strength of an artificial reef should be above C30 [3,29] to ensure that it will not break when dropped to the seafloor. To analyze the feasibility of seabed silt as an artificial reef material, the SAR specimens were made only of cement, seabed silt, and pure water, so as to avoid the influence of other materials on the test results. Unlike ordinary concrete, there were no other aggregates in the raw material. As conventional artificial reefs are made of concrete that includes gravel, sand, and cement, their strength can be adjusted by changing the particle size of the aggregate or the strength grade of the cement. Therefore, although incorporating seabed silt reduced the strength of the SAR specimens, the SAR strength could be similarly adjusted to meet the strength demands for artificial reefs. In addition, any shells were removed from the seabed silt during screening. If they were instead crushed and mixed into the reef, they could improve the SAR strength to some extent. They could also be evenly distributed on the surface of the artificial reef to provide a natural substrate for oyster adhesion [18,19].
3.2. Nutrient Dissolution
3.2.1. Nitrogen Content
Figure 2 shows the variation in nitrogen content in the immersion solution of the specimens with different proportions. During the dissolution test, the nitrogen content increased exponentially (R2 > 0.8207). The ANOVA results at 19 days show that the differences among the mixtures were not significant (P = 0.105 > 0.05), but the nitrogen contents dissolved from the M8 and M6 specimens at 19 days were higher than those of M4 and M2. It seems that a higher proportion of seabed silt contributes to increasing the nitrogen content in the solution.
3.2.2. Phosphorus Content
The phosphorus content decreased exponentially (R2 > 0.8905), as seen in Figure 3, and gradually tended toward stability. It is speculated that the SAR specimens may have had an adsorption effect on the phosphorus in solution, but further analysis is needed to identify the reason for this phenomenon. Although the phosphorus contents dissolved from the M8 and M6 specimens at 19 days were higher than for M4 and M2, the differences among them were not significant (P = 0.485 > 0.05).
3.2.3. Ratio of Nitrogen to Phosphorus
The growth of seaweed is closely related to the concentration of nitrogen, phosphorus, and other nutrients in the water, but also to the nitrogen–phosphorus ratio (N/P). The most suitable N/P ratio for seaweed growth is around 16:1 [30,31]. The nitrogen was sustainably dissolved out of the SAR specimens during the dissolution test. Thus, it can be regarded as a form of slow-release fertilizer for seaweed. However, the phosphorus content of the SAR specimen solutions was very low. At the end of the dissolution test, the N/P ratio in the immersion solution with each proportion ranged between 193.88 and 298.52 (Table 2), which is much larger than that of tidal sludge [3].
Shuangdao Bay is part of the Yellow Sea, and the N/P ratio of its marine aquaculture area in summer and autumn is 20.809 and 17.335, respectively. Poor phosphorus content is an inherent phenomenon in the seawater in this area, which may limit the uptake of both nitrogen and phosphorus by seaweed [3]. Moreover, the nutrient source of seabed silt may be related to the shellfish rafts and the enhancement of sea cucumber populations in the surrounding seawater. Therefore, before selecting the source of seabed silt, the N/P ratio of the dissolved nutrients from the seabed silt should first be tested. In this way, the N/P ratio could be adjusted by adding phosphorus to improve the dissolution properties of the SAR.
3.3. XRD Analysis
Figure 4 shows the XRD patterns of the SAR paste at 8 days. The hydration products of the SAR paste were CaCO3, SiO2, C–S–H gel, ettringite, and some silicate compounds. As shown in Figure 4, no portlandite was detected in the specimens, except for a small amount found in the M2 specimen, which is quite different from the hydration products of cement [14]. This may be related to the high amount of cement in the M2 specimen and also indicates that incorporating seabed silt greatly reduced the amount of portlandite in the cement hydration products. In addition, the curing process may have converted the CaO in the seabed silt into CaCO3, which could also be a reason why portlandite was not detected in the hydration products of the silt and cement mixture.
Figure 5 shows the XRD patterns of the SAR paste at 1, 8, and 28 days. It can be seen that the peaks of the SAR paste were highest and densest at 28 days, except for the M6 specimen. The pH of the SAR specimens was between 9.1 and 9.6. An alkaline environment is not conducive to the adhesion of marine organisms, as with all concrete. The hydration products of concrete include a large amount of portlandite, which leads to a high pH (about 12 to 13) in the surrounding marine environment [14]. An alkaline seawater environment keeps attaching organisms away from artificial reefs, which is not conducive to the recovery and proliferation of a seaweed field. Therefore, a large amount of fresh water is generally sprayed onto artificial reefs to reduce their alkalinity before deposition to avoid releasing alkalis into the seawater. However, this process is time-consuming and laborious for projects that involve large numbers of artificial reefs. The cement and seabed silt mixture should improve on traditional cement paste by reducing the pH to increase the adhesion properties of the artificial reefs.
The XRD results showed a relatively high silicate content among the hydration products of the SAR paste, which may be related to the SiO2 content of the seabed silt (Table 1). As shown in Figure 5, the diffraction peaks of the SAR specimens, except for M6, gradually increased and became dense with curing time. This indicates that CaCO3 and SiO2 were gradually formed in the specimens, the content continued to increase, and the crystallinity also gradually increased during the hydration process. This is consistent with the results of the compressive strength tests. These XRD test results explain the increase in the compressive strength of the SAR specimens from a microscopic perspective. The deviation of the M6 specimen from the XRD trend is similar to the situation found in the study of tidal sludge [3], and the reason requires further study.
C–S–H gel is considered to be the source of mechanical strength in concrete. However, the C–S–H gel content of all of the specimens was small. The existence of C–S–H gel requires a stable and continuous alkaline environment, which the hydration product of cement, portlandite can provide. However, after a certain ratio of seabed silt was incorporated in the SAR specimen, most Ca(OH)2 was consumed in the hydration reaction, corresponding to the compressive strength results. Yet a high portlandite content would affect the adhesion and biological effects of the SAR. Therefore, the question of how to adjust the mass ratio of the components and control the Ca(OH)2 content within a reasonable range to maintain sufficient biological attachment without compromising the mechanical strength of the reef requires further study.
3.4. SEM Analysis
Figure 6 shows the SEM images of the SAR specimens of each mixture at 8 days. The observed hydration products of the SAR paste were mainly ettringite and C–S–H gel, and no portlandite was observed. The gaps between the ettringite were large, reflecting the hydration process of the C–S–H gel. As shown in Figure 7, the ettringite was interlaced with C–S–H gel to form a compact structure at 28 days, meaning that the compressive strength of the SAR specimens had increased. The SEM results show that the ettringite content of the SAR specimens decreased as the proportion of seabed silt increased, consistent with the analysis of compressive strength.
In Figure 8a, the ettringite needles had a diameter of about 60–90 nm. The spot under the red block of the ettringite needle in the M4 specimen at 28 days (Figure 8a) was tested by EDS, as shown in Figure 8b. The ettringite formed in the SAR paste contained Si, Mg, Ca, Al, S, and O (Figure 8b and Table 3), supporting the compositional analysis in the XRD test.
3.5. DSC
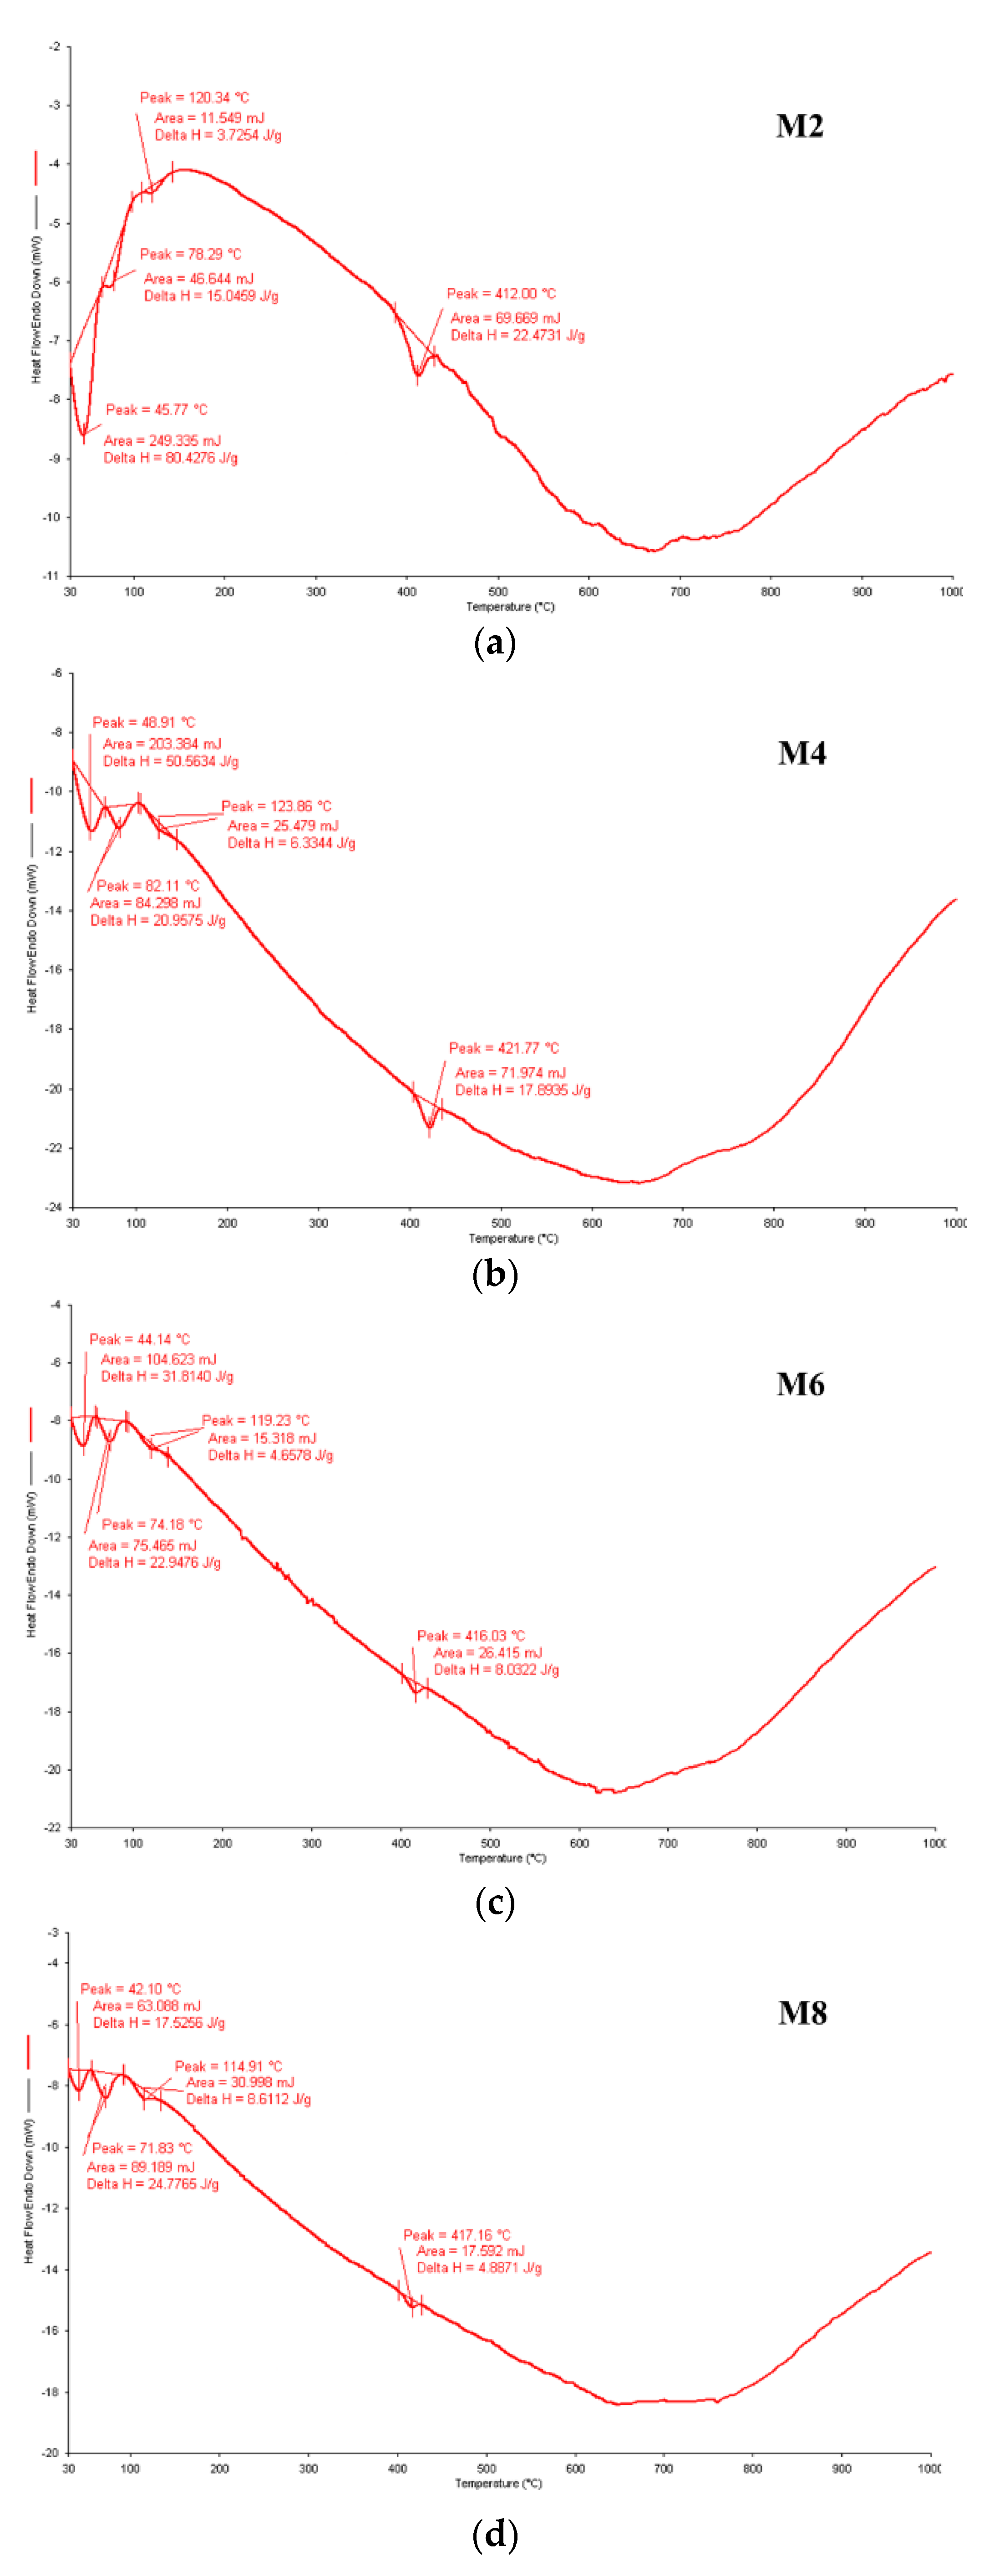
Figure 9 shows the DSC curves of the SAR paste with each mixture proportion at 28 days. The curve of the M2 paste shows strong endothermic peaks at 45.77 °C and 412.00 °C, and endothermic peaks at 78.29 °C and 120.34 °C; the M4 paste shows endothermic peaks at 48.91 °C, 82.11 °C, and 421.77 °C, and a minor peak at 123.66 °C; the M6 paste shows endothermic peaks at 44.14 °C and 74.18 °C, and minor peaks at 119.2 °C and 416.0 °C; and the M8 paste shows endothermic peaks at 42.10 °C and 71.83 °C, and minor peaks at 114.91 °C and 417.16 °C.
The thermogram of the cement paste shows two strong endothermic peaks at 117.9 °C and 446.9 °C [13]. The endothermic peak at 117.9 °C mainly corresponds to the dehydration of C–S–H gel and ettringite, and the endothermic peak at 446.9 °C can be attributed to the decomposition of portlandite. Therefore, the endothermic peaks below 100 °C mainly correspond to the dehydration of residual gypsum. The endothermic peaks from 119.2 °C to 123.66 °C are mainly related to the dehydration of C–S–H gel and ettringite, and those between 412.00 °C and 421.77 °C are mainly related to the decomposition of portlandite [32].
The DSC analysis reveals that the endothermic peaks of the SAR paste between 412.00 °C and 421.77 °C became weaker as the seabed silt mass in the mixture increased, indicating that the quantity of portlandite in the paste was decreasing. This is in good agreement with the XRD and SEM results.
4. Conclusion
- In this study, seabed silt was tested as a potential raw material for artificial reefs. The SAR specimens were composed purely of seabed silt and cement in four proportions. The compressive strength development and nutrient dissolution were examined in the SAR specimens. The hydration products of the SAR paste were investigated through XRD, SEM, and DSC techniques. The compressive strength of the SAR specimen was between that of C15 and C20, which was inversely proportional to their seabed silt content. The SAR specimens were able to continuously dissolve nitrogen-based nutrients, which is conducive to the improvement of primary productivity in the surrounding water. However, the effect on the N/P ratio in the surrounding water depends on the conditions of the seabed silt itself.
- The results of compressive strength and microstructure tests showed that the strength of the specimens increased continuously during the hydration process of the mixture of seabed silt and cement. The ettringite became interlaced with C–S–H gel to form a compact structure, but the main hydration products of the SAR paste were SiO2 and CaCO3. Ca(OH)2 was not detected in the SAR specimens, which may help to improve its adhesion and biological effects. This suggests that seabed silt can be partially mixed into AARs as a raw material.
- The potential bioadhesion effect of seabed silt and cement mixture needs further experimental verification, especially the influence of interaction between microorganisms and concrete materials. In addition, seabed silt may also contain heavy metals and other organic materials. Whether these substances will be dissolved out or influence the attachment and growth of algae also needs further study.
Author Contributions
Conceptualization, Z.J. and Z.L.; methodology, J.Z.; software, Z.N.; validation, Y.C.; formal analysis, L.Z.; investigation, Z.G.; resources, Z.L.; data curation, J.Z.; writing—original draft preparation, Z.J.; writing—review and editing, Z.J.; visualization, W.C.; supervision, Z.L.; project administration, Z.J.; funding acquisition, Y.C. and Z.L. All authors have read and agreed to the published version of the manuscript.
Funding
This research was funded by the National Natural Science Foundation of China, grant number 41771544 and the Fundamental Research Funds for the Central Universities, grant number 2019ZRJC006.
Acknowledgments
The authors are grateful to Y. Q. Xin, Q. H. Huo, and Q. Zhang for technical assistance and discussions.
Conflicts of Interest
The authors declare no financial and personal relationships with other people or organizations that can inappropriately influence our work, and there is no professional or other personal interest of any nature or kind in any product, service and/or company that could be construed as influencing the position presented in, or the review of, the manuscript entitled.
References
- Seaman, W.; Jensen, A.C. Purposes and practices of artificial reef evaluation. In Artificial Reef Evaluation with Application to Natural Marine Habitats; Seaman, W., Ed.; CRC Press: Boca Raton, FL, USA, 2000; pp. 95–120. [Google Scholar]
- Guilbeau, B.P.; Harry, F.P.; Gambrell, R.P.; Knopf, F.C.; Dooley, K.M. Algae attachment on carbonated cements in fresh and brackish waters—Preliminary results. Ecol. Eng. 2003, 20, 309–319. [Google Scholar] [CrossRef]
- Jiang, Z.Y.; Liang, Z.L.; Liu, Y. Application of Sludge in the preparation of artificial algal reef. Trans. Chin. Soc. Agric. Eng. 2014, 31, 242–245, (In Chinese with English abstract). [Google Scholar]
- Hanner, S.E.; McIntosh, T.L.; Blair, S.M. Development of benthic and fish assemblages on artificial reef materials compared to adjacent natural reef assemblages in Miami-Dade County, Florida. Bull. Mar. Sci. 2006, 78, 57–70. [Google Scholar]
- Yu, Y.G.; Gao, W.; Castel, A.; Liu, A.; Chen, X.J.; Liu, M.Y. Assessing external sulfate attack on thin-shell artificial reef structures under uncertainty. Ocean. Eng. 2020, 207, 107397. [Google Scholar] [CrossRef]
- Perkol-Finkel, S.; Zilman, G.; Sella, I.; Miloh, T.; Benayahu, Y. Floating and fixed artificial habitats: Spatial and temporal patterns of benthic communities in a coral reef environment. Estuar. Coast. Shelf Sci. 2008, 77, 491–500. [Google Scholar] [CrossRef]
- Relini, M.; Torchia, G.; Relini, G. Seasonal-variation of fish assemblages in the loano artificial reef (ligurian sea Northwestern Mediterranean). Bull. Mar. Sci. 1994, 55, 401–417. [Google Scholar]
- Patranella, A.; Kilfoyle, K.; Pioch, S.; Spieler, RE. Artificial reefs as juvenile fish habitat in a marina. J. Coast. Res. 2017, 33, 1341–1351. [Google Scholar] [CrossRef]
- Lemoine, H.R.; Paxton, A.B.; Anisfeld, S.C.; Rosemond, R.C. Selecting the optimal artificial reefs to achieve fish habitat enhancement goals. Biol. Conserv. 2019, 238, 108200. [Google Scholar] [CrossRef]
- Frease, R.A.; Windsor, J.G. Behavior of selected polycyclic aromatic-hydrocarbons associated with stabilized oil and coal ash artificial reef. Mar. Pollut. Bull. 1991, 22, 15–19. [Google Scholar] [CrossRef]
- Kress, N.; Tom, M.; Spanier, E. The use of coal fly ash in concrete for marine artificial reefs in the southeastern Mediterranean: Compressive strength, sessile biota, and chemical composition. ICES J. Mar. Sci. 2002, 59, S231–S237. [Google Scholar] [CrossRef] [Green Version]
- Katherine, K.Y.L. Coral recruitment onto an experimental pulverised fuel ash–concrete artificial reef. Mar. Pollut. Bull. 2003, 46, 642–653. [Google Scholar]
- Bigdeli, Y.; Barbato, M.; Lofton, C.D.; Gutierrez-Wing, M.T.; Rusch, K.A. Mechanical properties and performance under laboratory and field conditions of a lightweight fluorogypsum-based blend for economic artificial-reef construction. J. Mater. Civ. Eng. 2020, 32, 04020172. [Google Scholar] [CrossRef]
- Huang, X.Y.; Wang, Z.J.; Liu, Y.; Hu, W.T.; Ni, W. On the use of blast furnace slag and steel slag in the preparation of green artificial reef concrete. Constr. Build. Mater. 2016, 112, 241–246. [Google Scholar] [CrossRef]
- Pan, S.Y.; Adhikari, R.; Chen, Y.H.; Li, P.; Chiang, P.C. Integrated and innovative steel slag utilization for iron reclamation, green material production and CO2 fixation via accelerated carbonation. J. Clean Prod. 2016, 137, 617–631. [Google Scholar] [CrossRef]
- Onoue, K.; Shimono, S. Iron supply capacity of porous concrete using steelmaking slag aggregate for seaweed beds or fish reef blocks. J. Sustain. Met. 2018, 4, 333–342. [Google Scholar] [CrossRef]
- Okumura, S.; Kayano, Y.; Kusaka, K.; Tsumura, S.; Maruyama, K. Experimental release of juvenile red spotted grouper Epinephelus akaara into the artificial reefs made of scallop Patinopecten yessoensis shells. Nippon. Suisan Gakkaishi 2003, 69, 917–925. [Google Scholar] [CrossRef] [Green Version]
- Xu, Q.Z.; Zhang, L.B.; Zhang, T.; Zhou, Y.; Xia, S.D.; Liu, H.; Yang, H.S. Effects of an artificial oyster shell reef on macrobenthic communities in Rongcheng Bay, East China. Chin. J. Oceanol. Limnol. 2014, 32, 99–110. [Google Scholar] [CrossRef]
- Liu, G.S.; Li, W.T.; Zhang, X.M. Assessment of the benthic macrofauna in an artificial shell reef zone in Shuangdao Bay, Yellow Sea. Mar. Pollut. Bull. 2017, 114, 778–785. [Google Scholar] [CrossRef]
- Callaway, R. Interstitial space and trapped sediment drive benthic communities in artificial shell and rock reefs. Front. Mar. Sci. 2018, 5, 1–10. [Google Scholar] [CrossRef]
- Souche, J.C.; Saout, G.L.; Salgues, M.; Pioch, S. Effect of concrete with bio-active admixture on marine colonisation in mediterranean environment. Matériaux Tech. 2016, 104, 504–512. [Google Scholar] [CrossRef]
- Hayek, M.; Salgues, M.; Habouzit, F.; Bayle, S.; Souche, J.C.; De Weerdt, K.; Pioch, S. The influence of carbonation on the biocolonization of cementitious materials in the marine environment. Matériaux Tech. 2020, 108, 202. [Google Scholar] [CrossRef]
- Lu, X.X.; Ran, L.S.; Liu, S.; Jiang, T.; Zhang, S.R.; Wang, J.J. Sediment loads response to climate change: A preliminary study of eight large Chinese rivers. Int. J. Sediment. Res. 2013, 28, 1–14. [Google Scholar] [CrossRef]
- Liu, C.; Sui, J.Y.; He, Y.; Hirshfield, F. Changes in runoff and sediment load from major Chinese rivers to the Pacific Ocean over the period 1955–2010. Int. J. Sediment. Res. 2013, 28, 486–492. [Google Scholar] [CrossRef]
- Liu, G.S.; Cai, X.Y.; Tong, F.; Wang, L.; Zhang, X.M. Investigation of massive death of sea cucumber in artificial reef zone of Shuangdao Bay, Weihai. Fish. Inf. Strategy 2014, 29, 122–129, (In Chinese with English abstract). [Google Scholar]
- Ministry of Construction; The State Administration of Quality Supervision; Inspection and Quarantine People’s Republic of China. GB/T50081-2002 Standard for Test Method of Mechanical Properties on Ordinary Concrete; Ministry of Construction: Bejing, China, 2002.
- The State Administration of Quality Supervision; Inspection and Quarantine People’s Republic of China. GB/T 12763.4-2007 Specifications for Oceanographic Survey–Part 4: Survey of Chemical Parameters in Sea Water; The State Administration of Quality Supervision: Beijing, China, 2007.
- Ministry of Construction; The State Administration of Quality Supervision; Inspection and Quarantine People’s Republic of China. GB 50010-2010 Code for Design of Concrete Structures; Ministry of Construction: Bejing, China, 2010.
- Xu, Q.; Ji, T.; Yang, Z.; Ye, Y. Preliminary investigation of artificial reef concrete with sulphoaluminate cement, marine sand and sea water. Constr. Build. Mater. 2019, 211, 837–846. [Google Scholar] [CrossRef]
- Lourenco, S.O.; Barbarino, E.; Nascimento, A.; Freitas, J.N.P.; Diniz, G.S. Tissue nitrogen and phosphorus in seaweeds in a tropical eutrophic environment: What a long-term study tells us. J. Appl. Phycol. 2006, 18, 389–398. [Google Scholar] [CrossRef]
- Huo, S.; Liu, J.; Zhu, F.; Basheer, S.; Necas, D.; Zhang, R.; Li, K.; Chen, D.; Cheng, P.; Cobb, K.; et al. Post treatment of swine anaerobic effluent by weak electric field following intermittent vacuum assisted adjustment of N:P ratio for oil-rich filamentous microalgae production. Bioresour. Technol. 2020, 314, 123718. [Google Scholar] [CrossRef]
- Ghorbel, H.; Samet, B. Effect of iron on pozzolanic activity of kaolin. Constr. Build. Mater. 2013, 44, 185–191. [Google Scholar] [CrossRef]
Figure 1.
Compressive strength of the silt artificial reef (SAR) specimens.
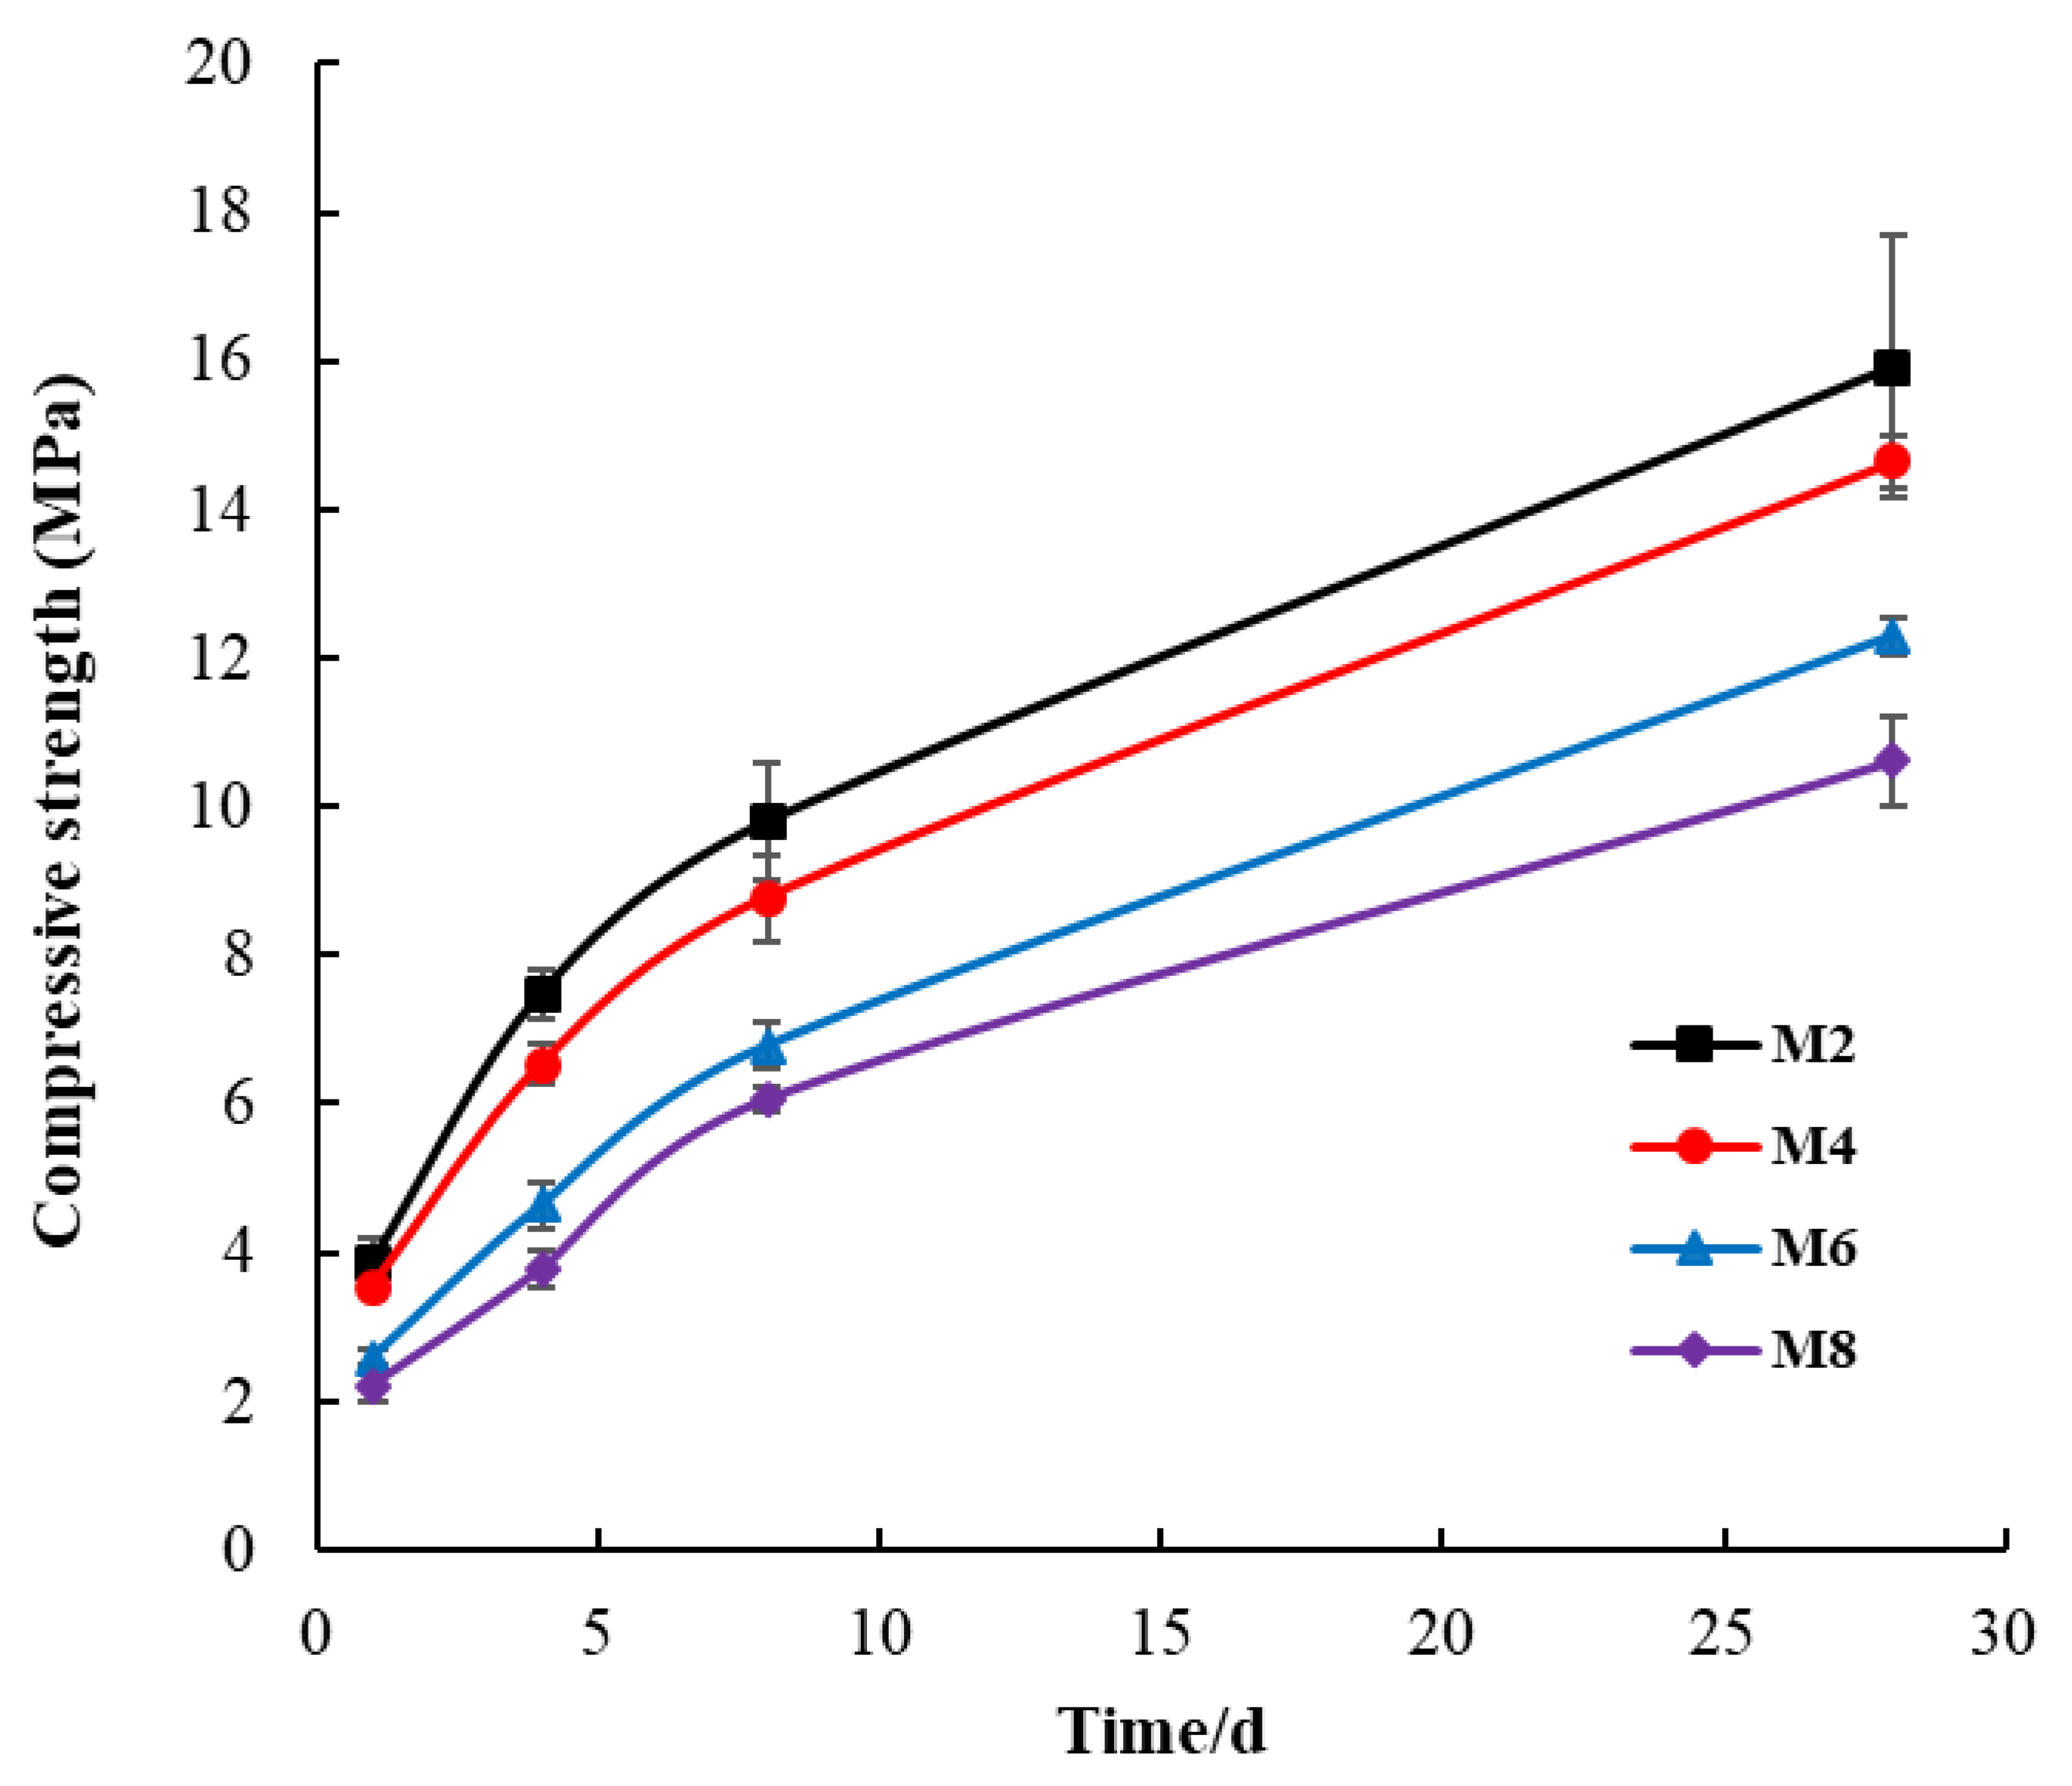
Figure 2.
Nitrogen dissolution (M2: y = 16.647x0.3229, R2 = 0.9777; M4: y = 15.487x0.3515, R2 = 0.8646; M6: y = 20.766x0.3679, R2 = 0.8608; M8: y = 18.421x0.4714, R2 = 0.8207).
Figure 2.
Nitrogen dissolution (M2: y = 16.647x0.3229, R2 = 0.9777; M4: y = 15.487x0.3515, R2 = 0.8646; M6: y = 20.766x0.3679, R2 = 0.8608; M8: y = 18.421x0.4714, R2 = 0.8207).
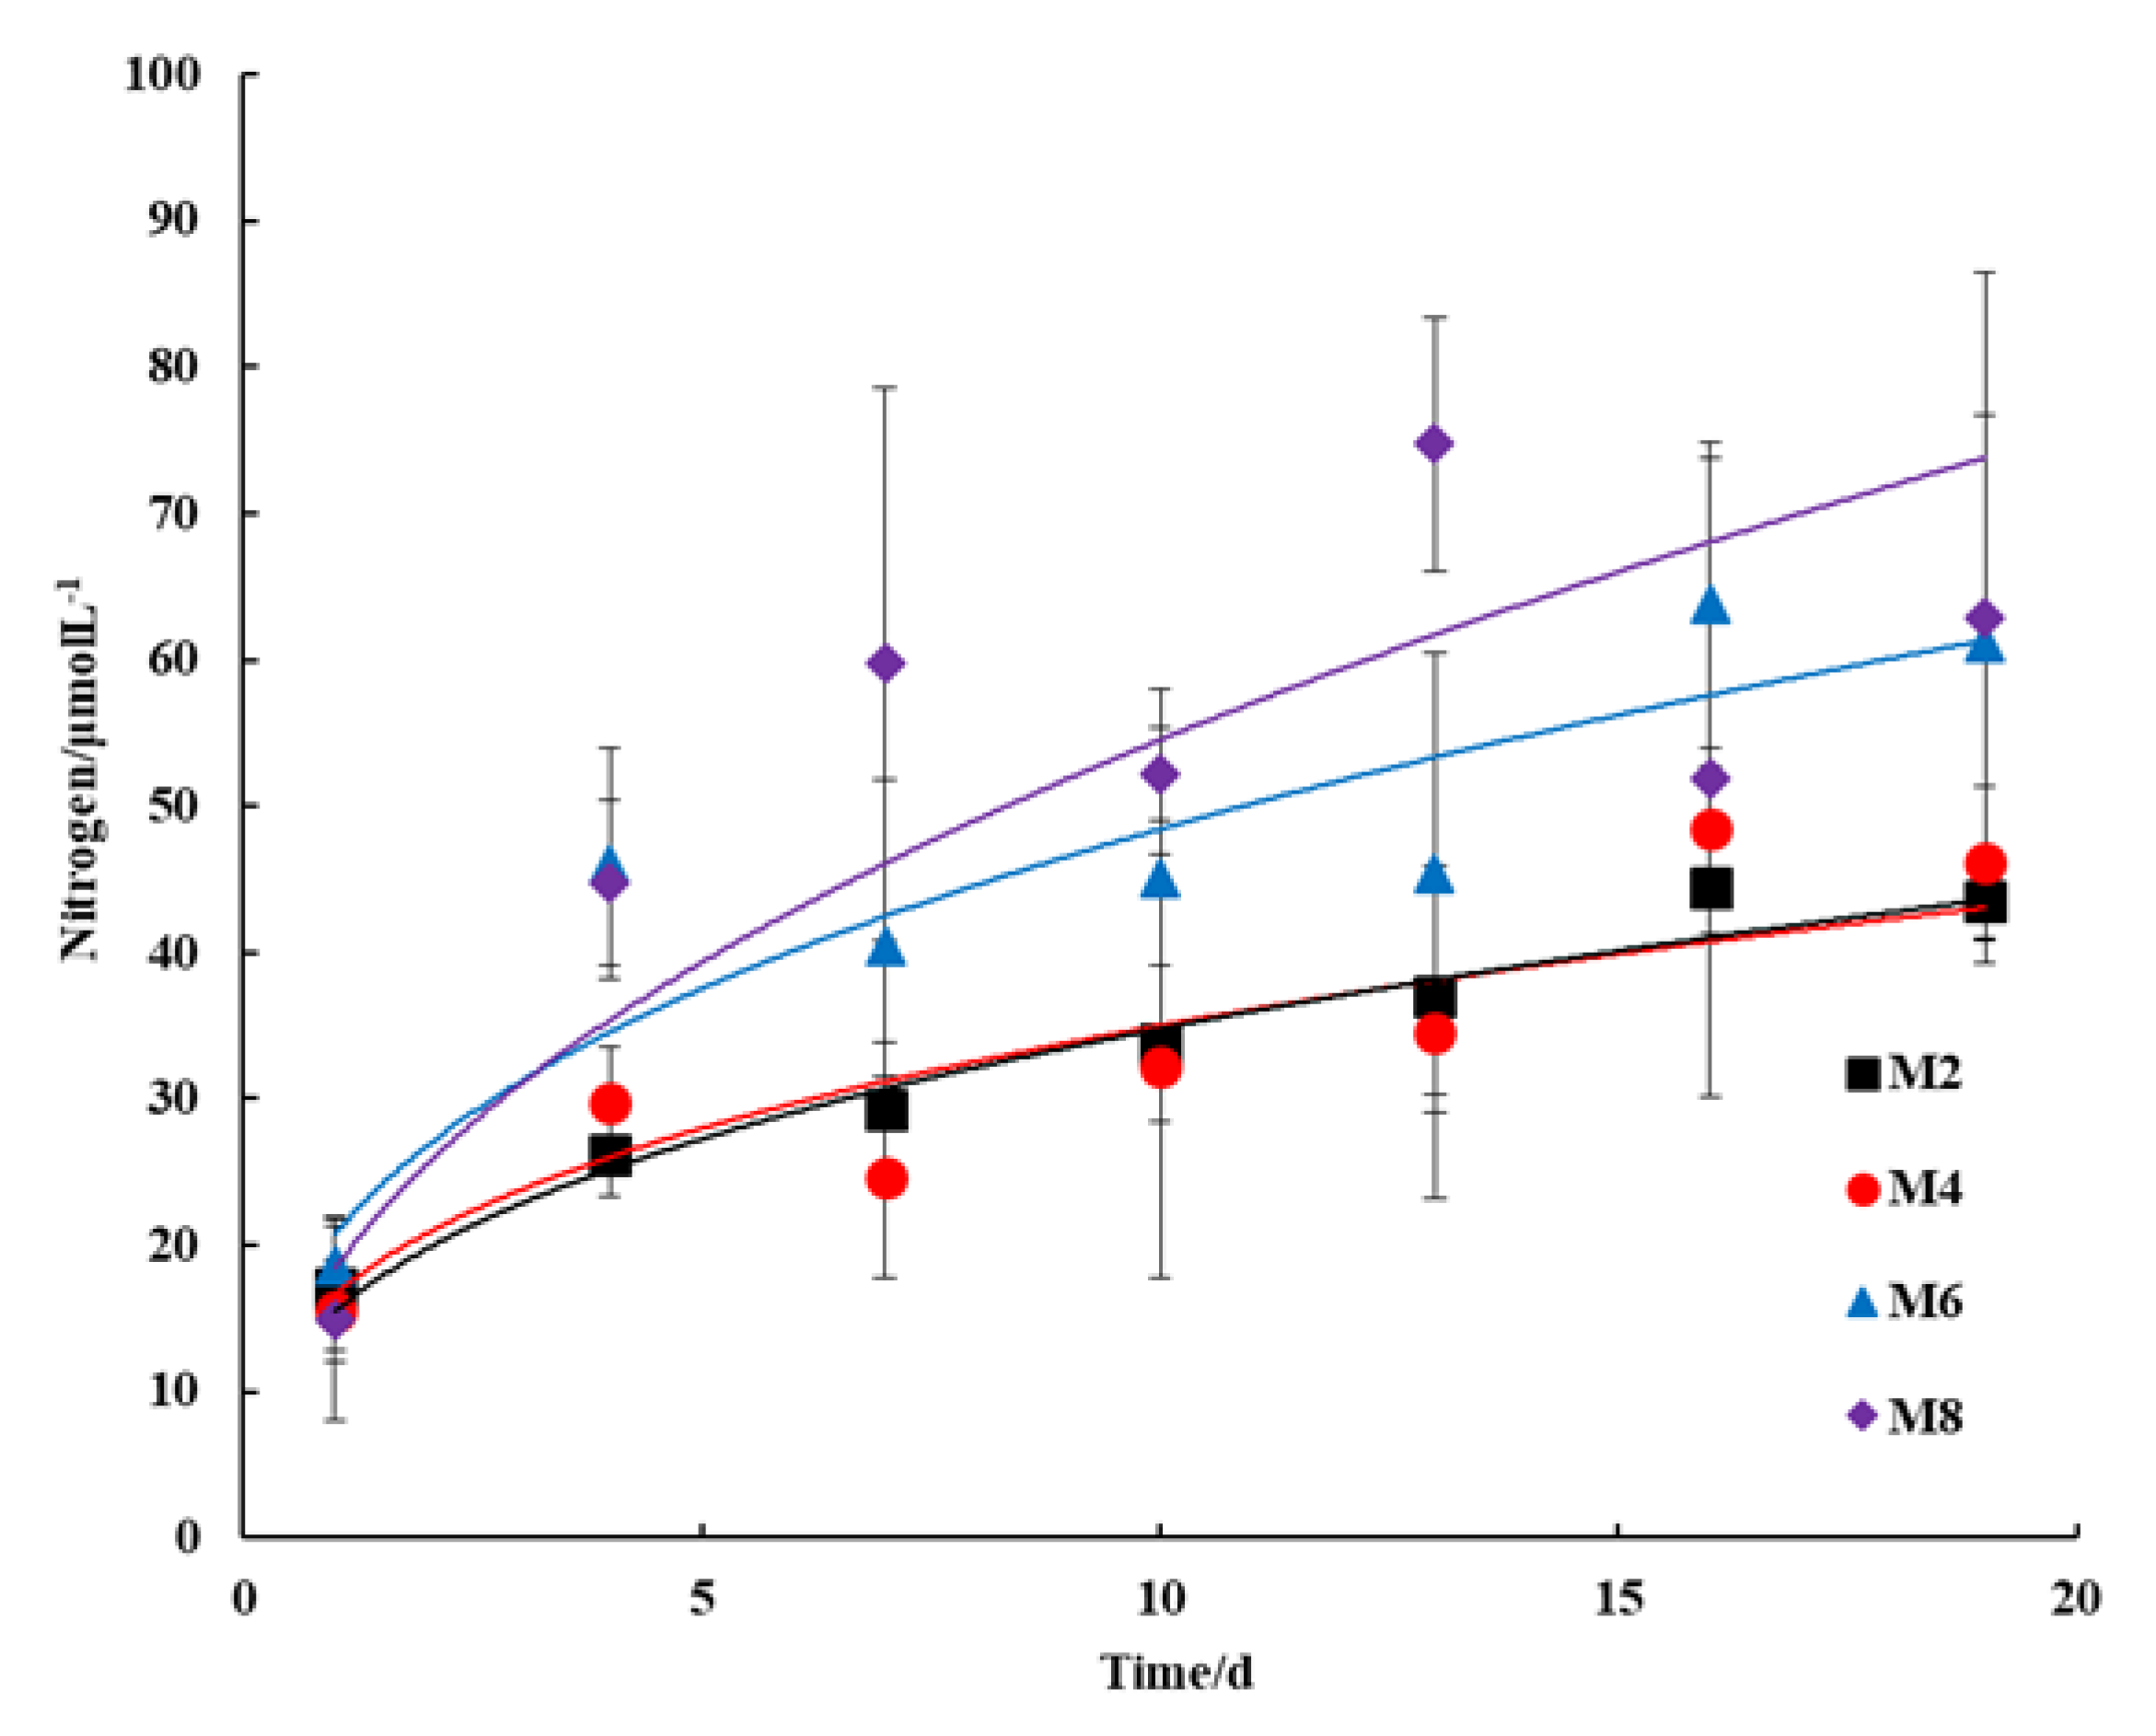
Figure 3.
Phosphorus dissolution (M2: y = 1.2205x−0.662, R2 = 0.8905; M4: y = 1.364x−0.683, R2 = 0.9122; M6: y = 1.6231x−0.748, R2 = 0.8931; M8: y = 1.1557x−0.53, R2 = 0.8975).
Figure 3.
Phosphorus dissolution (M2: y = 1.2205x−0.662, R2 = 0.8905; M4: y = 1.364x−0.683, R2 = 0.9122; M6: y = 1.6231x−0.748, R2 = 0.8931; M8: y = 1.1557x−0.53, R2 = 0.8975).
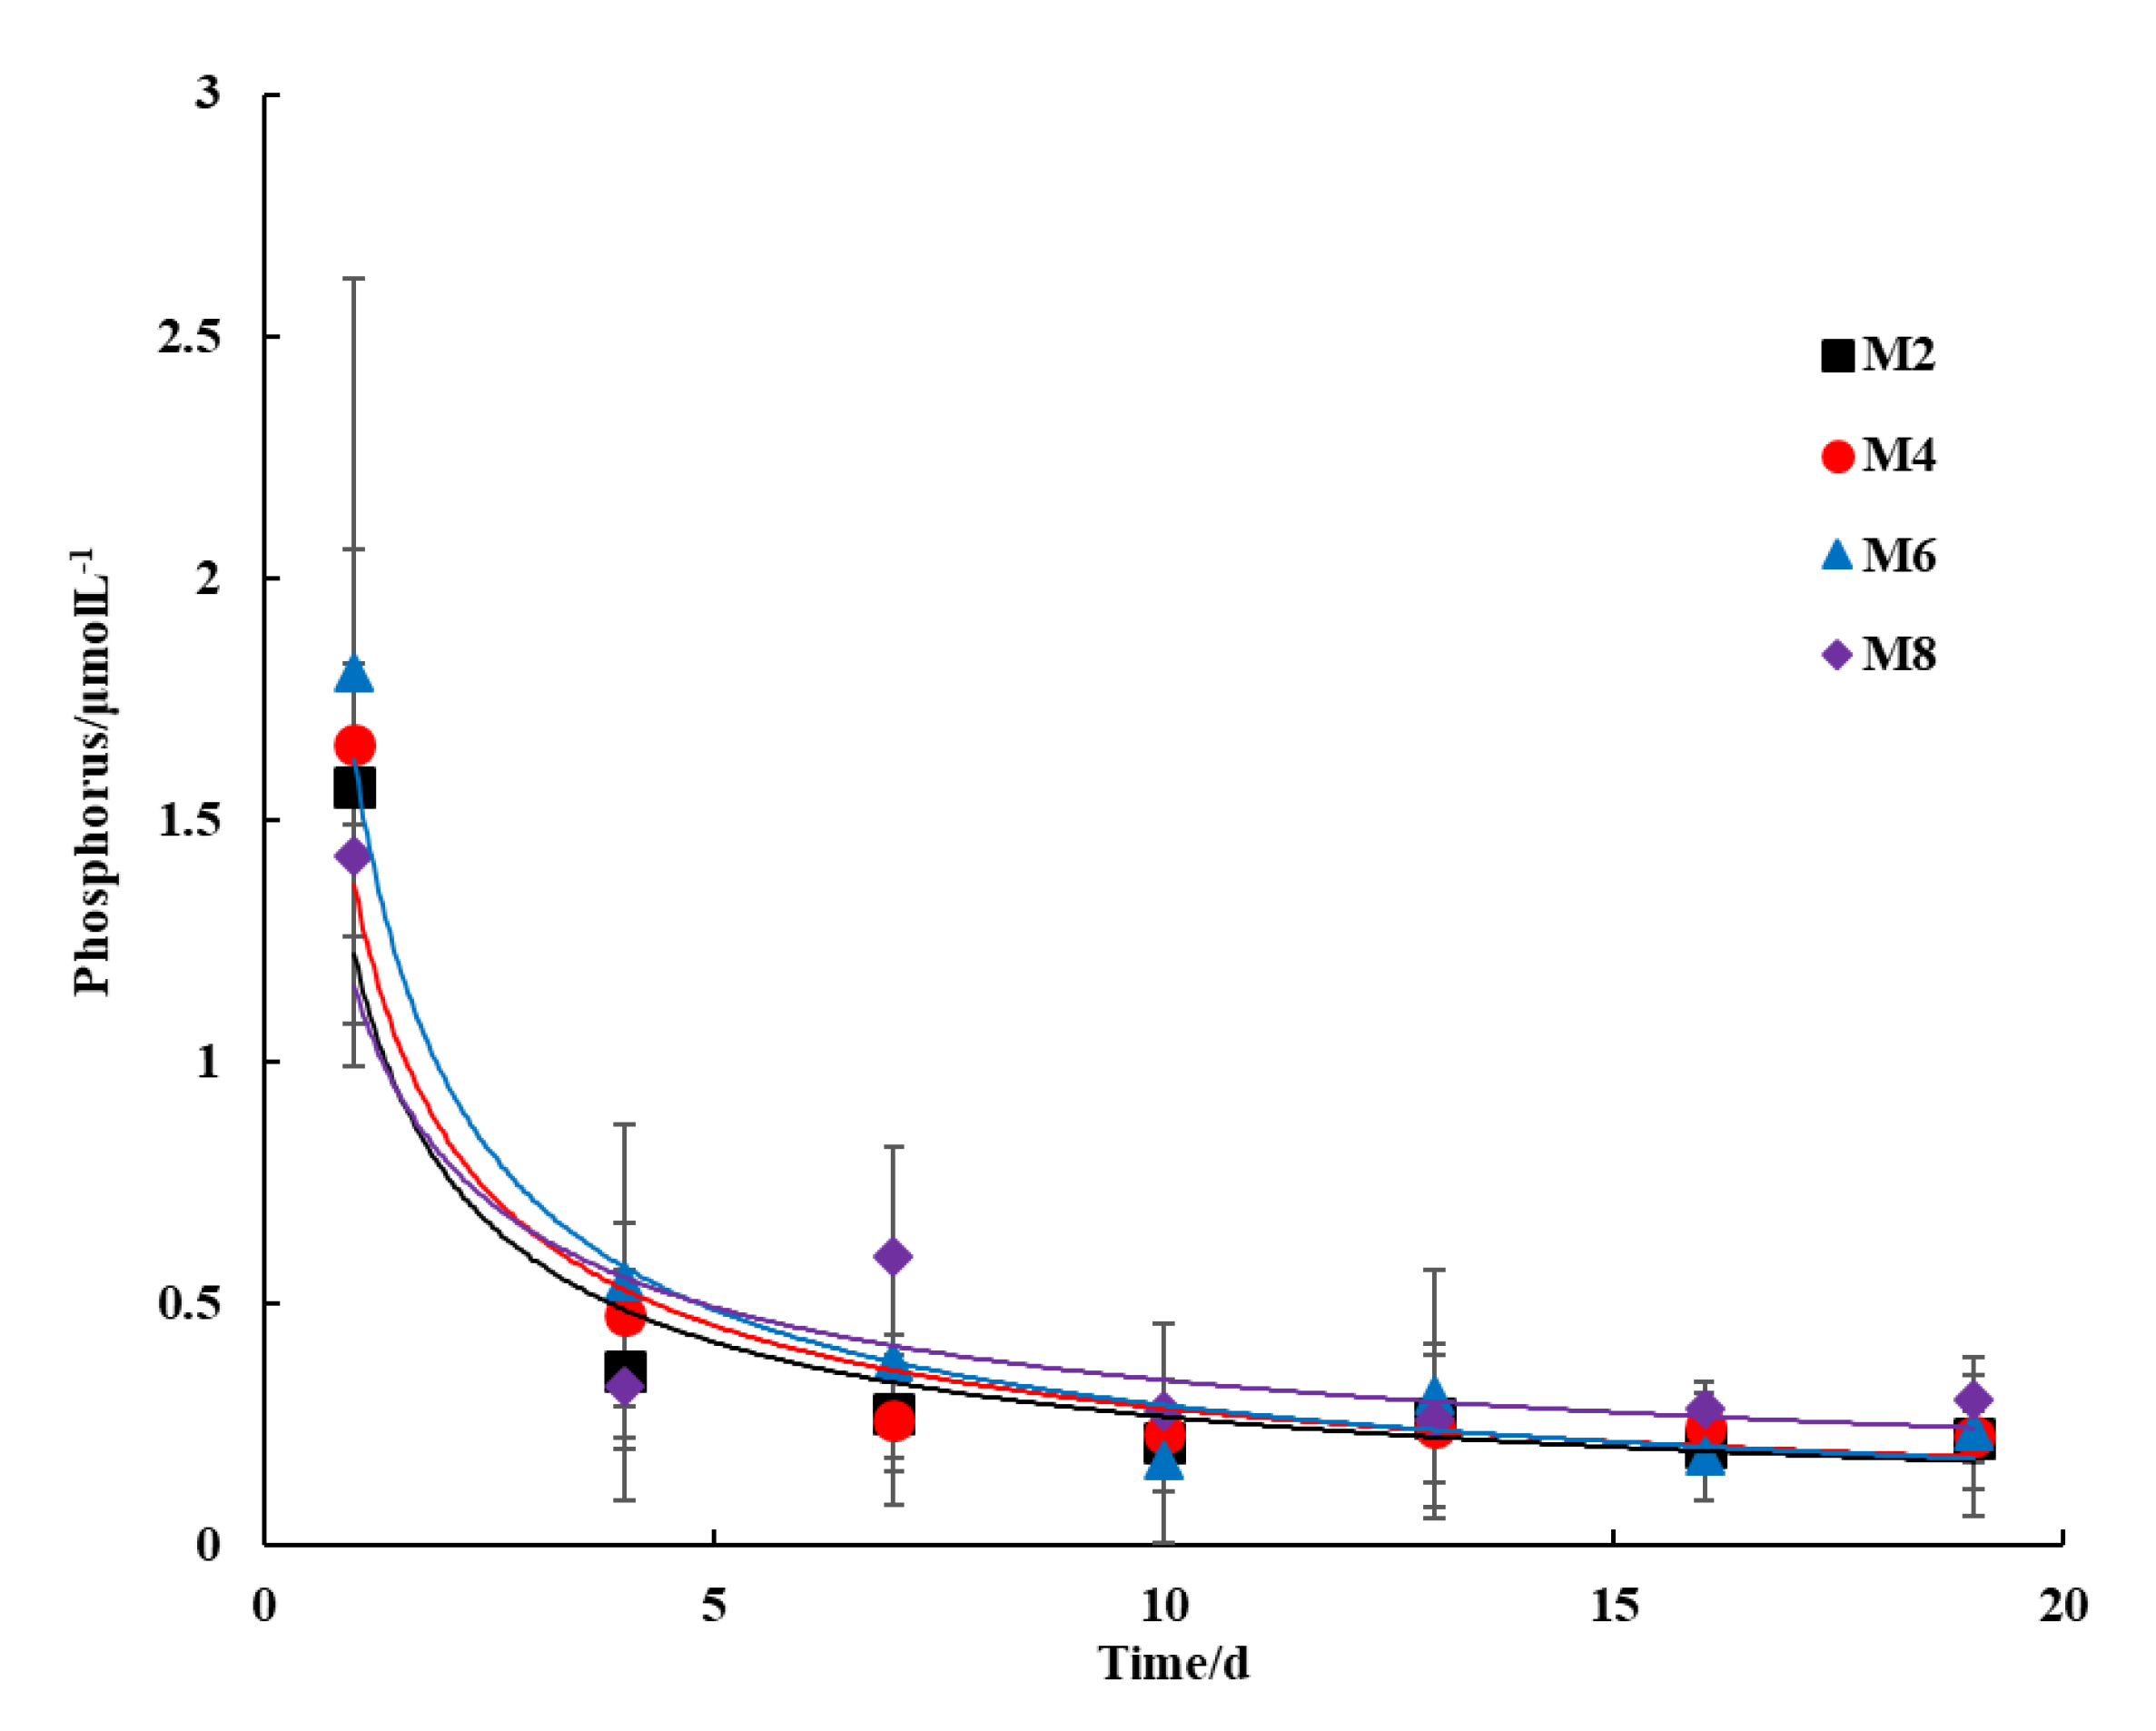
Figure 4.
XRD patterns of SAR paste at 8 days. (P): portlandite; (G): gypsum; (C): C–S–H; (E): ettringite; (Ca): CaCO3; (Q): SiO2.
Figure 4.
XRD patterns of SAR paste at 8 days. (P): portlandite; (G): gypsum; (C): C–S–H; (E): ettringite; (Ca): CaCO3; (Q): SiO2.

Figure 5.
XRD patterns of SAR paste at 1, 8, and 28 days.
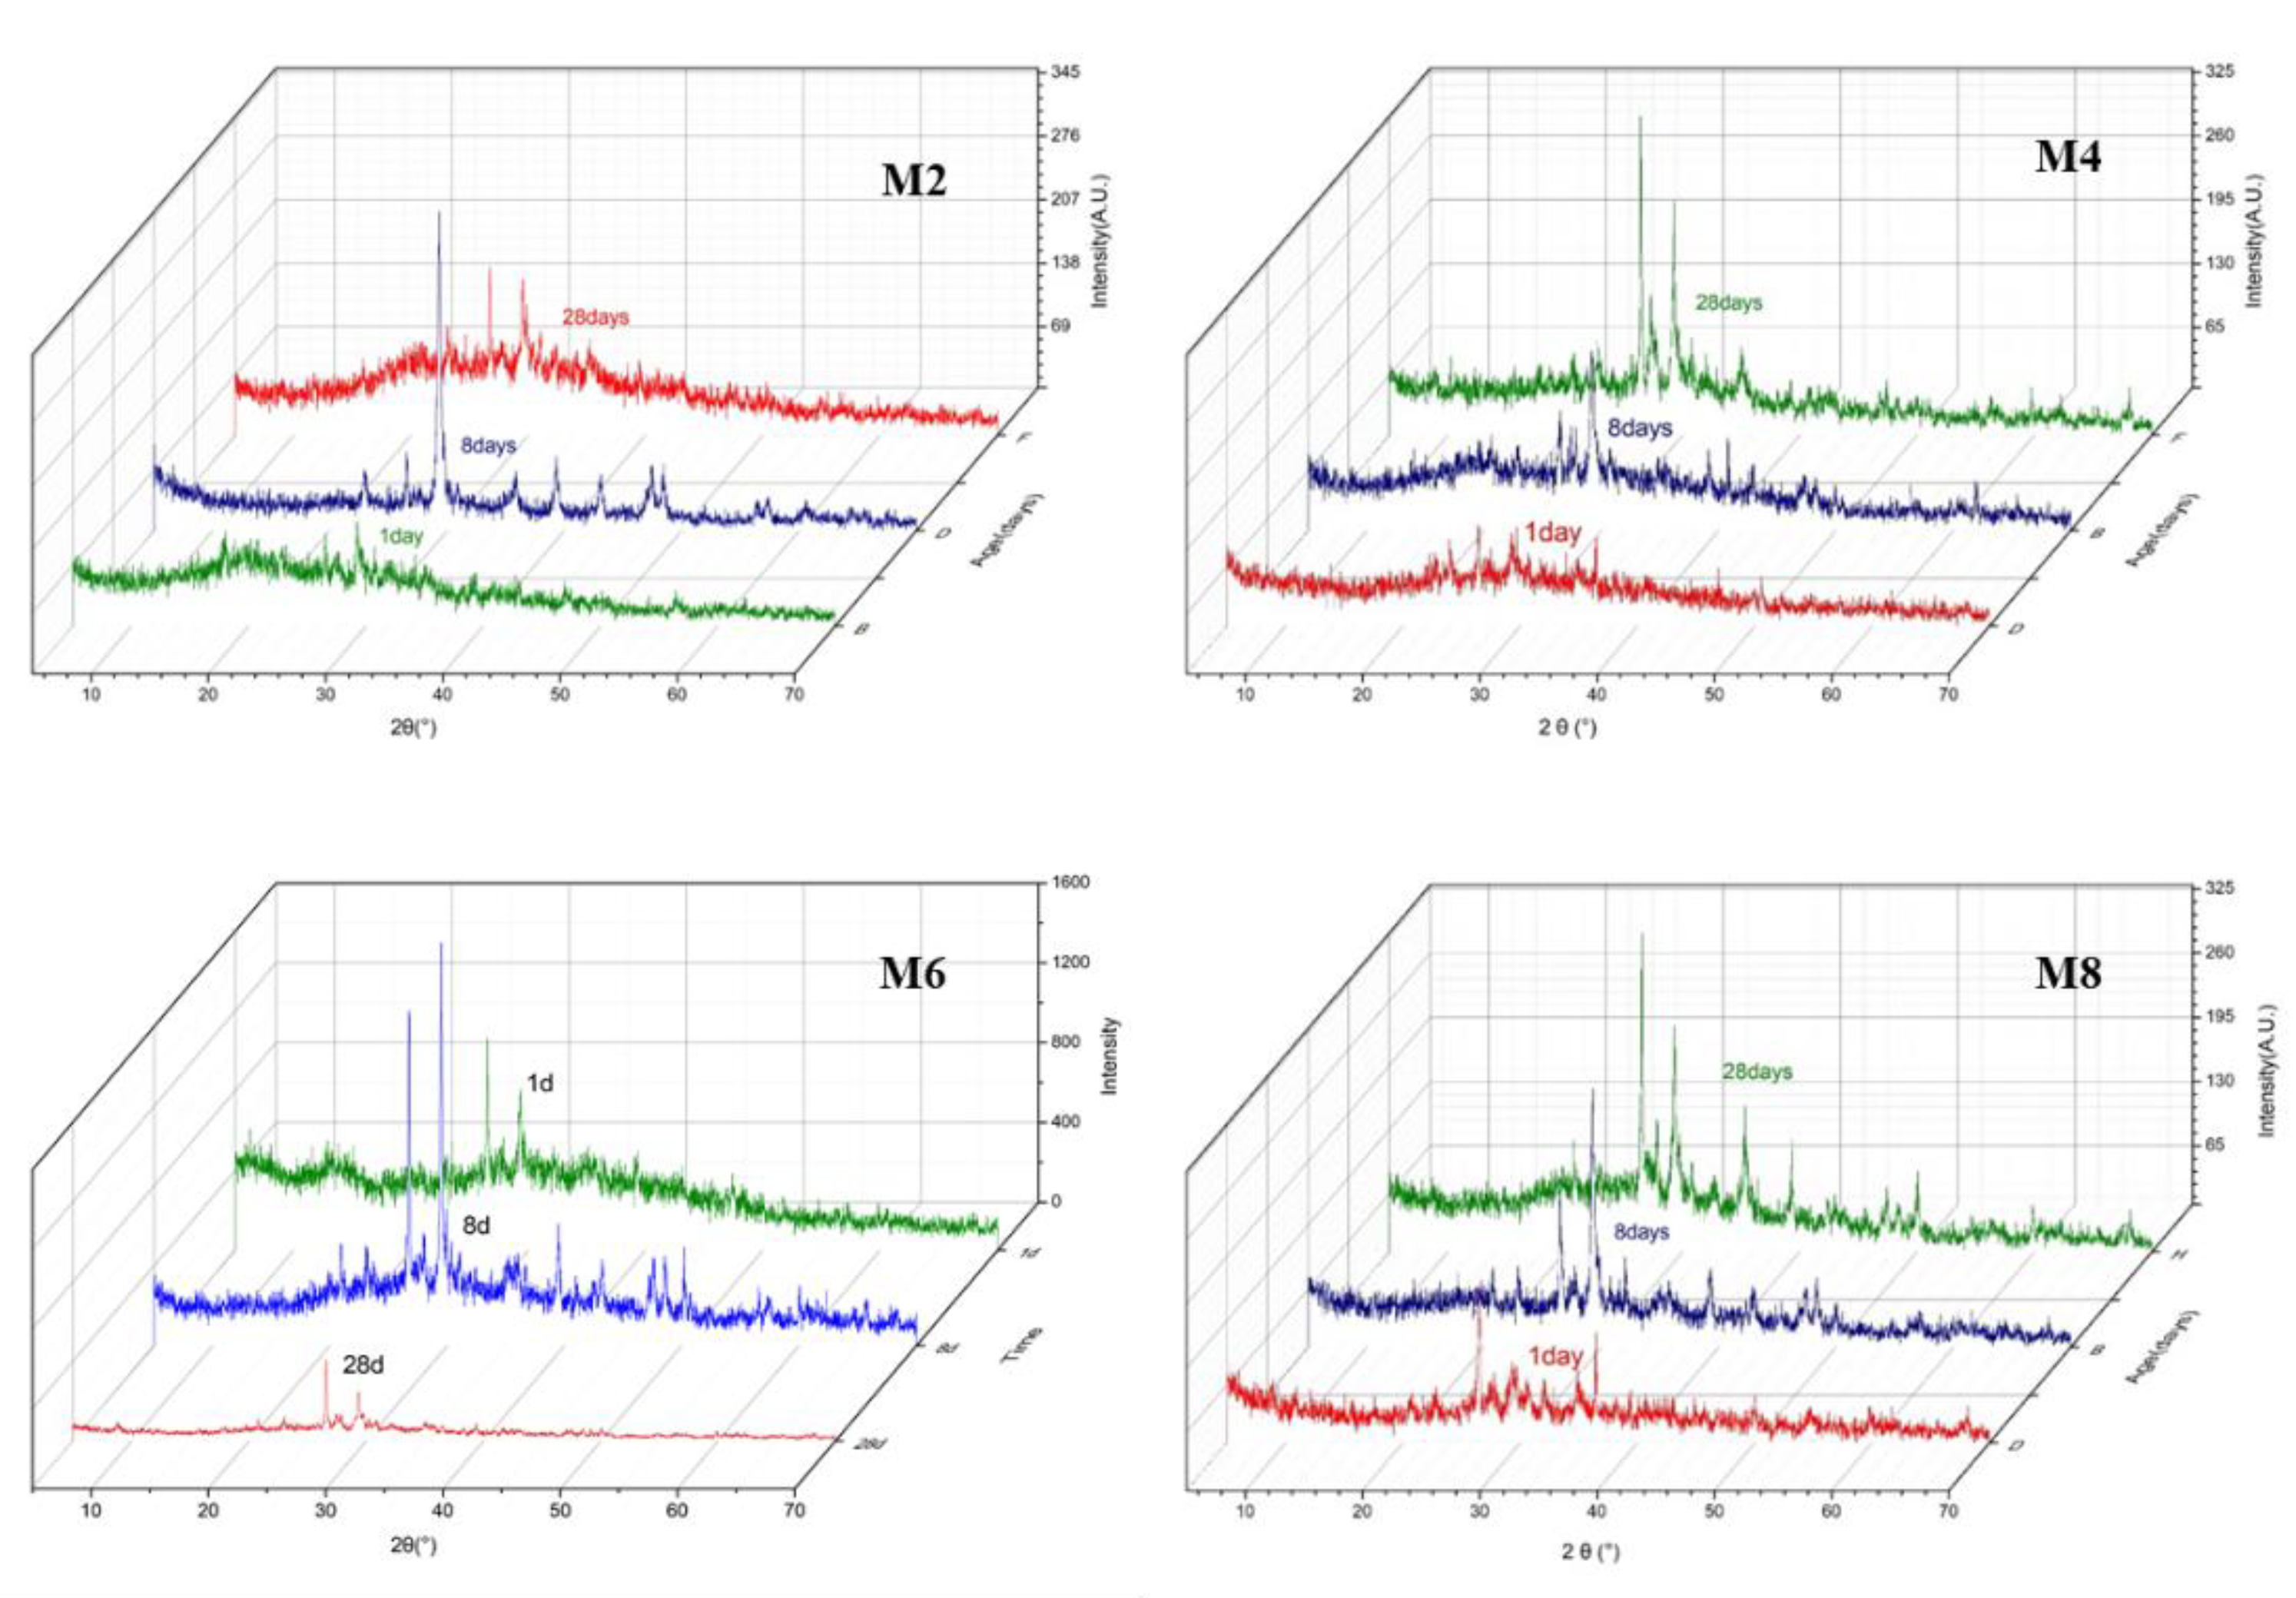
Figure 6.
SEM images of the SAR specimens at 8 days.
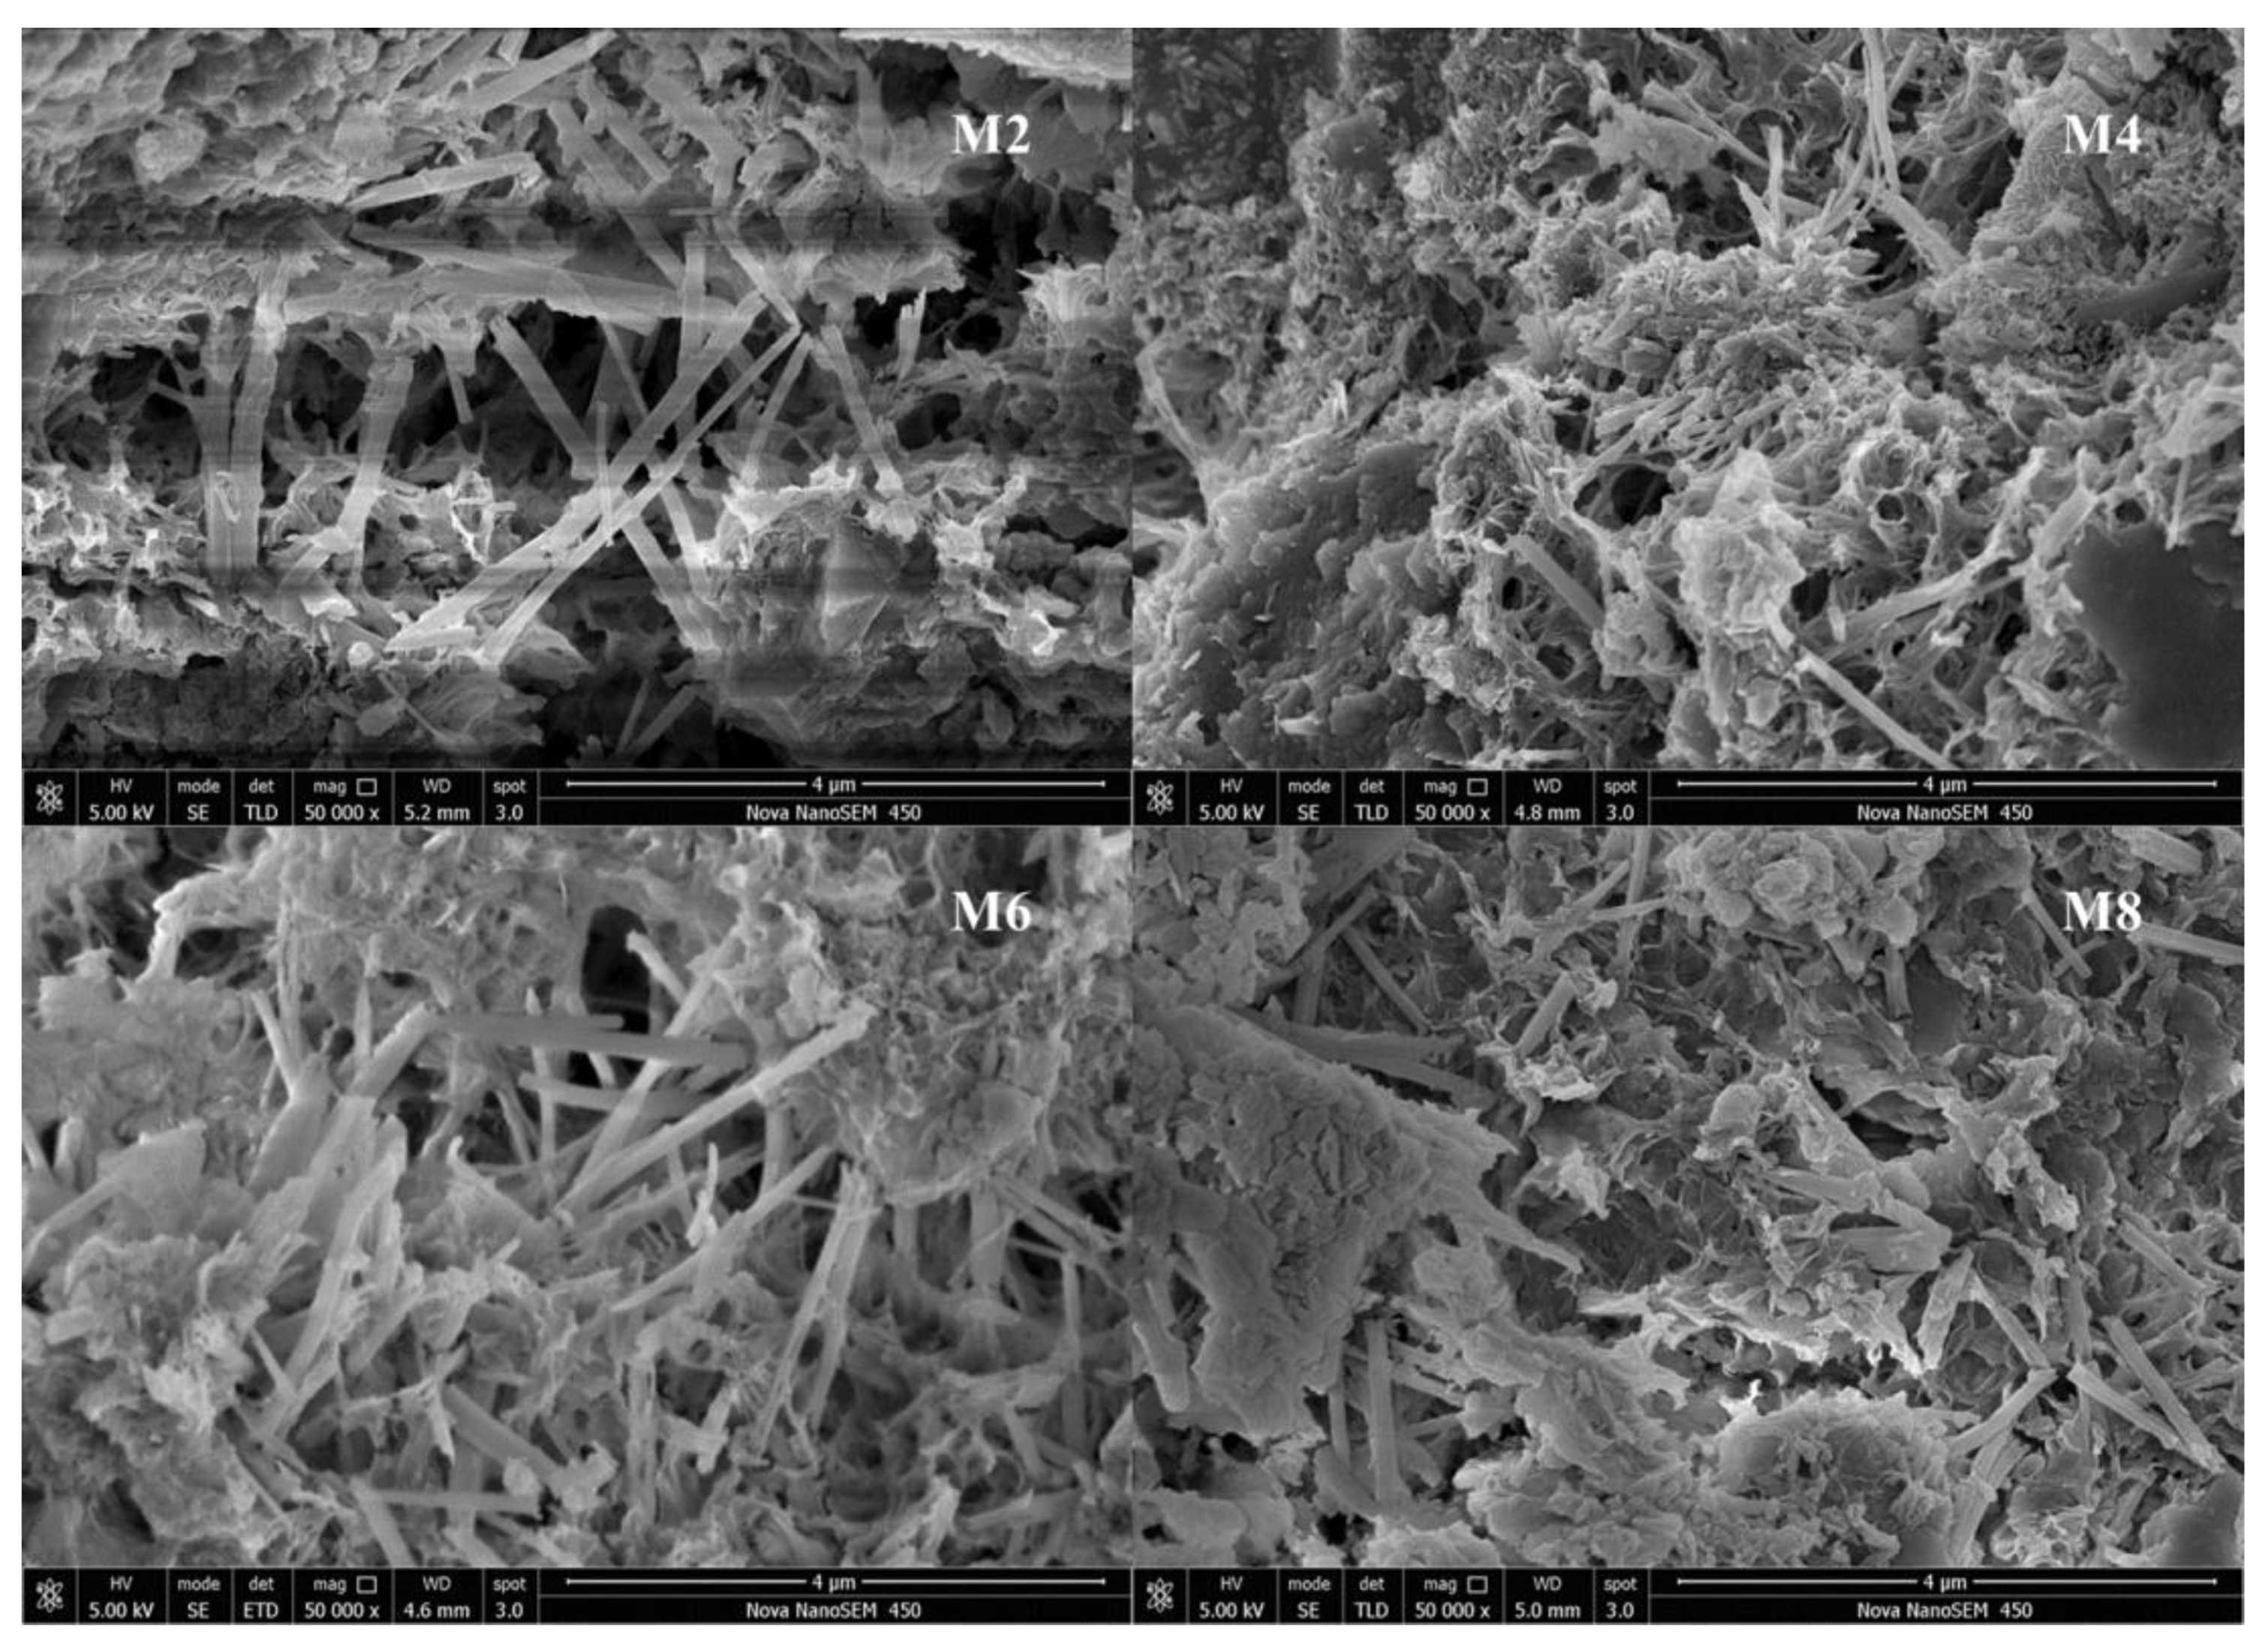
Figure 7.
SEM images of SAR specimens at 28 days.
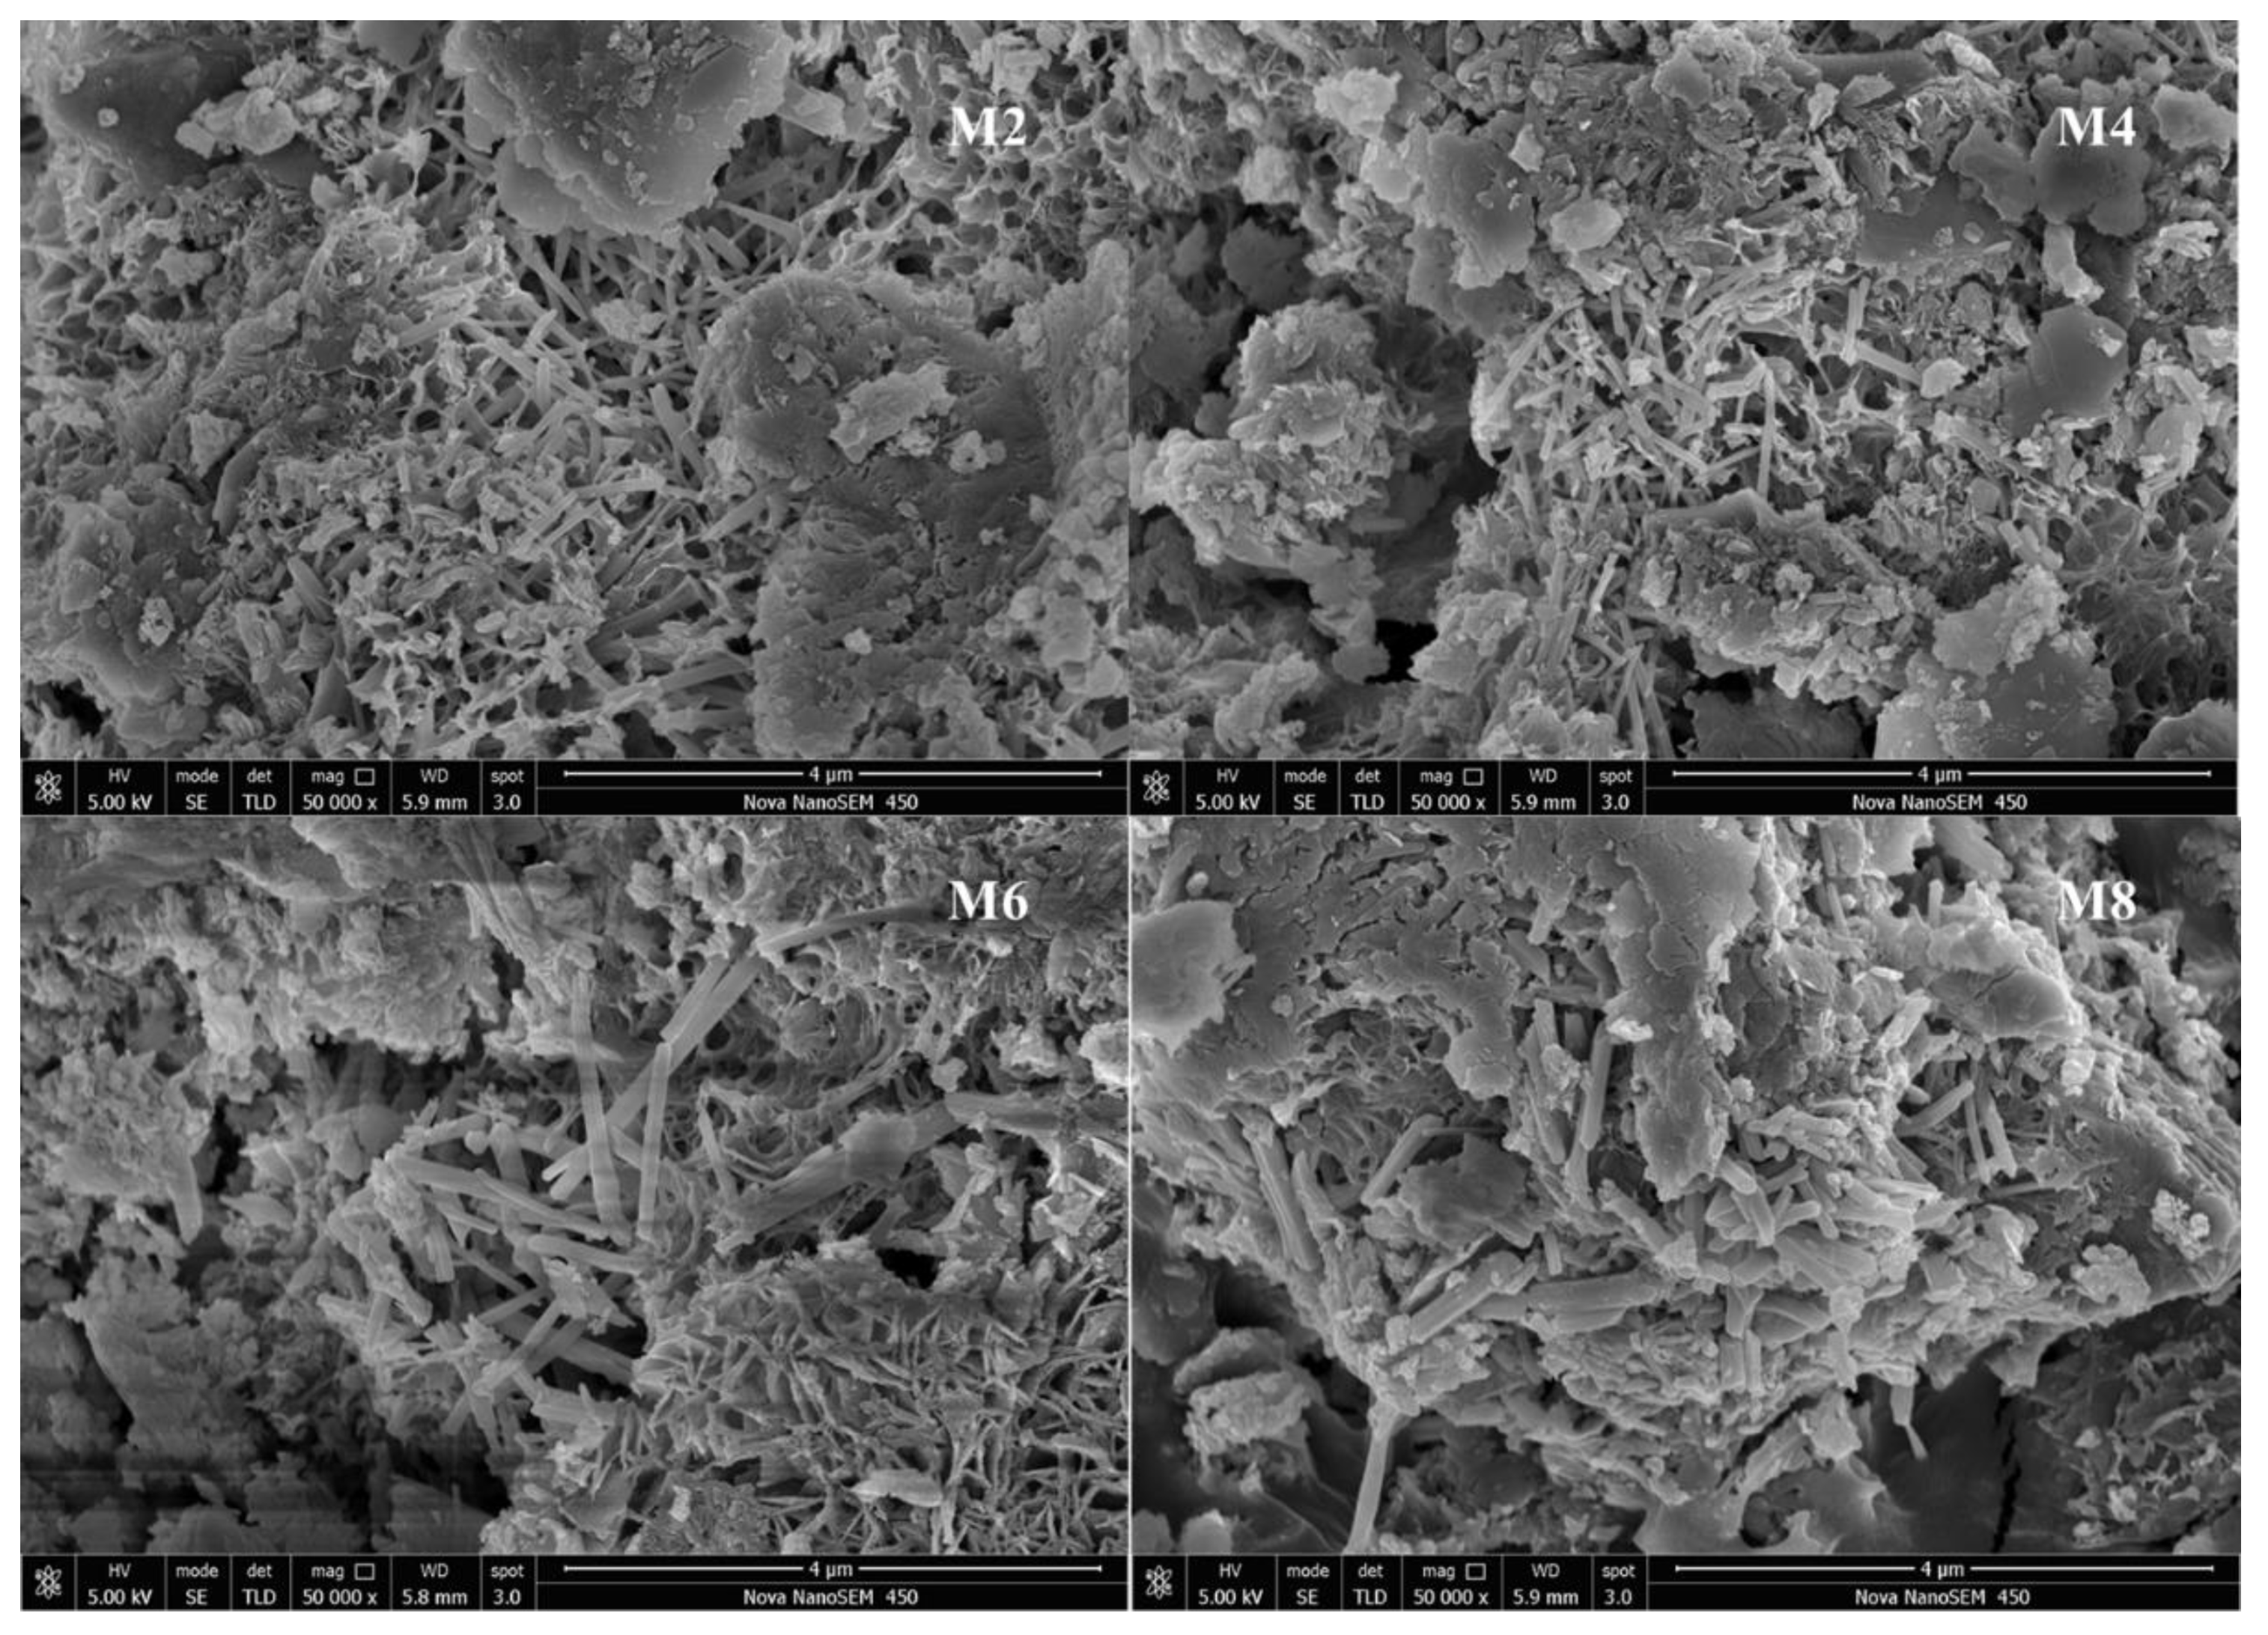
Figure 8.
SEM images of the M4 specimen at 28 days. (a): 28 days; (b): EDS of the spot under the red block in (a).
Figure 8.
SEM images of the M4 specimen at 28 days. (a): 28 days; (b): EDS of the spot under the red block in (a).
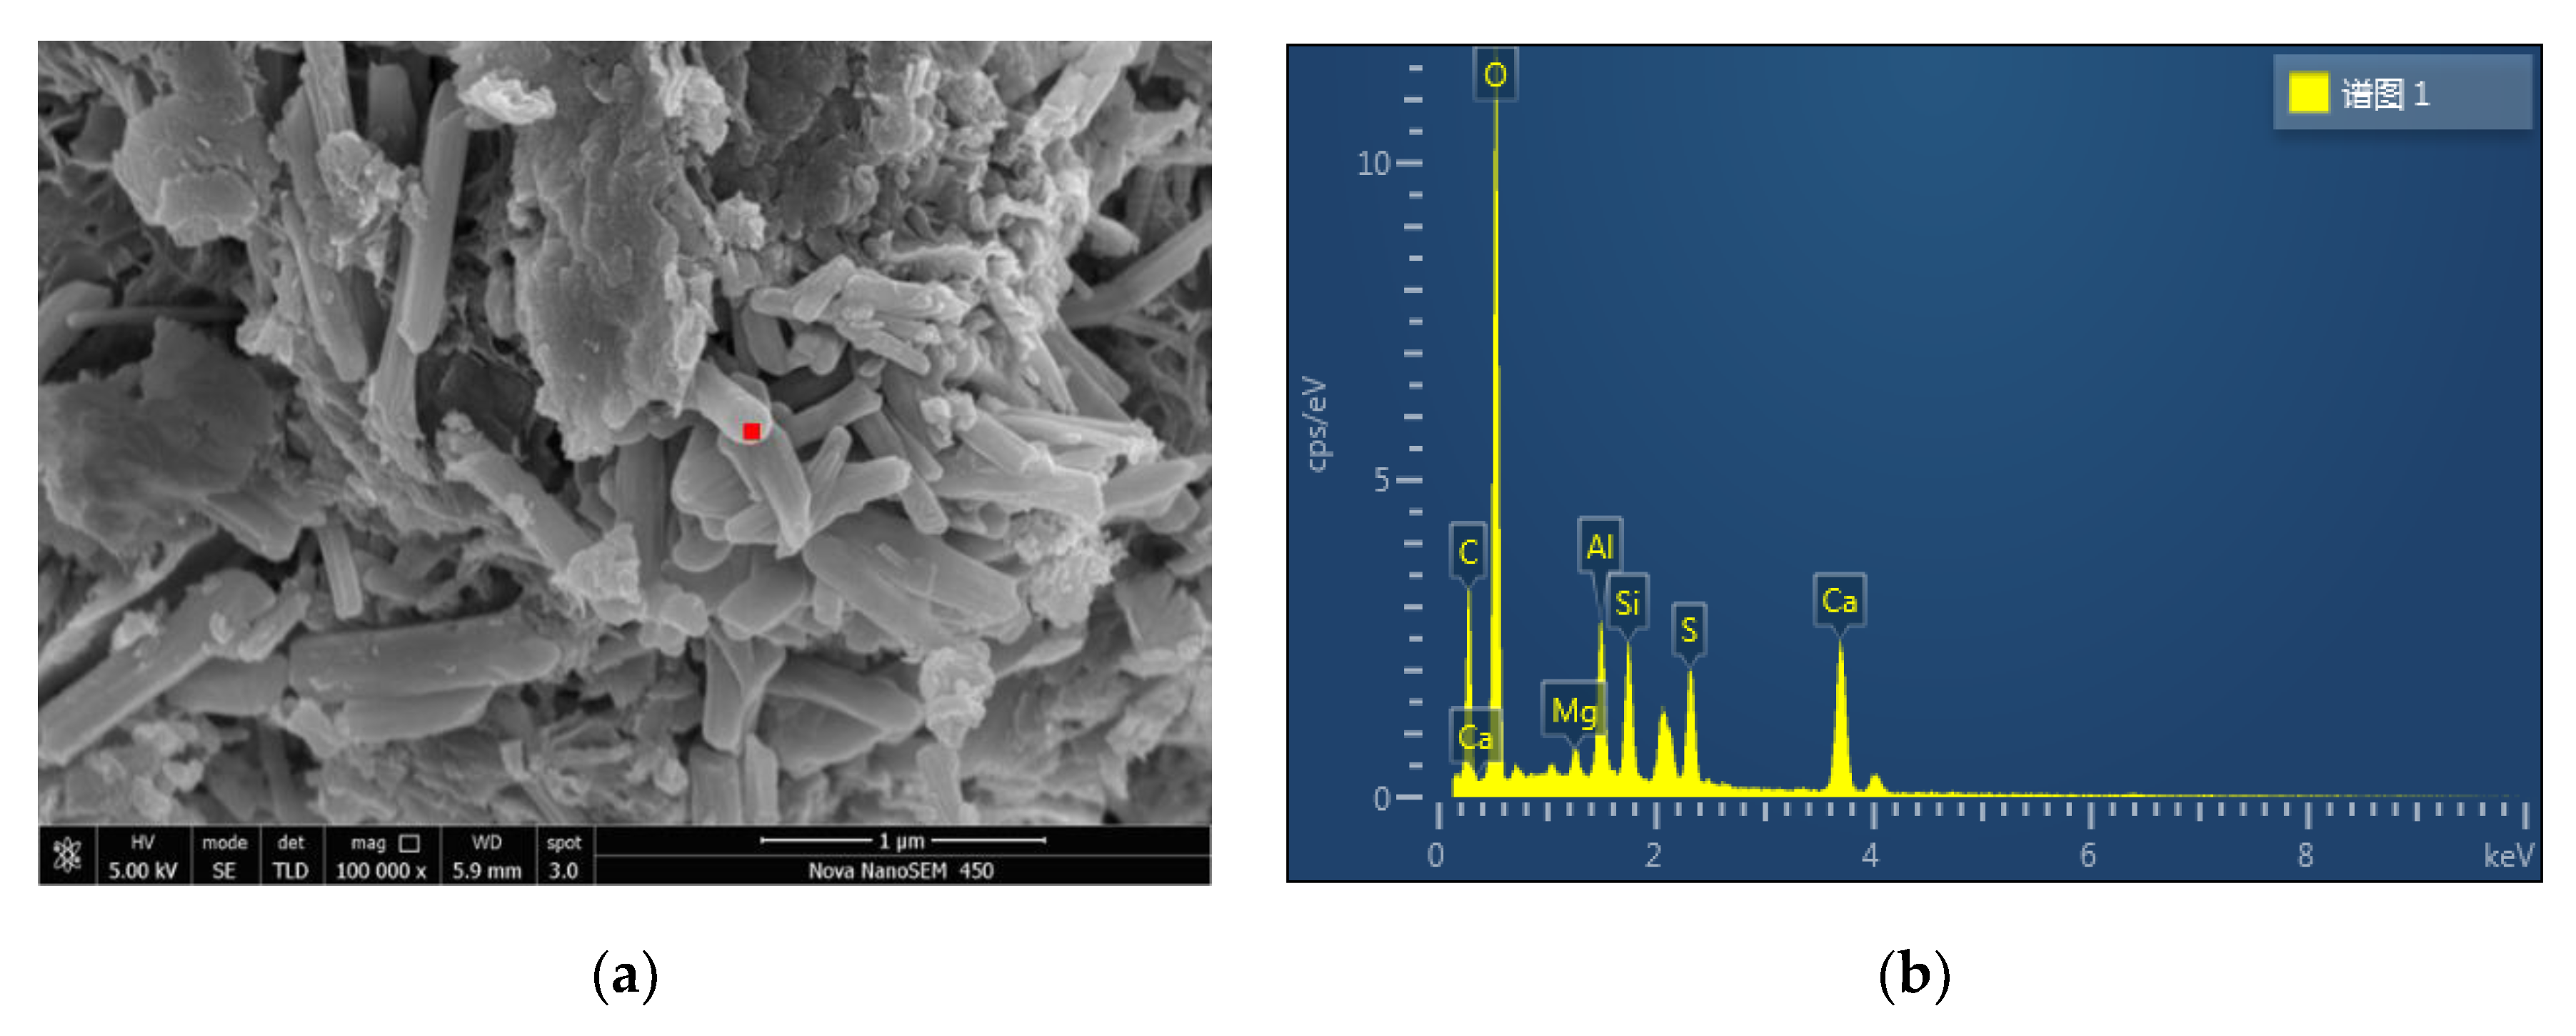
Figure 9.
Differential scanning calorimetry (DSC) curves of SAR specimens at 28 days. (a) M2 paste, (b) M4 paste, (c) M6 paste, (d) M8 paste.
Figure 9.
Differential scanning calorimetry (DSC) curves of SAR specimens at 28 days. (a) M2 paste, (b) M4 paste, (c) M6 paste, (d) M8 paste.

Table 1.
Chemical and physical properties of seabed silt.
| Components | SiO2 | Al2O3 | Fe2O3 | CaO | MgO | TiO2 | Na2O | K2O |
|---|---|---|---|---|---|---|---|---|
| Content (%) | 53.47 | 15.76 | 8.25 | 2.09 | 2.49 | 0.91 | 3.27 | 1.93 |
Table 2.
N/P ratios in the immersion solution.
| Specimen | M2 | M4 | M6 | M8 |
|---|---|---|---|---|
| N/P | 193.88 | 203.62 | 298.52 | 210.01 |
Table 3.
Crystal elements in SAR specimen M4.
| Element | wt% | Atomic Percent |
|---|---|---|
| C | 16.96 | 26.70 |
| O | 43.26 | 51.14 |
| Mg | 0.90 | 0.70 |
| Al | 5.19 | 3.64 |
| Si | 5.24 | 3.53 |
| S | 7.34 | 4.33 |
| Ca | 21.11 | 9.96 |
| Total quantity | 100.00 | 100.00 |
Publisher’s Note: MDPI stays neutral with regard to jurisdictional claims in published maps and institutional affiliations. |
© 2020 by the authors. Licensee MDPI, Basel, Switzerland. This article is an open access article distributed under the terms and conditions of the Creative Commons Attribution (CC BY) license (http://creativecommons.org/licenses/by/4.0/).
Share and Cite
MDPI and ACS Style
Jiang, Z.; Zhang, J.; Nie, Z.; Guo, Z.; Zhu, L.; Cong, W.; Chen, Y.; Liang, Z. The Application of Seabed Silt in the Preparation of Artificial Algal Reefs. Appl. Sci. 2020, 10, 7279. https://doi.org/10.3390/app10207279
AMA Style
Jiang Z, Zhang J, Nie Z, Guo Z, Zhu L, Cong W, Chen Y, Liang Z. The Application of Seabed Silt in the Preparation of Artificial Algal Reefs. Applied Sciences. 2020; 10(20):7279. https://doi.org/10.3390/app10207279
Chicago/Turabian StyleJiang, Zhaoyang, Jiating Zhang, Zhaoyi Nie, Zhansheng Guo, Lixin Zhu, Wei Cong, Yuan Chen, and Zhenlin Liang. 2020. "The Application of Seabed Silt in the Preparation of Artificial Algal Reefs" Applied Sciences 10, no. 20: 7279. https://doi.org/10.3390/app10207279
Note that from the first issue of 2016, this journal uses article numbers instead of page numbers. See further details here.