Experimental and Numerical Study on a Grouting Diffusion Model of a Single Rough Fracture in Rock Mass

Abstract
:
1. Introduction
2. Analytical Model
3. Experimental Study
3.1. Experimental Design
3.1.1. Experimental Configuration
Constant-Pressure-Controlled Grouting System
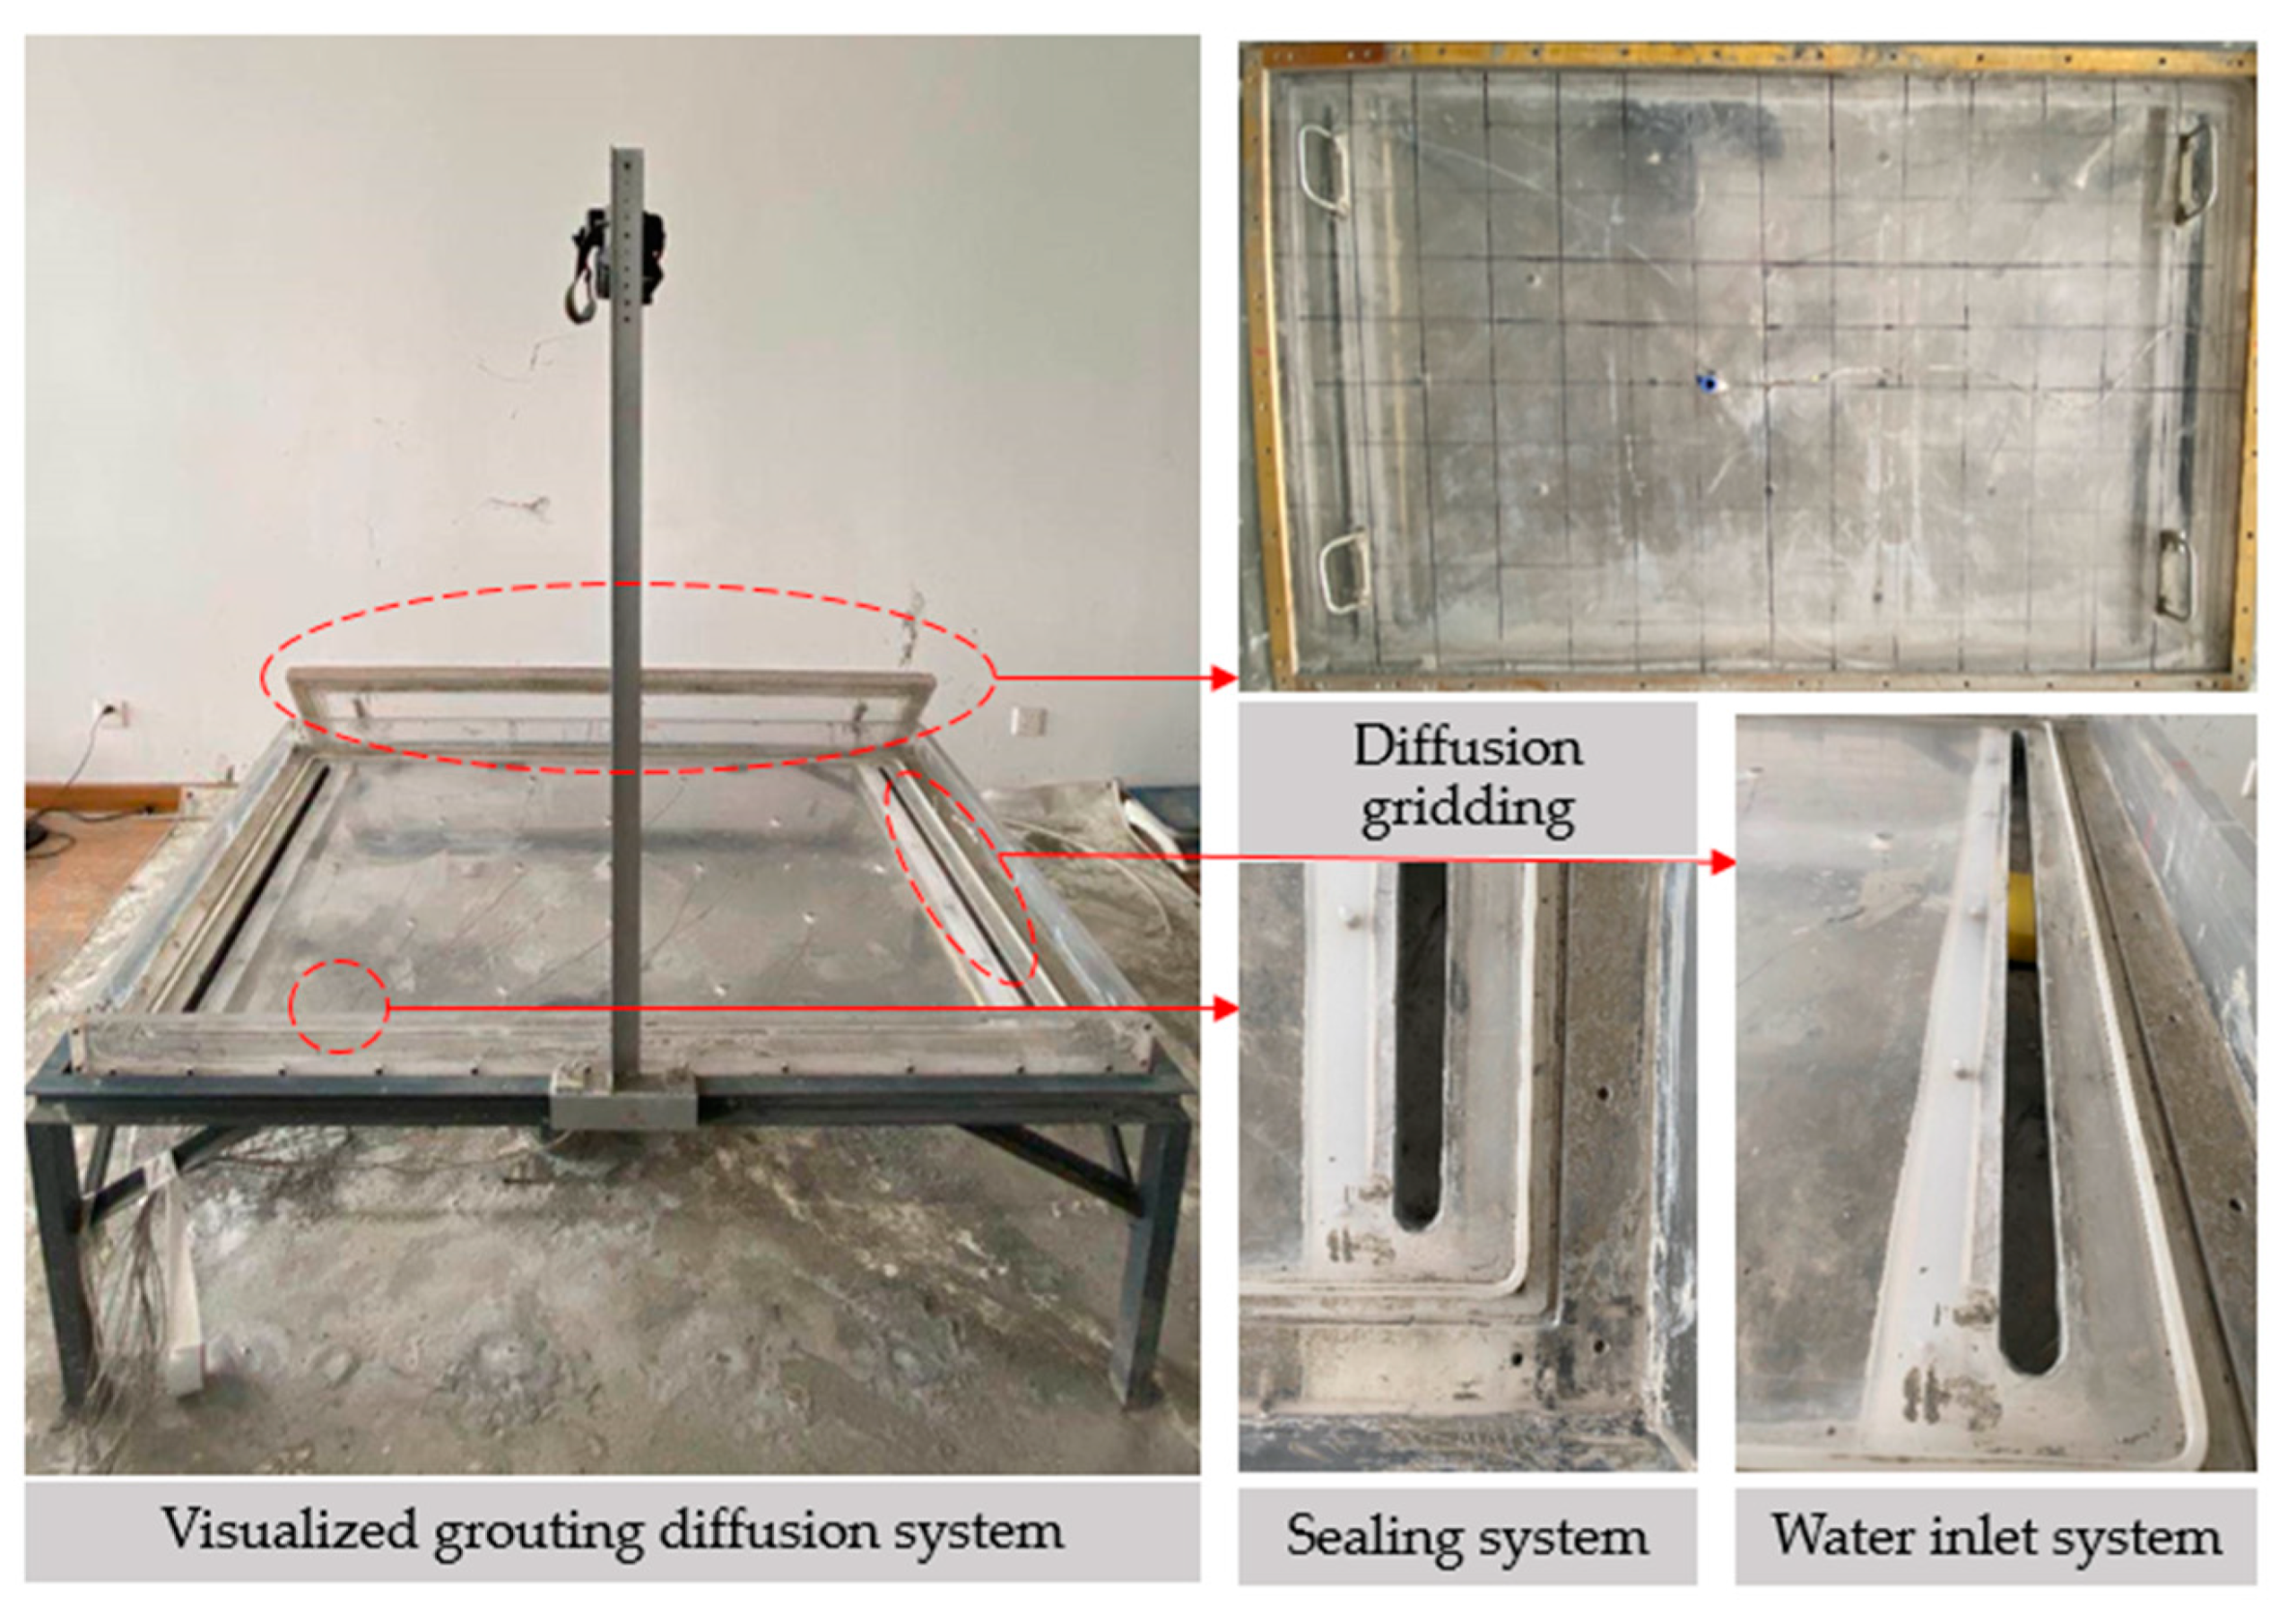
Visualized Grouting Diffusion System
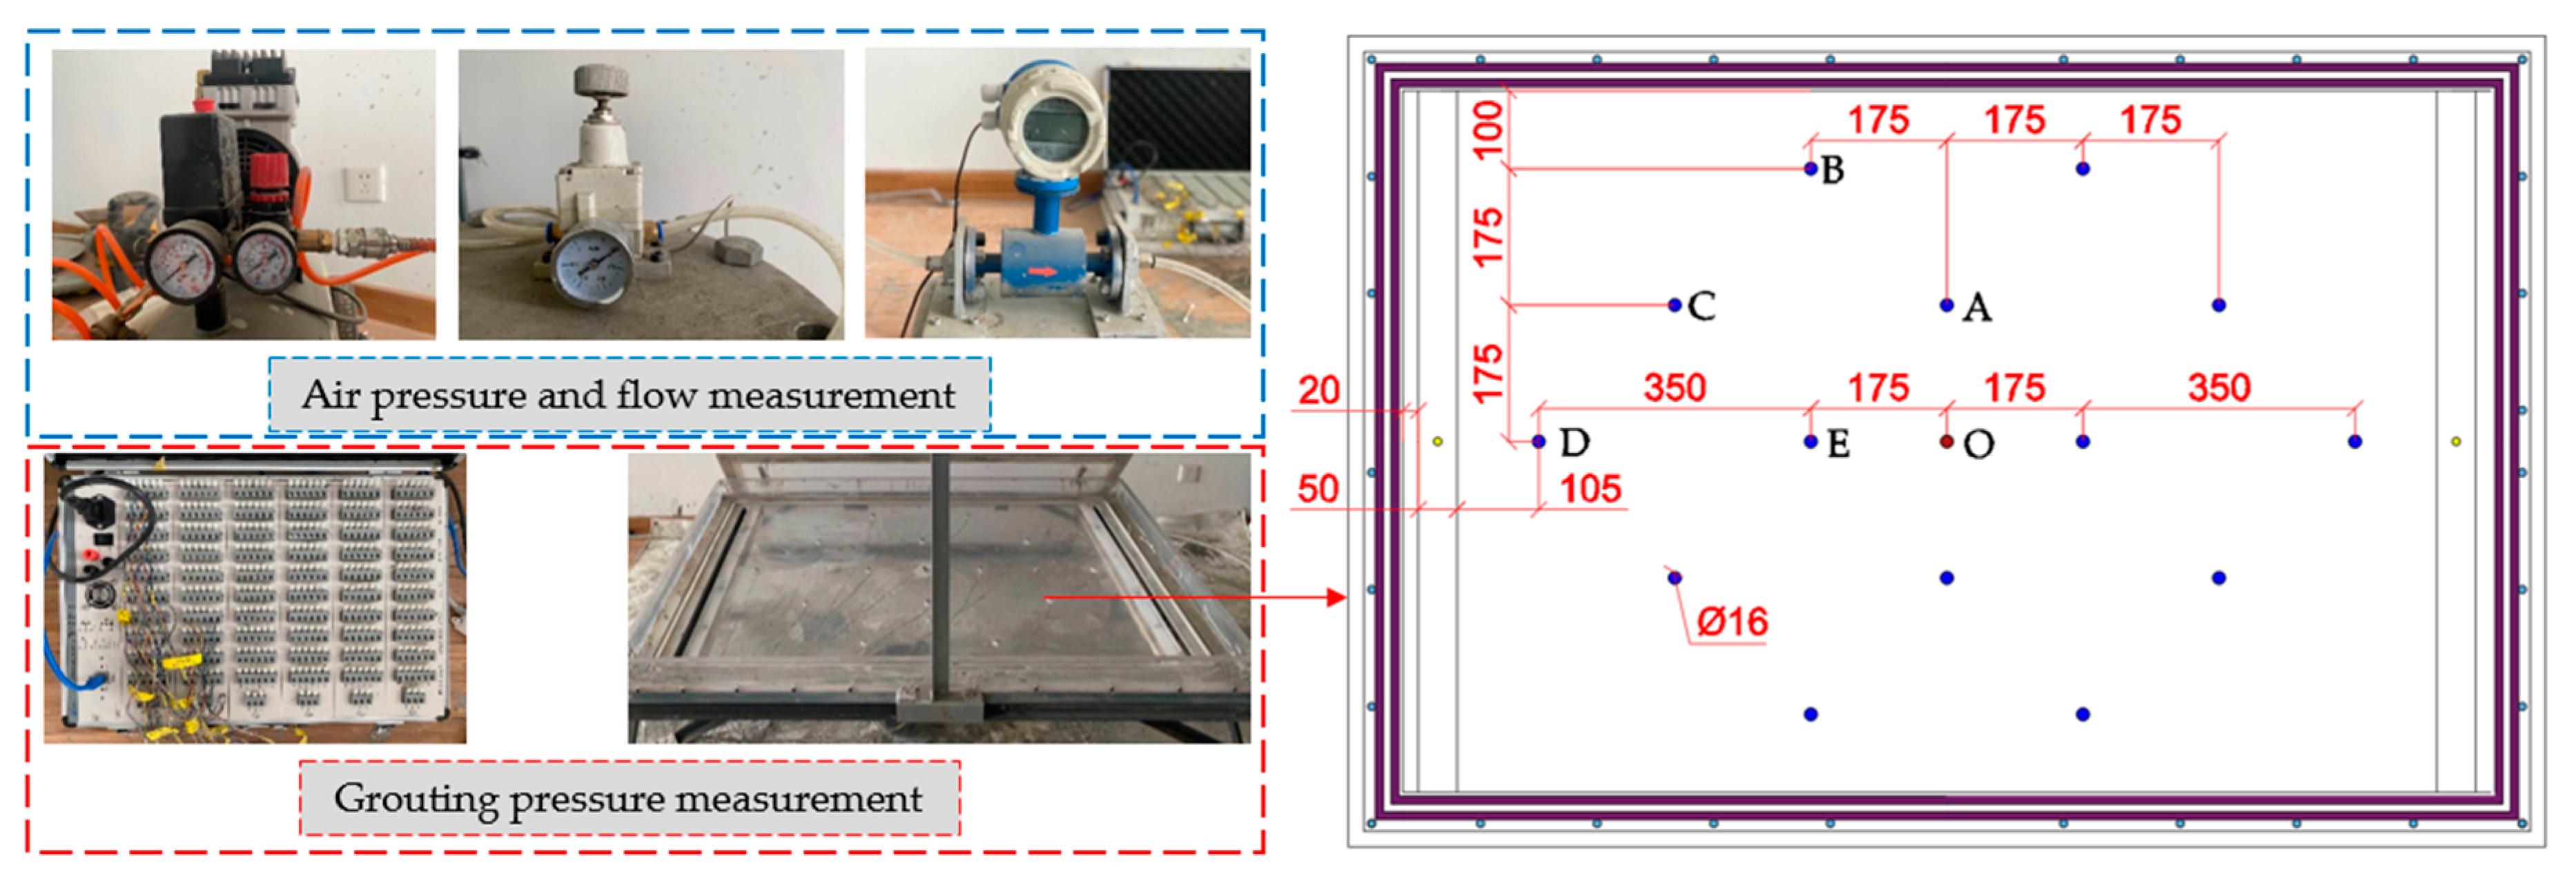
Measurement System
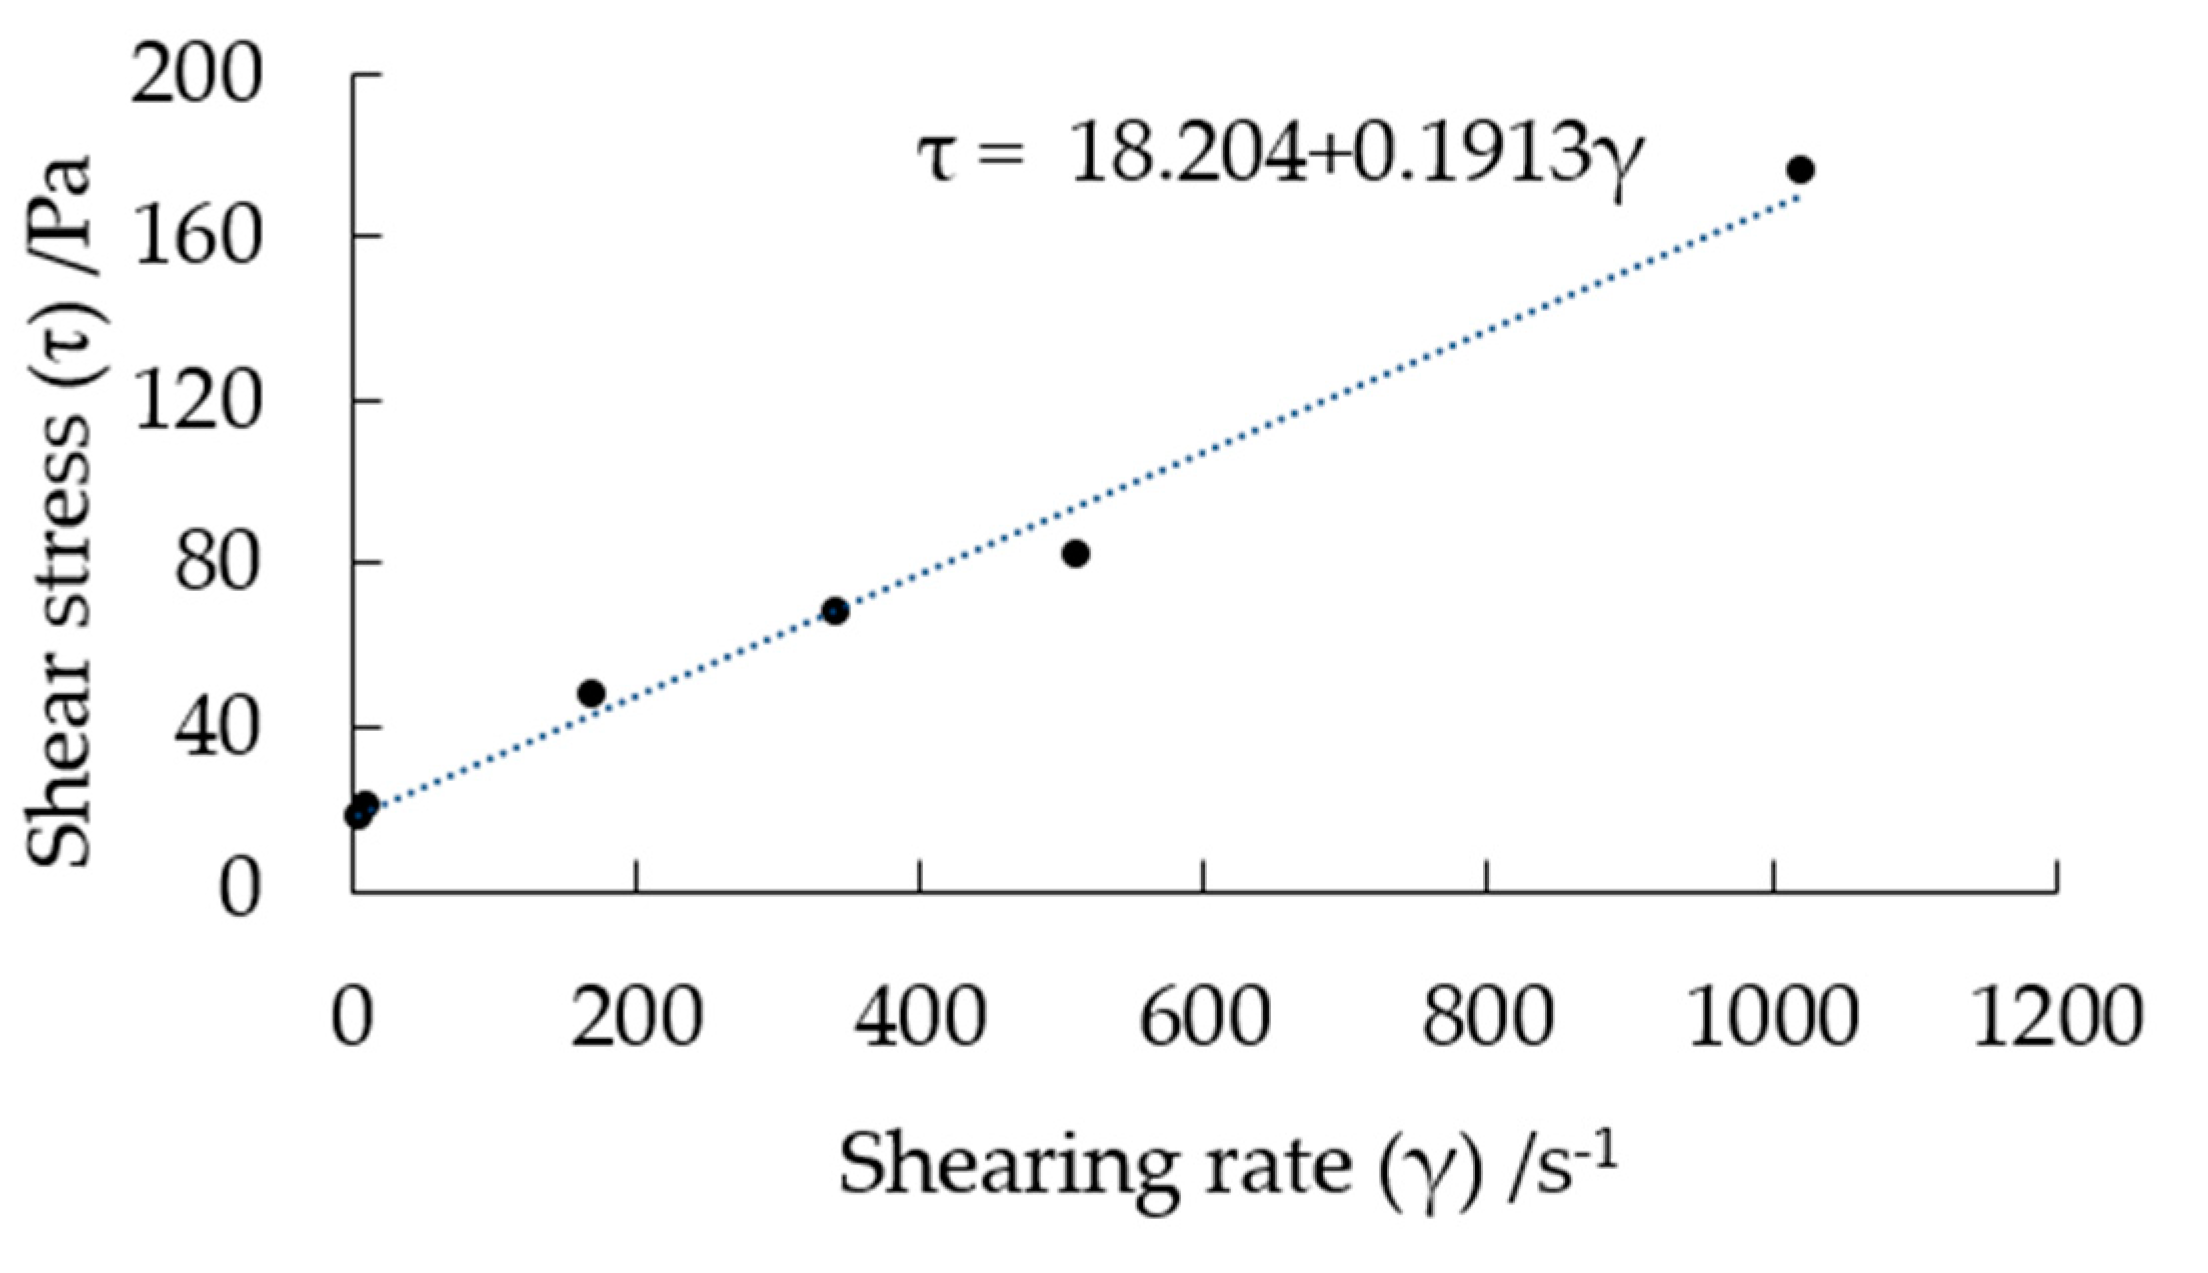
3.1.2. Materials
3.1.3. Design of Test Conditions
3.2. Experimental Results and Analysis
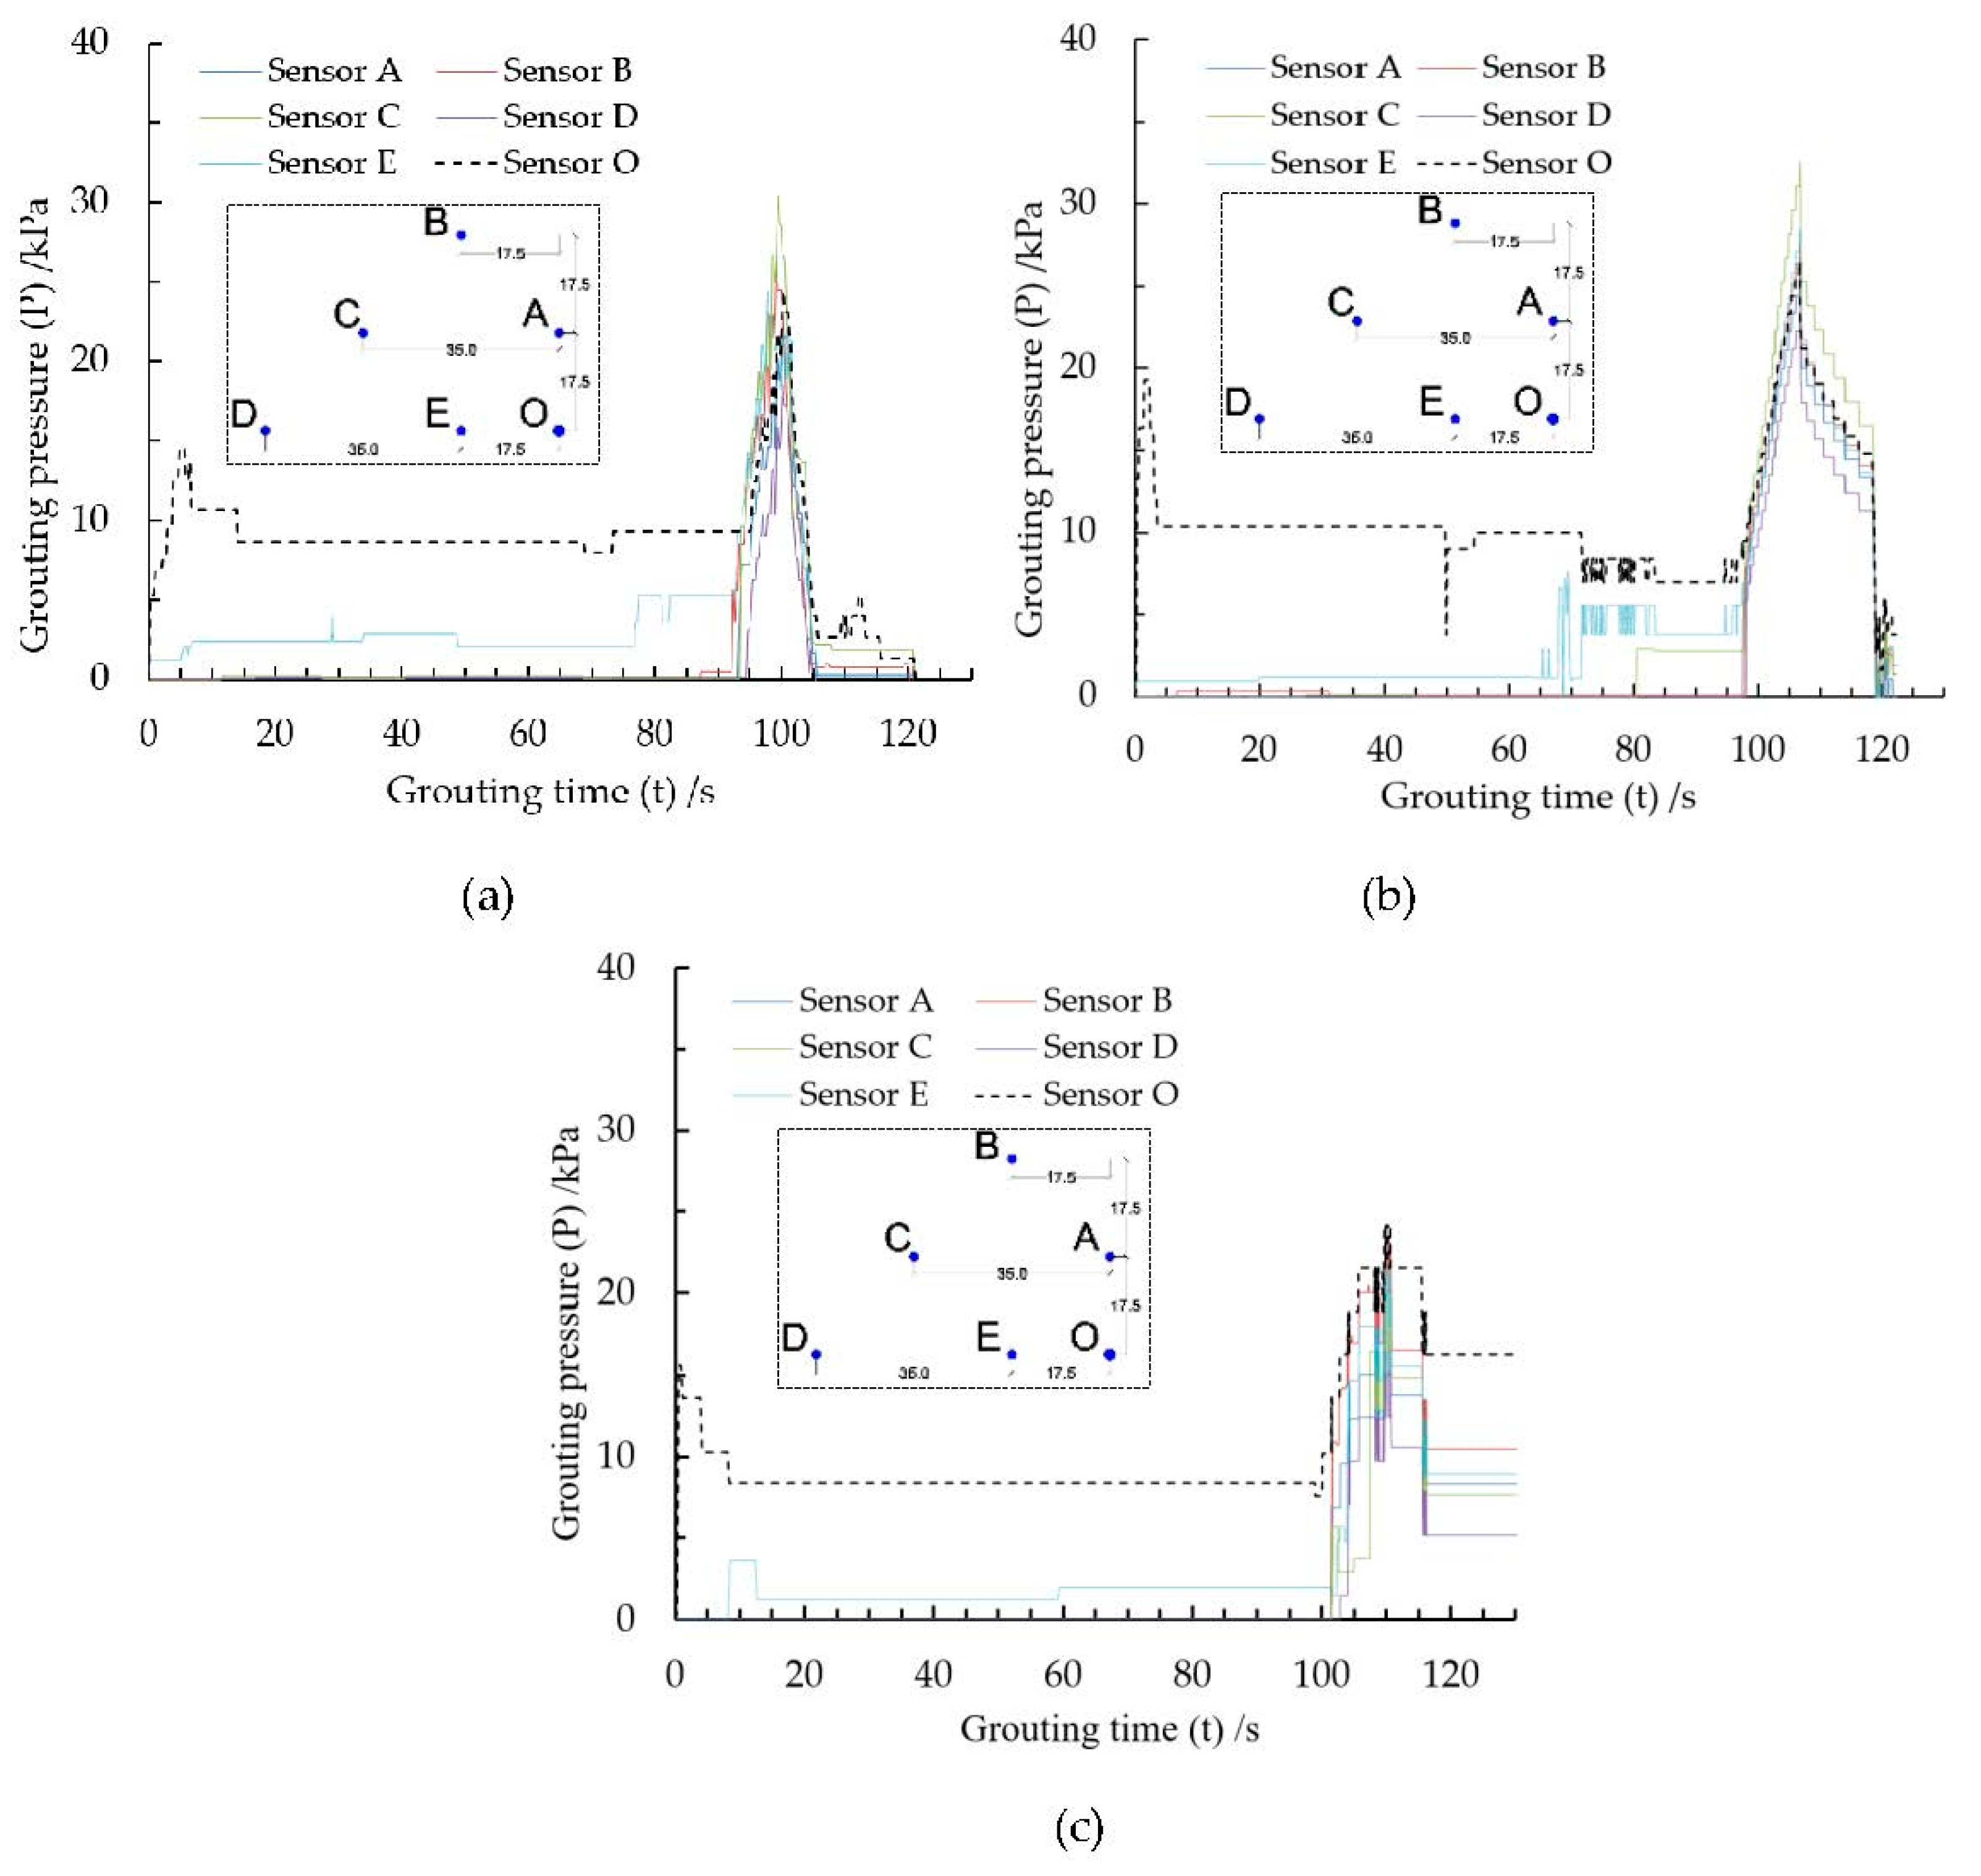
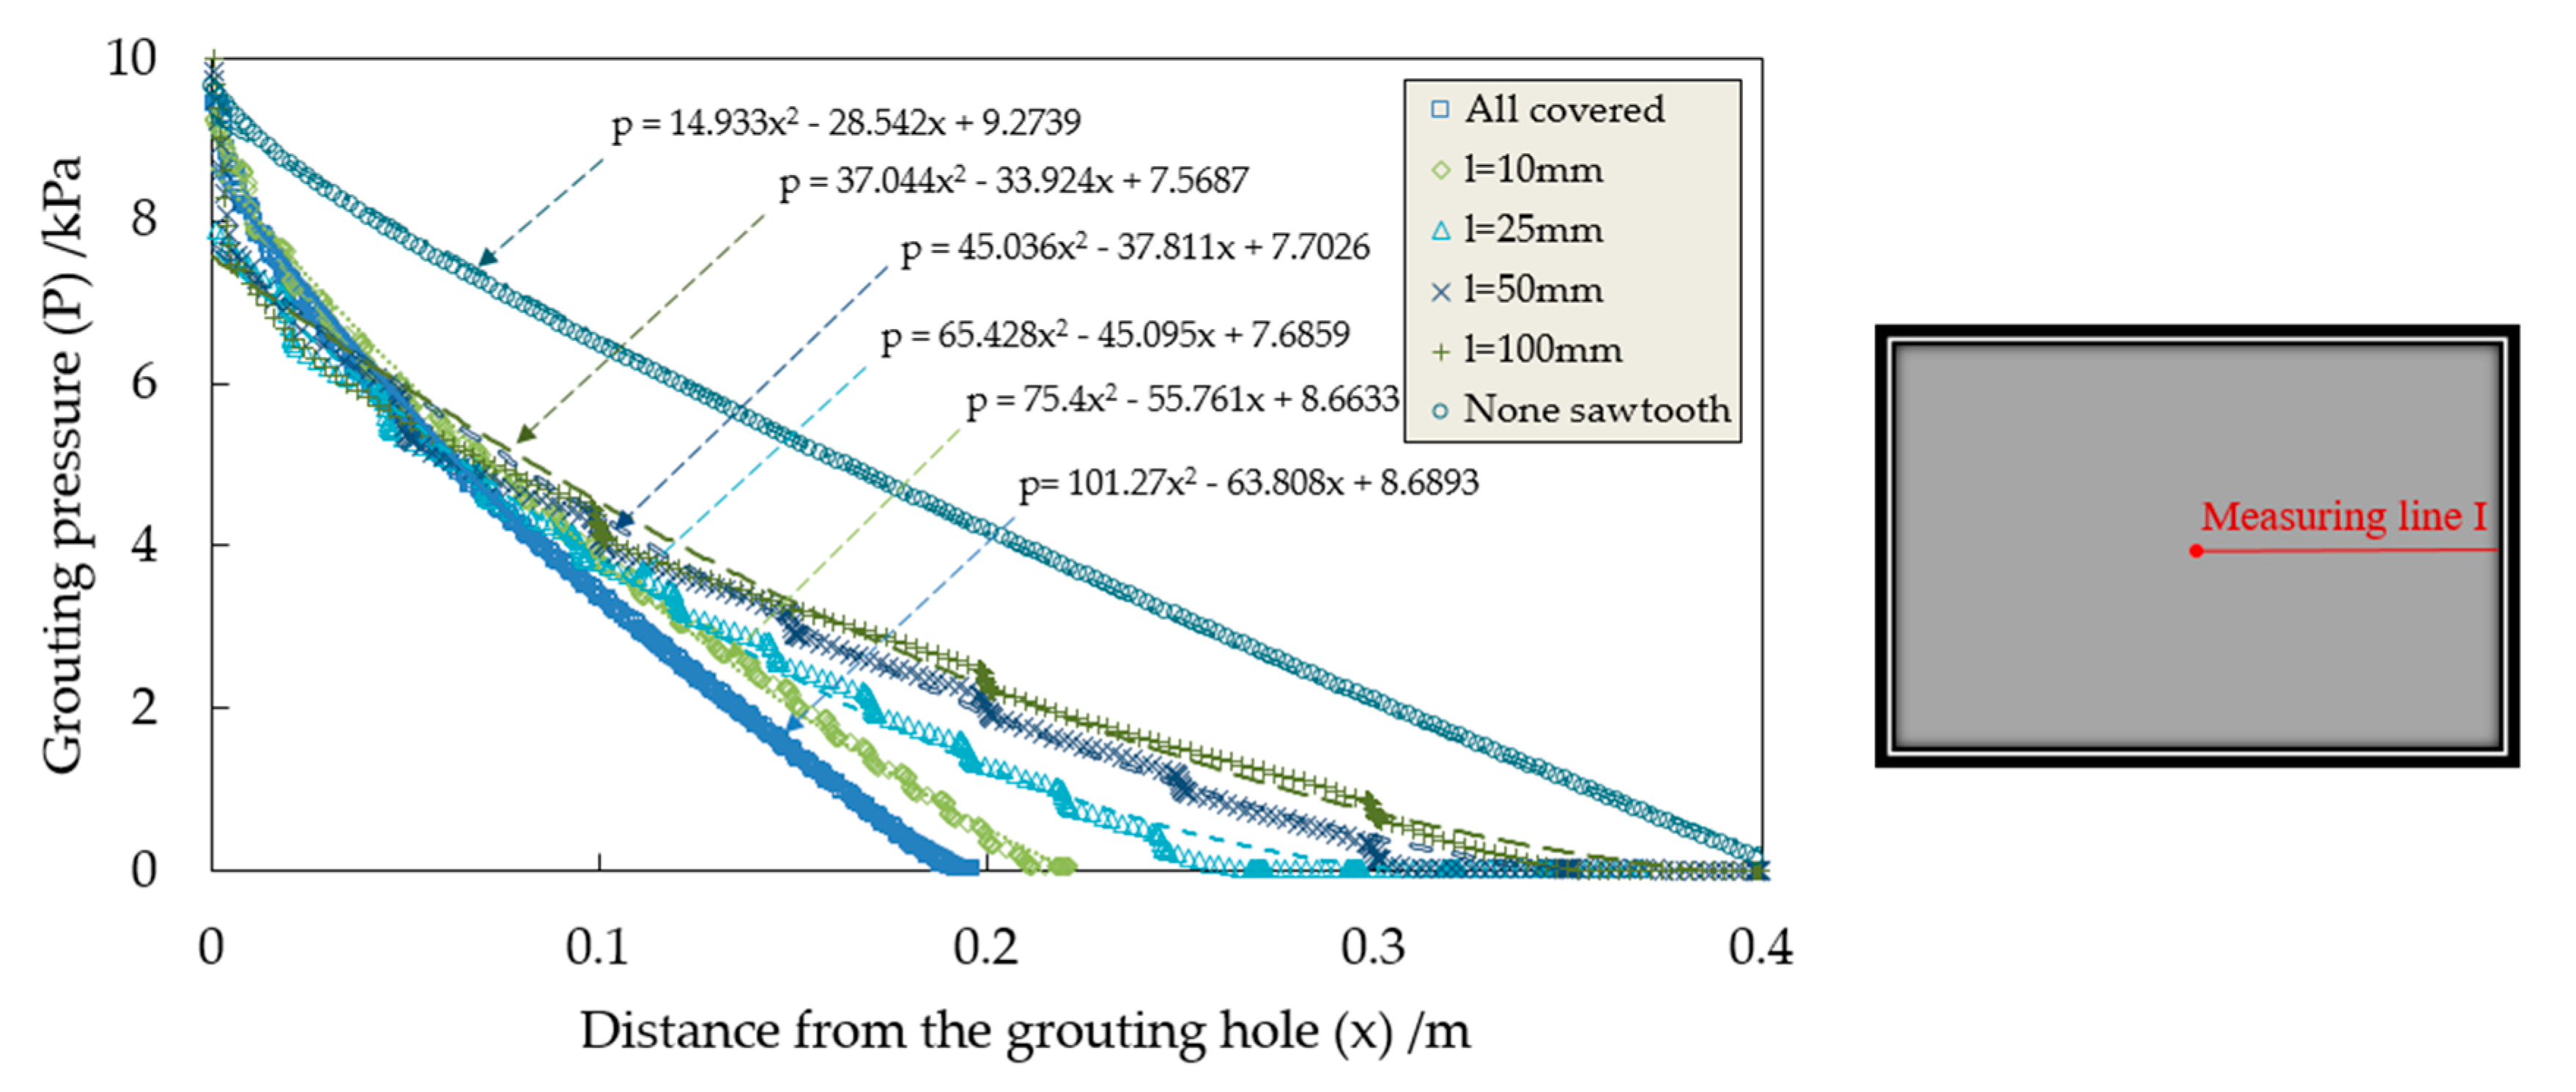
3.2.1. Grouting Pressure
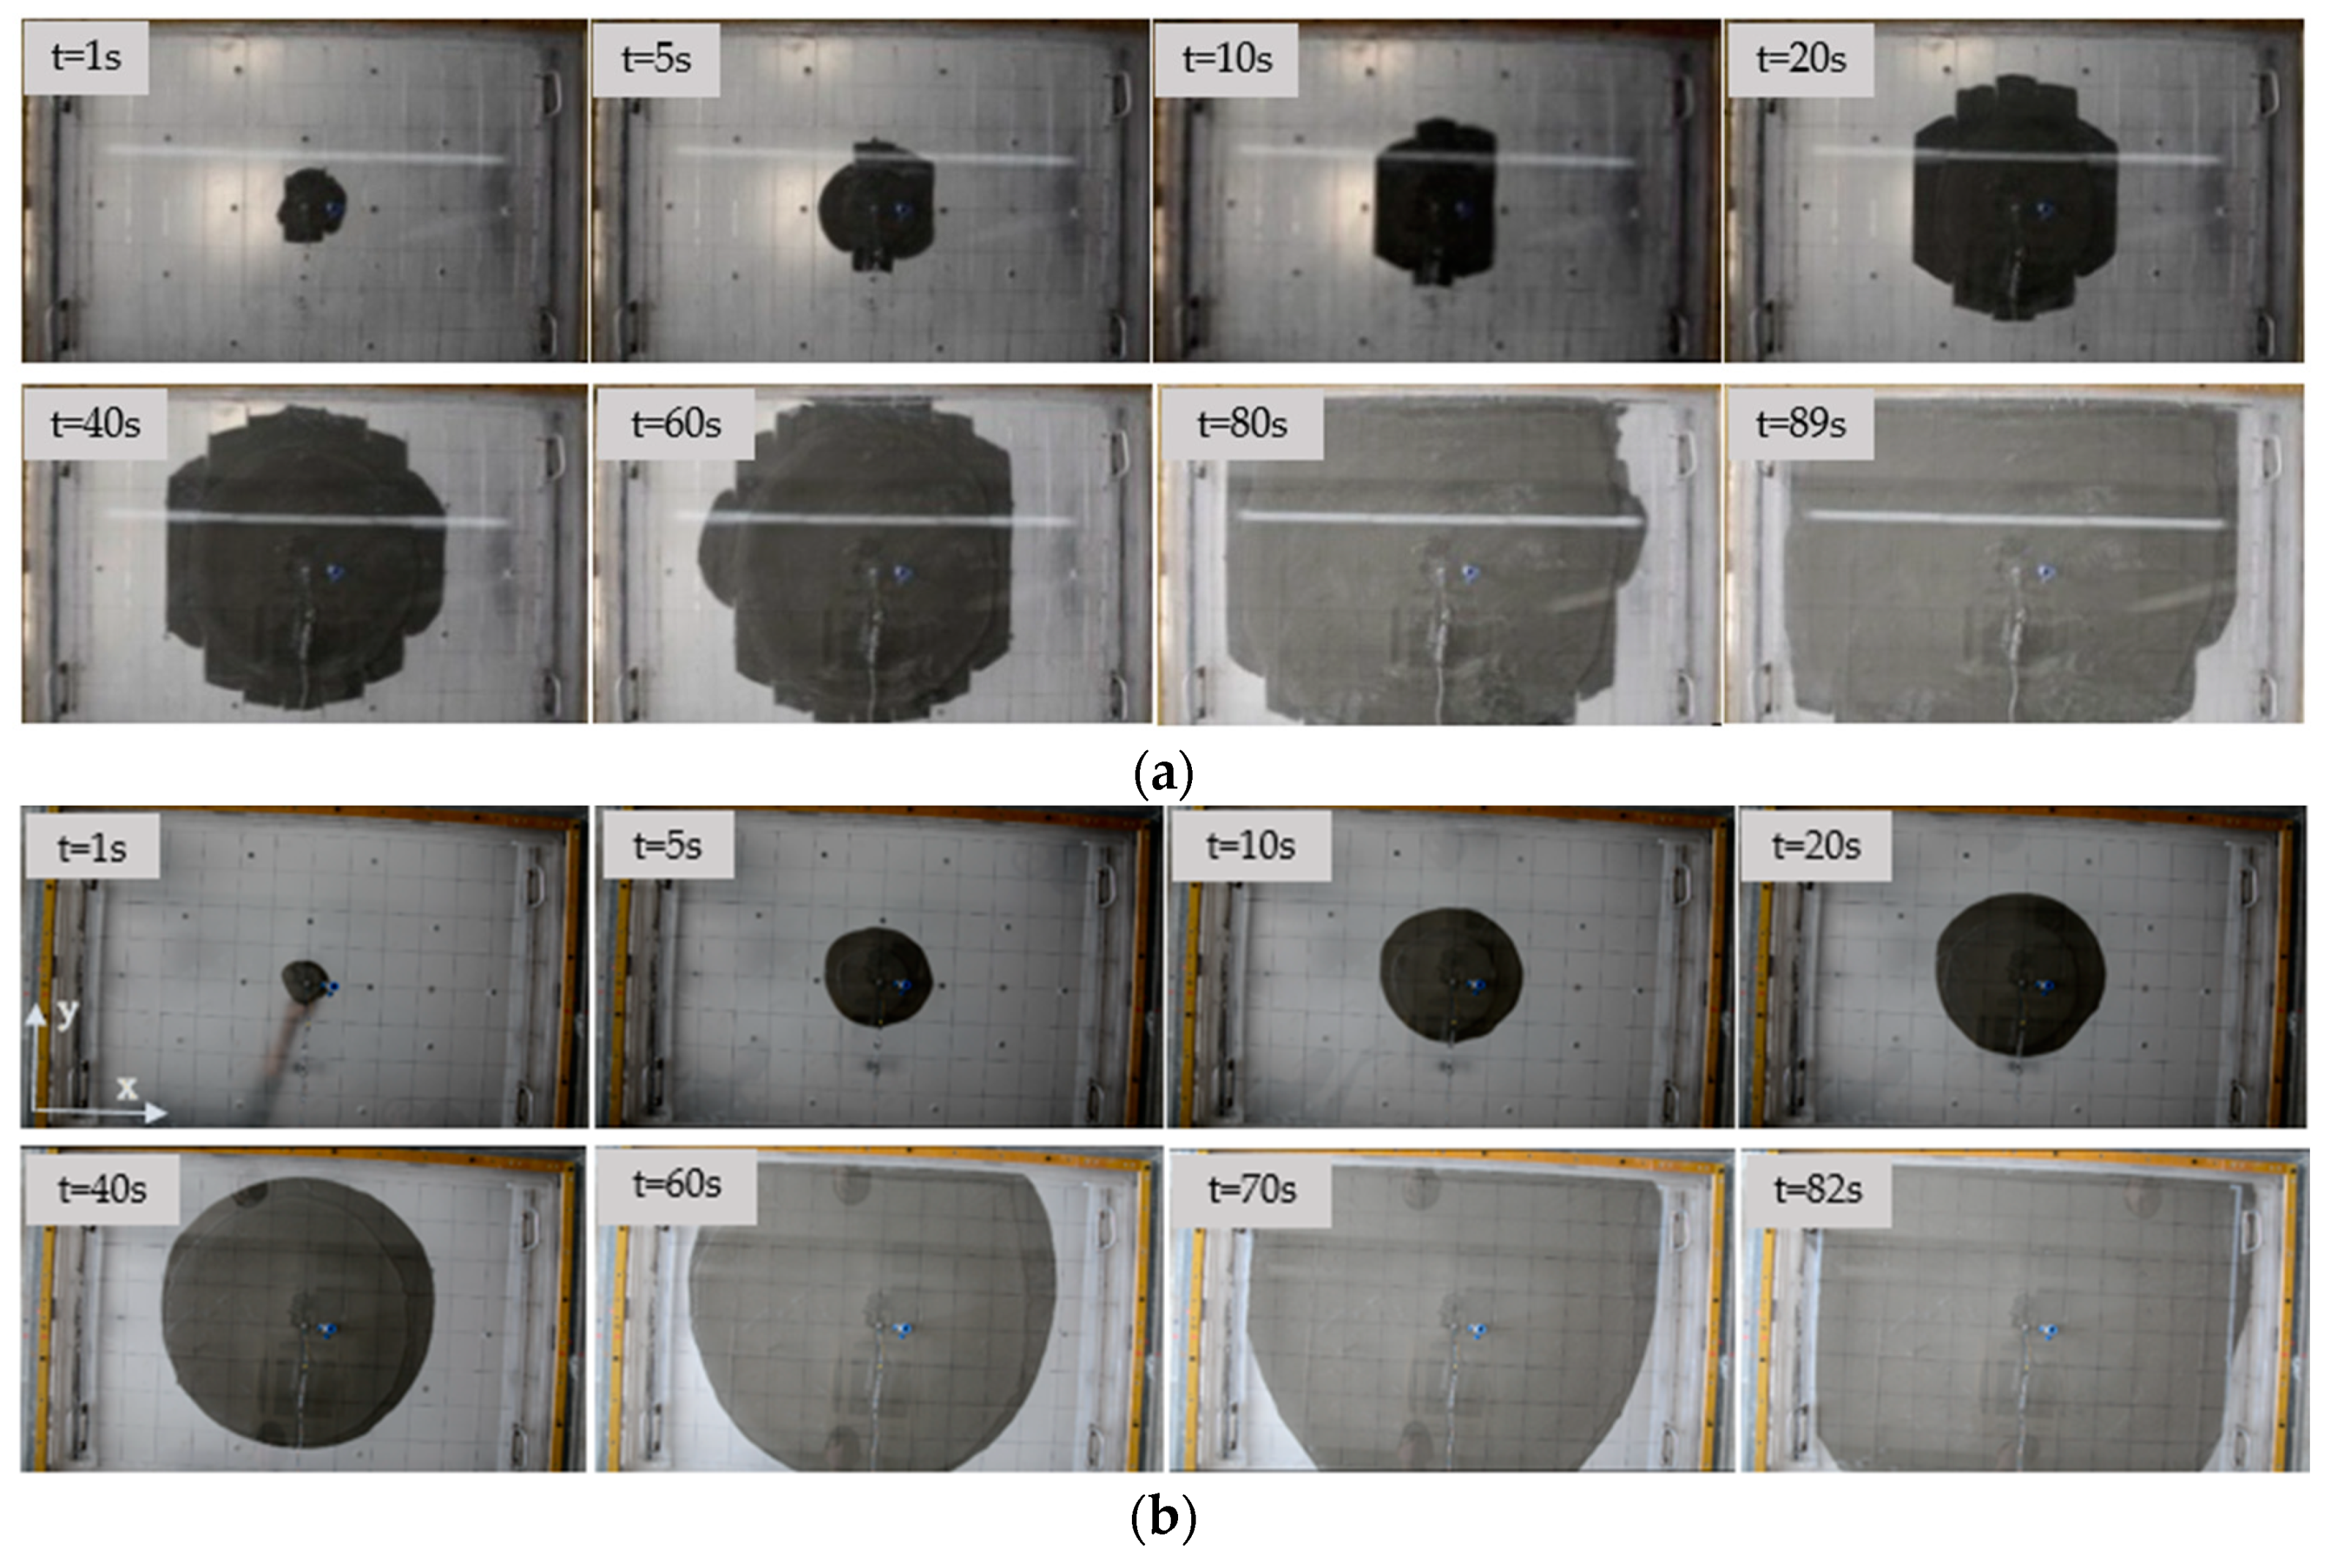
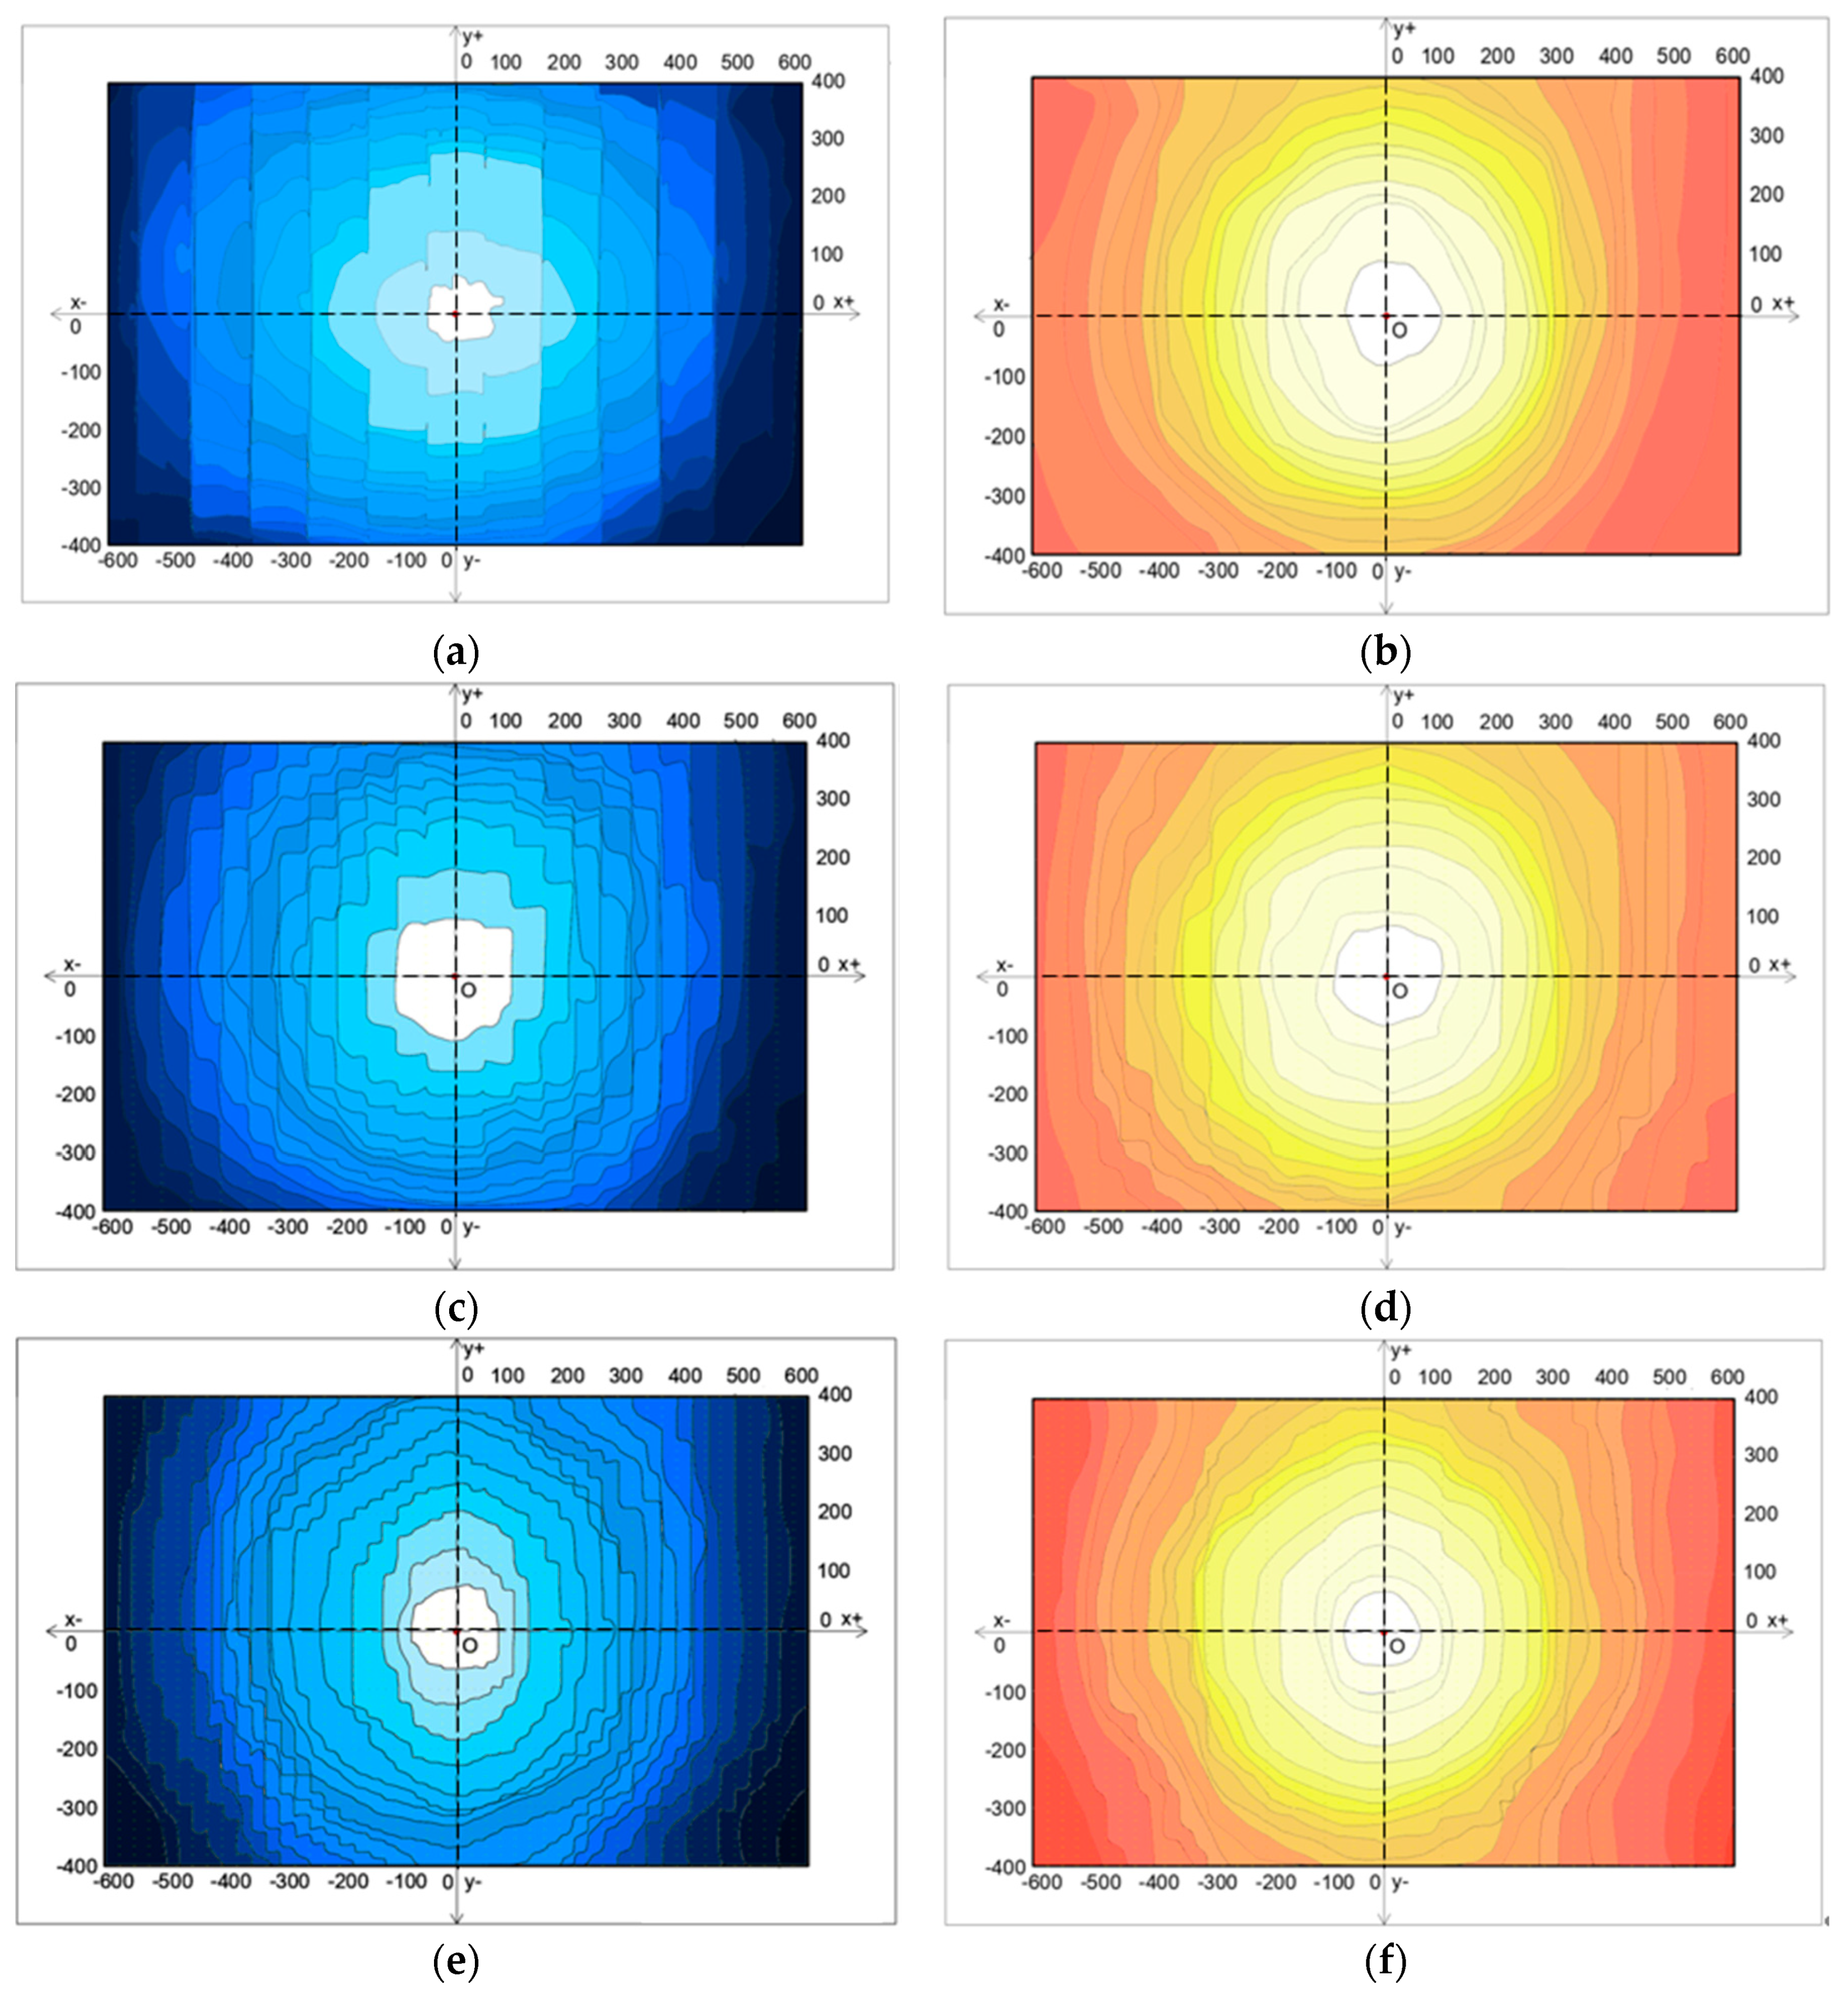
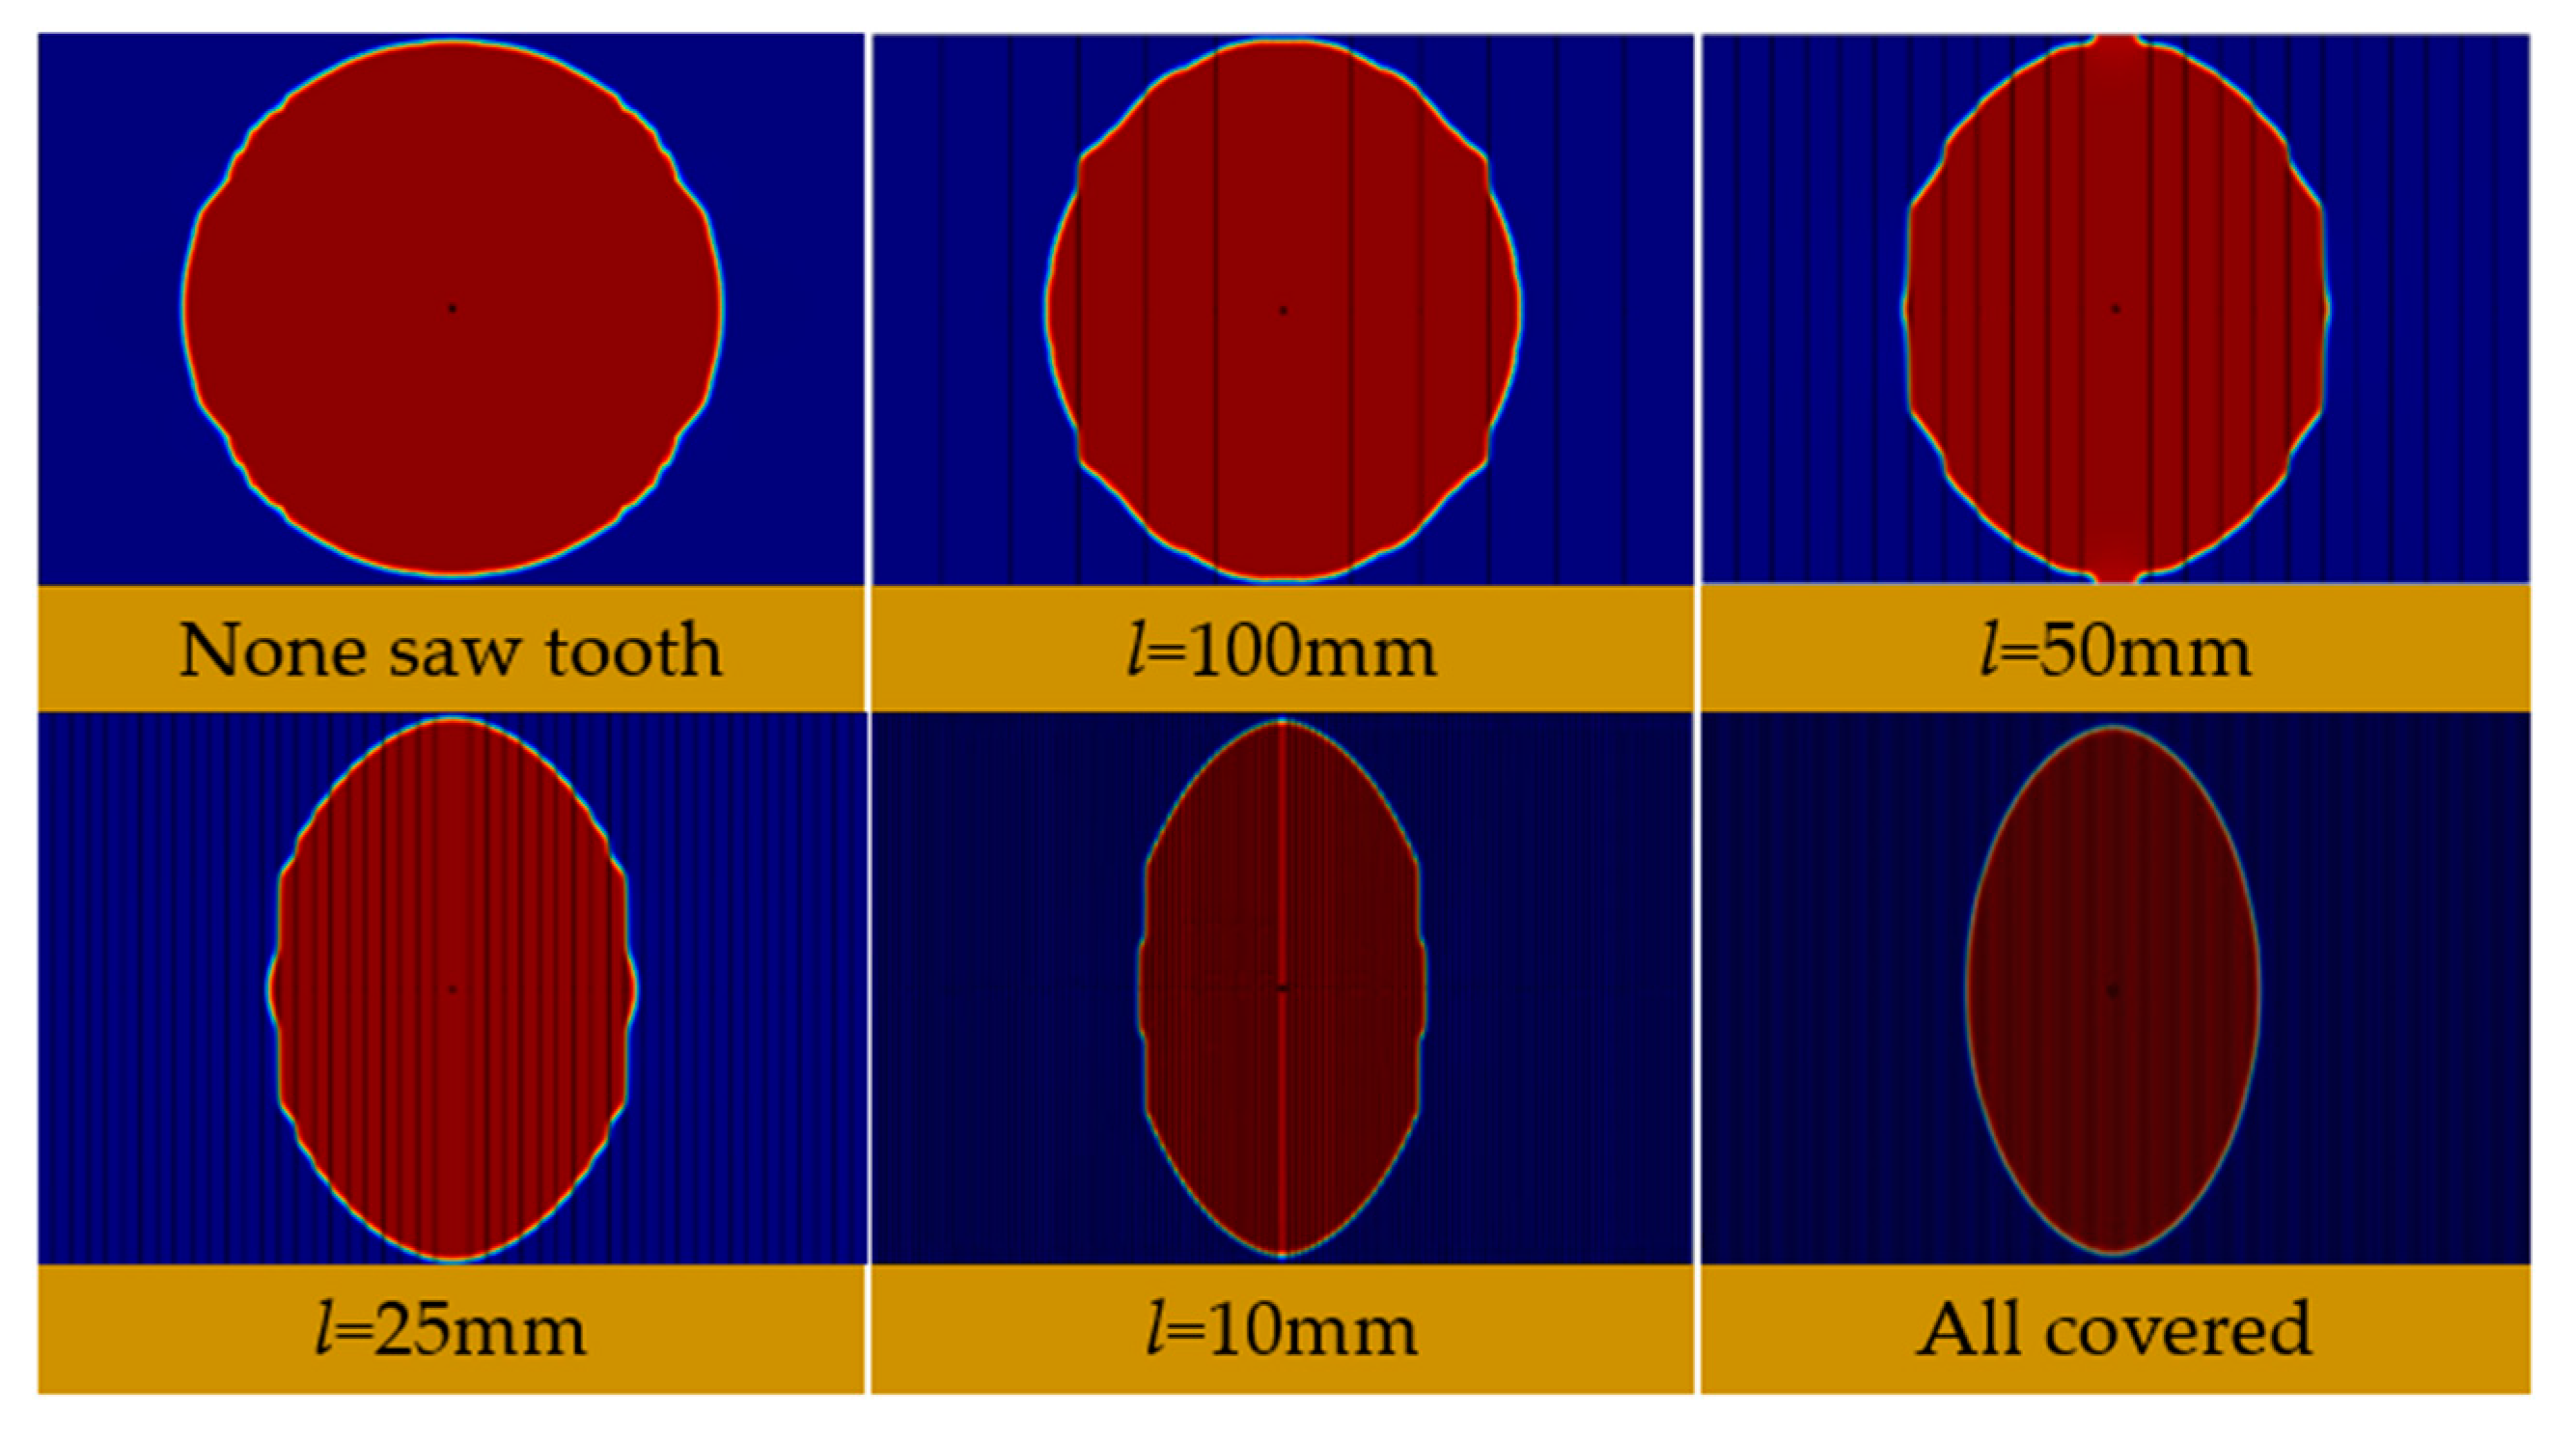
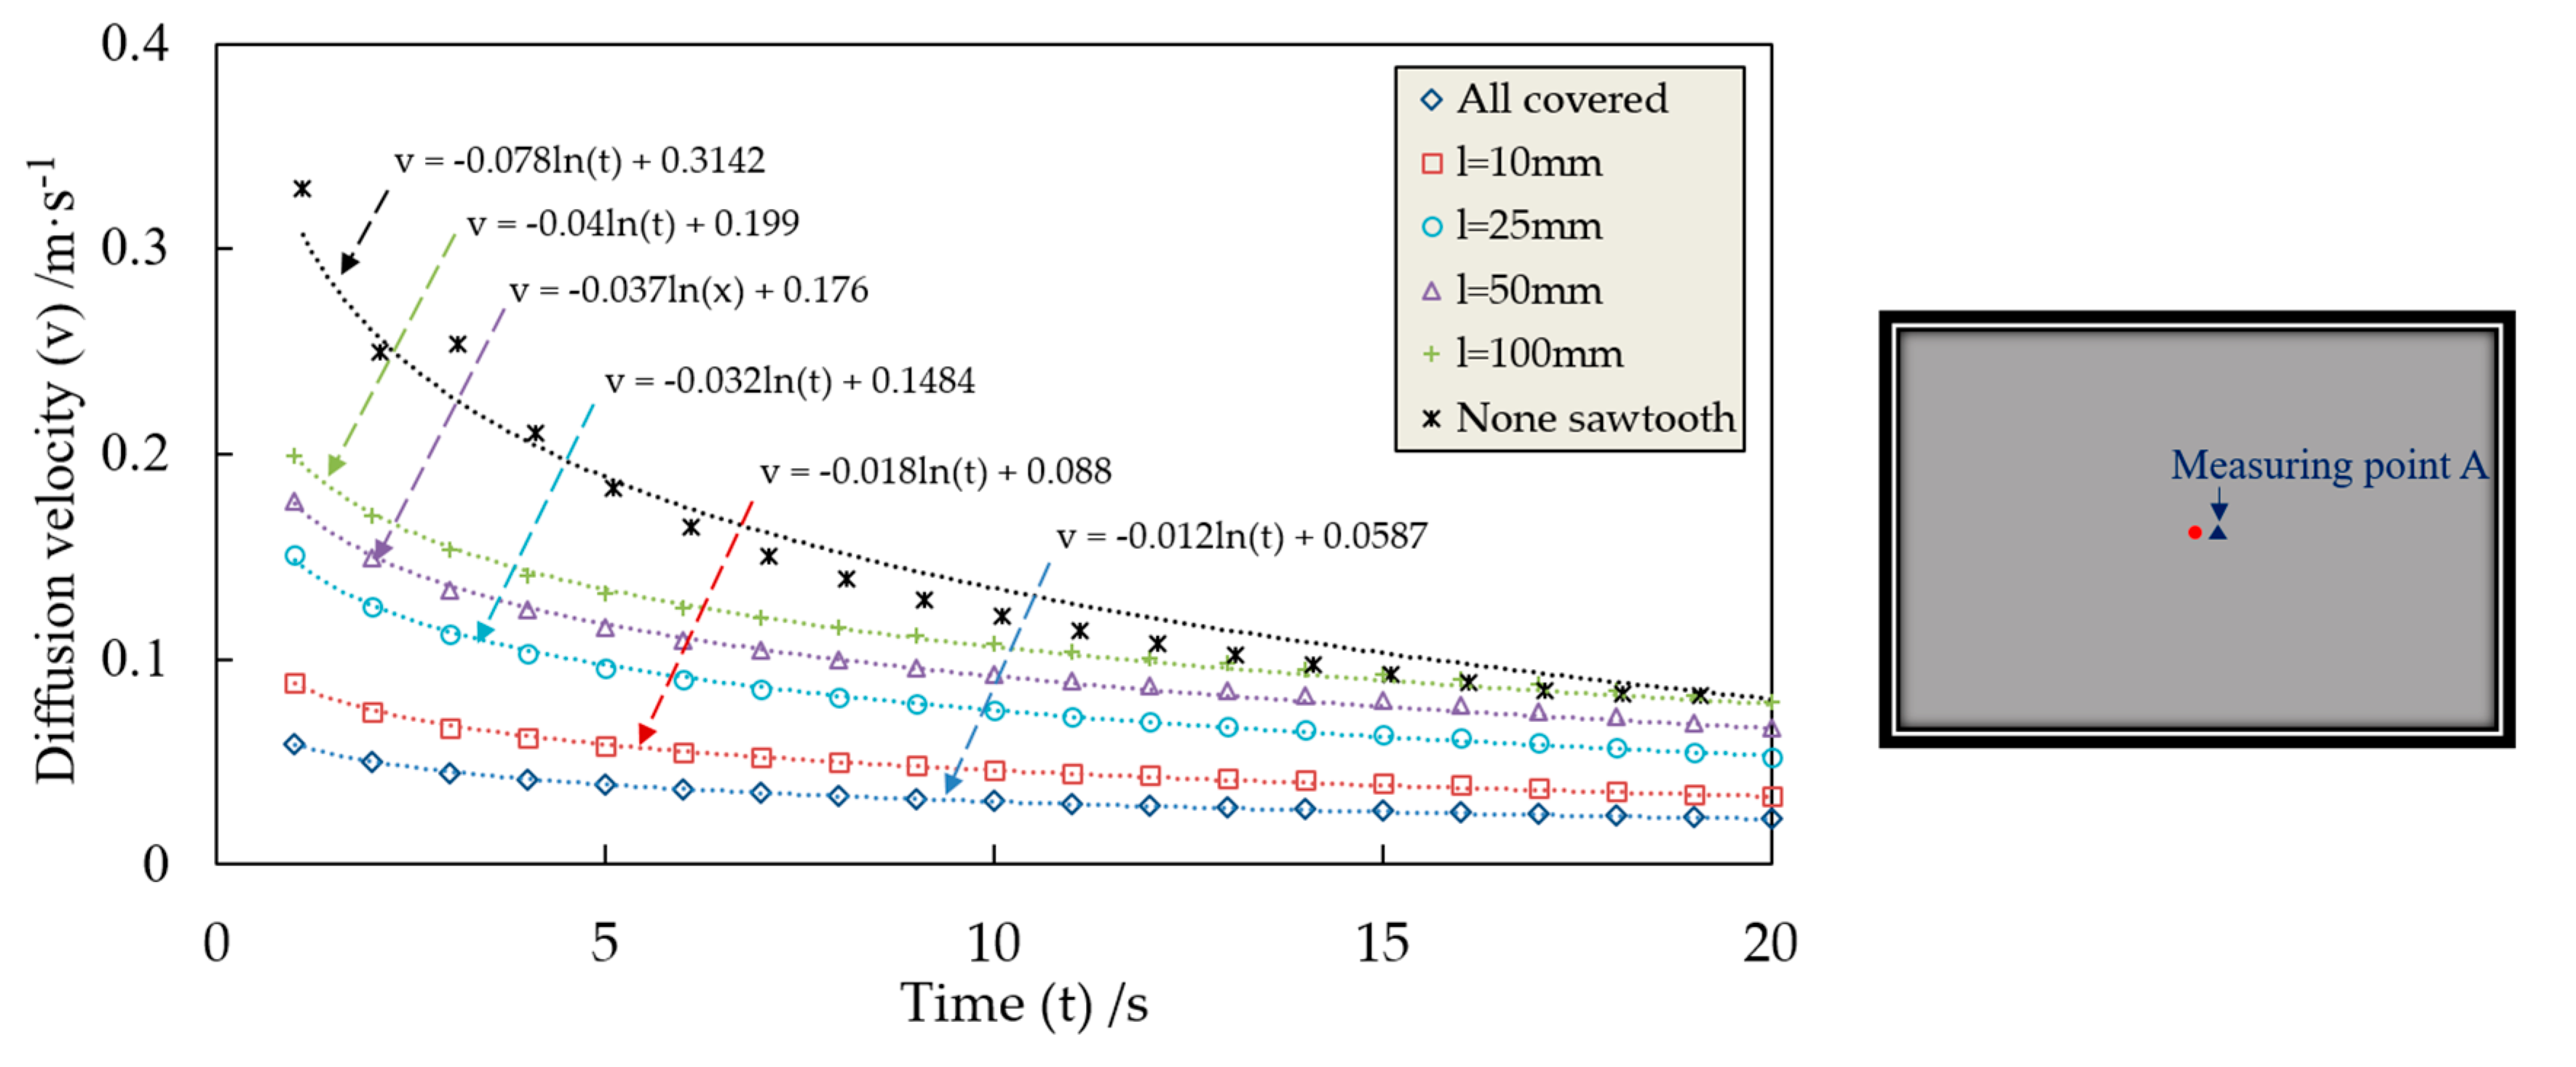
3.2.2. Grouting Diffusion Traces and Areas
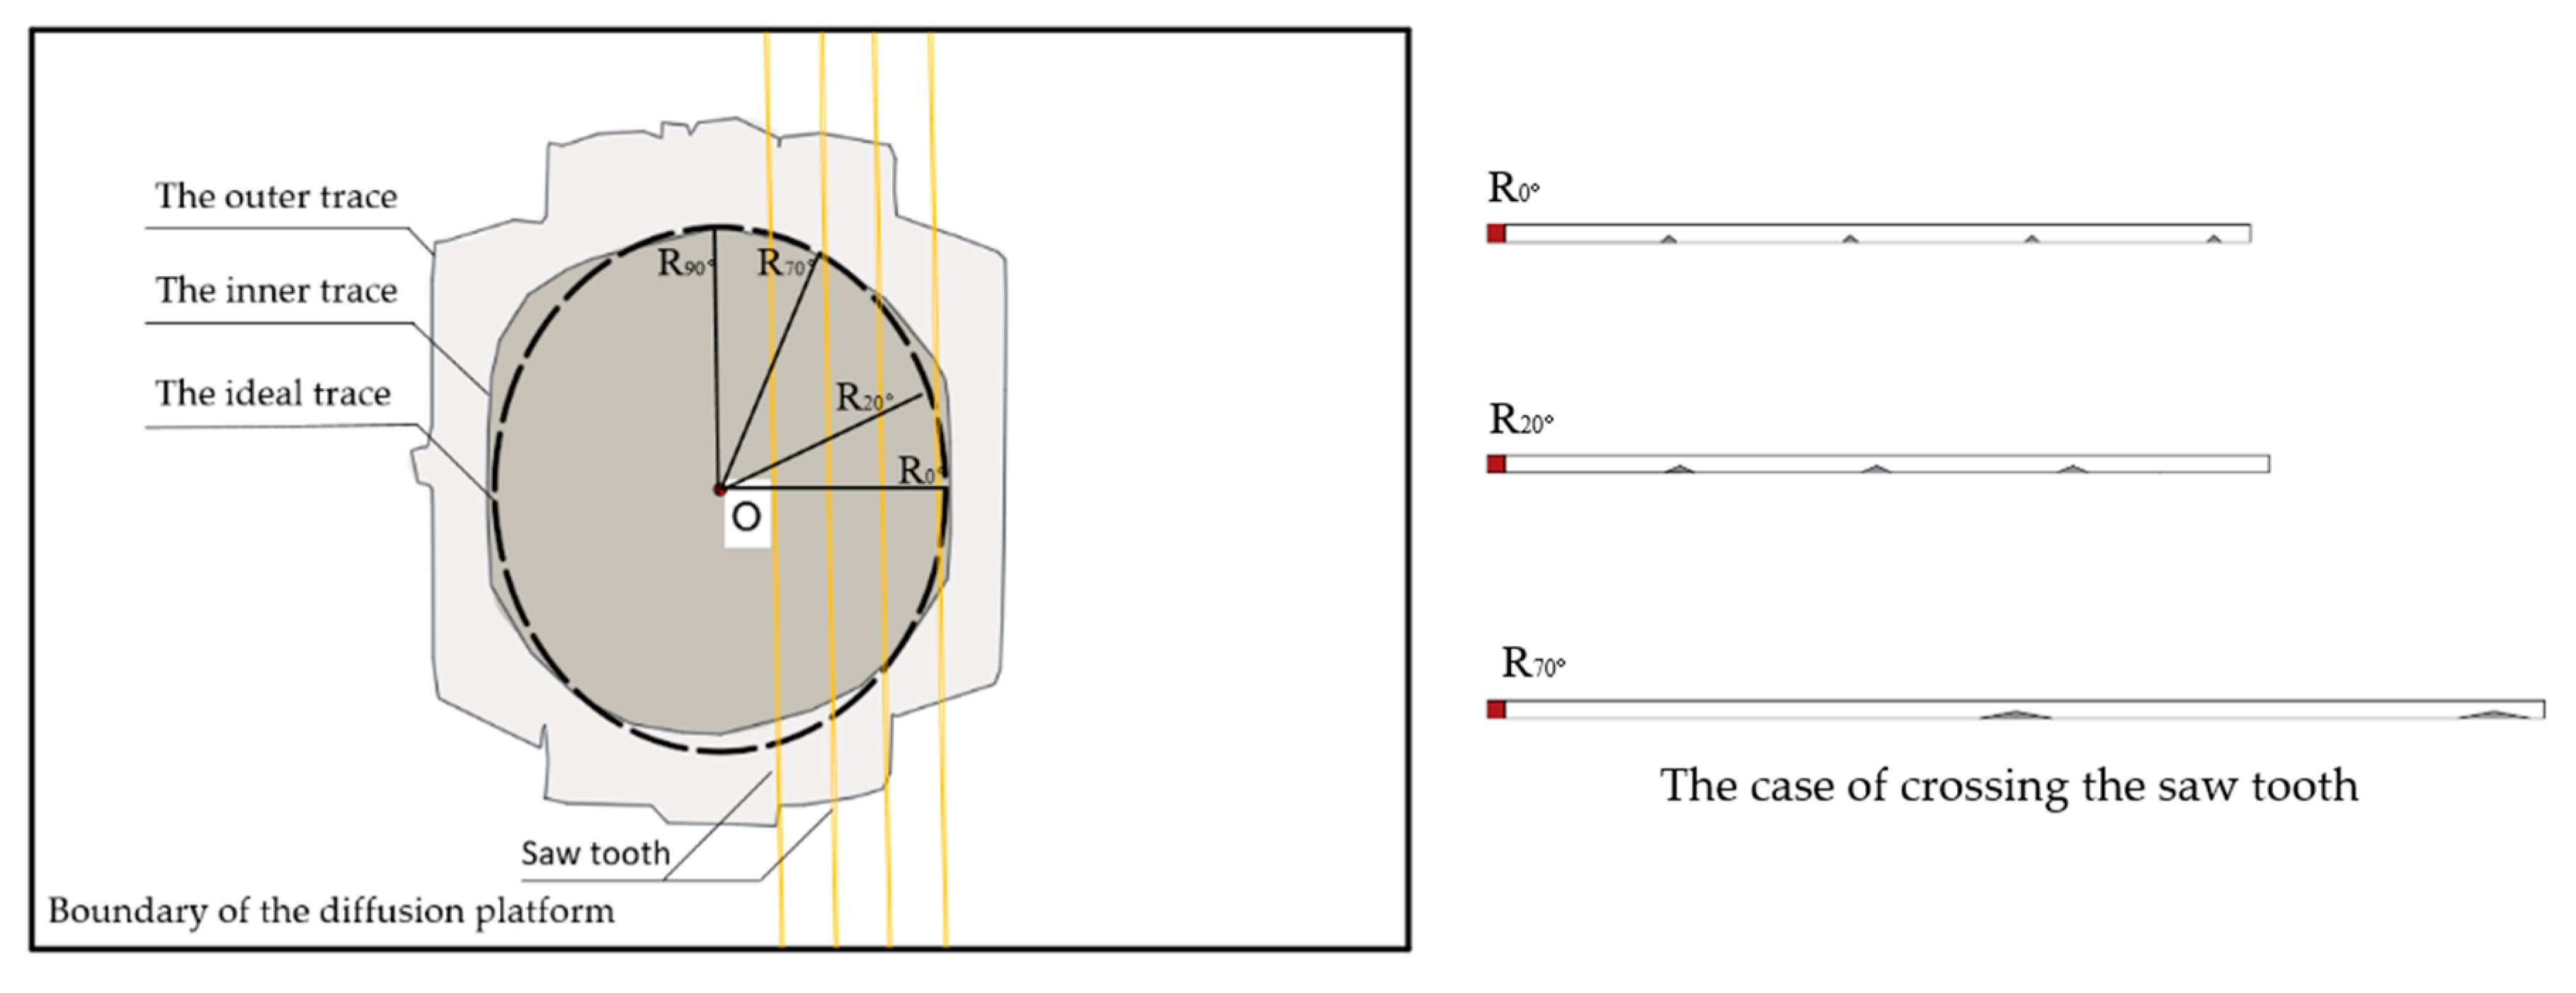
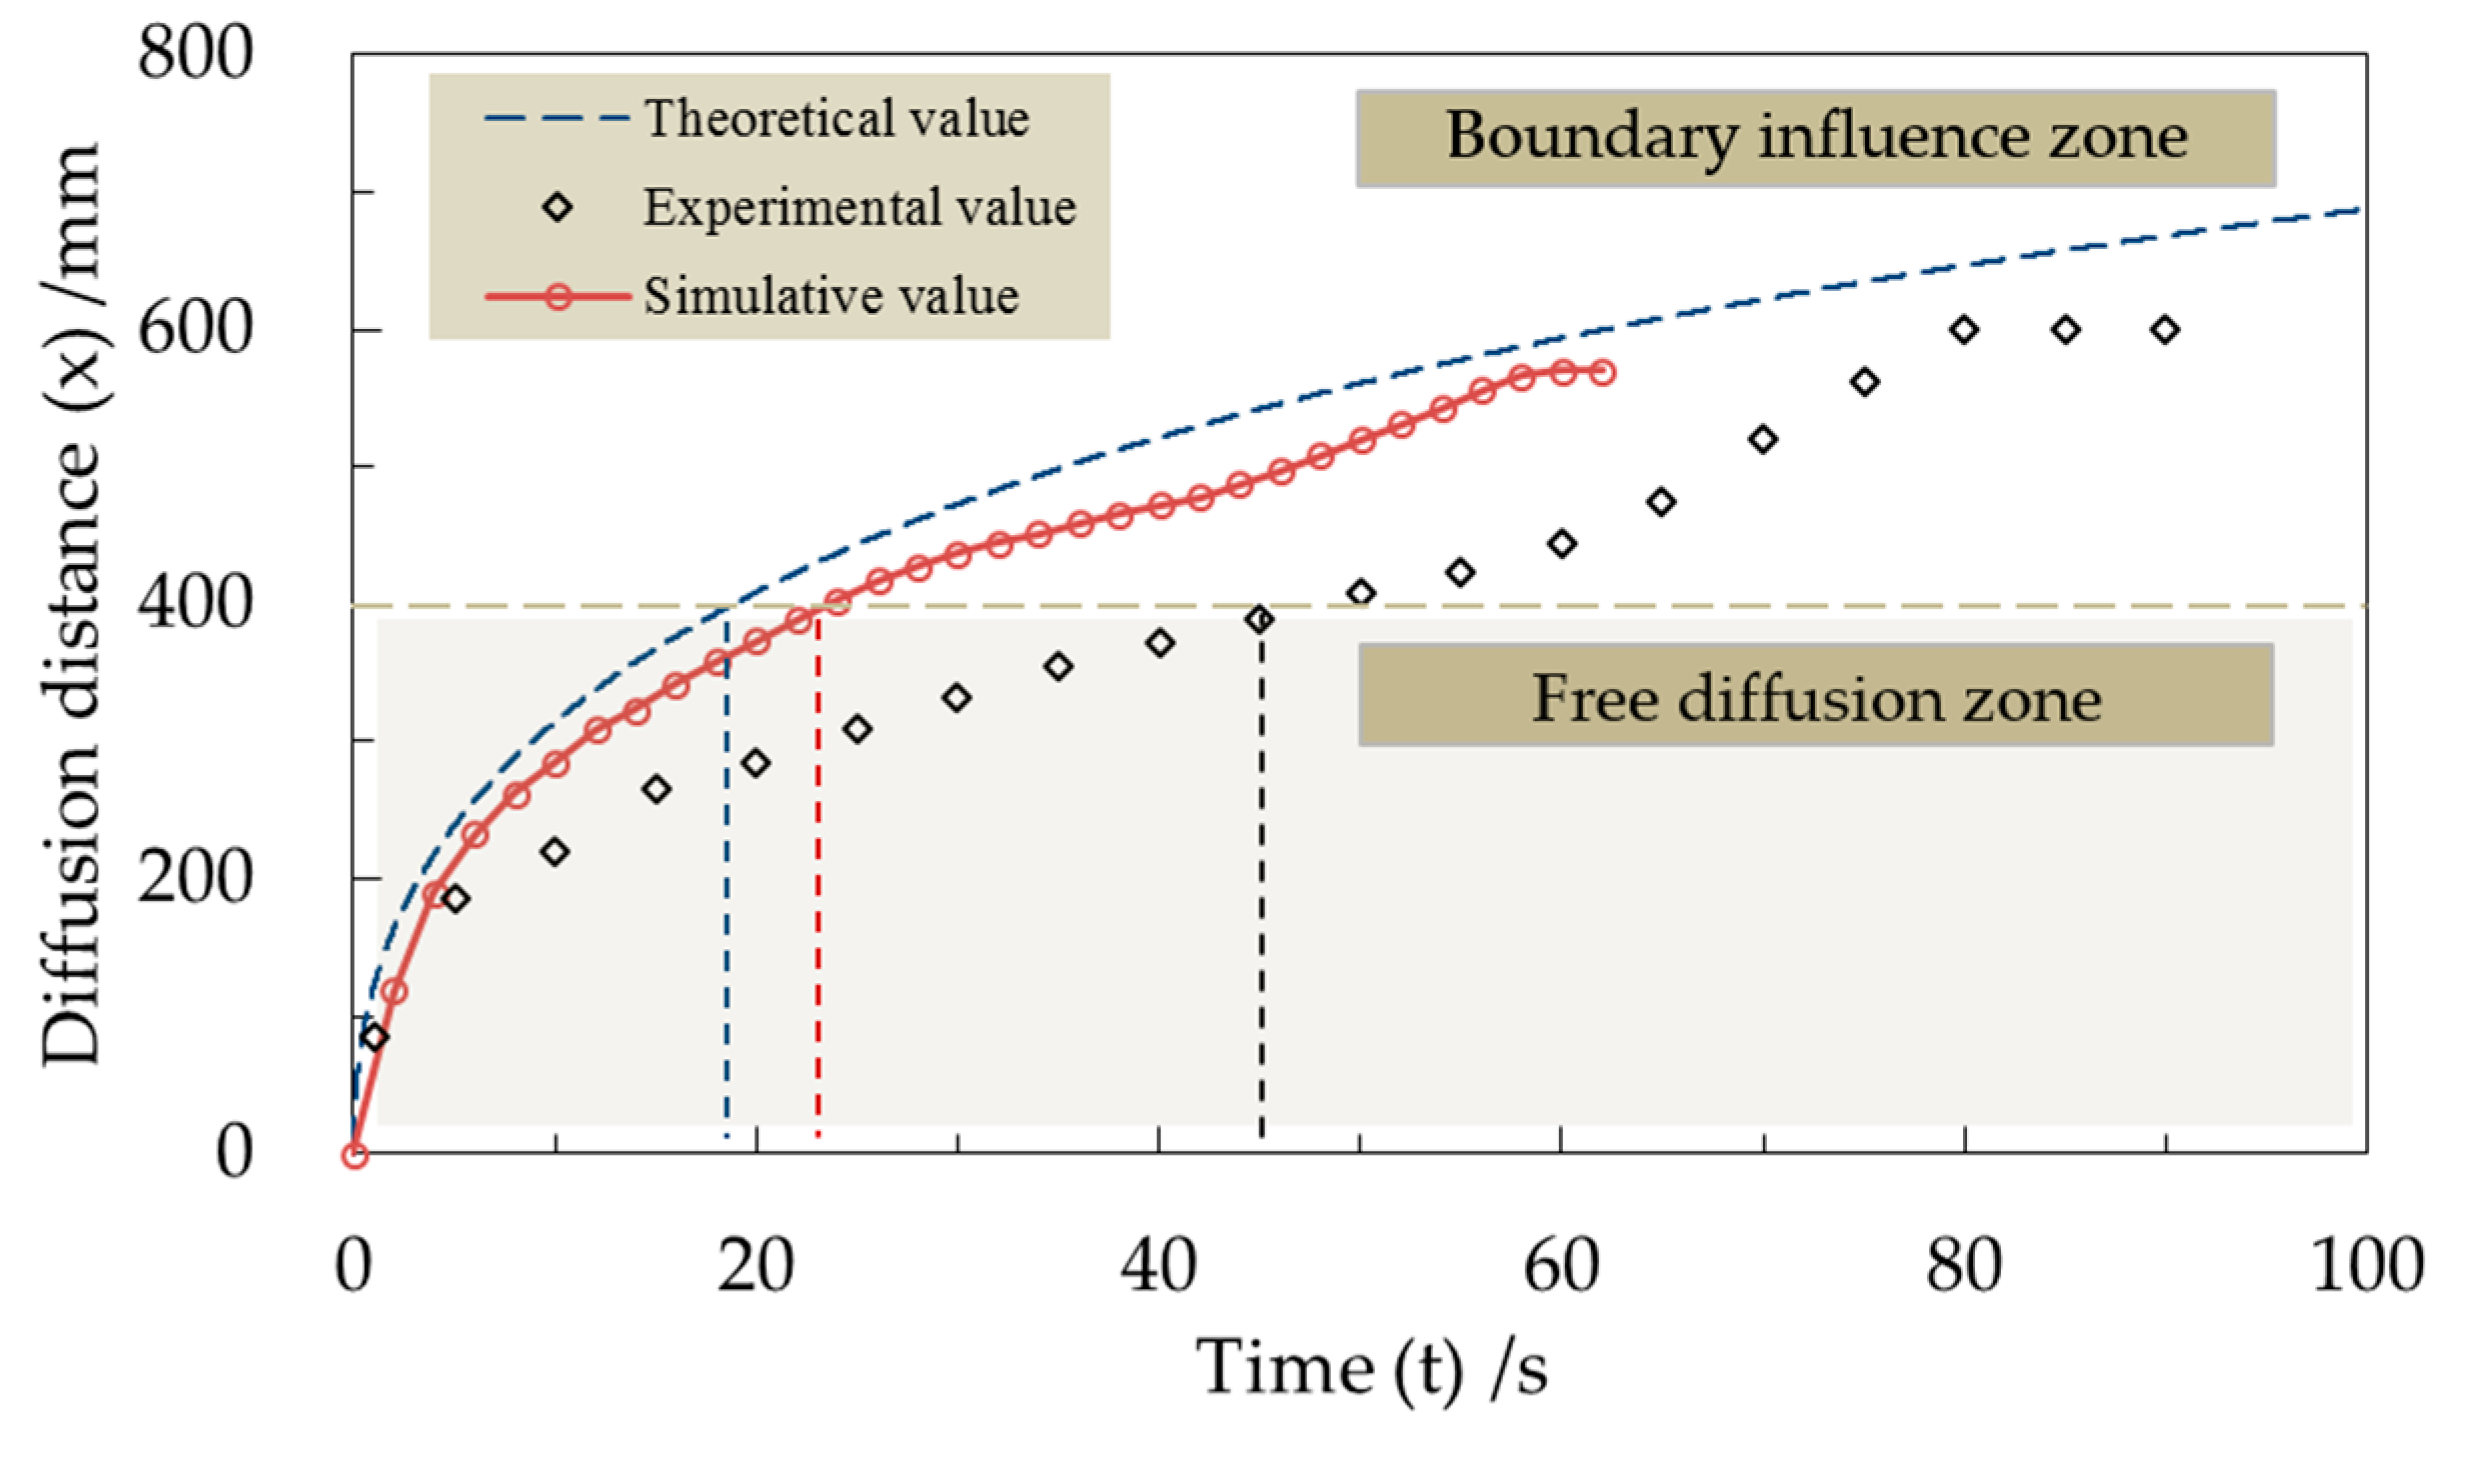
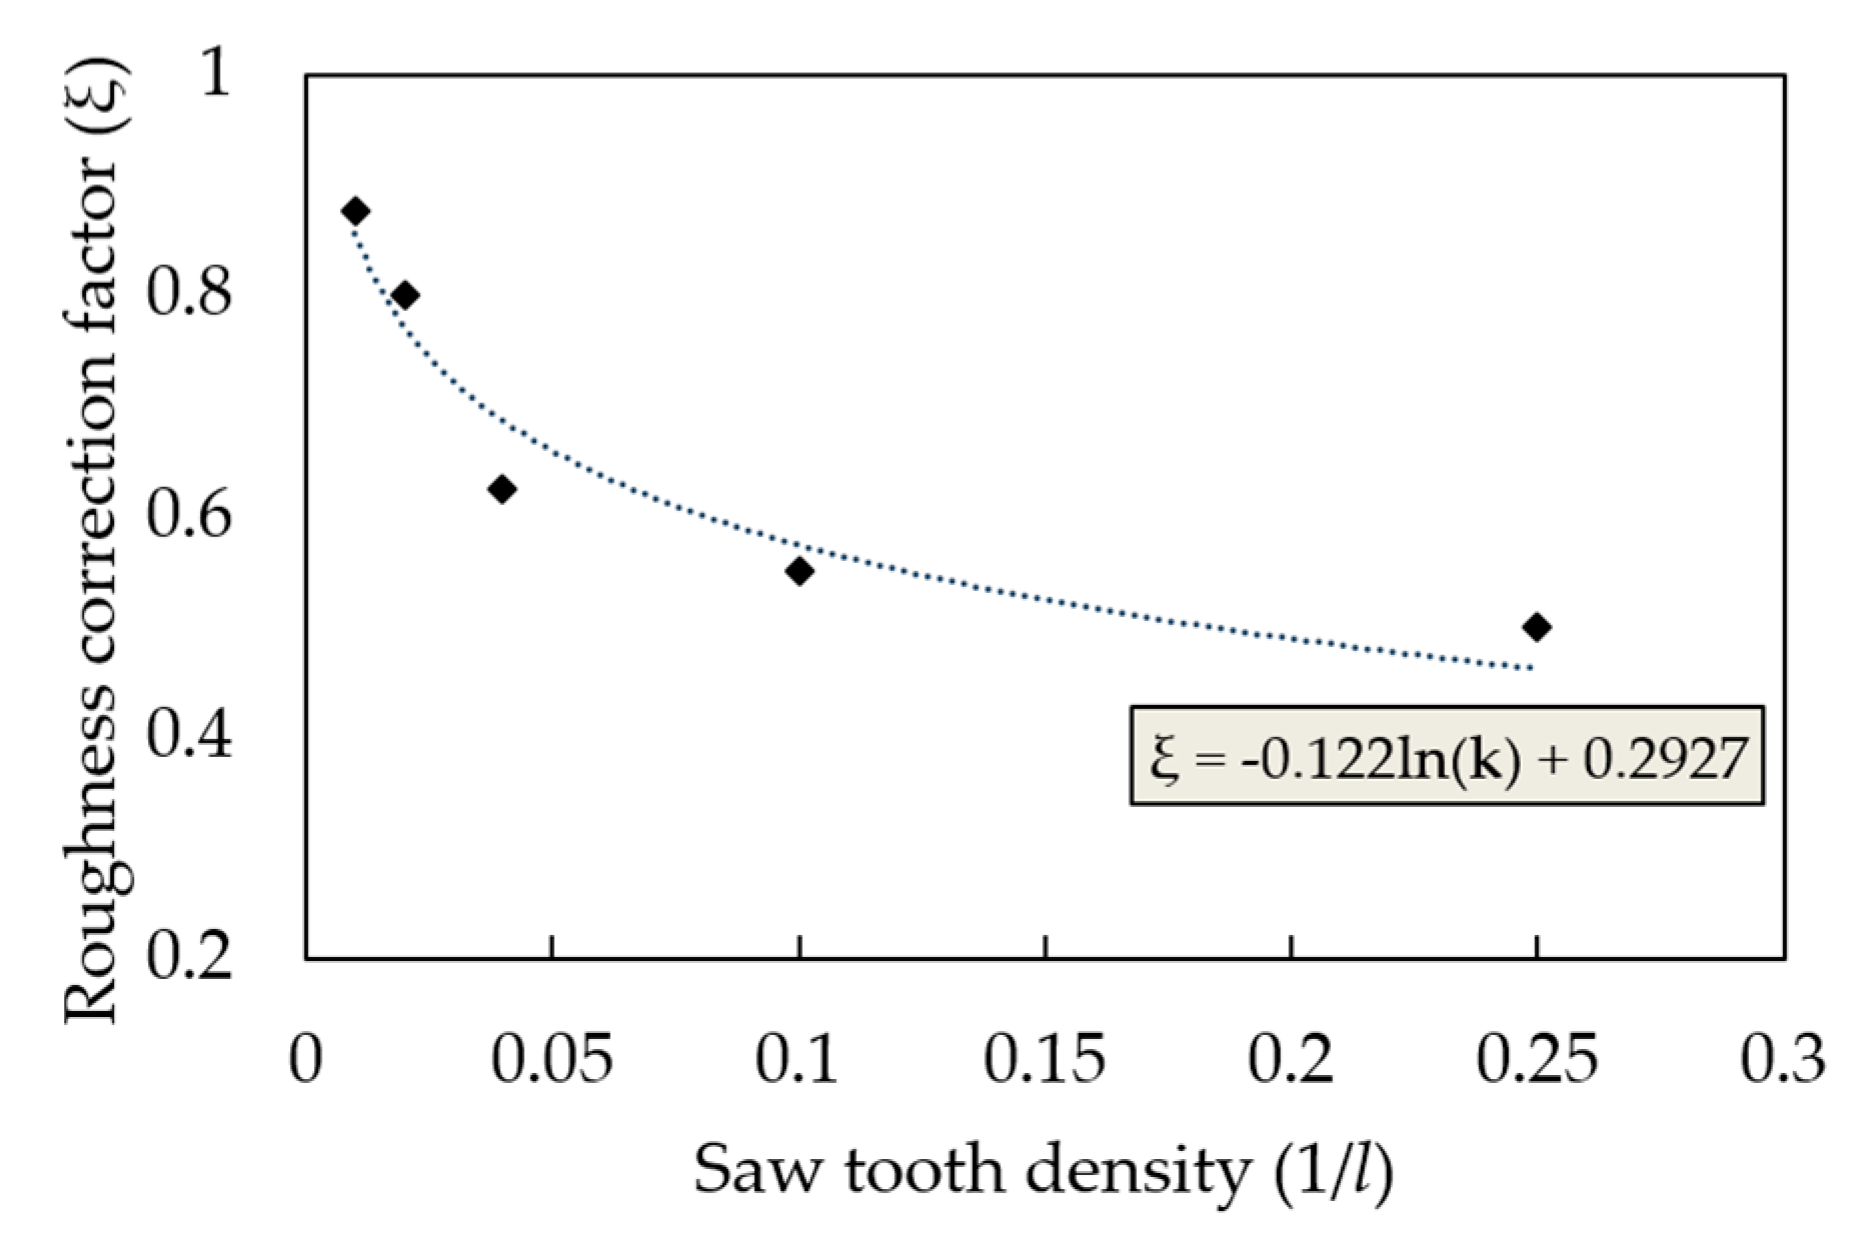
3.3. Grouting Diffusion Pattern
4. Numerical Study
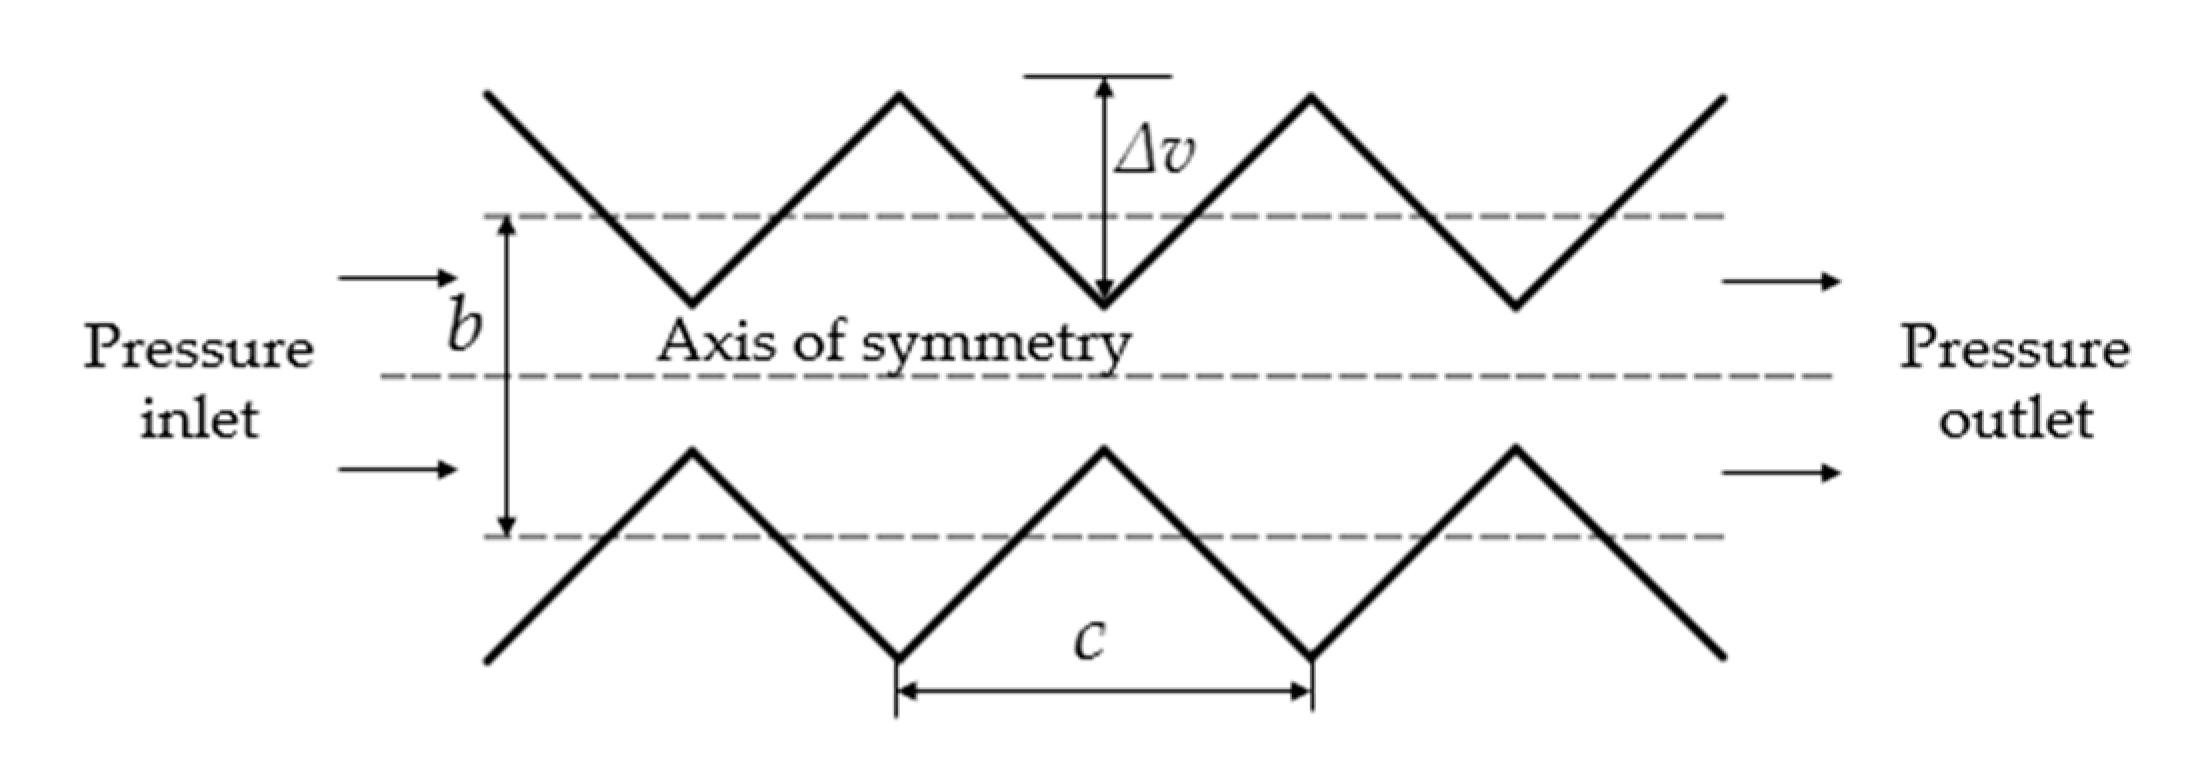
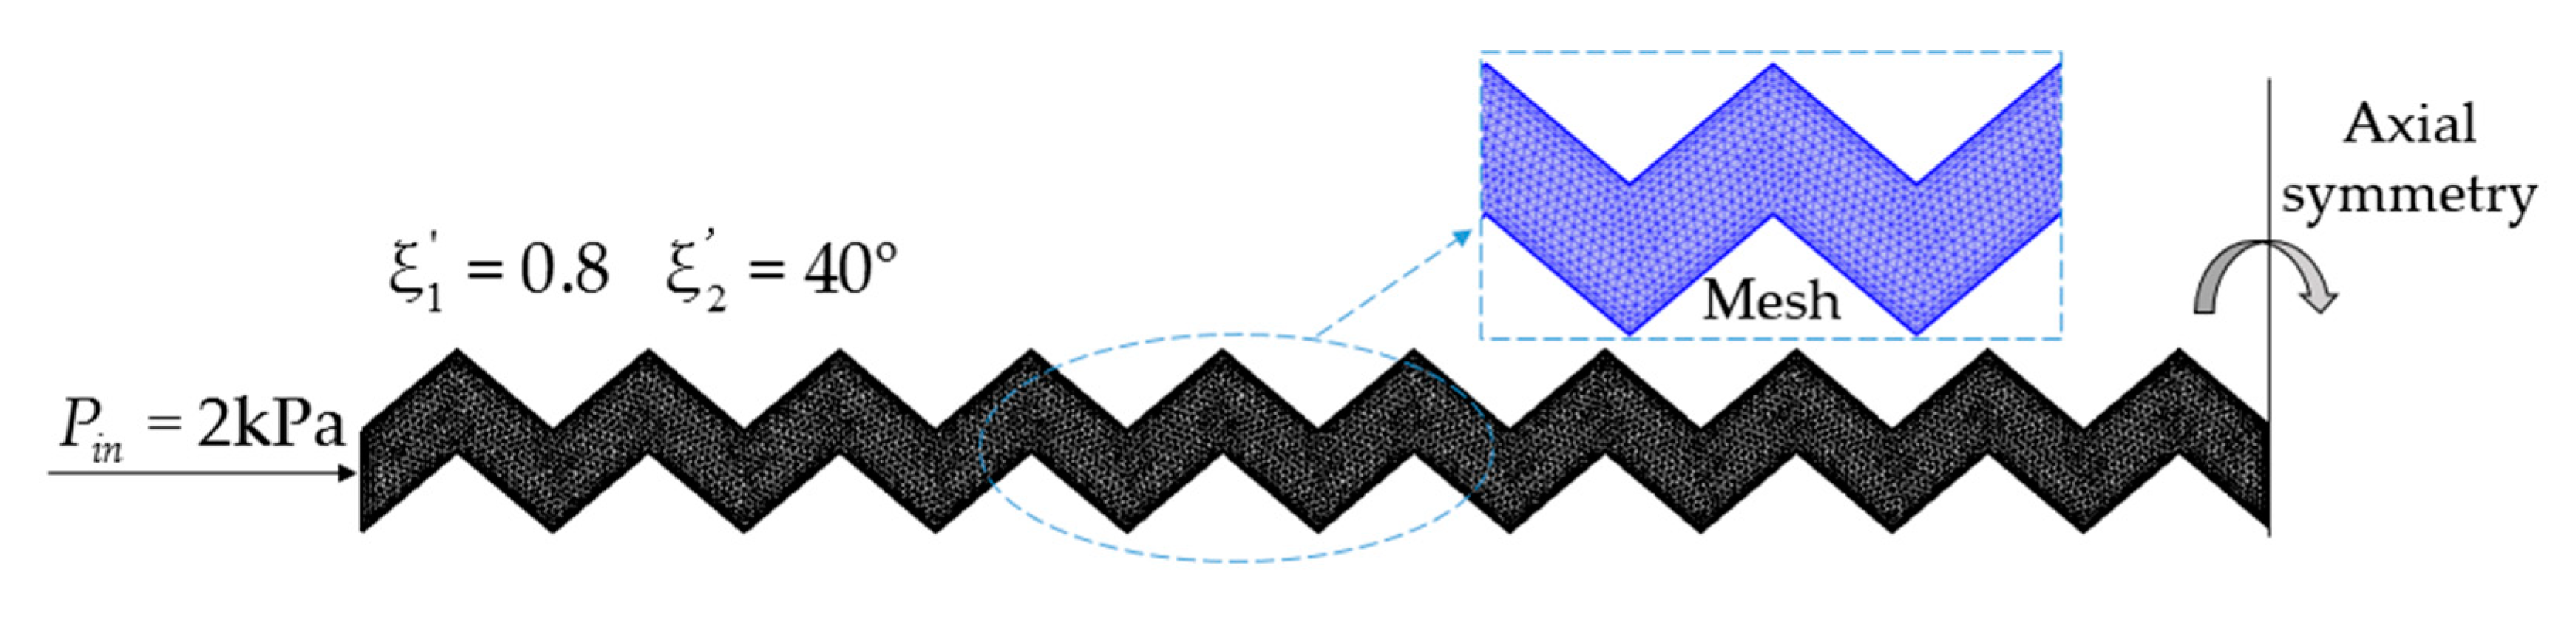
4.1. Grouting Diffusion Simulation under Anisotropic Rough Fractures
4.1.1. Modeling
4.1.2. Constitutive Model of the Slurry
4.1.3. Simulation Conditions
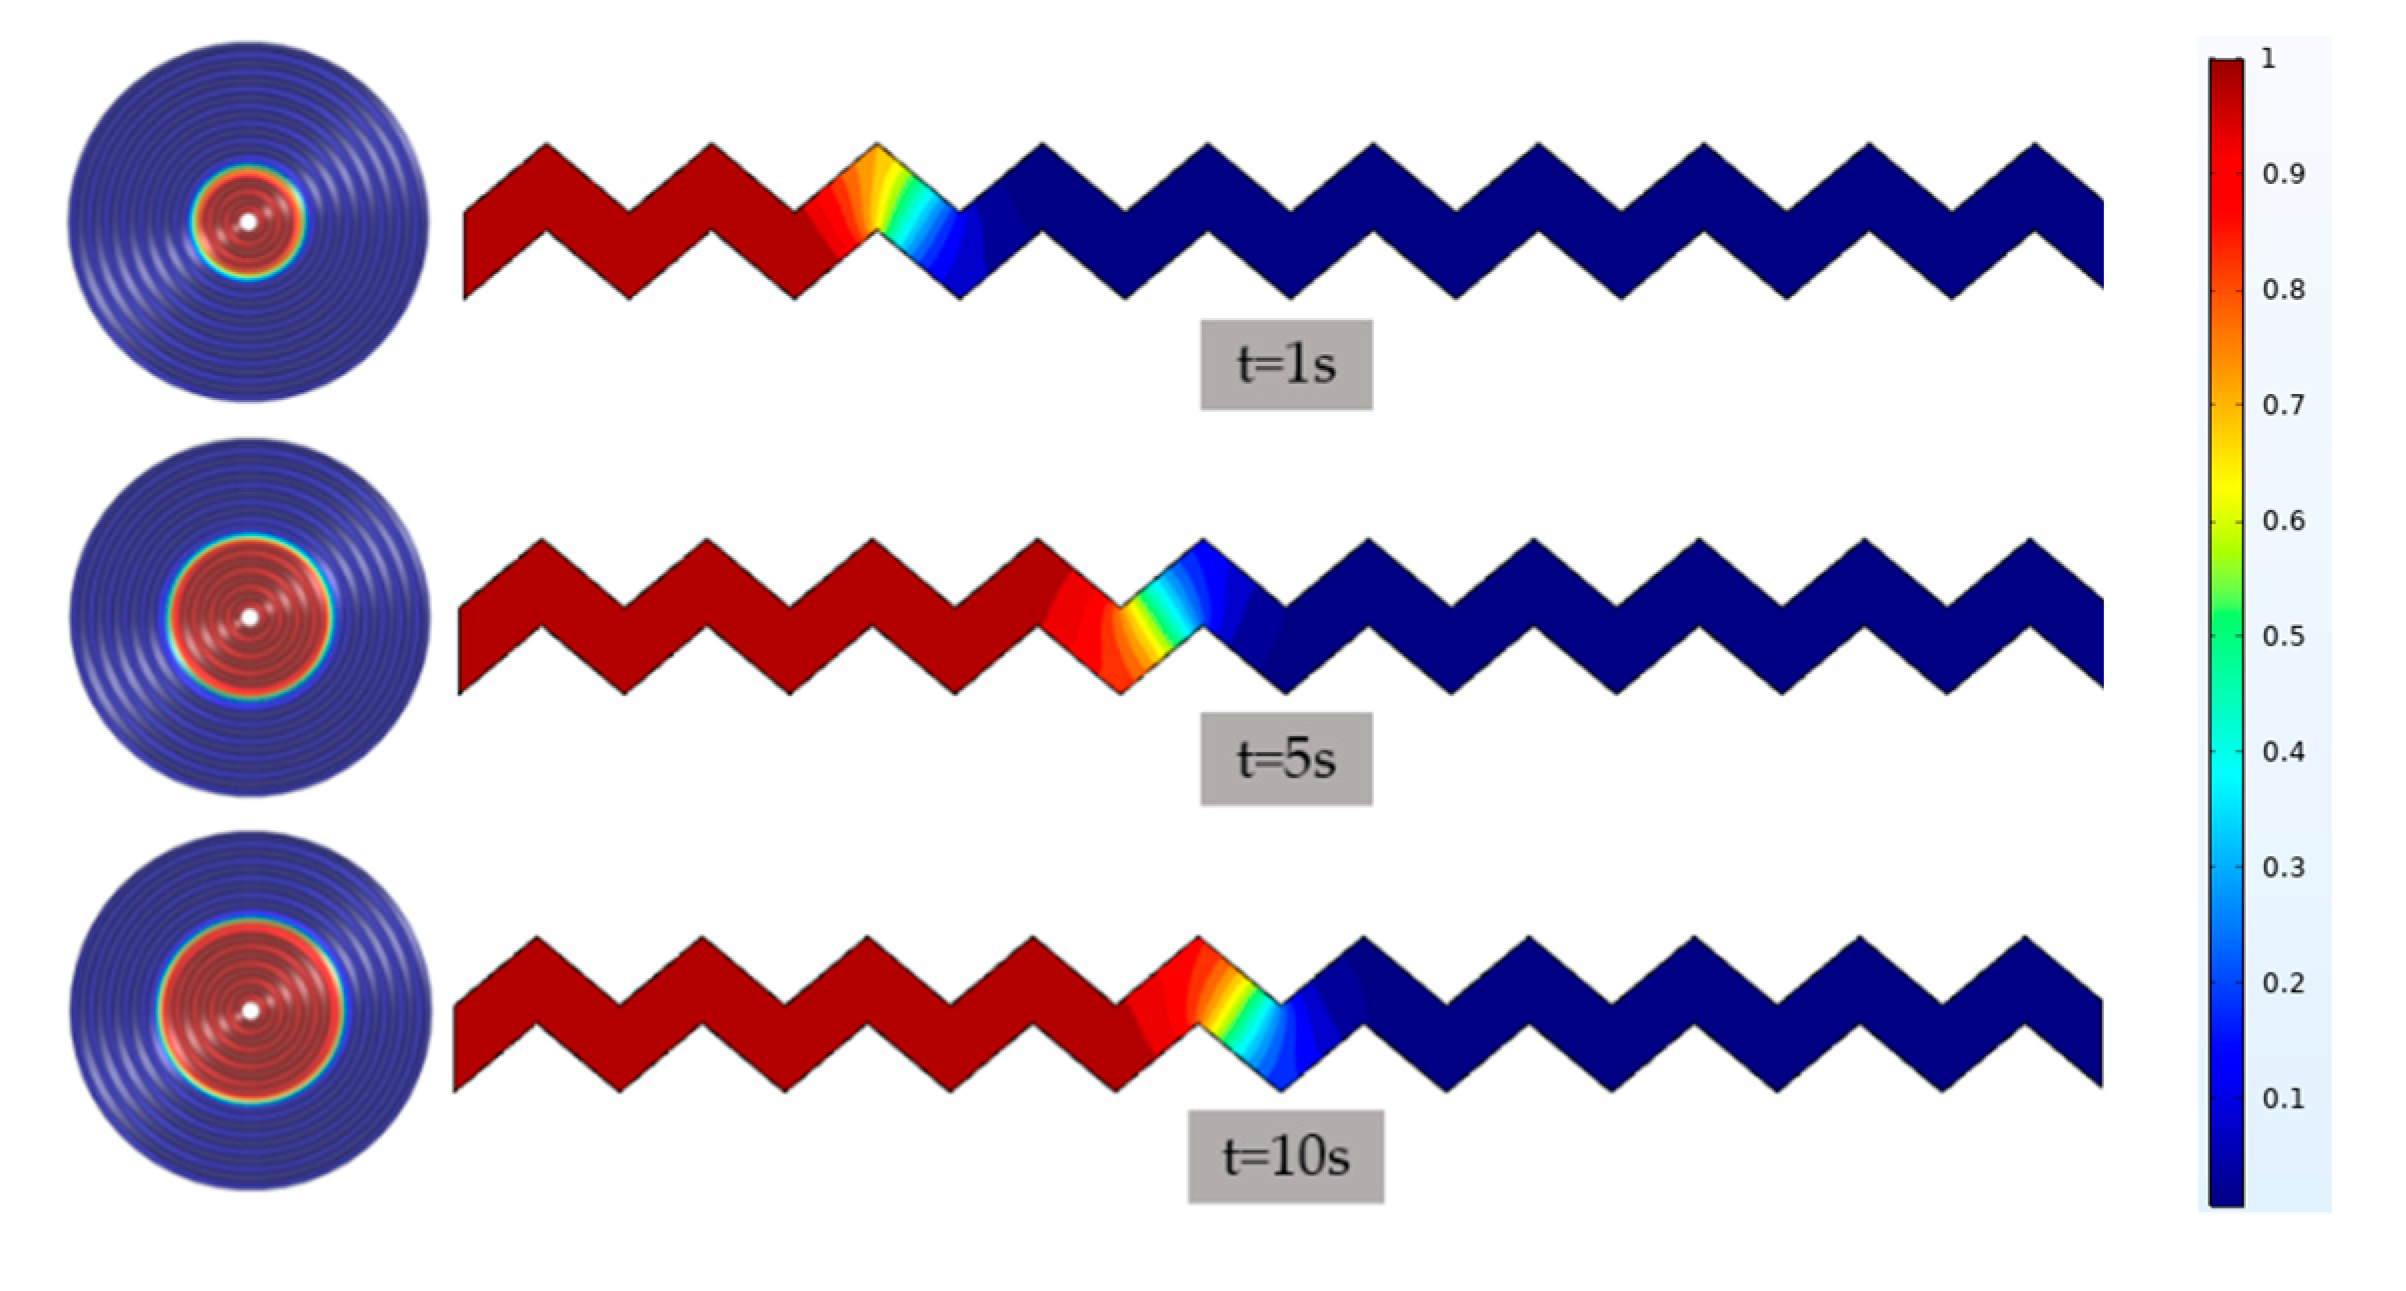
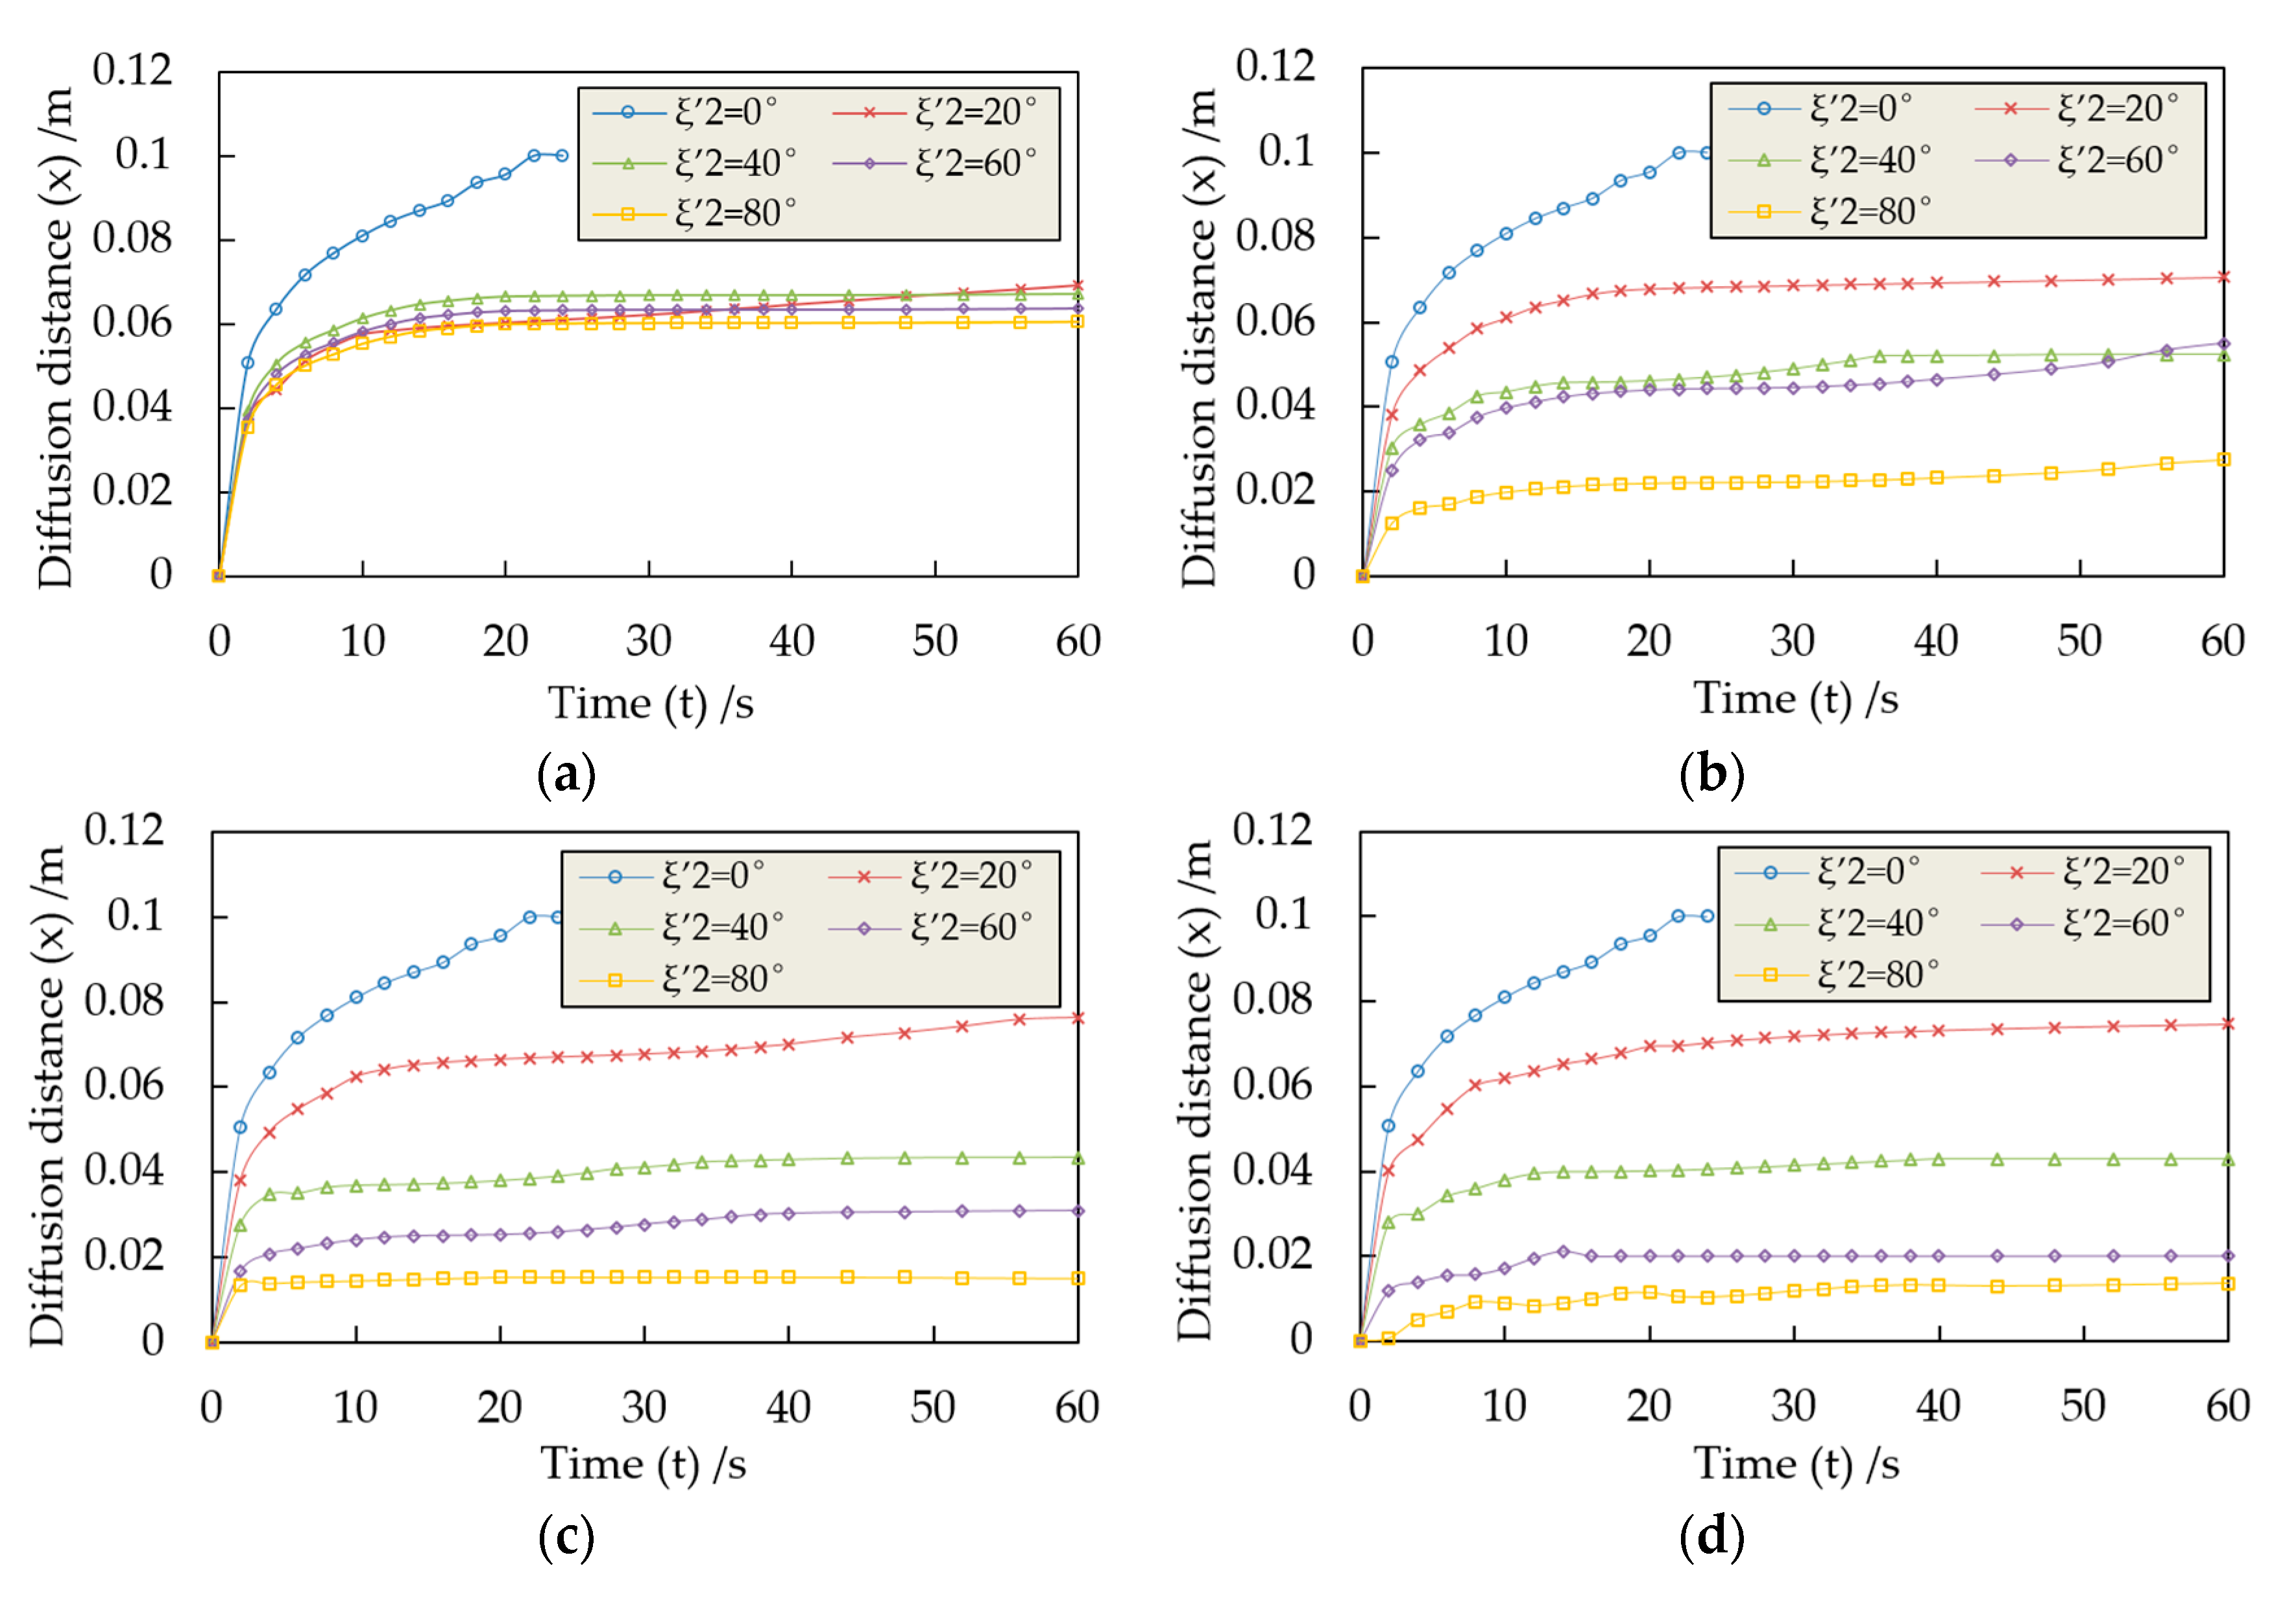
4.1.4. Simulation Results
4.2. Grouting Diffusion Simulation under Isotropic Rough Fractures
4.2.1. Modeling
4.2.2. Simulation Results
5. Conclusions
Author Contributions
Funding
Acknowledgments
Conflicts of Interest
References
- Kelessidis, V.C.; Maglione, R.; Tsamantaki, C.; Aspirtakis, Y. Optimal determination of rheological parameters for Herschel-Bulkley drilling fluids and impact on pressure drop, velocity profiles and penetration rates during drilling. J. Petrol. Sci. Eng. 2006, 53, 203–224. [Google Scholar] [CrossRef]
- Dai, G.; Byron Bird, R. Radial flow of a Bingham fluid between two fixed circular disks. J. Non-Newton. Fluid Mech. 1981, 8, 349–355. [Google Scholar] [CrossRef]
- Zou, L.C.; Hakansson, U.; Cvetkovic, V. Yield-power-law fluid propagation in water-saturated fracture networks with application to rock groutingGrouting of rock-simulation and classification. Tunn. Undergr. Space Technol. 2020, 92, 103170. [Google Scholar] [CrossRef]
- Rafi, J.Y.; Stille, H. Basic mechanism of elastic jacking and impact of fracture aperture change on grout spread, transmissivity and penetrability. Tunn. Undergr. Space Technol. 2015, 49, 174–187. [Google Scholar] [CrossRef]
- Sun, X. Study on the Diffusion Mechanisms of Grouting within Fractured Rock Mass Under Deep Ground. Ph.D. Thesis, China University of Mining and Technology, Xuzhou, China, 2019. [Google Scholar]
- Liu, R.T. Study on Diffusion and Plugging Mechanism of Quick Setting Cement Based Slurry in Underground Dynamic Water Grouting and Its Application. Ph.D. Thesis, Shandong University, Jinan, China, 2012. [Google Scholar]
- Gustafson, G.; Stille, H. Prediction of groutability from grout properties and hydrogeological data. Tunn. Undergr. Space Technol. 1996, 11, 325–332. [Google Scholar] [CrossRef]
- Zheng, Z.; Li, S.C.; Liu, R.T.; Zhu, G.X.; Zhang, L.Z.; Pan, D. Analysis of coupling effect between grout and rock mass during jointed rock grouting. Chin. J. Rock Mech. Eng. 2015, 34, 4054–4062. [Google Scholar]
- Ruan, W.J. Spreading model of grouting in rock mass fissures based on time-dependent behavior of viscosity of cement-based grouts. Chin. J. Rock Mech. Eng. 2005, 24, 2709–2714. [Google Scholar]
- Zhang, D.Y. Investigation on Coupling Mechanism of Multi-Fields for Grouting Diffusion in Fractured Rock Mass with Flowing Water. Ph.D. Thesis, China University of Mining and Technology, Xuzhou, China, 2017. [Google Scholar]
- Hakansson, U. Rheology of Fresh Cement-Based Grouts. Ph.D. Thesis, Royal Institute of Technology in Stockholm, Stockholm, Sweden, 1993. [Google Scholar]
- Majidi, R.; Miska, S.Z.; Ahmed, R.; Yu, M.; Thompson, L.G. Radial flow of yield-power-law fluids: Numerical analysis, experimental study and the application for drilling fluid losses in fractured formations. J. Petrol. Sci. Eng. 2010, 70, 334–343. [Google Scholar] [CrossRef]
- Jin, L.C.; Sui, W.H.; Xiong, J.L. Experimental Investigation on Chemical Grouting in a Permeated Fracture Replica with Different Roughness. Appl. Sci. 2019, 9, 2762. [Google Scholar] [CrossRef] [Green Version]
- Zhang, J.; Pei, X.; Sun, Y.; Huang, H. A Comparative Study of Grout Placement in a Rock Joint. In GeoShanghai International Conference, Shanghai, China, 27–30 May 2018; Springer: Singapore, 2018. [Google Scholar]
- Zhu, G.X.; Zhang, Q.S.; Lin, X.; Liu, R.T.; Zhang, L.Z. Analysis of the sealing mechanism of cement-sodium silicate grout in rock fractures with flowing water. Water 2020, 12, 1935. [Google Scholar] [CrossRef]
- Liu, R.T.; Zhang, L.Z.; Zhang, Q.S.; Yang, L. Numerical simulation of crack grouting process of quick setting slurry with running water and its experimental verification. Chin. J. Rock Mech. Eng. 2017, 36, 3297–3306. [Google Scholar]
- Yang, P.; Sun, X.Q. Rough single fracture grouting numerical simulation in hydrodynamic environment. Chin. J. Underg. Space Eng. 2017, 13, 950–954. [Google Scholar]
- Li, J.Q.; Xu, W. A CFD Simulation of self-compaction concrete based on Herschel-Bulkley rheological model. Eng. Mech. 2013, 30, 373–377. [Google Scholar]
- Nikakhtar, L.; Zare, S.; Mirzaei, H. Numerical modelling of backfill grouting approaches in EPB tunneling. J. Ming Environ. 2020, 11, 301–314. [Google Scholar]
- Sun, F.; Zhang, D.L.; Chen, T.L.; Zhang, X.P. Meso-mechanical simulation of fracture grouting in soil. Chin. J. Geotech. Eng. 2010, 32, 474–480. [Google Scholar]
- Gustafson, G.; Claesson, J.; Fransson, A. Steering parameters for rock grouting. J. App. Math. 2013, 22, 1643–1652. [Google Scholar] [CrossRef]
- Claesson, J. Radial Bingham flow. Background Report of a Detailed Solution. In Technology Representative; Chalmers University of Technology: Göteborg, Sweden, 2003. [Google Scholar]
- Lin, T.Y.; Kandlikar, S.G. An experimental investigation of structured roughness effect on heat transfer during single-phase liquid flow at microscale. J. Heat Trans. 2012, 134, 101701. [Google Scholar] [CrossRef]
- Wangner, R.N.; Kandlikar, S.G. Effects of structured roughness on fluid flow at the microscale level. Hydro. J. 2008, 16, 613–627. [Google Scholar]
- Hu, Y.; Werner, C.; Li, D. Influence of three-dimensional roughness on pressure-driven flow through microchannels. J. Fluids Eng. 2003, 125, 871–879. [Google Scholar] [CrossRef]
- Kleinstreuer, C.; Koo, J. Computational analysis of wall roughness effects for liquid flow in micro-conduits. J. Fluids Eng. 2004, 126, 1–9. [Google Scholar] [CrossRef]


| Components | CaO | SiO2 | Fe2O3 | MgO | Al2O3 | SO3 | Loss |
|---|---|---|---|---|---|---|---|
| Ratio (%) | 62 | 22.6 | 3.2 | 3.3 | 4.7 | 2.9 | 1.3 |
| Program | Saw Tooth Density | |||||
|---|---|---|---|---|---|---|
| roughness | None | 1/100 | 1/50 | 1/25 | 1/10 | All covered |
| Roughness Correction Factor (ξ) | 20° | 40° | 60° | 80° |
|---|---|---|---|---|
| 0 | 1 | |||
| 0.2 | 0.884 | 0.884 | 0.876 | 0.872 |
| 0.4 | 0.862 | 0.514 | 0.506 | 0.242 |
| 0.6 | 0.868 | 0.510 | 0.302 | 0.240 |
| 0.8 | 0.864 | 0.470 | 0.242 | 0.196 |
© 2020 by the authors. Licensee MDPI, Basel, Switzerland. This article is an open access article distributed under the terms and conditions of the Creative Commons Attribution (CC BY) license (http://creativecommons.org/licenses/by/4.0/).
Share and Cite
Ding, W.; Duan, C.; Zhang, Q. Experimental and Numerical Study on a Grouting Diffusion Model of a Single Rough Fracture in Rock Mass. Appl. Sci. 2020, 10, 7041. https://doi.org/10.3390/app10207041
Ding W, Duan C, Zhang Q. Experimental and Numerical Study on a Grouting Diffusion Model of a Single Rough Fracture in Rock Mass. Applied Sciences. 2020; 10(20):7041. https://doi.org/10.3390/app10207041
Chicago/Turabian StyleDing, Wenqi, Chao Duan, and Qingzhao Zhang. 2020. "Experimental and Numerical Study on a Grouting Diffusion Model of a Single Rough Fracture in Rock Mass" Applied Sciences 10, no. 20: 7041. https://doi.org/10.3390/app10207041