1. Introduction
The “Core musculature” term refers to the combination of muscles that surround and comprise the lumbopelvic region, and act synergistically to stabilize the trunk and hip, contributing to the movement control and stability of more distal joints [
1]. On the other hand, core stability, defined as the ability to control the position and motion of the trunk over the pelvis, governs optimal force production, transfer and application to more distal segments in many functional athletic activities [
2].
The core muscles are considered to play a key role in sport performance as they seem to provide ‘‘proximal stability for distal mobility” [
1,
3] throughout the entire kinetic chain. Moreover, core stabilization precedes gross motor movement, as the central nervous system activates the trunk musculature before limb movement to provide the stability and stiffness of the trunk and pelvis in anticipation of the forces produced at this level [
3].
“Core stability” is accomplished through a complex interaction of neuromuscular coordination, proprioception, strength and endurance of the trunk and hip musculature. This inherent complexity has been the focus of a wide range of studies employing different measurement techniques for core stability evaluation in recent years [
3]. In this way, there is a lack in the literature of a gold standard for core stability evaluation in sports. Therefore, the assessment of trunk stability in the field setting could become even more complex because it requires the combination of different variable measurements, such as force, endurance, etc. [
4,
5].
Considering this multi-characteristic approach, a wide variety of testing methods have been described to evaluate core stability performance, both in laboratory and in clinical settings. In the laboratory, the most common testing method to measure core strength has been developed by the use of isokinetic dynamometers, whereas trunk stability tests have been performed through the employment of custom-designed devices [
6,
7]. Beside these expensive and time-consuming tests, “clinical tests” are the preferred choice for evaluating core stability for “in the field conditions”.
No gold standard for core stability evaluation has been established, until recently. These tests have also involved vague or unclear scoring systems and require expensive instrumentations or the development of individually customized equipment. The definition of a gold standard test for core stability evaluation has become challenging, as there is not a widely accepted conclusive definition for core stability. In fact, there are numerous muscles that participate in the body core’s dynamic stabilization. Several reliable and easy to use methods have been proposed to assess core musculature function. These include the prone bridging test, the Biering–Sørensen test, the double leg lowering test, prone plank stability], the side plank bridging test], the front abdominal power test (FAPT), the side abdominal power test (SAPT) [
3,
8,
9,
10,
11,
12] and the flexion-rotation test [
13]. Some of the limitations of these tests are as follows: (a) they isolate one aspect of this complex interaction, such as core strength or endurance; (b) they are linked to a subjective scoring or evaluation system; and (c) they asses a more complete picture of this interaction, but not in a functionally relevant position, aligned with the sport-specific core region’s biomechanical and or functional requirements [
3]. Furthermore, these tests have also reported vague or unclear scoring systems and/or require expensive equipment, or they require the development of individually customized measurement devices which limit the extrapolation of the results obtained to other populations.
The interaction among the lumbopelvic and hip muscles makes it difficult for researchers to develop a single test that could encompass all muscles and structures [
12]. Considering the abovementioned methodological limitations, there is a clear need to develop a quick, simple, valid and reliable test to accurately evaluate the core stability of an athlete, due to this capacity’s proven strong relationship with sport performance as well as with low back and lower limb injury risk [
2,
14,
15,
16,
17].
In the present research, we aimed to describe two functional core stability tests that aimed to evaluate the athlete’s ability to produce isometric force, from two core stability-challenging positions, through the use of a hand-held dynamometer. Secondly, we evaluated a professional football team before and after a standardized core training program in order to elucidate if a motor control-based progression would have any effect on the player’s ability to produce isometric force in the previously validated tests.
2. Methods
2.1. Experimental Approach to the Problem
This investigation consisted of two consecutively performed studies.
Study I: (Cross-sectional validation study)
A preliminary validation study of the two new core functional strength tests was performed. The core function testing positions were derived from traditional core-conditioning exercises that address both closed [
2] (Closed Kinetic Chain test; CCT) and open kinetic chain efforts [
12] (Prone Plank Test; PPT) (
Figure 1A and 1B respectively). These two tests aimed to assess the force exertion capacity in those two positions with a hand-held dynamometry. The intra- and intertester reliability of the measurements was evaluated for both tests.
Study II: (Longitudinal study)
Once the testing procedures were shown to be reliable, a prospective longitudinal study was performed aiming to analyze the core functional strength values in relation to the implementation of a core neuromuscular training program during the competitive season of a professional football team squad (Spanish league 2).
2.2. Participants
Study I: (Cross-sectional validation study)
Seven recreationally active males (6–7 on the Tegner scale) (mean ± standard deviation 19.23 ± 2.43 years old, 181.0 ± 6.23 cm, 75.42 ± 7.25 kg) were recruited for the between-session reliability study. Then, the sample was increased by adding 15 male junior football players competing in Spain’s National Junior League (mean ± standard deviation 17.87 ± 1.13 years old, 181.20 ± 6.84 cm, 74.69 ± 6.63 kg). All participants were free from any previous spine or lower leg injury at the time of examination. Participants were instructed not to perform any kind of specific core stability training during the week between the two testing sessions.
Study II: (Longitudinal intervention study)
In total, 20 male professional football players competing in Spain’s National Second League (mean ± standard deviation age 27.7 ± 5.1 years old, height 180.9 ± 6.9 cm, weight 76.5 ± 5.4 kg) were included in the longitudinal study.
2.3. Procedures
Two hand-held dynamometers (HOGGAN Health microFET3 Combo Manual Muscle Tester & Digital Inclinometer, United States) were used for data recording. Each tester employed the same device during the entire evaluation process.
Closed Kinetic Chain test (CCT)
The participant was placed in a standing position with the trunk positioned at 50° of flexion, knee positioned at 20° of flexion (0° of abduction/rotation of the knee) and with both hands placed at the iliac crest level. The tester was positioned ipsilateral to the testing leg and the HHD was placed just superior to the lateral femoral condyle. Then, the participant exerted a maximal isometric contraction toward hip abduction and external rotation, “squeezing their glutes” against the HHD which was firmly fixed by the examiner. The applied force had to be maintained for 3 s and 3 attempts were registered for each leg. (
Figure 1A). No compensation at the trunk level was allowed during the execution of the test.
Prone Plank Test (PPT)
The participant was placed in a prone position with the ankles positioned at 0° of ankle dorsal flexion. They were instructed to hold their pelvis in a parallel position with respect to the stretcher and to move the testing leg into 20° of hip extension and abduction, with the knee in an extended position. The tester was positioned ipsilateral to the testing leg, and the dynamometer was placed superior to the external malleolus. Then, the participants exerted a maximal isometric contraction toward hip extension and hip abduction against the hand-held dynamometer (HHD) which was firmly fixed by the examiner. Participants had to maintain the generating force for 3 s and 3 attempts were registered for each leg. To ensure appropriate direction of force applied by the participant, they were asked to perform the task with the following instructions: “imagine you had a watch at the bottom of your feet at which you should have to tag the five or ten o’clock hours on it”, when testing the right and left legs respectively (
Figure 1B). No pelvis compensation was allowed during the execution of the test.
Study I: (Cross-sectional study)
Two test sessions were performed 1 week apart. No physical activity program focusing on the core muscles between the testing sessions was allowed for the participants.
All participants were evaluated by two testers (S.E. and E.B.) following the same testing protocol. Both testers were physical therapists and they had not been familiarized with the procedure of the new proposed core strength tests. Before each testing session, both testers were instructed about the testing procedure and were familiarized with the dynamometer by an expert instructor (I.S). One familiarization trial was followed by three testing measurements for each leg and test type. The two highest recordings were gathered for statistical analysis. If the difference between the trials was higher than 10%, another trial was performed.
Study II: (longitudinal study)
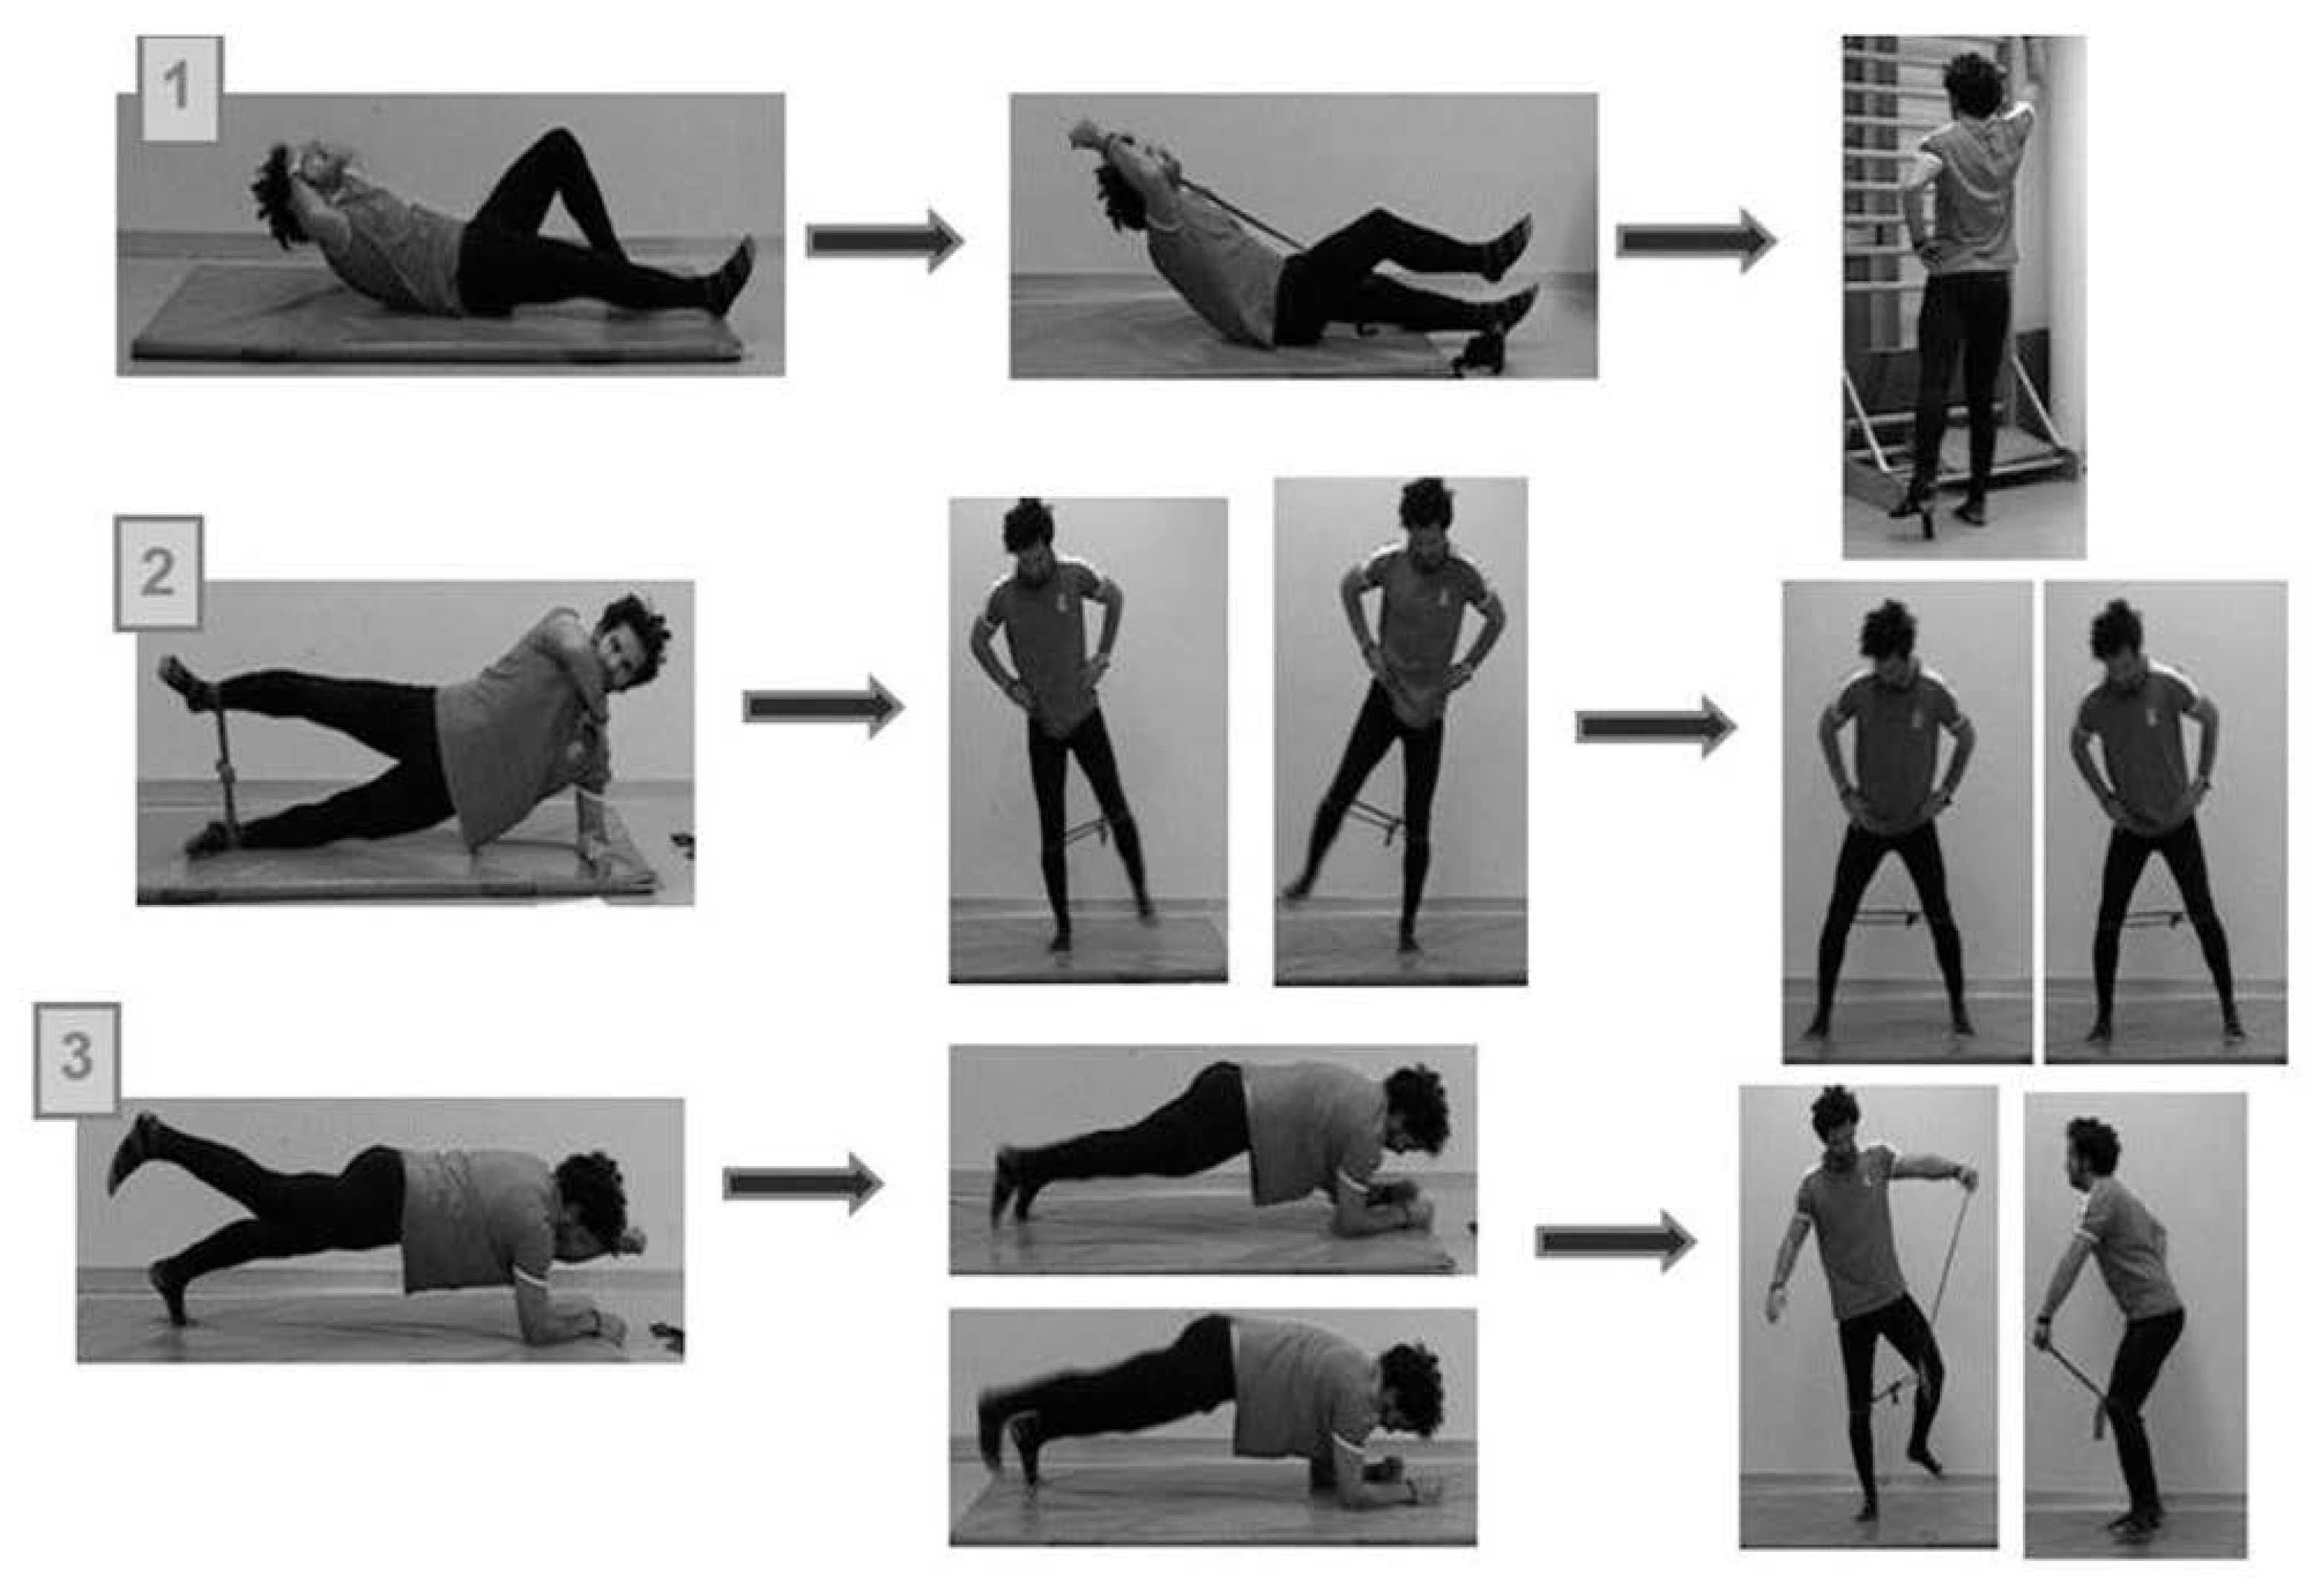
A 42 weeks standardized core stability training program was performed, divided into three different stages with progressively increasing stabilization demands (
Figure 2). The difficulty was increased after every 14 weeks. The players performed 28 core program training sessions at each stage and were evaluated at the beginning and at the end of the whole standardized exercise program.
All participants were tested by the same evaluator (I.S) following the same testing protocol described in detail in the validation study. At the follow-up evaluation, 7 players missed the testing session due to either injury or national team recruitment for international call ups, hence the test–retest comparison was done with a sample of 13 football players.
The compliance with the core training program was recorded at every core training session by the athletic trainer of the football team (J.S), using a data log model generated by the authors.
All participants provided informed consent before participation. The football team’s medical staff’s permission was requested in study II. The study was approved by the ethic committee of the Public University of Navarra and was performed in accordance with the Declaration of Helsinki for longitudinal studies with human beings.
2.4. Statistical Analysis
The SPSS statistical package (version 17.0.0.236; SPSS Inc. Chicago, IL, USA) was used to perform all the statistical analyses. All analyses assumed statistical significance at p ≤ 0.05.
Study I: (Cross-sectional study)
A total of 22 participants were evaluated for the intrasession, and intra- and inter-rater reliability analysis. Furthermore, a subset of seven subjects was randomly selected from the initial cohort and they repeated the whole examination at seven days for the test–retest reliability calculations.
Descriptive statistics, including mean peak torque values with standard deviation, coefficient of variation (%) (expressed as the SD of the mean, multiplied by 100% and expressed as a percentage) and confidence intervals (95%), were calculated. The peak isometric force values obtained from each evaluator during the PPT and CCT were gathered for intra-rater (trial 1, trial 2), inter-rater (male tester, female tester) and intra-rater intersession (assessment day 1/day 2). Afterwards, a Paired
t-test comparison and the corresponding non parametrical Wilcoxon Signed-rank test were run to primarily test whether the two sets of scores were significantly different from each other, before their test–retest reliability was analyzed [
18].
The data was graphically examined using Bland and Altman [
19] plots in, which the difference between test sessions was plotted against the mean of the two test sessions. Mean differences between test sessions with 95% CIs were calculated to determine whether there was any systematic bias. The relative reliability of the data was determined using a two-way random effect model intraclass correlation coefficient (2, k). Before calculating absolute reliability, Bland and Altman plots were generated to examine the correlation (R2) between the absolute differences and the mean values for each test, in order to detect the presence or absence of heteroscedasticity in the data [
19]. If the random error increases as the measured values increase, the data is considered heteroscedastic. In contrast, when there is no relation between the error and the size of the measured value, the data is described as homoscedastic. With homoscedastic errors, providing that they are also normally distributed, the raw data can be analyzed with conventional parametric analyses, but heteroscedastic data should be transformed logarithmically before analysis, or investigated via an analysis based on ratio statistics. This comparison method is widely used to verify the reliability and reproducibility of the measurement, rather than the correlation coefficient (r) and regression techniques, which are inadequate and can be very misleading when assessing agreement, as they evaluate only the linear association of two sets of observations. With this graph, evaluation of the magnitude of the disagreement, identification of outliers and the observation of any bias are easily achieved [
20]. Due to the simplicity and potential for the identification of pairs of observations whose differences reach beyond clinical tolerances, the Bland and Altman approach is currently the preferred approach to evaluate agreement between two measurements [
19].
If R2 was between 0 and 0.1, the data were considered homoscedastic; consequently, the absolute reliability was assessed by determining the SEM, which was calculated using the square root of the mean square error from the analysis of variance model, as recommended by Atkinson and Nevill [
21]. If R2 was greater than 0.1, the data was considered heteroscedastic; consequently, absolute reliability was determined by calculating the CV. When applicable, the CV was calculated for each subject by dividing the standard deviation of the two testing sessions by the mean of the two testing sessions ×100 (for intersession CV calculation), and the standard deviation of two testers by the mean of the two testers ×100 (for intrasession CV calculation).
Both the intra-rater (rater 1 and 2, between 2 days) and the inter-rater reliability (between rater 1 and 2, the same testing day) peak isometric force values were assessed using intraclass correlation coefficients (ICC) with 95% confidence intervals (CI) in order to assess relative reliability by utilizing a two-way random effects model with single measure reliability (ICC (2,1)). The mean value from each participant was used for the analysis. Values < 0.50 represented poor reliability, values > 0.50 and < 0.75 indicated fair to good reliability, and values > 0.75 marked excellent reliability [
20]. Given that ICC values may be influenced by the inter-subject variability of scores, the standard error of measurement (SEM) was reported in conjunction with the ICCs. A large ICC may represent poor trial-to-trial consistency if the inter-participant variability is too high [
18], in contrast to SEM, which is not affected by inter-subject variability [
18]. SEM was calculated using the equation SEM = SD × (√1 − ICC), where SD corresponds to the sample standard deviation [
17,
20,
21,
22] for intra- and inter-rater reliability analysis. In the case of the intersession reliability analysis, the SD of the T2 data set class was utilized, assuming that between the two assessment sessions, T2 generated lower SD [
21]. The error in an individual’s score at one point in time was estimated by multiplying the SEM by the
z value for the 90% confidence level (
z value = 1.65) [
23,
24,
25,
26,
27,
28,
29]. This value was then multiplied by the square root of 2 (to account for the measurement error in two test sessions) in order to estimate the minimum detectable change (MDC) at the 90% confidence level.
Study II: (Longitudinal study)
A preliminary effect size calculation was performed to determine the adequate sample size required to account for a random error of 0.8. A total of 27 participants would have been necessary, but finally 20 participants were recruited (an entire second Spanish league football club). After that, only 13 players were included in the statistical analysis, because 7 players did not complete the testing session after the core training program due to either injury or national team recruitment for international match play. The compliance of the core training program was 82%, corresponding to 69 core training sessions accomplished out of the 84 total sessions established at the beginning of the intervention.
After checking the assumptions of parametric statistics, the mean comparisons before and after the implementation of the core training program were analyzed using a Paired Sample
t-test. The estimation of MDC at a 90% confidence level was also calculated to determine whether the observed change in score between the pre- and post-testing evaluations was truly a change in patient status, or was merely associated with an error (noise) in the measurement process [
17].
3. Results
Study I: (Cross-sectional study)
Bland and Altman plots for intrasession intratester and intratester intersession reliability (
Figure 3) demonstrated no systematic biases between trials and testing days. In relation to intrasession and intertester reliability, the PPT test values were grouped together. Alternatively, in the case of the CCT test values, a systematic bias seemed to occur, given the fact that the higher the force values reported from the participants, the greater the differences encountered between testers.
Descriptive data from both testers for the intrasession analysis of the first testing session (T1) are presented in
Table 1. Looking at between-trial variability, the mean CV (%) values for both core strength tests for the male tester (PPT = 4.11%; CCT = 5.79%) and the female tester (PPT = 2.73%; CCT = 5.05%) were below 10%, indicating low test–retest variation
22.
Regarding the intratester and intrasession reliability analysis, the data showed excellent reliability for both the core strength tests for the male tester (PPT = 0.94; CCT = 0.96) and the female tester (PPT = 0.99; CCT = 0.81) (
Table 2).
In relation to intratester and intersession reliability analysis, the data exhibited excellent reliability for both core strength tests for the male tester (PPT = 0.77; CCT = 0.94) and the female tester for PPT (ICC = 0.84), but poor reliability for the female tester in the case of the CCT (ICC = 0.38). These results are shown in
Table 3. The intertester and intrasession reliability analysis is represented in
Table 4. For the PPT test, the data exhibit fair to good reliability (ICC = 0.62) and poor reliability for the CCT test (ICC = 0.47). The SEMs and MDC
90 for each reliability analysis are expressed in conjunction with the ICCs in
Table 2,
Table 3 and
Table 4.
Study II: (Longitudinal study)
There was a statistically significant increase with respect to peak muscle force exertion between the two testing sessions, for both the PPT (
p < 0.00) and CCT (
p < 0.00) (
Figure 4). Furthermore, large effect size values (Cohen’s D), of 0.9 and 1.0, were reported for PPT and CCT, respectively (
Table 5).
4. Discussion
Study I: (validation study)
The purpose of the validation study was to determine the validity and reliability of two new proposed core strength field tests, using an HHD to evaluate the ability to produce force in challenging positions, representing core stability. The observed ICCs in this study suggest the excellent test–retest reliability of the Prone Plank Test (PPT) and the Closed Kinetic Chain Test (CCT) (see
Table 3 and
Table 4). The ICC is a measure of relative reliability indicating a measure’s ability to discriminate between existing differences among two sets of data. It is calculated by dividing the between-patient variance by the total variance [
17] (between-patient and within-patient variance). The present findings therefore suggest that the PPT and CCT demonstrated appropriate reliability for their use in the training field setting as a core strength functional evaluation.
The SEM provides an absolute measure of reliability with regard to the original test units, and can be used to estimate the error associated with an individual patient’s test score [
17,
26]. The smaller the SEM value, the more reliable the measurements [
17,
20]. In our study, the SEM ranged from 4.01 N to 13.50 N for intratester intrasession and intersession reliability analyses. The results found in our study correlate with a similar study accomplished by De Blaiser et al. [
10], in relation to intratester and intrasession reliability, who evaluated maximal isometric trunk flexion and extension strength tests using HHD on a healthy athletic population. They reported excellent intratester and intertester reliability values (ICC = 0.76–0.93) for all tests, except for the intratester reliability of the maximal isometric trunk flexion test starting at 0°, which was good (ICC = 0.67). The ICCs for the intertester and intrasession analysis in our study were lower than what they had found, probably because the testers from their study had similar physical characteristics, in order to counteract the participant’s force exertion. Another study conducted by Moreland et al. [
30] determined the intertester reliability of six tests of trunk muscle strength evaluation using practical measurement methods which could be applied in most clinical or work settings. For abdominal and back extensor isometric force tests using HHD, they reported poor (0.24 and 0.25, respectively) ICC values. These results contrast with those reported in our study, maybe because the rater’s ability to apply force could have been limited, as they argued. In a more recent study conducted by Recio et al. [
7], a flexion–extension isokinetic protocol was used to asses trunk muscle strength and endurance in a healthy and physically active population (1–3 h of moderate physical activity in recreational sports, 1–3 days a week). The ICC values obtained for the strength variables in this study ranged from 0.57 to 0.77 in extension, and from 0.62 to 0.84 in flexion, with low SEM values. Another study designed by Essendrop et al. [
31] evaluated the intratester reliability of isometric strength tests by using a HHD device in a workplace environment, and found excellent ICCs for back flexion and extension tests (0.97–0.93, respectively).
Two distinct methodologies have been traditionally used in sport science for strength evaluation: isokinetic testing or isometric HHD [
19]. Isokinetic dynamometers are computerized machines able to provide different variables of muscle strength (i.e., peak force, endurance, power, optimum angle of torque production, etc.). Isokinetic dynamometry is considered the “gold standard” for trunk muscle strength evaluation, mainly because it allows a controlled and accurate assessment of a large number of muscle force parameters, but the high technology requirements, as well as the time consumption, of these isokinetic protocols, along with their substantial economic cost, could limit the generalization of its use.
Alternatively, hand-held dynamometry (HHD) strength evaluation has been shown to be a reliable, objective way to obtain strength measurements [
23,
24,
25,
26]. HHD is a tool that can be placed between the practitioner’s hand and the tested body part of the athlete. Stark et al. [
22] recently demonstrated, in a systematic review, the moderate-to-good reliability and validity scores between the HHD vs. isokinetic testing procedures. Considering the cost of isokinetic testing devices and their logistical limitations for routine clinical testing purposes, the HHD could be considered a practical standard for muscle strength assessment in the training field or clinical setting. These results support those from our study, and enlarge the scientific verification of the use of HHD-based core strength evaluations in the field training arena, or the clinical setting itself, enabling clinicians to routinely perform quantitative and objective core body region strength evaluations on a science-based foundation. In the authors opinion, the employment of previously analyzed and validated tests, with adequate reliability and reproducibility, guarantees the internal methodological quality standards that this kind of in-the-field performed test have to demonstrate in order to ensure the appropriate extrapolation of these evaluation methodologies. Moreover, a robust validation process can also enable different researchers in the development of these routines and result interpretations.
Study II: (longitudinal study)
The purpose of the study was to determine whether these preliminary validated tests (PPT and CCT) would be able to detect changes in the force application capacities of professional football players after the implementation of a motor control-based core stability training program.
We found a significant improvement in the measured core strength values (PPT and CCT tests) after the core stability training program was implemented. The original result obtained from this longitudinal study was that participants were able to produce higher strength values in spite of the fact that the progression criteria were core neuromuscular control challenge-based, instead of being based on traditional resistance progression criteria. In fact, neuromuscular control training for athletes has traditionally been focused on resistance exercises for trunk musculature. However, these types of core training programs could not only lead to excessive applications of mechanical loads to the spine, but they can also fail to satisfy the biomechanical stabilization requirements necessary to counteract the acting internal and external forces during athletic maneuvers [
30,
31]. Even so, previous studies using non-elite or sub-elite instead of elite subjects have clearly demonstrated the effectiveness of core stabilization programs in improving core strength when compared with no or regular training only [
32,
33]. Regarding the literature available, it is difficult to find longitudinal studies recruiting elite professional football players due to the inability to have a control group and the high level competitive demand that often challenges this type of scientific effort.
A weak core body region has been linked with alterations in the transfer of energy throughout the whole kinetic chain, potentially resulting in reduced sport performance and increased injury risk [
2,
15,
34]. As a result, the implementation of a core strength training program has become popular in sport and clinical settings as a means to improve performance and reduce injury risk. Several studies have examined the effects of improving core-related strength following a core training program, finding a wide variety of results. Similarly, few studies have analyzed the possible relationship between core strength and sport-performance, concluding that if founded, the correlations were weak to moderate [
31,
34,
35,
36]. One of the main sources that could explain the inconsistency of these results could involve the methodology used to measure the core strength. Most of the studies followed McGill testing protocol-derived methods. These studies, despite demonstrating excellent test–retest reliability, seem to be more related to trunk muscle endurance capacity, rather than being focused on the more functional and faster movements demands that most multi-directional sports seem to require [
35].
Furthermore, in the present study, we found that those players displaying a limb symmetry index greater than 15% (described in the literature as the maximum physiological difference) displayed a trend toward the equalization of the observed deficit at the end of the season. In contrast, players reporting more symmetric limb-to-limb values at baseline significatively improved their performance in the tests at the end of the season. Whether this fact could be linked to both injury risk reduction and/or athletic performance enhancement should be appropriately addressed in future studies.
The present study had several limitations. The first is associated with the use of the HHD, which has been demonstrated to reproduce some tester bias as the evaluator has to produce sufficient force to ensure the actual isometric contraction of the participant. As such, inadequate force application by the evaluator may lead to decreased intertester reliability [
23,
24]. To avoid or diminish this bias, both testing sessions (test 1 and test 2) were conducted by the same tester in the longitudinal study [
25]. Another limitation of HHD is that the force recorded by male and female testers is different. The female tester recorded lower values, as the subject could produce higher forces, and the force exerted by the same participant was different in the reports of different examiners [
23]. This finding can be verified in the Bland and Altman plots. In relation to the longitudinal study, the a priori effect size calculation showed the necessity of obtaining 27 players for a random error of 0.8. This fact highlighted the fact that the study was slightly underpowered. Furthermore, seven dropouts were registered in the post-intervention evaluations. However, the statistically significant improvements, as well as the large to very large effect sizes achieved from pre- to post-evaluation, may serve as a starting point for future adequately powered studies targeting this issue. Another limitation of this study could be that there was not a control group, but the lack of a control group is common in interventions among professional players, because leaving a player out of an intervention that could be beneficial is not recommended due to potential ethical objections.
Despite these limitations, in the authors’ opinion the HHD is easy to use, portable, inexpensive, and requires little training for proficient application. The present validation study revealed that the tester’s experience has little or no bearing on intratester reliability measures. However, greater participant strength values could produce weaker intertester reliability measures [
26,
37]. To avoid this error, one solution could be to couple the HHD device to a rigid customized device. In this manner, the subject would exert the force against a structure that it is not possible to move, ensuring an actual isometric contraction [
38].

 ,
, 


