Experimental Study of Forced Convective Heat Transfer in a Coiled Flow Inverter Using TiO2–Water Nanofluids


Tecnologico de Monterrey, Escuela de Ingeniería y Ciencias, Ave. Eugenio Garza Sada 2501, Monterrey 64849, Mexico
*
Author to whom correspondence should be addressed.
Appl. Sci. 2020, 10(15), 5225; https://doi.org/10.3390/app10155225
Submission received: 6 July 2020
/
Revised: 23 July 2020
/
Accepted: 26 July 2020
/
Published: 29 July 2020
(This article belongs to the Special Issue Nanofluids Application in Heat Transfer)
Abstract
:The curved geometry of a coiled flow inverter (CFI) promotes chaotic mixing through a combination of coils and bends. Besides the heat exchanger geometry, the heat transfer can be enhanced by improving the thermophysical properties of the working fluid. In this work, aqueous solutions of dispersed TiO2 nanometer-sized particles (i.e., nanofluids) were prepared and characterized, and their effects on heat transfer were experimentally investigated in a CFI heat exchanger inserted in a forced convective thermal loop. The physical and transport properties of the nanofluids were measured within the temperature and volume concentration domains. The convective heat transfer coefficients were obtained at Reynolds numbers (NRe) and TiO2 nanoparticle volume concentrations ranging from 1400 to 9500 and 0–1.5 v/v%, respectively. The Nusselt number (NNu) in the CFI containing 1.0 v/v% nanofluid was 41–52% higher than in the CFI containing pure base fluid (i.e., water), while the 1.5 v/v% nanofluid increased the NNu by 4–8% compared to water. Two new correlations to predict the NNu of TiO2–water nanofluids in the CFI at Reynolds numbers of 1400 ≤ NRe ≤ 9500 and nanoparticle volume concentrations ranges of 0.2–1.0 v/v% and 0.2–1.5 v/v% are proposed.
1. Introduction
Heat exchangers play a vital role in a wide range of industries, such as the pharmaceutical, food and beverage, chemical, petrochemical, oil and gas, power generation, HVAC-R (heating, ventilation, air conditioning, and refrigeration), and other fields. The processes involved may require either streams at specific operation temperatures, the removal/addition of heats of reaction, mixing, adsorption, etc., or the unit operations for drying, boiling, and condensing, among other steps. Industry-specific requirements have led to the development of enhanced heat exchangers capable of transporting high heat fluxes without compromising on practical sizing aspects.
With regard to passive and active heat transfer enhancement techniques [1], the former are commonly used due to their lower cost, their relatively easy implementation, and their longer operating life [2]. The improvement of the thermophysical properties of working fluids, as a passive enhancement technique, offsets the low thermal property of conventional heat transfer fluids (e.g., water, ethylene glycol, and engine oil). In 1995, Choi and Eastman [3] proposed a novel class of engineered heat transfer fluids called nanofluids (NFs), in which nanometer-sized particles of materials with high thermal conductivity are dispersed in a base fluid. Many researchers have experimentally determined the thermal conductivity () of different NFs with typical volume concentrations in the 0.5–4.0 v/v% range. In general, k is 15–40% higher in NFs than in pure base fluids [4]. Stable and highly conductive NFs can overcome the low limitations of conventional heat transfer fluids in heat exchangers. Various NFs have been numerically, analytically, and experimentally studied in diverse types of existing heat exchangers, as is exemplified next.
Fotukian and Esfahany [5] studied Al2O3–water (W) NFs in a circular tube, and their experiments showed that the convective heat transfer coefficient was increased by as much as 48% compared to pure water for volume concentrations lower than 0.2 v/v%. Ravi Kumar et al. [6] carried out experiments with Fe3O4–W NFs at volume concentrations of up to 0.06 v/v% in a double-tube heat exchanger, finding that the Nusselt number () increased by 14.7% using the maximum concentration when in a base fluid. Qi et al. [7] investigated the performance of TiO2–W NFs in a double-tube heat exchanger. It was found that NFs, at weight concentrations of 0.1, 0.3, and 0.5 w/w%, increased the heat transfer rate by 10.8%, 13.4%, and 14.8%, respectively. Kumar and Sonawane [8] used a shell and tube heat exchanger (STHE) to experiment with Fe2O3–W and Fe2O3–ethylene glycol (EG) NFs. They found that with an increasing nanoparticle (NP) volume concentration up to 0.08 v/v%, both and the overall heat transfer coefficient () were increased with respect to the base fluid. Shahrul et al. [9] performed numerical studies in an STHE using water-based NFs with ZnO, CuO, Fe3O4, TiO2, and Al2O3 NPs at 0.3 v/v%. By comparing the performance when using pure water, was increased by 31% and 43% for the ZnO–W and Al2O3–W NFs (the minimum and maximum observed increases), respectively. Kumar et al. [10] used a plate and frame heat exchanger (PHE) to study TiO2, Al2O3, ZnO, CeO2, hybrid (Cu+Al2O3), graphene nanoplate (GNP), and multi-walled carbon nanotube (MWCNT) NPs dispersed in water as the base fluid while varying the spacing between the plataes. They found an increase by as much as 53% in at 0.75 v/v% for the MWCNT–W NF compared to pure water. Behrangzade et al. [11] tested Ag–W NFs at 100 ppm in a PHE. They found an increase of up to 16.78% in with respect to the base fluid. Khoshvaght-Aliabadi et al. [12] experimented on a plate–fin heat exchanger using Al2O3–W NFs, and reported an increase in ranging from 9% to 15% at a weight concentration of 0.1 w/w%. Strandberg and Das [13] used a mathematical model to analyze a finned tube heat exchanger using EG–W (60:40 w/w%) as the base fluid. The NPs considered were Al2O3 and CuO, which, at 4% volume, provided modeled results with an increase in heat transfer compared to the base fluid of 11.6% and 8.7%, respectively. Li and Kleinstreuer [14] chose a microchannel geometry to study the effect of NFs on heat transfer using computer simulation. They found that for CuO–W NFs at 1 and 4 v/v% the average enhancement of thermal performance was 15% and 20%, respectively, compared to the base fluid. Osman et al. [15] conducted experiments with Al2O3–W NFs at 0.3, 0.5, and 1 v/v% in a rectangular minichannel, and the results showed up to a 54% enhancement for the NF at 1 v/v%.
Besides the improvement in , the passive enhancement technique with tube curving has been widely used due to its compactness and high heat transfer coefficient produced by the pattern of secondary flows (i.e., Dean vortices). This secondary heat transport superimposed on the main axial flow dominates the overall process, achieving a higher heat transfer rate per unit of length than in straight tubes [16]. The use of NFs in helical coil heat exchangers has also proven advantageous in achieving heat transfer enhancement [17,18].
Although heat transport along curved paths exhibits superiority over straight geometries, as the streamlines of Dean vortices are closed curves, their fluid parcels do not mix. Thus, as the fluid parcels near the vortex centers do not approach the tube walls, the temperature fields are heterogeneous in the radial direction [19]. Perturbing the secondary flow in curved geometries by chaotic advection produces chaotic trajectories that enhance the mixing of the particles within the fluid [20]. Chaotic advection in curved ducts is produced by periodic changes in geometry, such as a rotating coil axis over defined segments. The coiled flow inverter (CFI) introduced by Saxena and Nigam [21] is a particular class of curved geometry that promotes chaotic mixing through a combination of coils and bends; the centrifugal forces acting on the secondary flow change direction at each equally spaced 90° bend along the length of a straight helical coiled tube. Their pioneering work reported a significant reduction of residence time distribution in the CFI geometry, and it was found that it exhibited up to a 20 times reduction in the dispersion number compared to that in a helical coil geometry.
Typically, bent coils are made up by four helical “arms” arranged in a square shape. These four-arm CFI units, which are used in different research fields, including heat transfer enhancement, are henceforth referred to as CFI sets.
Most of the experimental research in heat transfer characteristics for CFI sets has been performed using water as the working fluid. For instance, Kumar et al. [22] evaluated the flow dynamics and thermal performance in a heat exchanger similar to a shell and tube (STHE) with eight CFI sets on the tube side. The values of on the tube side were compared to those in a straight coiled geometry predicted by existing correlations. The CFI geometry increased the by 25% and 12% in the Reynolds number () ranges of 1000 << 10,000 and 10,000 << 16,000, respectively. Experimental data were fitted to develop correlations accordingly. Mandal et al. [23] compared the performance of the CFI heat exchanger used by Kumar et al. [22] with that of the conventional PHE and the STHE. The three devices were rated under equivalent heat transfer areas and process conditions. Based on the heat transfer results, the flow inside the CFI sets augmented the by 12–14%, relative to the flows in the STHE and PHE, and empirical correlations were obtained. Singh and Nigam [24] evaluated the heat transfer performances of three CFI heat exchangers containing one, two, or four CFI sets. The geometric features of the prototypes were similar to those of the heat exchanger evaluated by Kumar et al. [22]. Experiments were conducted predominantly under turbulent flow, and in the setup with one CFI set. the was up to 3.6 and 4.5 times higher, respectively, than that in the PHE and STHE obtained by Mandal et al. [23].
Numerical studies to investigate the transfer characteristics in CFI have also been conducted. Kumar and Nigam [25] characterized the hydrodynamics and forced convection in a CFI set, and compared them to those that occur in a straight coil configuration. Both scenarios were studied under laminar regime conditions, and the results revealed that the bent coil configuration (i.e., CFI set) showed a 20–30% enhancement in when compared to that of the straight coil. Kumar and Nigam [26] analyzed a comparable scenario to the previously referred one, except for the additional use of the condition of uniform heat flux at the wall. The values were 25–36% higher in coils with rather than without bends. Mridha and Nigam [27] studied the fluid flow and heat transfer characteristics in a CFI set under turbulent flow conditions. They numerically solved the three-dimensional differential governing equations of mass, momentum, and energy. The velocity and temperature profiles revealed that increasing the number of bends in the CFI set increased the uniformity of both secondary fields by radial mixing. In the simulation data, the heat transfer enhancement was 4–13% relative to a coiled tube without flow inversions.
The literature review reveals that only a few numerical investigations in curved geometries have studied the process of simultaneously integrating both passive heat transfer enhancement techniques, NFs, and chaotic advection. Singh et al. [28] numerically solved the governing equations of mass, momentum, and energy in straight tubes, straight helical coils, and a CFI set using Al2O3–W NFs at 1, 3, and 4 v/v% under laminar flow conditions. The computational values were compared with the experimental values in water reported by Kumar et al. [22]. Relative to the base fluid (i.e., water), the NFs at 1, 3, and 4 v/v% augmented the by 24%, 33%, and 42% in the CFI set and by 15%, 25%, and 35% in the straight helical coil, respectively. The superior heat transfer was attributed to chaotic mixing induced by flow inversion in the CFI set. Under the laminar regime, Tohidi et al. [29] numerically analyzed the hydrodynamics and heat transfer characteristics of Al2O3–W and CuO–W NFs at 1, 2, and 3 v/v% in a particular chaotic geometry. The chaotic configuration was created by assembling consecutive sections of two regular helical segments with different pitches, and internal flow inversion was generated by the geometrical perturbation at the bend of each helical segment. The results of the chaotic configuration were compared to those in the straight helical coil. The in the chaotic configuration was increased by 18%, 19%, and 21% for the Al2O3–W NFs at 1, 2, and 3 v/v% and by 18%, 21%, and 25% for the CuO–W NFs at the same concentrations, respectively.
To the best of our knowledge, an experimental study of forced convective heat transfer in a coiled flow inverter using NFs as the working fluid is yet to be seen in literature. Furthermore, extensive heat transfer research has focused on Al2O3–W and CuO–W systems [30], while in comparison, there are limited studies on TiO2–W systems. This paper addresses those two aspects. TiO2 NPs possess excellent physical and chemical properties, such as chemical stability, good dispersivity, and non-toxicity. In fact, TiO2 NPs exhibit better dispersion than other metal oxide NPs [31]. Hence, the present paper experimentally studies the forced convective heat transfer in a coiled flow inverter using TiO2–W NFs at volume concentrations of 0.2, 0.5, 1.0, and 1.5 v/v%. The flow rates are controlled to ensure flows with Reynolds numbers of 1400 ≤≤ 9500. Moreover, the physical and transport properties of the NFs are measured. Finally, new heat transfer correlations to predict the of the studied NFs are proposed.
2. Experimental Methodology
2.1. Preparation of the Nanofluids
The TiO2–W NFs were prepared from a 20 w/w% TiO2 nanopowder (30–50 nm) dispersion in water, provided by US Research Nanomaterials, Inc. (Houston, TX, USA), lot number: US707020180710. The characteristics of the NPs in this solution, hereafter referred to as the stock solution, are reported in Section 4.1. NF batches with TiO2 volume concentrations of 0.2, 0.5, 1.0, and 1.5 v/v% were prepared by adding deionized water to a total volume of 600 mL in each batch. The stock solution volume required to provide the total amount of TiO2 NPs in each NF batch included additional water and surfactant. The volumes of these two components were considered when calculating the amount of deionized water for each NF batch. All NFs were mixed by a high-speed stirrer, and then dispersed by ultrasonic vibration (Cole Parmer 500 W ultrasonic processor with probe model CV0034) at 40 kHz for approximately 1 h. Immediately after sonication, the thermophysical properties were measured (see Section 2.2) and the forced convective heat transfer studies were executed (see Section 2.4). No NP sedimentation was observed before or after each trial.
2.2. Characterization of the Nanofluids
The thermal conductivity (), dynamic viscosity (), density (), and specific heat capacity () of the prepared TiO2–W NFs were measured as functions of temperature and NP volume concentration. The was determined by the transient hot wire method using a KD2 Pro Thermal Analyzer (Decagon Devices Inc., Pullman, WA, USA). The single-needle sensor probe (model KS1, ±5% from 0.2–2 W m−1 °C−1) was calibrated with base fluid (i.e., deionized water) and glycerin before measuring each NF batch. The test temperatures (25, 35, and 45 °C) were achieved by immersing the sample in a 1 kW automatic heating bath circulator (setpoint ± 0.03 °C, model CORIO C-B27, Julabo Inc., Allentown, PA, USA). A 45 mL sample was taken and poured into a glass vial with a PTFE screw cap and a silicon pad. The KS1 sensor probe was inserted into the center of the vial, which was then immersed in the heating bath for 20 min. Each reported value of the thermal conductivity was obtained by averaging the results of five measurements. The experimental setup for measuring consisted of a cone-and-plate viscometer (model DV2TLVCP, ±1.0%, spindle: CPA-40Z, Brookfield Engineering Laboratories, Inc., Middleborough, MA, USA) and a circulating temperature bath (model TC150). The viscometer was calibrated by the manufacturer, and the calibration was validated by measuring deionized water prior to each NF testing. Measurements were performed at 25, 35, and 45 °C and replicated five times. Additional measurements were performed using a reverse-flow Cannon-Fenske viscometer (size 25) as a control. The was determined using glass hydrometers ranging from 0.9–1.0 and 1.0–1.1 with graduation marks in 0.000 (accuracy ± 0.10%). A sample of each NF was taken in a measuring cylinder and immersed in the heating bath utilized for the measurements. The test temperatures were 25, 35, and 45 °C. The hydrometer was immersed into each NF sample and the reading was taken after reaching thermal equilibrium. The observed readings were then corrected for each test temperature. The measurements were repeated at least once to verify the repeatability of the values. The was determined by differential scanning calorimetry (DSC) analysis (model DSC 3, measurement uncertainty ±3.5%, Mettler Toledo, Greifensee, CH) using the standard protocol ASTM E1269 [32]. A sapphire disk was used as reference material. The thermal cycle was as follows: Isothermal heating for 4 min at 20 °C, heating from 20 to 100 °C at 20 °C/min, isothermal heating for 4 min at 100 °C. The measurements were replicated at least twice for all samples, and the STARe software from Mettler Toledo was used for data analysis.
2.3. Characterization of the Nanoparticles
The size distribution, crystal phase, and morphology of the TiO2 NPs contained in the NFs were determined experimentally. The size distribution was determined by the dynamic light scattering (DLS) technique (model NanoBrook 90 Plus PALS, Brookhaven Instruments Co., Holtsville, NY, USA). The accuracy of the particle size measurements was corroborated on standard-sized polystyrene spheres with a diameter of 216 ± 4 nm (part number 3220A, Thermo Fisher Scientific, Waltham, MA, USA). For DLS analysis, the sample must be clear to slightly hazy. To achieve the required transparency, an aliquot from the stock solution was diluted to 1:1000, and then sonicated in a Branson 5800 ultrasonic bath for 1 h. The crystalline phase and the structural purity of the TiO2 NPs were determined by X-ray diffraction (XRD) on an Empyrean diffractometer (Malvern Panalytical, Worcestershire, UK). A powdered sample was obtained by drying 15 mL of stock solution at room temperature. The powder was ground and placed in a non-glass sample holder, and then the diffraction patterns were referenced to the ICSD database. The morphology of the NPs was determined by the scanning electronic microscopy (SEM) technique (model EVO MA25, Zeiss Microscopy, Munich, DE). The sample was prepared for SEM by depositing a droplet of the diluted solution used in the DLS measurements on a carbon film mounted on a specimen stub. The droplet was evaporated in a desiccator.
2.4. Measurements of the Convective Heat Transfer Coefficient
The forced convective thermal loop (Figure 1a,b) consisted of a hot and a cold section through which the working fluid circulates. The components in both sections were connected with flexible PVC tubing (Nalgene®, 5/16″ and 3/16″; Thermo Fisher Scientific Inc., Waltham, MA, USA). The flow lines were thermally insulated with a standard rubber tubular pipe insulator. The grip and seal on all PVC tubing connections were provided by worm drive clamps.
The hot section was constituted by the heating bath circulator utilized for the and measurements (see Section 2.2) operating at 70 °C, as well as the CFI test section, as shown in Figure 2. The CFI set was constructed from malleable copper tubing (wall thickness 0.030″ and ¼″; Mueller Industries, Memphis, TN, USA). The set consisted of four helical arms, each constituting four turns with a radius of curvature of 0.031 m (λ = 12.8) and a pitch of 0.01 m. The λ closely approximated the optimum value suggested by Vashisth and Nigam [33]. The tubing was bent to form a 90° angle between two consecutive arms. The approximate internal volume of the CFI set based on its dimensions (i.e., internal diameter and total length), was 0.064 L. The total volume of working fluid necessary to fill the whole circuit was 0.45 L.
The temperatures of the working fluids (i.e., deionized water and the NFs described in Section 2.1) were measured by 14 calibrated thermocouples (Type K, 0.5 mm, ±0.4%; OMEGA Engineering, Norwalk, CT, USA), placed as indicated in Figure 1a and Figure 2. The inlet and outlet temperatures of the working fluid in the CFI set were measured by thermocouples T0 and T13 in Figure 1a, respectively. The temperatures at the intermediate points along the test section (Figure 2) were recorded by 12 thermocouples inserted through the cooper tubing into approximately the centerline of the tube. These thermocouples were fixed with cyanoacrylate adhesive (Loctite® 401, Henkel, Rocky Hill, CT, USA), paste epoxy (PC-11®, PC-Products, Allentown, PA, USA), and conventional silicon sealant. All thermocouples were connected to a data logger (OMB-DAQ-56 and OMB-PDQ2, OMEGA Engineering, USA) for data acquisition.
The cold section consisted of three positive displacement pumps connected in parallel (two gear pumps (models PQ-12DC, Cole Parmer, USA) and a peristaltic pump (model Masterflex L/S Easy-Load II Head coupled with a Masterflex L/S Variable-Speed Drive, Cole Parmer, Vernon Hills, IL, USA)), a rotameter (0.2–1.9 L per minute (LPM), ±2% full scale; model H205B-005 Hedland, Budger Meter Inc., USA), a benchtop recirculating chiller (750 W at 0 °C; model LS51MX1A110C, Polyscience Inc., USA), a jacketed glass beaker (500 mL; model CG-1103-04, Chemglass Inc., Vineland, NJ, USA), and a helical section (six turns, radius of curvature = 0.063 m, and pitch = 0.02 m) made of the same copper tubing as the CFI set. The working fluid passed from the test section to the cooling loop through the helical section immersed in the chilled water. From there, it was received in the jacketed glass beaker, which served as the reservoir for discharge and suction (tap water was circulated through the jacket). Thus, the working fluid was suctioned and circulated through the test section by the pump system. The flow rate was manipulated by the analog speed controller of the peristaltic pump and the plug-in class-2 transformers implemented in the gear pumps. Five flow rates that provide values ranging from 1400 to 9500 were selected. The rotameter was calibrated for each working fluid. The temperature of the chilled water was adjusted to maintain the inlet temperature of the working fluid to the CFI set within a maximum variation of ±0.5 °C for all working fluids at the designated flow rate. Trials were conducted at least twice and all systems reached steady state. The temperatures of the heated bath water and the chilled working fluid were also recorded. The room temperature was maintained at 23 °C. Including start-up, stabilization, and steady-state operation, a trial lasted approximately 90 min on average. Table 1 summarizes the experimental conditions established in this study.
3. Calculations
In steady state, the overall heat transfer coefficient expressed in terms of the external heat transfer area () was computed by Equation (1):
where is the mass flow rate of the working fluid; and are the bulk fluid temperatures at the inlet and outlet of the test section (see Figure 1a), respectively, is the external surface area of the test section in direct contact with the heating bath water, and is the logarithmic mean temperature difference, defined as:
where and , and is the temperature of the heating bath water.
In the present CFI heat exchanger, the inverse of was the sum of three thermal resistances: Two convective resistances (one at the outer surface and the other at the inner surface of the tube) and a conductive resistance at the tube wall. The formula is given by Equation (3) [34]:
where and are the outer and inner convective heat transfer coefficients, respectively; and are the outer and inner diameters of the tube, respectively, and and are the thermal conductivity and the length of the tube in the test section, respectively.
Under the present experimental conditions and setup, the outer convective thermal resistance was considered to remain constant throughout all trials. Thus, the with deionized water as the working fluid was obtained at different inner flow rates by the widely accepted correlation of Kumar et al. [22], and was substituted in Equation (3). After computing by Equation (1), was obtained in each instance by rearranging Equation (3) and the average value was 2377 W m−2 °C−1. After determining , with NF as the working fluid was determined by solving Equation (1) for and substituting the result in Equation (3). This procedure was repeated for each inner flow rate, with at least one replicate.
The internal Nusselt number is given by Equation (4):
The accepted functional form of the Nusselt number for NF as the working fluid is [35]:
The values of the constant and the exponents , , and in Equation (5) were determined by least-squares regression analysis.
4. Results and Discussion
4.1. Nanoparticle Characterization by DLS, XRD, and SEM Analysis
Figure 3 shows the size distribution (i.e., intensity distribution) of the TiO2 NPs obtained in the DLS measurements. The average NP diameter was 46 nm. The crystal structure of these NPs was identified as rutile phase from the XRD pattern (Figure 4). The strong diffraction peaks at 27°, 36°, and 55° correspond to the (1 1 0), (1 0 1), and (2 1 1) planes, respectively. All peaks are consistent with the standard spectrum of rutile TiO2 (ICSD 98-016-8138), indicating that no important impurities were present. The spherical shape of the NPs was confirmed by the SEM image (see Figure 5).
4.2. Nanofluid Characterization
The presence of dispersant in NFs plays a crucial role not only in terms of influencing their stability, but also their thermophysical properties. Moreover, two-component theoretical models to predict the physical and transport properties of NFs do not take into account the contribution of the dispersant [36]. Thus, the thermal conductivity (), dynamic viscosity (), density (), and specific heat capacity () of the prepared TiO2–W NFs were determined experimentally. The convective heat transfer coefficient in NFs depends on these thermophysical properties [37].
4.2.1. The Thermal Conductivity of the Nanofluids
Figure 6a clearly shows that the increases as the TiO2 NP volume concentration of the NFs increases, as well as temperature. This trend confirms that the addition of TiO2 NPs to the base fluid (i.e., deionized water) increases the thermal conductivity of the resulting TiO2–W NFs. Over the test temperature range, the NFs containing 1.5 and 0.2 v/v% TiO2 NPs exhibited an enhancement in thermal conductivity of 11–12% and 4–7%, respectively, compared to the base fluid. Figure 6a also shows the nonlinear dependence of the on the NP volume concentration. This behavior was observed in the experimental data obtained at 25, 35, and 45 °C. In addition to this, Figure 6b compares the experimental data on the effective thermal conductivity obtained at 35 °C with the predictions obtained by two of the classical models. These models are defined as follows:
The Maxwell [38] model,
The Hamilton and Crosser (H–C) [39] model,
where is the empirical shape factor, which is defined as , with for spherical NPs, and are the thermal conductivities of the base fluid and the NPs, respectively, and ϕ is the NP volume fraction in the NFs.
Classical models of the effective thermal conductivity of two-component materials, such as those expressed in Equations (6) and (7), typically predict a linear dependence on the NP volume concentration. However, the TiO2–W NFs used in this study proved not to follow this trend after experimental measurements, as evidenced in Figure 6b. It can be seen that the measurements are significantly greater than those predicted by the Maxwell and H–C models (both model predictions overlap). Also, the measured nonlinear dependence differs from that of the Wasp [40] model, the Bruggeman [41] model, and the effective medium theory [42]. Nevertheless, the nonlinear behavior obtained in the measurements is similar to that reported by Murshed et al. [43].
4.2.2. The Dynamic Viscosity of the Nanofluids
Figure 7a shows the dependance of the on the NP volume concentration and the temperature of the NFs. It can be seen that the NF dynamic viscosity appreciably increases over the base fluid with an increase in the NP volume concentration. At 35 °C, the increase in the dynamic viscosity of the NFs containing 0.2, 0.5, 1.0, and 1.5 v/v% NPs is 14%, 16%, 17%, and 22%, respectively, compared to the base fluid. Figure 7a also indicates that the decreases as the temperature increases, as is the case for a wide class of working fluids. From 25 to 45 °C, decreases by 26% for the NF at 0.2 v/v%, 27% for the NF at 0.5 v/v%, and 27% for the NFs at 1.0 and 1.5 v/v%.
4.2.3. The Density of the Nanofluids
Figure 8a shows the measured density of the water and the 0.2, 0.5, 1.0, and 1.5 v/v% NFs at test temperatures ranging from 25 to 45 °C. At 35 °C, NFs with NP volume concentrations of 0.2 and 1.5 v/v% see an increase in density of 0.1% and 2.7% compared to the base fluid (i.e., water), respectively. Figure 8a also shows that decreases with the increase in temperature. From 25 to 45 °C, the density decreases by 0.3% for the NF at 0.2 v/v%, 0.6% for the NFs at 0.5 and 1.0 v/v%, and 0.4% for the NF at 1.5 v/v%. For comparison, Figure 8b depicts the measured data at 35 °C and that predicted by the principle of mixture rule [48], defined as:
where ϕ is the NP volume fraction in the NF, is the density of the base fluid, and is the density of the NPs.
4.2.4. The Specific Heat Capacity of the Nanofluids
Figure 9a depicts the measured specific heat capacity of the NFs as a function of temperature and NP volume concentration. From this figure, it is evident that decreases as the volume fraction of the NPs in the NFs increases. The obtained results at 35 °C indicate that the decrements in the specific heat of the NFs at 0.2, 0.5, 1.0, and 1.5 v/v% are 0.7%, 2.4%, 3.1%, and 3.2%, respectively, compared to the base fluid. Figure 9a also indicates that the specific heat capacity of the NFs used in this study moderately increases with an increase in temperature. This experimental behavior was also observed by Vajjha and Das [50] in other metal oxide NFs.
Figure 9b shows a comparison between the measured data at 35 °C and that computed by the Xuan and Roetzel [51] model, which is defined as:
where ϕ is the volume fraction of the NPs, is the density of the NPs, is the specific heat capacity of the NPs, is the density of the base fluid, and is the specific heat capacity of the base fluid.
4.3. Forced Convective Heat Transfer Study
Figure 10 plots the experimentally determined of water and the four TiO2–W NFs with NP volume concentrations of 0.2, 0.5, 1.0, and 1.5 v/v% against . The flow regimes in the CFI can be identified by adopting the criteria used by Kumar and Nigam [26] for laminar flow conditions (22 ≤ < 1265) and that used by Mridha and Nigam [27] for turbulent regimes (10,000 ≤ < 30,000). As shown in Figure 10, the is an increasing function of , and is 41–52% higher in the NF containing 1.0 v/v% NPs than in the base fluid (i.e., water) for Reynolds numbers in the range of 6000 ≤ ≤ 9500. However, in the same range, the of the NF containing 1.5 v/v% NPs is 36–40% lower than that for NF at 1.0 v/v% TiO2 NPs, but 4–8% higher than in pure water. Moreover, in the 1400 ≤ < 6000 range, the TiO2 NFs do not noticeably enhance the heat transfer. The effect of adding TiO2 NPs is marginal in this flow region, for example, the NF containing 1.0 v/v% TiO2 NPs exhibits an enhancement on of 2–5% compared to the base fluid. In general, the heat transfer characteristics of all the tested working fluids are comparable over the 1400 ≤ < 6000 range. The reason behind this behavior is hypothesized to be associated with the fluid flow characteristics in that region. As the viscous forces are dominant at low , the boundary layer increases in thickness, leading to a negligible enhancement of the heat transfer, despite the fact that the tested NFs have an enhanced thermal conductivity (compared to the base fluid), as discussed in Section 4.2.1. This may imply that, for the 1400 ≤ < 6000 range, the conductive resistance imposed by the boundary layer of the tested NFs outweighs their thermal benefits. When the increases, in addition to thinning of the boundary layer, the effect of flow inversion also becomes more significant as the homogenization of the temperature fields in the Dean vortices takes place, and hence, the increase in the occurs.
The greatest heat transfer enhancement was achieved by using the NF at 1.0 v/v% TiO2 NPs under 6000 ≤ ≤ 9500. The flow regime criteria based on the theoretical and simulation studies by Kumar and Nigam [26] and Mridha and Nigam [27] could suggest that this flow region corresponds to transitional flow. The behavior found in the NP volume concentration agrees with the results of Duangthongsuk and Wongwises [54] using TiO2–W NFs, who also reported maximal thermal performance at 1.0 v/v% TiO2 and a decline in performance at higher TiO2 concentrations. This NP concentration behavior on the heat transfer may be due to the combined effect on increasing both and . As evidenced in Figure 6 and Figure 7, increasing the volume fraction of the NPs in NFs increases and . As previously discussed, the may compromise the thermal benefits of NFs unless its increased can surpass the increased conductive resistance imposed by the boundary layer. From the experimental results, it is possible to infer that in the NF containing 1.5 v/v% TiO2 NPs, the increased effect overcomes the heat transfer enhancement. Conversely, in the 1.0 v/v% NF, the thermal conduction enhancement outweighs the dynamic flow effect, and this positive effect likely contributed to the intensified heat transfer phenomenon that occurred in the CFI test section.
Using the obtained experimental data, the following empirical correlation was derived to predict the internal of the TiO2–W NFs flowing in the CFI geometry using least-squares regression analysis.
Equation (12) is valid over the 0.002 ≤ ϕ ≤ 0.01 range of NP concentrations, the 1400 ≤ ≤ 9500 range of Reynolds numbers, the 4.5 ≤ ≤ 5.2 range of Prandtl numbers, and a curvature ratio of λ = 12.8. Note that Equation (12) excludes the effect of λ on , as λ remained unchanged throughout the present experiments.
In order to extend Equation (12) for the experimental data of the NF containing 1.5 v/v% TiO2 NPs (ϕ = 0.015) and also to take into consideration the CFI curvature ratio (λ), the approach reported by Yang et al. [55] was adapted from the relationship proposed by Kumar et al. [22] and the following correlation was obtained:
where is the Peclet number, is the NP concentration enhancement limit for the present study ( = 0.015), and the constants , , and are determined by nonlinear regression with tolerance and convergence of 5% and 0.0001, respectively. The analysis results are listed in Table 2.
Equation (13) is then valid over the 0.002 ≤ ϕ ≤ 0.015 range of NP concentrations, the λ 10 values of the curvature ratio, the 1400 ≤ ≤ 9500 range of Reynolds numbers, and the 4.5 ≤ ≤ 5.2 range of Prandtl numbers.
Figure 11a,b shows the deviation of the predicted by the two proposed correlations, Equations (12) and (13), from the experimental data, respectively. As observed by the lines projected from the central line representing the perfect fit, the maximum deviation was approximately ±10% for both correlations. The predicted values of the NF with 1.5 v/v% NPs shown in Figure 11a are displayed for reference only, as Equation (12) is exclusively valid for NP concentrations from 0.2 to 1.0 v/v%. The fitting is of sufficient quality for obtaining the correlations from the cumulative experimental data.
Figure 12 compares the of the present experimental data and that obtained by the proposed correlations, Equation (12) (Figure 12a–a.iv), and Equation (13) (Figure 12b–b.iv). The plots are consistent for the TiO2 NP concentrations at which the correlations are valid: 0.2–1.0 v/v% for Equation (12) (see Figure 12a.ii–a.iv) and 0.2–1.5 v/v% for Equation (13) (see Figure 12b.i–b.iv). The data of the NF with 1.5 v/v% NPs shown in Figure 12a.i are included to confirm that Equation (12) is exclusively valid for NP concentrations of up to 1.0 v/v%, as previously established. At any given within the range of this study, increasing the NP concentration (up to 1.0 v/v%) increased the predicted . At 1.5 v/v% this trend was reversed by a drastic drop in the experimental results (see Figure 12a,b), indicating the development of complex flow and heat transfer behavior (as already discussed). This particular behavior is accurately captured by Equation (13). For values below 6000 the was relatively insensitive to NP concentration. In fact, the results of pure water (see Figure 10) indicate that within this range, the heat transfer was not obviously enhanced by adding NPs to the base fluid, as discussed before. The proposed correlations also capture this behavior over the 1400 ≤ ≤ 6000 range of Reynolds numbers for ranges of NP concentrations of 0.2–1.0 v/v% (see Figure 12a.ii–a.iv) and 0.2–1.5 v/v% (see Figure 12b.i–b.iv) as predicted by Equations (12) and (13), respectively.
Figure 13 plots the ratio as a function of , which, in contrast to Figure 12, does not require average values of for each NP concentration. Moreover, as both and were readily obtained in the experiments, the proposed correlations can be better compared with the experimental results in Figure 13 than in Figure 12. Consistent with the earlier comparison, the agreement is high at NP concentrations of 0.2, 0.5, and 1.0 v/v% for Equation (12) (see Figure 13a.ii–a.iv) and at 0.2, 0.5, 1.0, and 1.5 v/v% for Equation (13) (see Figure 13b.i–b.iv). As the correlation expressed in Equation (13) extends to the NP concentration of 1.5 v/v%, the quality of agreement of the experimental and predicted values at this concentration is confirmed again (see Figure 13b.i). In contrast, Figure 13a.i validates the exclusion of this concentration from Equation (12).
The potential role that the CFI geometry may play in heat transfer enhancement when using TiO2–W NFs as working fluids was explored. To this end, the experimental values of the NF containing 1.0 v/v% NPs from the present study were contrasted with the convective heat transfer experimental results of the TiO2–W NFs in a straight tube and to water flowing in a helical coiled tube. For the horizontal straight tube case, the correlation of Duangthongsuk and Wongwises [54] was utilized, which is given below:
Equation (14) is valid for TiO2–W NFs with NP volume concentrations in the range of 0 and 1.0 v/v% and between 3000 and 18,000.
For the helical coil, the correlation derived by Shchukin [56] was used:
which is valid for water as the working fluid over the ranges of 26 < < 7000 and 6.2 < λ < 62.5.
Since the previous correlations (i.e., Equations (14) and (15)) can predict values for that might not necessarily coincide with those of actual experiments, the following analysis highlights only potential benefits of using a CFI. Hence, Figure 14 plots the versus the of the 1.0 v/v% TiO2–W NF obtained in the current experiments, along with the results computed by Equations (12)–(15). When > 5000, a possible thermal superiority is exhibited by the CFI scenario compared to the predictions for the straight tube and the helical coil. At the highest investigated (i.e., 9500), the seems to be 64% greater in the CFI scenario than in the straight tube for the same working fluid. Moreover, at this , the may be 62% higher than that in the helical coiled tube with water. For ≤ 5000, the three scenarios seem to provide similar performances.
4.4. Uncertainty Analysis
Following Taylor and Kuyatt [57], the uncertainty in a calculated quantity , which depends on the values of the measured quantities with their own uncertainties , is given by:
The uncertainties in calculated in this work varied from 7.1% to 13.9%.
5. Conclusions
This study experimentally investigated the forced convective heat transfer of TiO2–W NFs in a CFI. The effects of the NP concentrations and the flow Reynolds numbers on the heat transfer performance of NPs were evaluated. The following conclusions were obtained:
- ○
- Over particular ranges of NP volume concentrations and Reynolds numbers, the heat transfer was considerably higher in the proposed system than in the base fluid (i.e., water) flowing through the CFI and potentially superior than in water flowing in a helical coiled tube and TiO2–W NFs in a straight tube.
- ○
- NP volume concentrations of 0.2, 0.5, 1.0, and 1.5 v/v% were studied at Reynolds numbers ranging from 1400 to 9500. The heat transfer was enhanced in the 6000 ≤ ≤ 9500 and at all NP concentrations, except for 1.5 v/v%. At the latter concentration, it is theorized that the higher viscosity of the NF than that of the base fluid outweighed the thermal conductivity advantage of the NF.
- ○
- The most significant increase of the NF in the CFI was 41–52% relative to water, obtained for the 1.0 v/v% NF in the higher Reynolds number range (i.e., 6000 ≤ ≤ 9500). At lower Reynolds numbers (i.e., 1400 ≤ < 6000), the CFI geometry failed to enhance the heat transfer of the NFs (relative to water) at any concentration.
- ○
- From the experimental results of the TiO2–W NFs in the CFI, two new empirical equations for prediction were proposed. The correlations are valid in the 1400 ≤ ≤ 9500 range of Reynolds numbers, the 4.5 ≤ ≤ 5.2 range of Prandtl numbers, and NP volume fractions of 0.002 ≤ ϕ ≤ 0.010 and 0.002 ≤ ϕ ≤ 0.015. The latter was built using previous theoretical findings for CFI, and the enhancement was added considering the limiting effect of having excess NPs.
- ○
- The physical and transport properties of the TiO2–W NFs were measured experimentally in the concentration domain of 0.2–1.5 v/v% and with temperature varied from 25 to 45 °C. The experimental results indicated that the classical theoretical models to estimate the thermophysical properties of NFs do not accurately predict the data for the TiO2–W NFs used in this study.
This work should assist the determination of the flow ranges that will benefit from the CFI geometry and impose practical limits on the NP volume concentrations when enhancing the heat transfer is the objective. It also extends the state-of-the-art experimental methods for enhancing heat transfer in the CFI geometry to TiO2–W NFs as the working fluid, which is of great current interest. Finally, this work highlights the potential importance of chaotic advection in thermal mixing applications of TiO2–W NFs.
Author Contributions
Conceptualization, methodology, and supervision: J.L.L.-S. and A.J.G.-C. Investigation, visualization, and writing (original draft): B.A.-T. Data curation, formal analysis, resources, software, and writing (review and editing): B.A.-T., J.L.L-S., and A.J.G.-C. Validation: B.A.-T. and J.L.L-S. Funding acquisition and project administration: A.J.G.-C. All authors have read and agree to the published version of the manuscript.
Funding
This research was funded by Conacyt and SENER through the Sustainable Energy Fund, grant number CEMIE-Sol P09.
Acknowledgments
This work was supported by Tecnologico de Monterrey through the Energy and Climate Change Research Group and NOVUS initiative, and Conacyt and SENER through the Sustainable Energy Fund and CEMIE-Sol Project P09.
Conflicts of Interest
The authors declare no conflict of interest.
Nomenclature
| external surface area of heat exchange (m2) | |
| specific heat capacity (of working fluid) (J kg−1 °C−1) | |
| inner diameter of the tube (m) | |
| outer diameter of the tube (m) | |
| coil diameter (m) | |
| convective heat transfer coefficient (W m−2 °C−1) | |
| thermal conductivity (of working fluid) (W m−1 °C−1) | |
| thermal conductivity of the tube in the test section (W m−1 °C−1) | |
| length of the tube in the test section (m) | |
| mass flow rate of working fluid (kg s−1) | |
| empirical shape factor of nanoparticles | |
| Dean number | |
| Nusselt number | |
| Peclet number | |
| Prandtl number | |
| Reynolds number | |
| ppm | parts per million |
| heat transfer rate (W) | |
| bulk fluid temperature at the inlet (°C) | |
| – | bulk fluid temperatures at the intermediate points along the test section (°C) |
| bulk fluid temperature at the outlet (°C) | |
| temperature of the heating bath water (°C) | |
| temperature difference at the inlet (°C) | |
| temperature difference at the outlet (°C) | |
| logarithmic mean temperature difference (°C) | |
| overall heat transfer coefficient (W m−2 °C−1) | |
| uncertainty in a calculated quantity | |
| inlet velocity (m s−1) | |
| v/v% | volume percent concentration (%) |
| w/w% | weight percent concentration (%) |
| a measured quantity for Equation (16) | |
| uncertainty in a measured quantity |
Subscripts
| base fluid | |
| inner | |
| nanofluid | |
| nanoparticle | |
| outer |
Greek Symbols
| ,, | constants in Equation (13) |
| λ | curvature ratio |
| dynamic viscosity (kg m−1 s−1) | |
| density (kg m−3) | |
| ϕ | volume fraction of nanoparticles |
| nanoparticles volume fraction enhancement limit for the present study ( = 0.015) | |
| sphericity of nanoparticle |
Acronyms
| CFI | coiled flow inverter |
| DLS | dynamic light scattering |
| EG | ethylene glycol |
| GNP | graphene nanoplate |
| HVAC-R | heating, ventilation, air conditioning, and refrigeration |
| ICSD | inorganic crystal structure database |
| LPM | liters per minute |
| MWCNT | multi-walled carbon nanotube |
| NF(s) | nanofluid(s) |
| NP(s) | nanoparticle(s) |
| PALS | phase analysis light scattering |
| PHE | plate and frame heat exchanger |
| PTFE | polytetrafluoroethylene |
| PVC | polyvinyl chloride |
| SEM | scanning electronic microscopy |
| STHE | shell and tube heat exchanger |
| XRD | X-ray diffraction |
| W | water |
References
- Bergles, A.E. Techniques to enhance heat transfer. In Handbook of Heat Transfer, 3rd ed.; McGraw-Hill: New York, NY, USA, 1998; pp. 11.1–11.76. [Google Scholar]
- Sheikholeslami, M.; Gorji-Bandpy, M.; Ganji, D. Review of heat transfer enhancement methods: Focus on passive methods using swirl flow devices. Renew. Sustain. Energy Rev. 2015, 49, 444–469. [Google Scholar] [CrossRef]
- Choi, S.U.S. Enhancing thermal conductivity of fluid with nanoparticles. In Proceedings of the ASME International Mechanical Engineering Congress and Exposition, ASME, San Francisco, CA, USA, 12–17 November 1995; pp. 99–105. [Google Scholar]
- Yu, W.; France, D.M.; Routbort, J.L.; Choi, S.U.S. Review and Comparison of Nanofluid Thermal Conductivity and Heat Transfer Enhancements. Heat Transf. Eng. 2008, 29, 432–460. [Google Scholar] [CrossRef]
- Fotukian, S.M.; Esfahany, M.N. Experimental investigation of turbulent convective heat transfer of dilute γ-Al2O3/water nanofluid inside a circular tube. Int. J. Heat Fluid Flow 2010, 31, 606–612. [Google Scholar] [CrossRef]
- Ravi Kumar, N.T.; Bhramara, P.; Addis, B.M.; Sundar, L.S.; Singh, M.K.; Sousa, A.C.M. Heat transfer, friction factor and effectiveness analysis of Fe3O4/water nanofluid flow in a double pipe heat exchanger with return bend. Int. Commun. Heat Mass Transf. 2017, 81, 155–163. [Google Scholar] [CrossRef]
- Qi, C.; Luo, T.; Liu, M.; Fan, F.; Yan, Y. Experimental study on the flow and heat transfer characteristics of nanofluids in double-tube heat exchangers based on thermal efficiency assessment. Energy Convers. Manag. 2019, 197, 111877. [Google Scholar] [CrossRef]
- Kumar, N.; Sonawane, S.S. Experimental study of Fe2O3/water and Fe2O3/ethylene glycol nanofluid heat transfer enhancement in a shell and tube heat exchanger. Int. Commun. Heat Mass Transf. 2016, 78, 277–284. [Google Scholar] [CrossRef]
- Shahrul, I.M.; Mahbubul, I.M.; Saidur, R.; Khaleduzzaman, S.S.; Sabri, M.F.M.; Rahman, M.M. Effectiveness Study of a Shell and Tube Heat Exchanger Operated with Nanofluids at Different Mass Flow Rates. Numer. Heat Transfer Part A Appl. 2014, 65, 699–713. [Google Scholar] [CrossRef]
- Kumar, V.; Tiwari, A.K.; Ghosh, S.K. Effect of variable spacing on performance of plate heat exchanger using nanofluids. Energy 2016, 114, 1107–1119. [Google Scholar] [CrossRef]
- Behrangzade, A.; Heyhat, M. The effect of using nano-silver dispersed water based nanofluid as a passive method for energy efficiency enhancement in a plate heat exchanger. Appl. Therm. Eng. 2016, 102, 311–317. [Google Scholar] [CrossRef]
- Khoshvaght-Aliabadi, M.; Jafari, A.; Sartipzadeh, O.; Salami, M. Thermal–hydraulic performance of wavy plate-fin heat exchanger using passive techniques: Perforations, winglets, and nanofluids. Int. Commun. Heat Mass Transf. 2016, 78, 231–240. [Google Scholar] [CrossRef]
- Strandberg, R.; Das, D.K. Finned tube performance evaluation with nanofluids and conventional heat transfer fluids. Int. J. Therm. Sci. 2010, 49, 580–588. [Google Scholar] [CrossRef]
- Li, J.; Kleinstreuer, C. Thermal performance of nanofluid flow in microchannels. Int. J. Heat Fluid Flow 2008, 29, 1221–1232. [Google Scholar] [CrossRef]
- Osman, S.; Sharifpur, M.; Meyer, J.P. International Journal of Heat and Mass Transfer Experimental investigation of convection heat transfer in the transition flow regime of aluminium oxide-water nanofluids in a rectangular channel. Int. J. Heat Mass Transf. 2019, 133, 895–902. [Google Scholar] [CrossRef] [Green Version]
- Rainieri, S.; Bozzoli, F.; Cattani, L.; Pagliarini, G. Compound convective heat transfer enhancement in helically coiled wall corrugated tubes. Int. J. Heat Mass Transf. 2013, 59, 353–362. [Google Scholar] [CrossRef]
- Srinivas, T.; Vinod, A.V. Heat transfer intensification in a shell and helical coil heat exchanger using water-based nanofluids. Chem. Eng. Process. Process Intensif. 2016, 102, 1–8. [Google Scholar] [CrossRef]
- Bahrehmand, S.; Abbassi, A.; Bahremand, H. Heat transfer and performance analysis of nanofluid flow in helically coiled tube heat exchangers. Chem. Eng. Res. Des. 2016, 109, 628–637. [Google Scholar] [CrossRef]
- Mokrani, A.; Castelain, C.; Peerhossaini, H. The effects of chaotic advection on heat transfer. Int. J. Heat Mass Transf. 1997, 40, 3089–3104. [Google Scholar] [CrossRef]
- Acharya, N.; Sen, M.; Hsueh-Chia, C. Heat transfer enhancement in coiled tubes by chaotic mixing. Int. J. Heat Mass Transf. 1992, 35, 2475–2489. [Google Scholar] [CrossRef]
- Saxena, A.K.; Nigam, K.D.P. Coiled configuration for flow inversion and its effect on residence time distribution. AIChE J. 1984, 30, 363–368. [Google Scholar] [CrossRef]
- Kumar, V.; Mridha, M.; Gupta, A.; Nigam, K.D. Coiled flow inverter as a heat exchanger. Chem. Eng. Sci. 2007, 62, 2386–2396. [Google Scholar] [CrossRef]
- Mandal, M.; Kumar, V.; Nigam, K. Augmentation of heat transfer performance in coiled flow inverter vis-à-vis conventional heat exchanger. Chem. Eng. Sci. 2010, 65, 999–1007. [Google Scholar] [CrossRef]
- Singh, J.; Nigam, K. Pilot plant study for effective heat transfer area of coiled flow inverter. Chem. Eng. Process. Process Intensif. 2016, 102, 219–228. [Google Scholar] [CrossRef]
- Kumar, V.; Nigam, K. Numerical simulation of steady flow fields in coiled flow inverter. Int. J. Heat Mass Transf. 2005, 48, 4811–4828. [Google Scholar] [CrossRef]
- Kumar, V.; Nigam, K. Laminar convective heat transfer in chaotic configuration. Int. J. Heat Mass Transf. 2007, 50, 2469–2479. [Google Scholar] [CrossRef]
- Mridha, M.; Nigam, K. Numerical study of turbulent forced convection in coiled flow inverter. Chem. Eng. Process. Process Intensif. 2008, 47, 893–905. [Google Scholar] [CrossRef]
- Singh, J.; Choudhary, N.; Nigam, K.D. The thermal and transport characteristics of nanofluids in a novel three-dimensional device. Can. J. Chem. Eng. 2014, 92, 2185–2201. [Google Scholar] [CrossRef]
- Tohidi, A.; Ghaffari, H.; Nasibi, H.; Mujumdar, A. Heat transfer enhancement by combination of chaotic advection and nanofluids flow in helically coiled tube. Appl. Therm. Eng. 2015, 86, 91–105. [Google Scholar] [CrossRef] [Green Version]
- Bashirnezhad, K.; Ghavami, M.; Alrashed, A.A. Experimental investigations of nanofluids convective heat transfer in different flow regimes: A review. J. Mol. Liq. 2017, 244, 309–321. [Google Scholar] [CrossRef]
- Yang, L.; Hu, Y. Toward TiO2 Nanofluids—Part 1: Preparation and Properties. Nanoscale Res. Lett. 2017, 12, 417. [Google Scholar] [CrossRef] [Green Version]
- ASTM E1269-11. Standard Test Method for Determining Specific Heat Capacity by Differential Scanning Calorimetry; ASTM International: West Conshohocken, PA, USA, 2011. [Google Scholar]
- Vashisth, S.; Nigam, K. Experimental investigation of void fraction and flow patterns in coiled flow inverter. Chem. Eng. Process. Process. Intensif. 2008, 47, 1281–1297. [Google Scholar] [CrossRef]
- White, F.M. Heat Transfer, 1st ed.; Addison-Wesley Publishing Company Inc.: New York, NY, USA, 1984. [Google Scholar]
- Kakac, S.; Yener, Y.; Pramuanjaroenkij, A. Enhancement of Convective Heat Transfer with Nanofluids. In Convective Heat Transfer, 3rd ed.; Taylor & Francis Group; CRC Press: Boca Raton, FL, USA, 2014; pp. 517–560. [Google Scholar]
- Qiu, L.; Zhu, N.; Feng, Y.; Michaelides, E.E.; Żyła, G.; Jing, D.; Zhang, X.; Norris, P.M.; Markides, C.N.; Mahian, O. A review of recent advances in thermophysical properties at the nanoscale: From solid state to colloids. Phys. Rep. 2020, 843, 1–81. [Google Scholar] [CrossRef]
- Viswanatha, K.; Seshu, S.; Vandrangi, K.; Snoussi, L. Influence of nanofluid properties on turbulent forced convection heat transfer in different base liquids. Math. Methods Appl. Sci. 2020, 1–22. [Google Scholar] [CrossRef]
- Maxwell, J.C. A Treatise on Electricity and Magnetism, 2nd ed.; Oxford Univ. Press: Oxford, UK, 1904. [Google Scholar]
- Hamilton, R.L.; Crosser, O.K. Thermal Conductivity of Heterogeneous Two-Component Systems. Ind. Eng. Chem. Fundam. 1962, 1, 187–191. [Google Scholar] [CrossRef]
- Wasp, E.J. Solid-Liquid Flow Slurry Pipeline Transportation; Trans. Tech Publications: Berlin, Germany, 1977. [Google Scholar]
- Bruggeman, D.A.G. Berechnung verschiedener physikalischer kkonstanten von heterogenen ssubstanzen. Ann. Phys. 1935, 24, 636–664. [Google Scholar] [CrossRef]
- Timofeeva, E.V.; Gavrilov, A.N.; McCloskey, J.M.; Tolmachev, Y.; Sprunt, S.; Lopatina, L.M.; Selinger, J.V. Thermal conductivity and particle agglomeration in alumina nanofluids: Experiment and theory. Phys. Rev. E 2007, 76, 061203. [Google Scholar] [CrossRef] [PubMed] [Green Version]
- Murshed, S.M.S.; Leong, K.C.; Yang, C. Enhanced thermal conductivity of TiO2—Water based nanofluids. Int. J. Therm. Sci. 2005, 44, 367–373. [Google Scholar] [CrossRef]
- Einstein, A. Calculation of the viscosity-coefficient of a liquid in which a large number of small spheres are suspended in irregular distribution. Ann. Phys. 1906, 324, 289–306. [Google Scholar] [CrossRef] [Green Version]
- Brinkman, H. The viscosity of concentrated suspensions and solutions. J. Chem. Phys. 1952, 20, 571–581. [Google Scholar] [CrossRef]
- He, Y.; Jin, Y.; Chen, H.; Ding, Y.; Cang, D.; Lu, H. Heat transfer and flow behaviour of aqueous suspensions of TiO2 nanoparticles (nanofluids) flowing upward through a vertical pipe. Int. J. Heat Mass Transf. 2007, 50, 2272–2281. [Google Scholar] [CrossRef]
- Murshed, S.M.S.; Leong, K.; Yang, C. Investigations of thermal conductivity and viscosity of nanofluids. Int. J. Therm. Sci. 2008, 47, 560–568. [Google Scholar] [CrossRef]
- Khanafer, K.; Vafai, K. A critical synthesis of thermophysical characteristics of nanofluids. Int. J. Heat Mass Transf. 2011, 54, 4410–4428. [Google Scholar] [CrossRef]
- Said, Z.M.; Sajid, H.; Kamyar, A.; Saidur, R. Experimental investigation on the stability and density of TiO2, Al2O3, SiO2 and TiSiO4. In Proceedings of the IOP Conference Series: Earth and Environmental Science (16), IOP Publishing Ltd., Putrajaya, Malaysia, 5–6 March 2013; p. 012002. [Google Scholar]
- Vajjha, R.; Das, K. Specific Heat Measurement of Three Nanofluids and Development of New Correlations. J. Heat Transf. 2009, 131, 071601. [Google Scholar] [CrossRef]
- Xuan, Y.; Roetzel, W. Conceptions for heat transfer correlation of nanofluids. Int. J. Heat Mass Transf. 2000, 43, 3701–3707. [Google Scholar] [CrossRef]
- Saeedinia, M.; Akhavan-Behabadi, M.A.; Razi, P. Thermal and rheological characteristics of CuO–Base oil nanofluid flow inside a circular tube. Int. Commun. Heat Mass Transf. 2012, 39, 152–159. [Google Scholar] [CrossRef]
- Akilu, S.; Baheta, A.T.; Sharma, K.V.; Said, M.A. Experimental determination of nanofluid specific heat with SiO2 nanoparticles in different base fluids. In Proceedings of the AIP Conference Proceedings (1877), American Institute of Physics Inc., Langkawi, Malaysia, 9–11 November 2016. 090001. [Google Scholar]
- Duangthongsuk, W.; Wongwises, S. An experimental study on the heat transfer performance and pressure drop of TiO2-water nanofluids flowing under a turbulent flow regime. Int. J. Heat Mass Transf. 2010, 53, 334–344. [Google Scholar] [CrossRef]
- Yang, Y.; Zhang, Z.G.; Grulke, E.A.; Anderson, W.B.; Wu, G. Heat transfer properties of nanoparticle-in-fluid dispersions (nanofluids) in laminar flow. Int. J. Heat Mass Transf. 2005, 48, 1107–1116. [Google Scholar] [CrossRef]
- Shchukin, V.K. Correlation for experimental data on heat transfer in curved pipes. Therm. Eng. 1969, 16, 72–76. [Google Scholar]
- Taylor, B.N.; Kuyatt, C.E. Guidelines for Evaluating and Expressing the Uncertainty of NIST Measurement Results; National Institute of Standards and Technology Technical Note 1297; National Institute of Standards and Technology: Gaithersburg, MD, USA, 1994.
Figure 1.
(a) Schematic of the experimental test rig. (b) Photograph of the experimental setup.
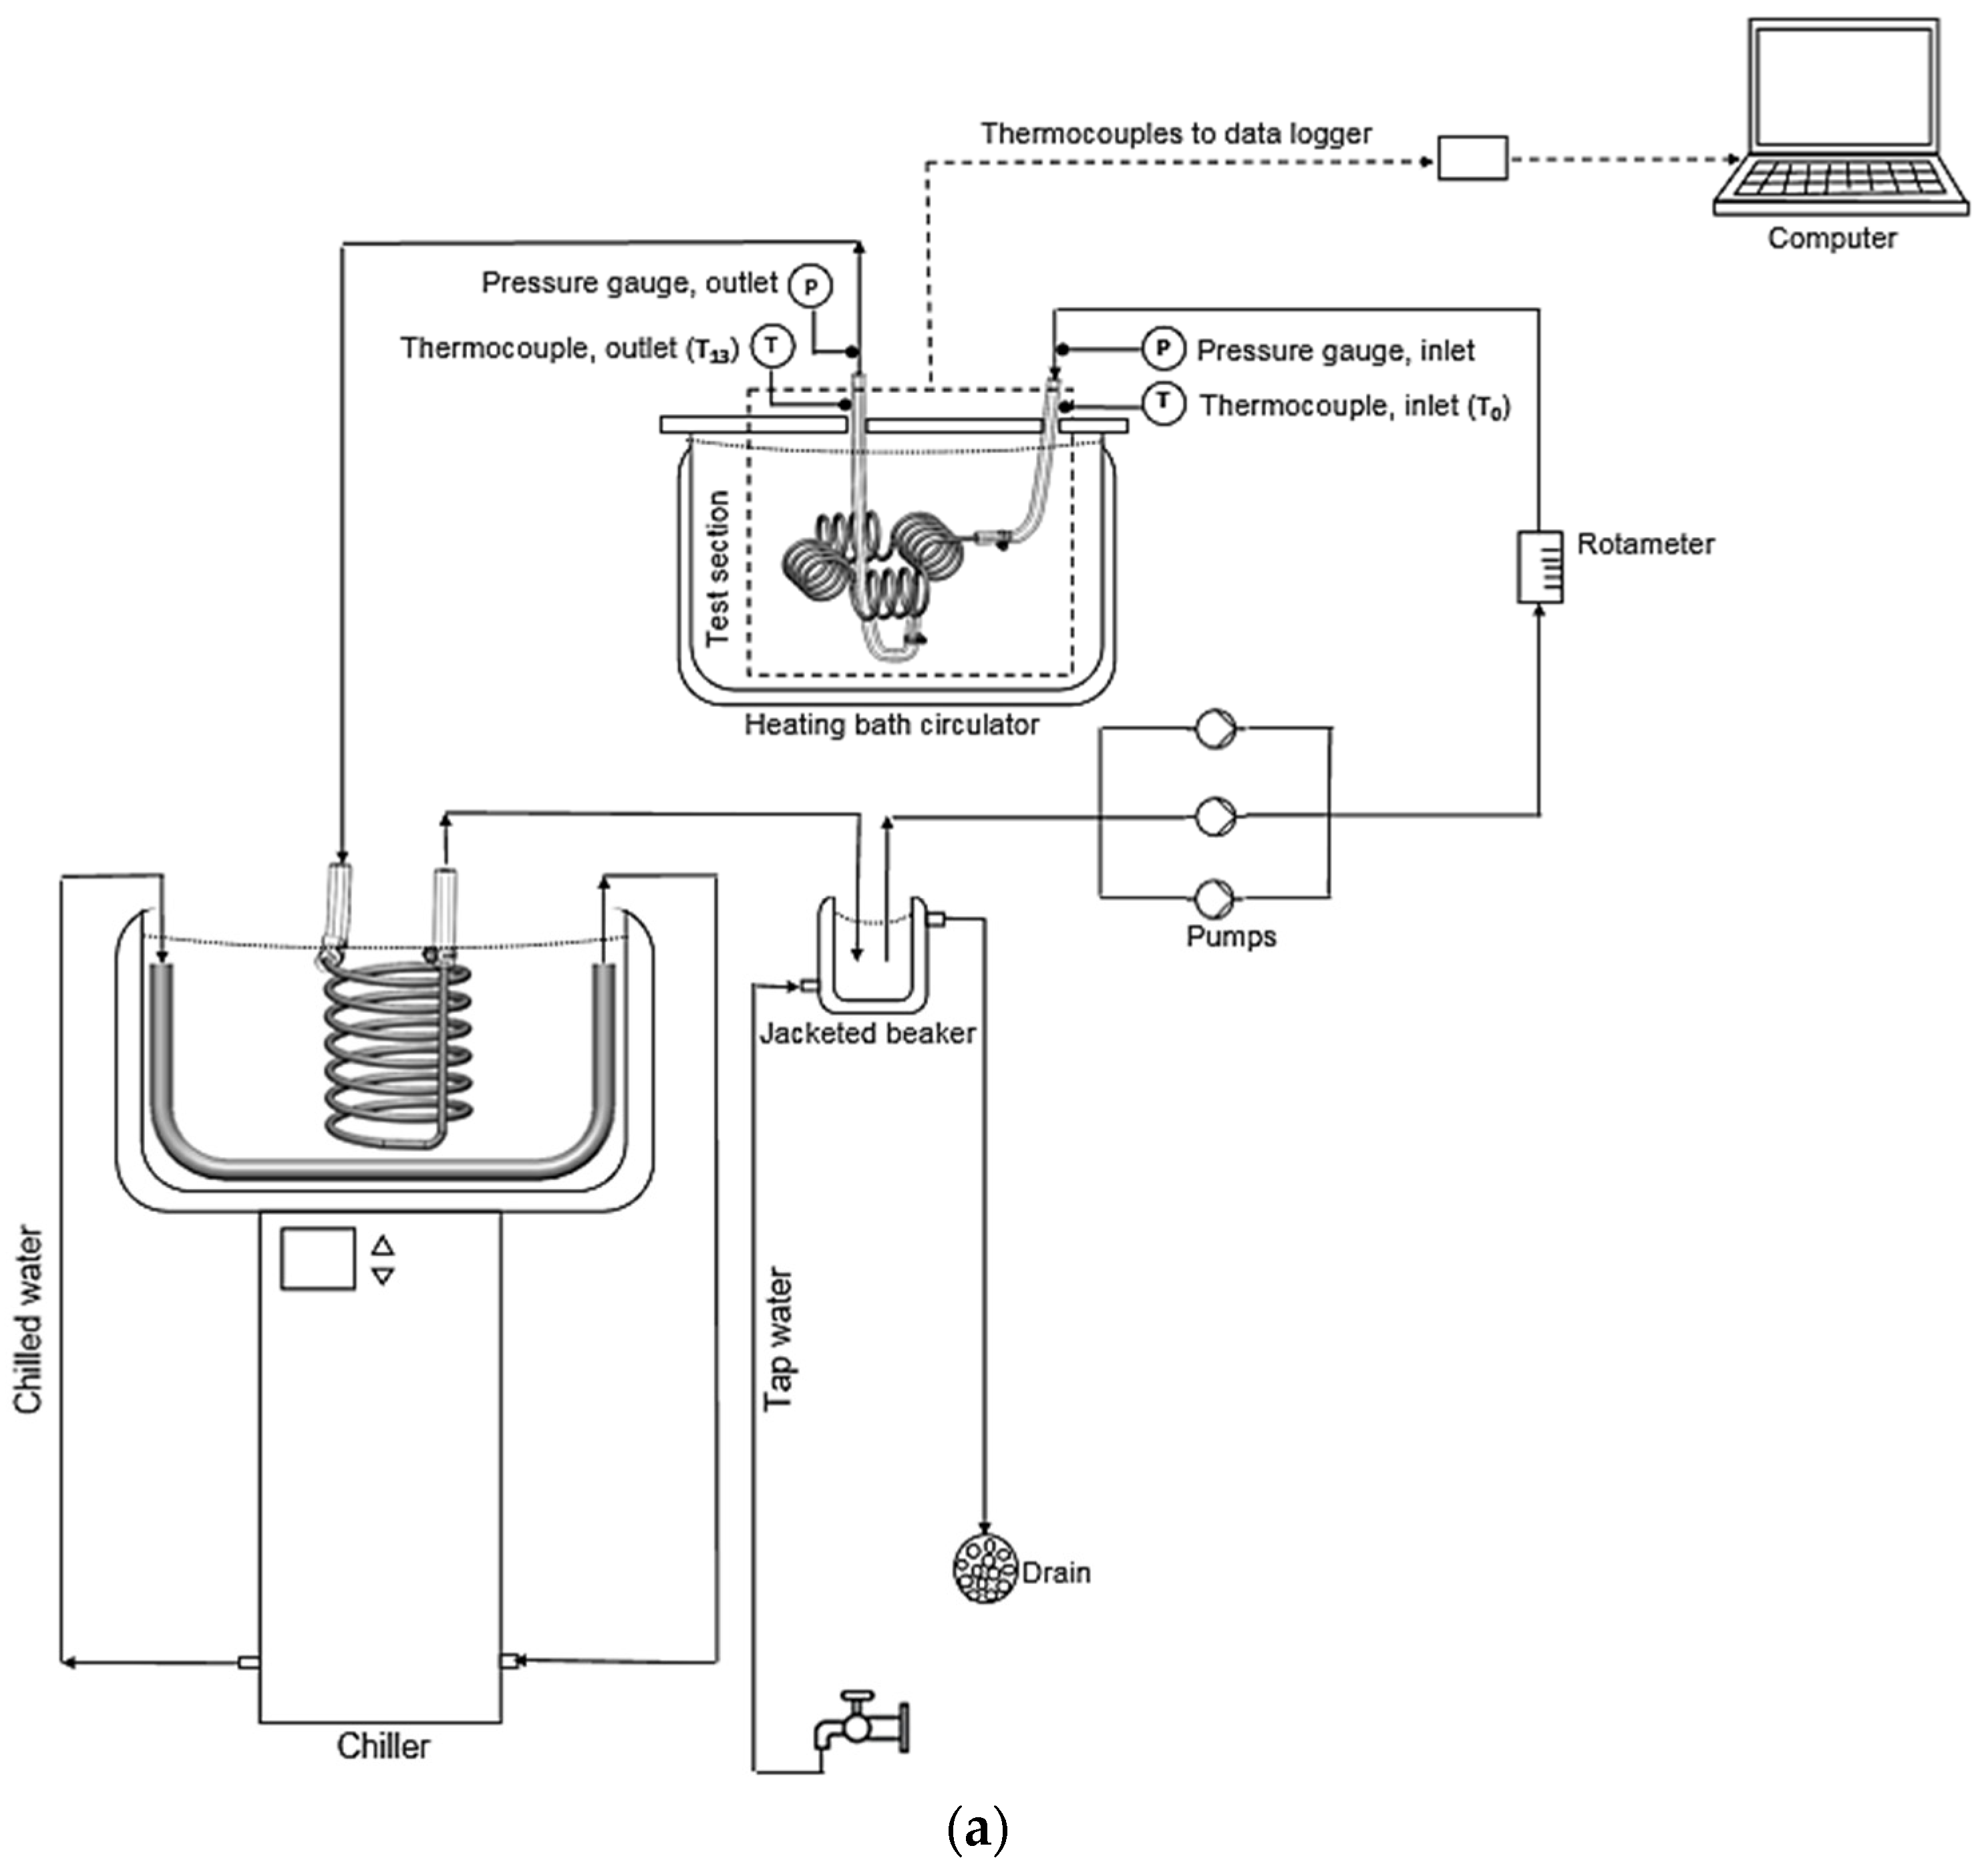
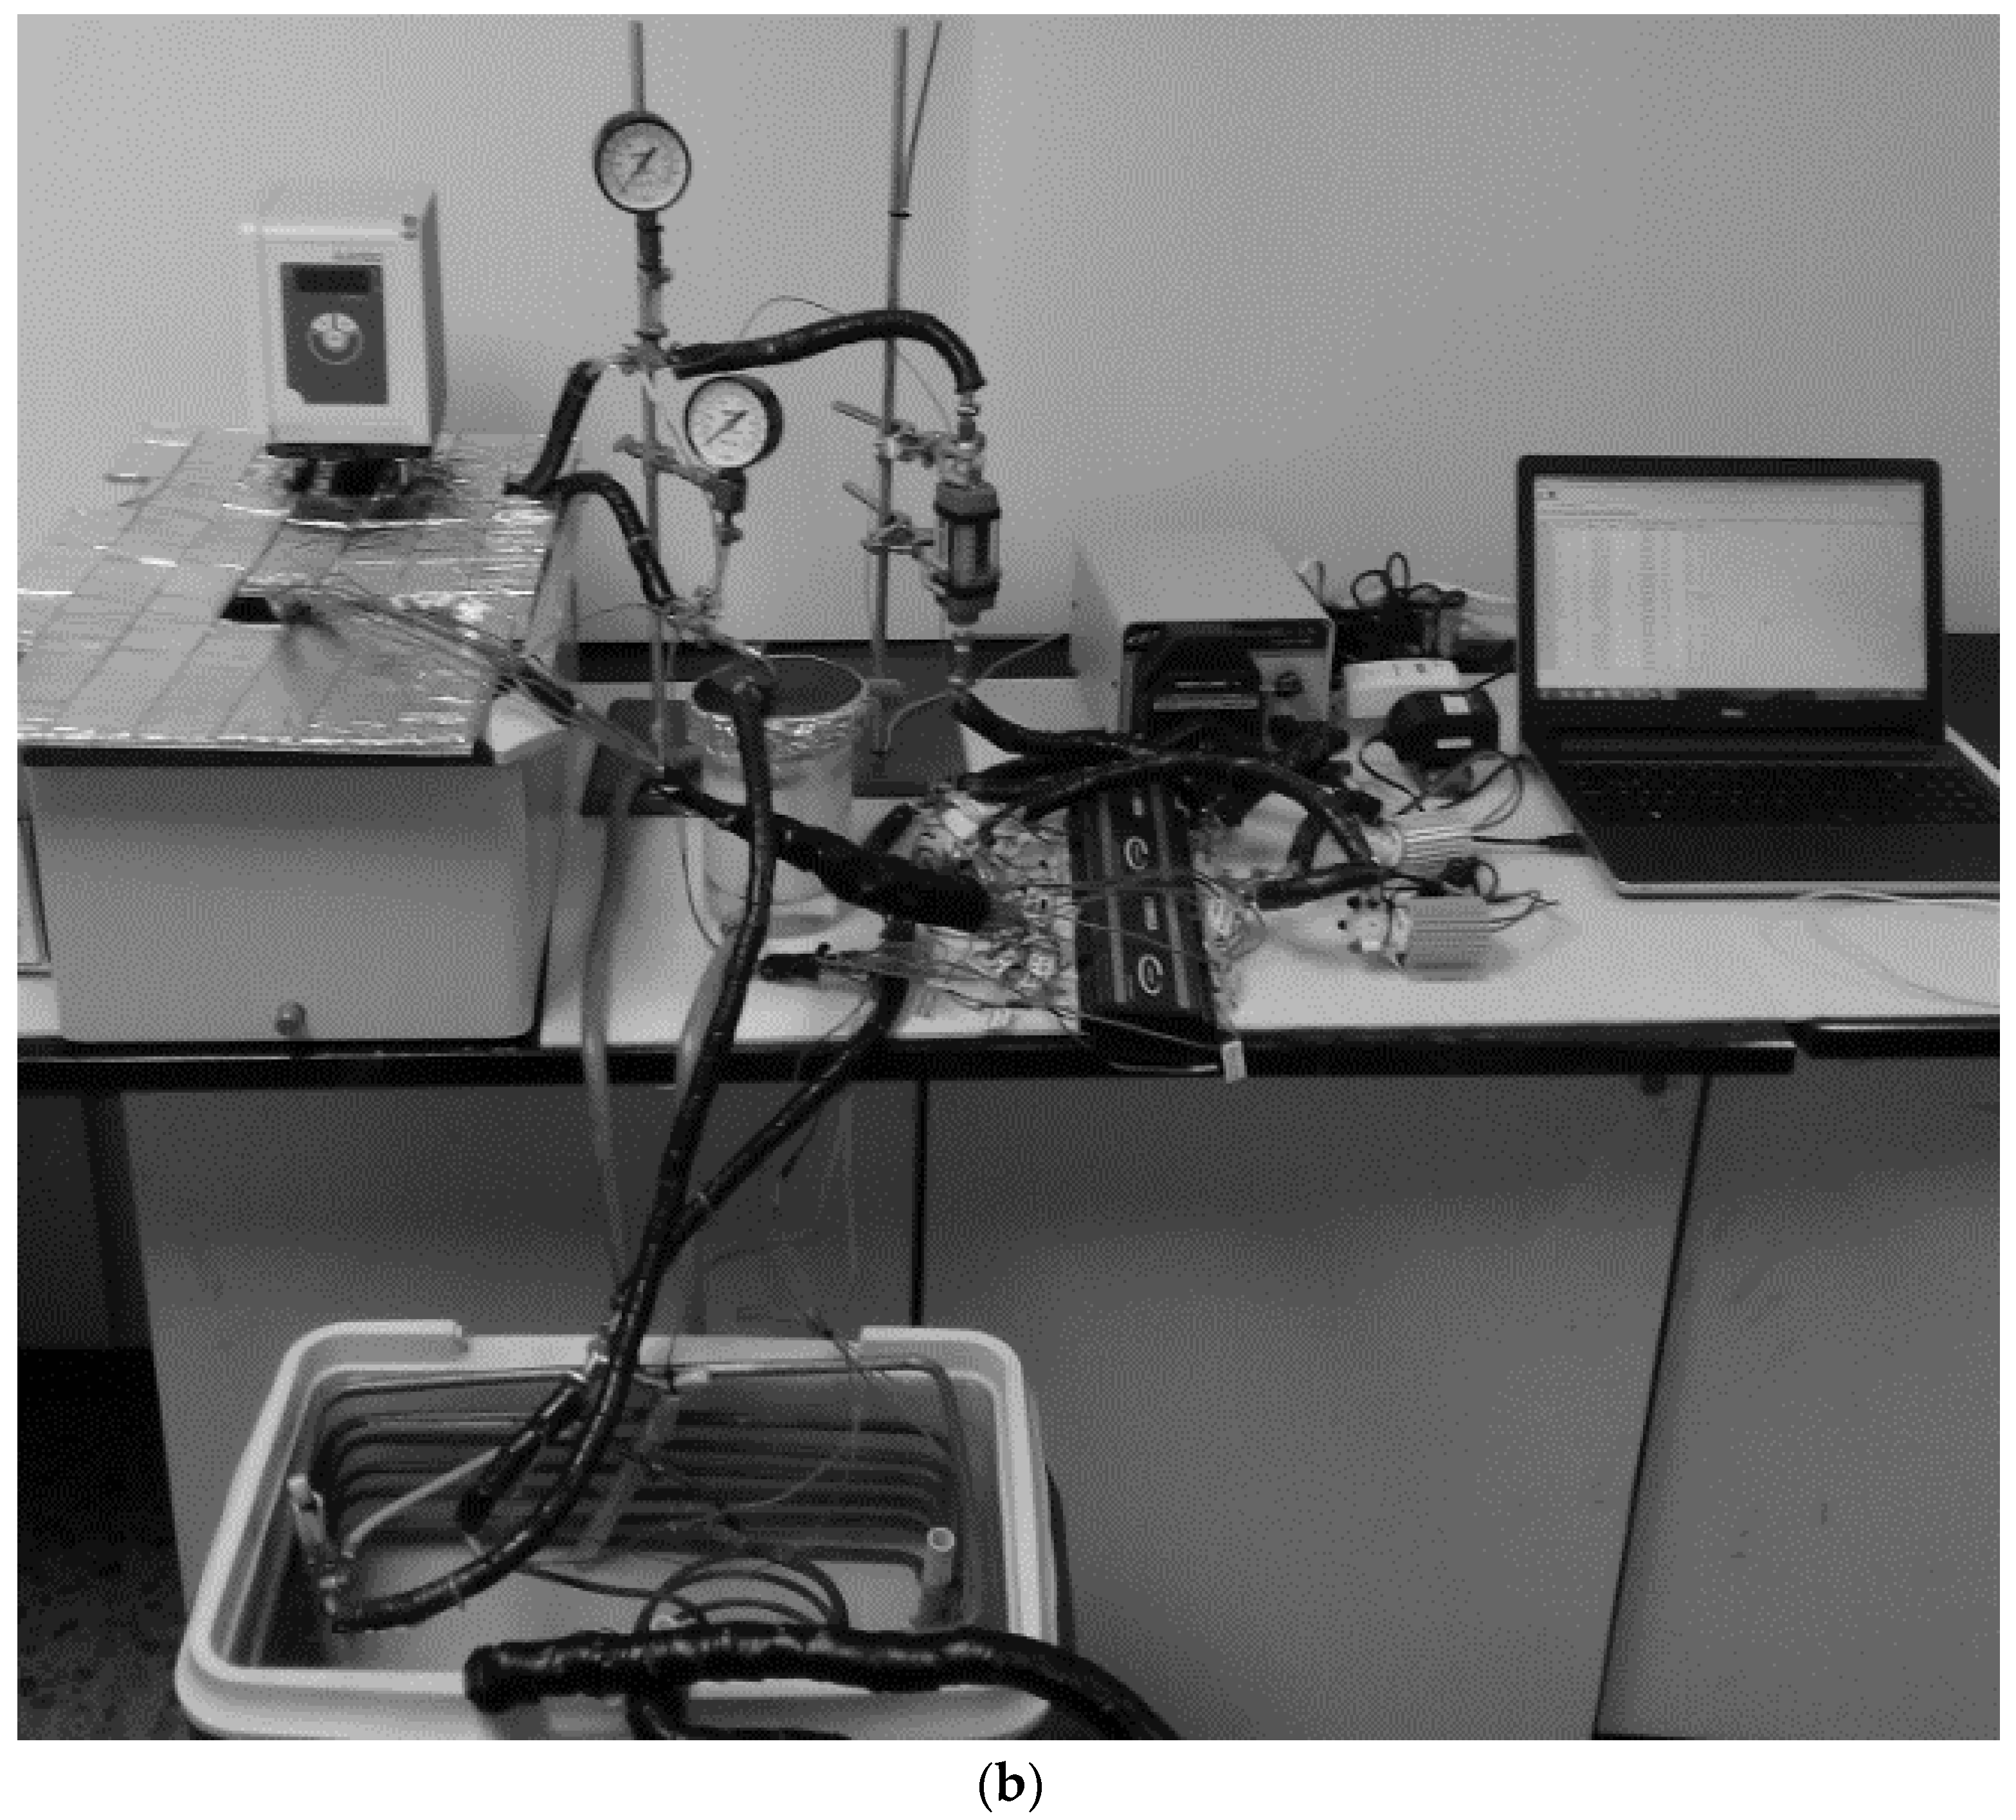
Figure 2.
Schematic of the test section and the thermocouple locations. Arrows indicate the flow direction of the fluid.
Figure 2.
Schematic of the test section and the thermocouple locations. Arrows indicate the flow direction of the fluid.
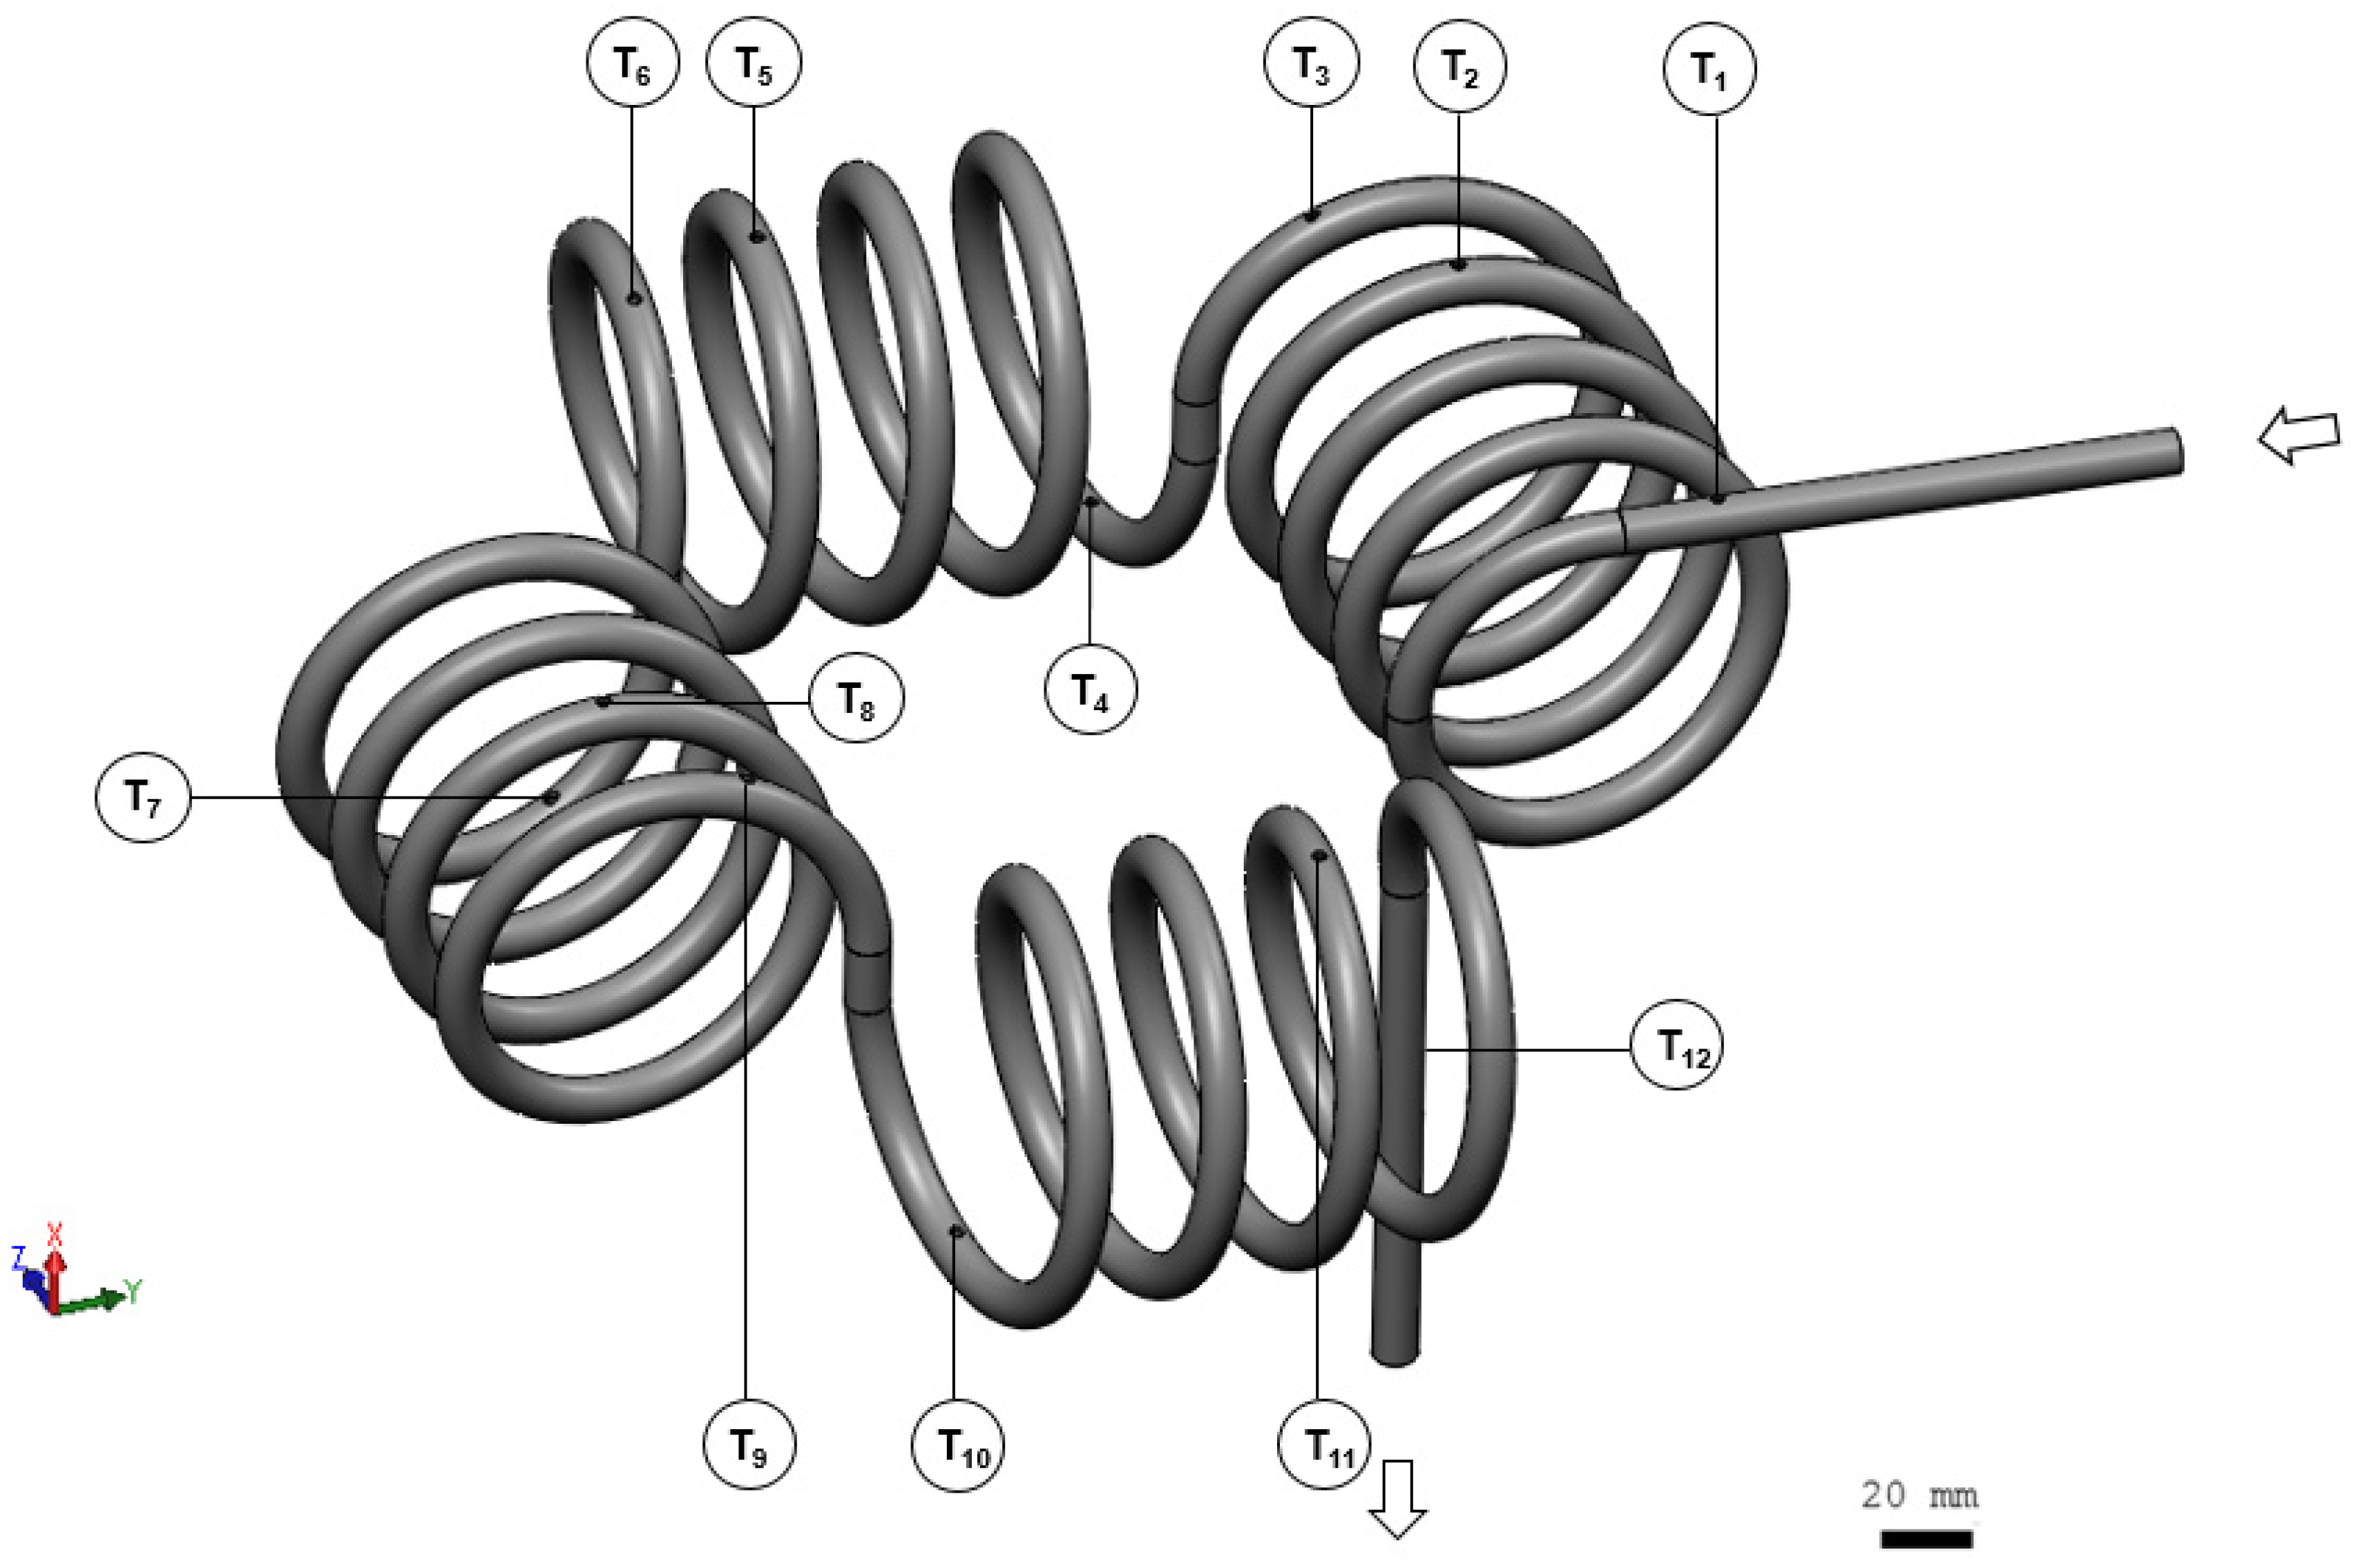
Figure 3.
Particle size distribution of the TiO2 nanoparticles (NPs), obtained from the dynamic light scattering (DLS) analysis.
Figure 3.
Particle size distribution of the TiO2 nanoparticles (NPs), obtained from the dynamic light scattering (DLS) analysis.
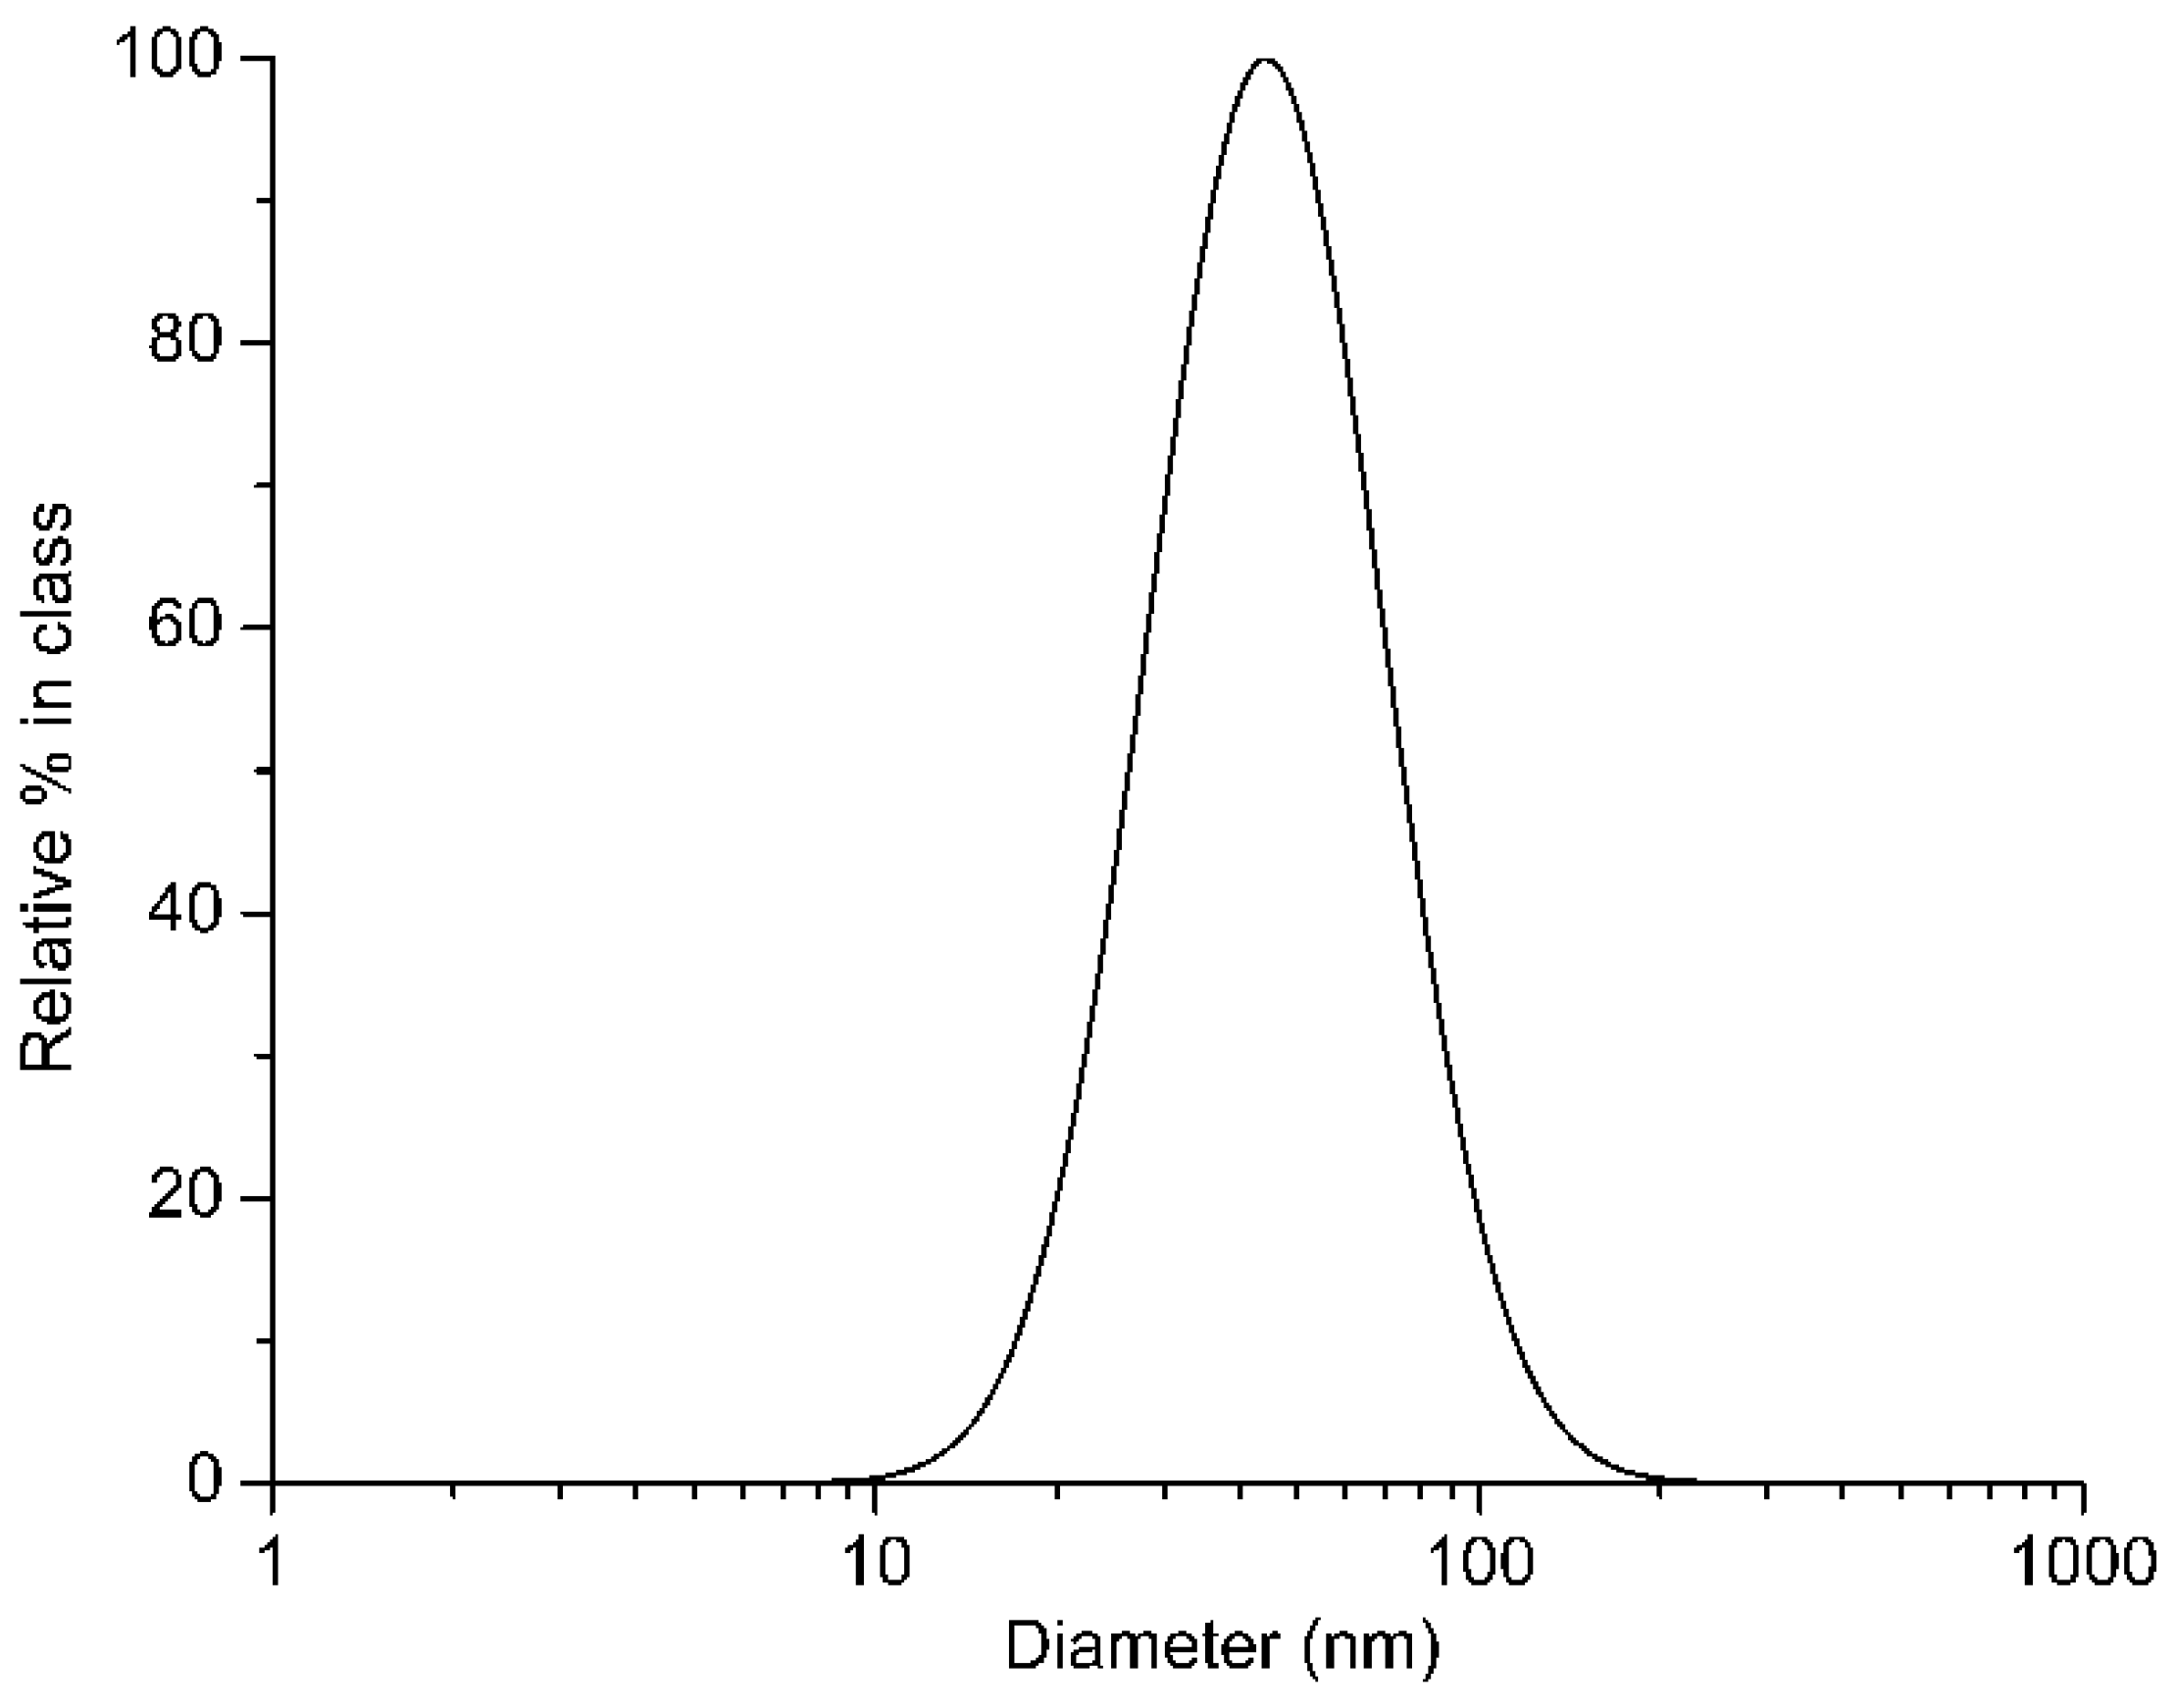
Figure 4.
X-ray diffraction pattern of rutile TiO2.

Figure 5.
Scanning electronic microscopy (SEM) image of the TiO2 NPs.
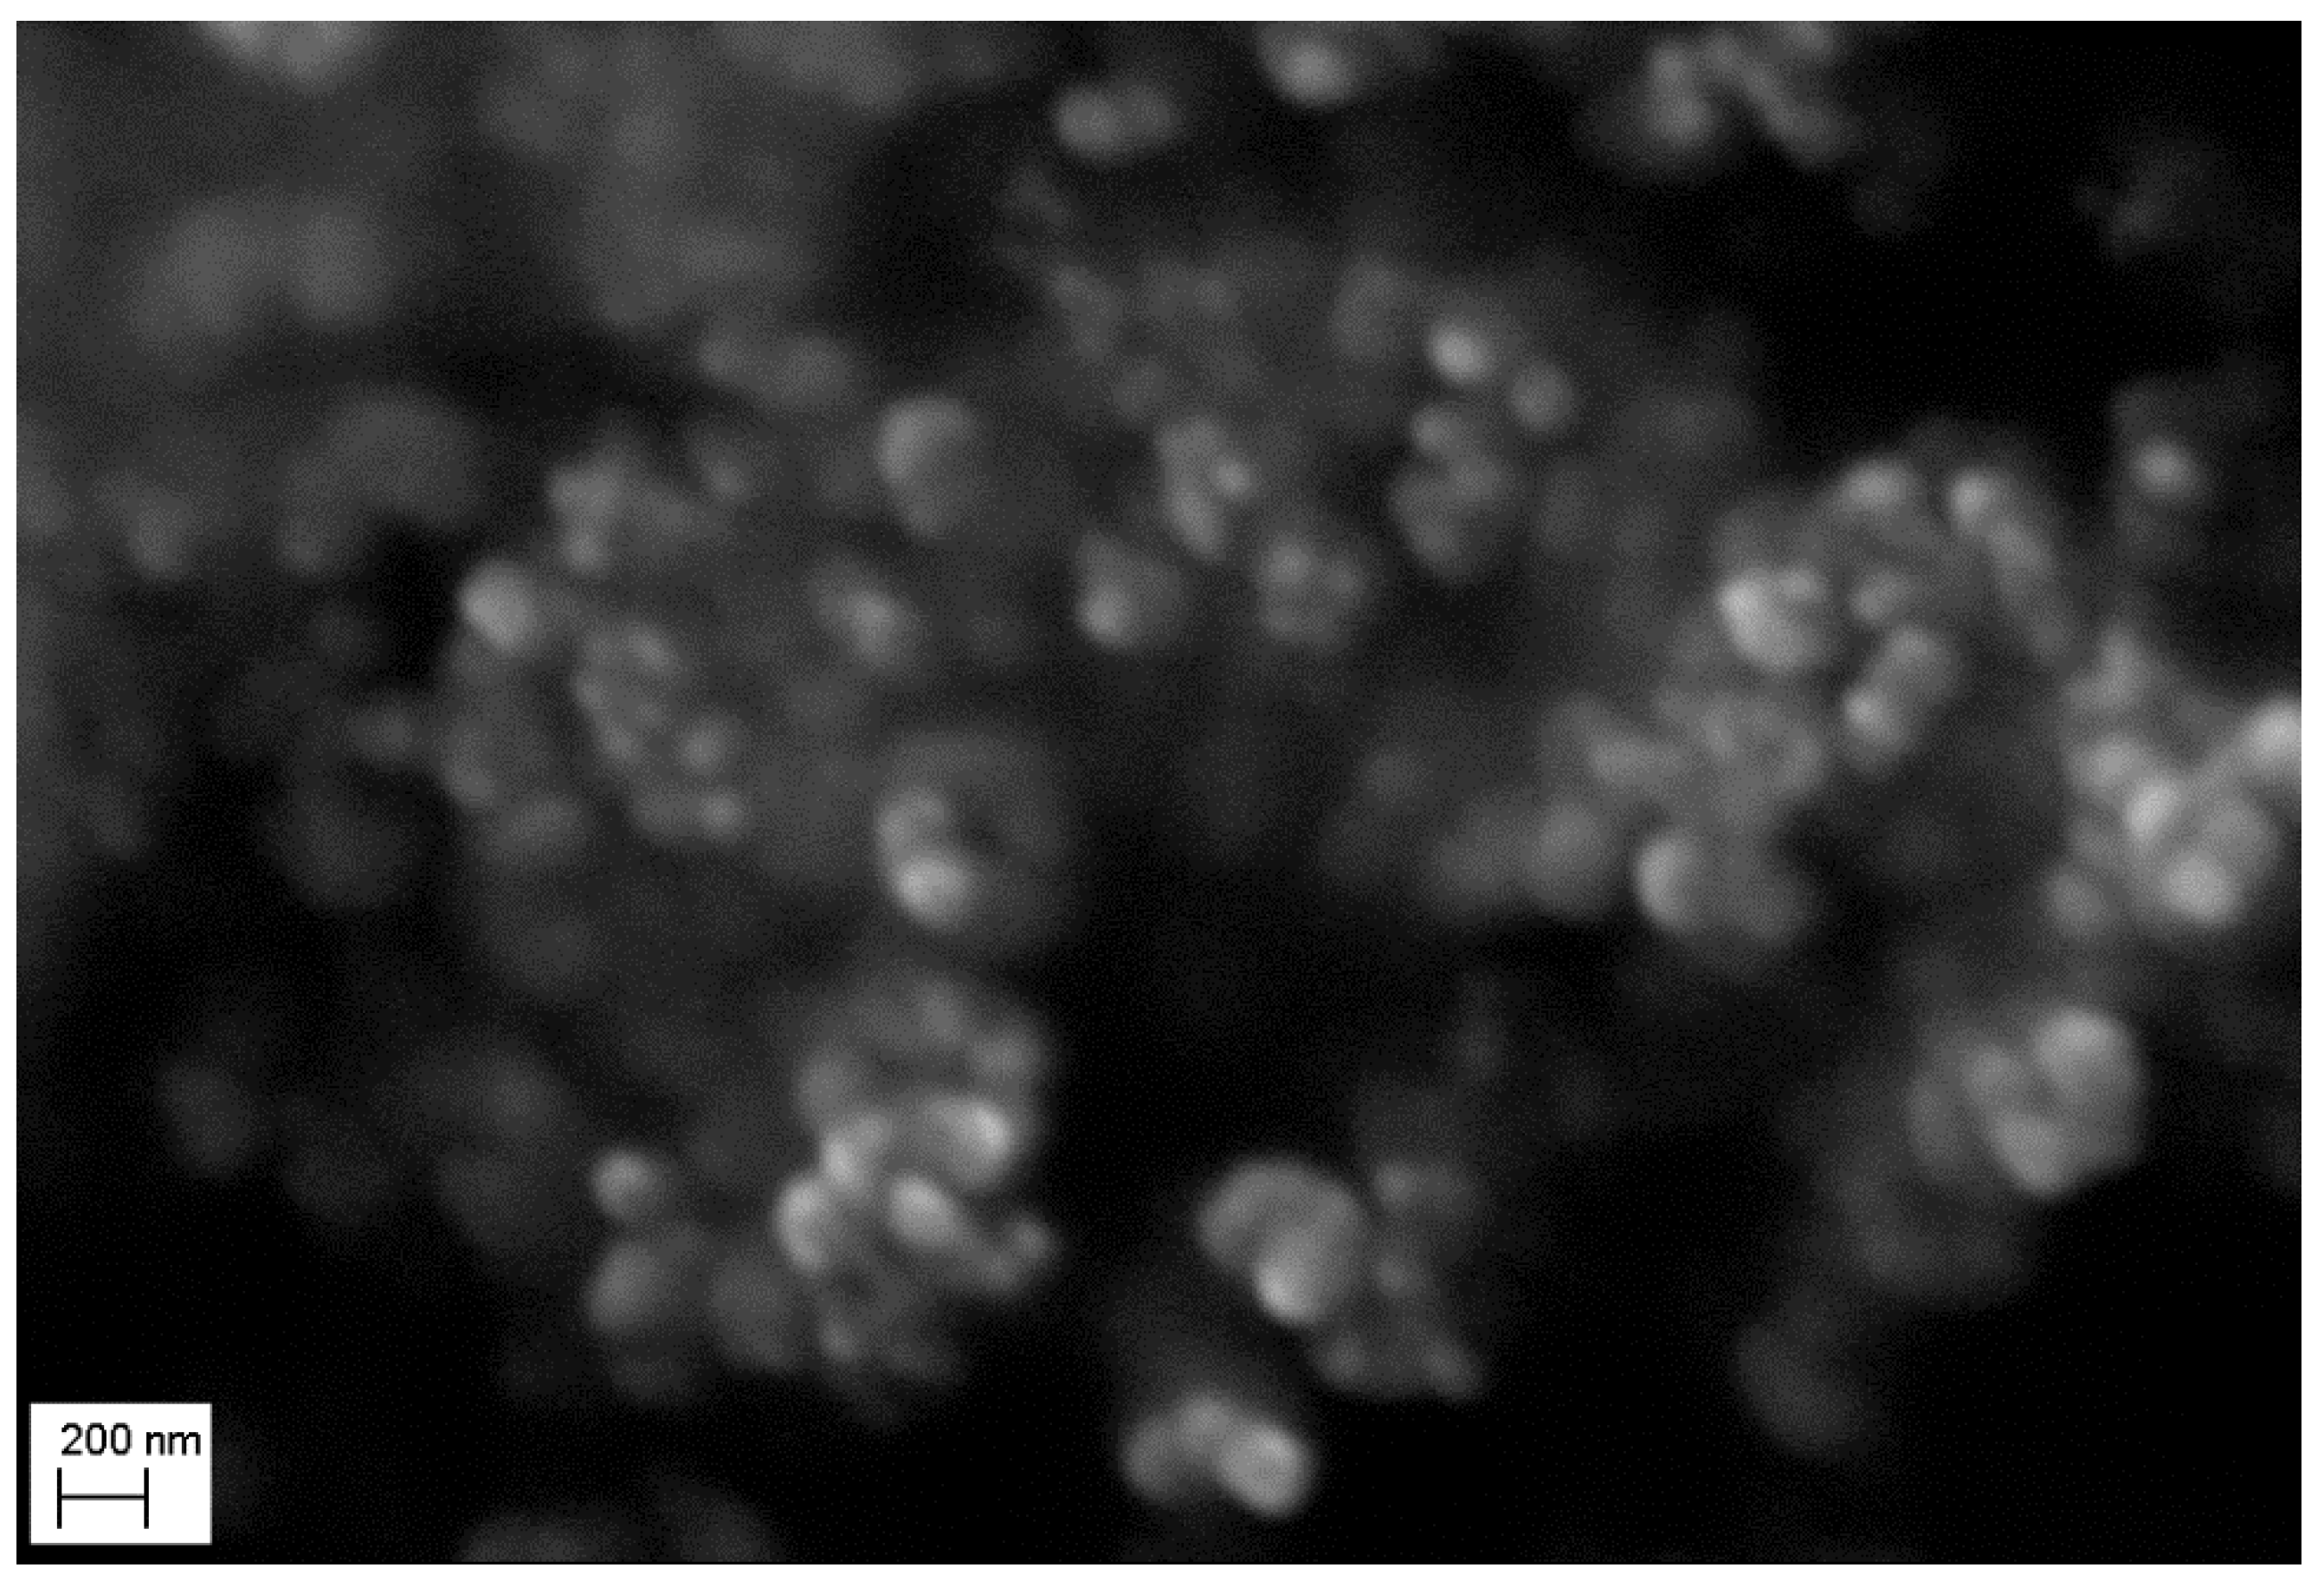
Figure 6.
(a) Experimental thermal conductivity of TiO2–water (W) nanofluids (NFs) as a function of temperature and NP volume concentration. (b) Comparison of the measured thermal conductivity at 35 °C and that predicted from two of the classical models on effective thermal conductivity.
Figure 6.
(a) Experimental thermal conductivity of TiO2–water (W) nanofluids (NFs) as a function of temperature and NP volume concentration. (b) Comparison of the measured thermal conductivity at 35 °C and that predicted from two of the classical models on effective thermal conductivity.

Figure 7.
(a) Experimental dynamic viscosity of TiO2–W NFs as a function of temperature and NP volume concentration. (b) Comparison of the measured dynamic viscosity at 35 °C and that predicted by the classical models of dynamic viscosity.
Figure 7.
(a) Experimental dynamic viscosity of TiO2–W NFs as a function of temperature and NP volume concentration. (b) Comparison of the measured dynamic viscosity at 35 °C and that predicted by the classical models of dynamic viscosity.
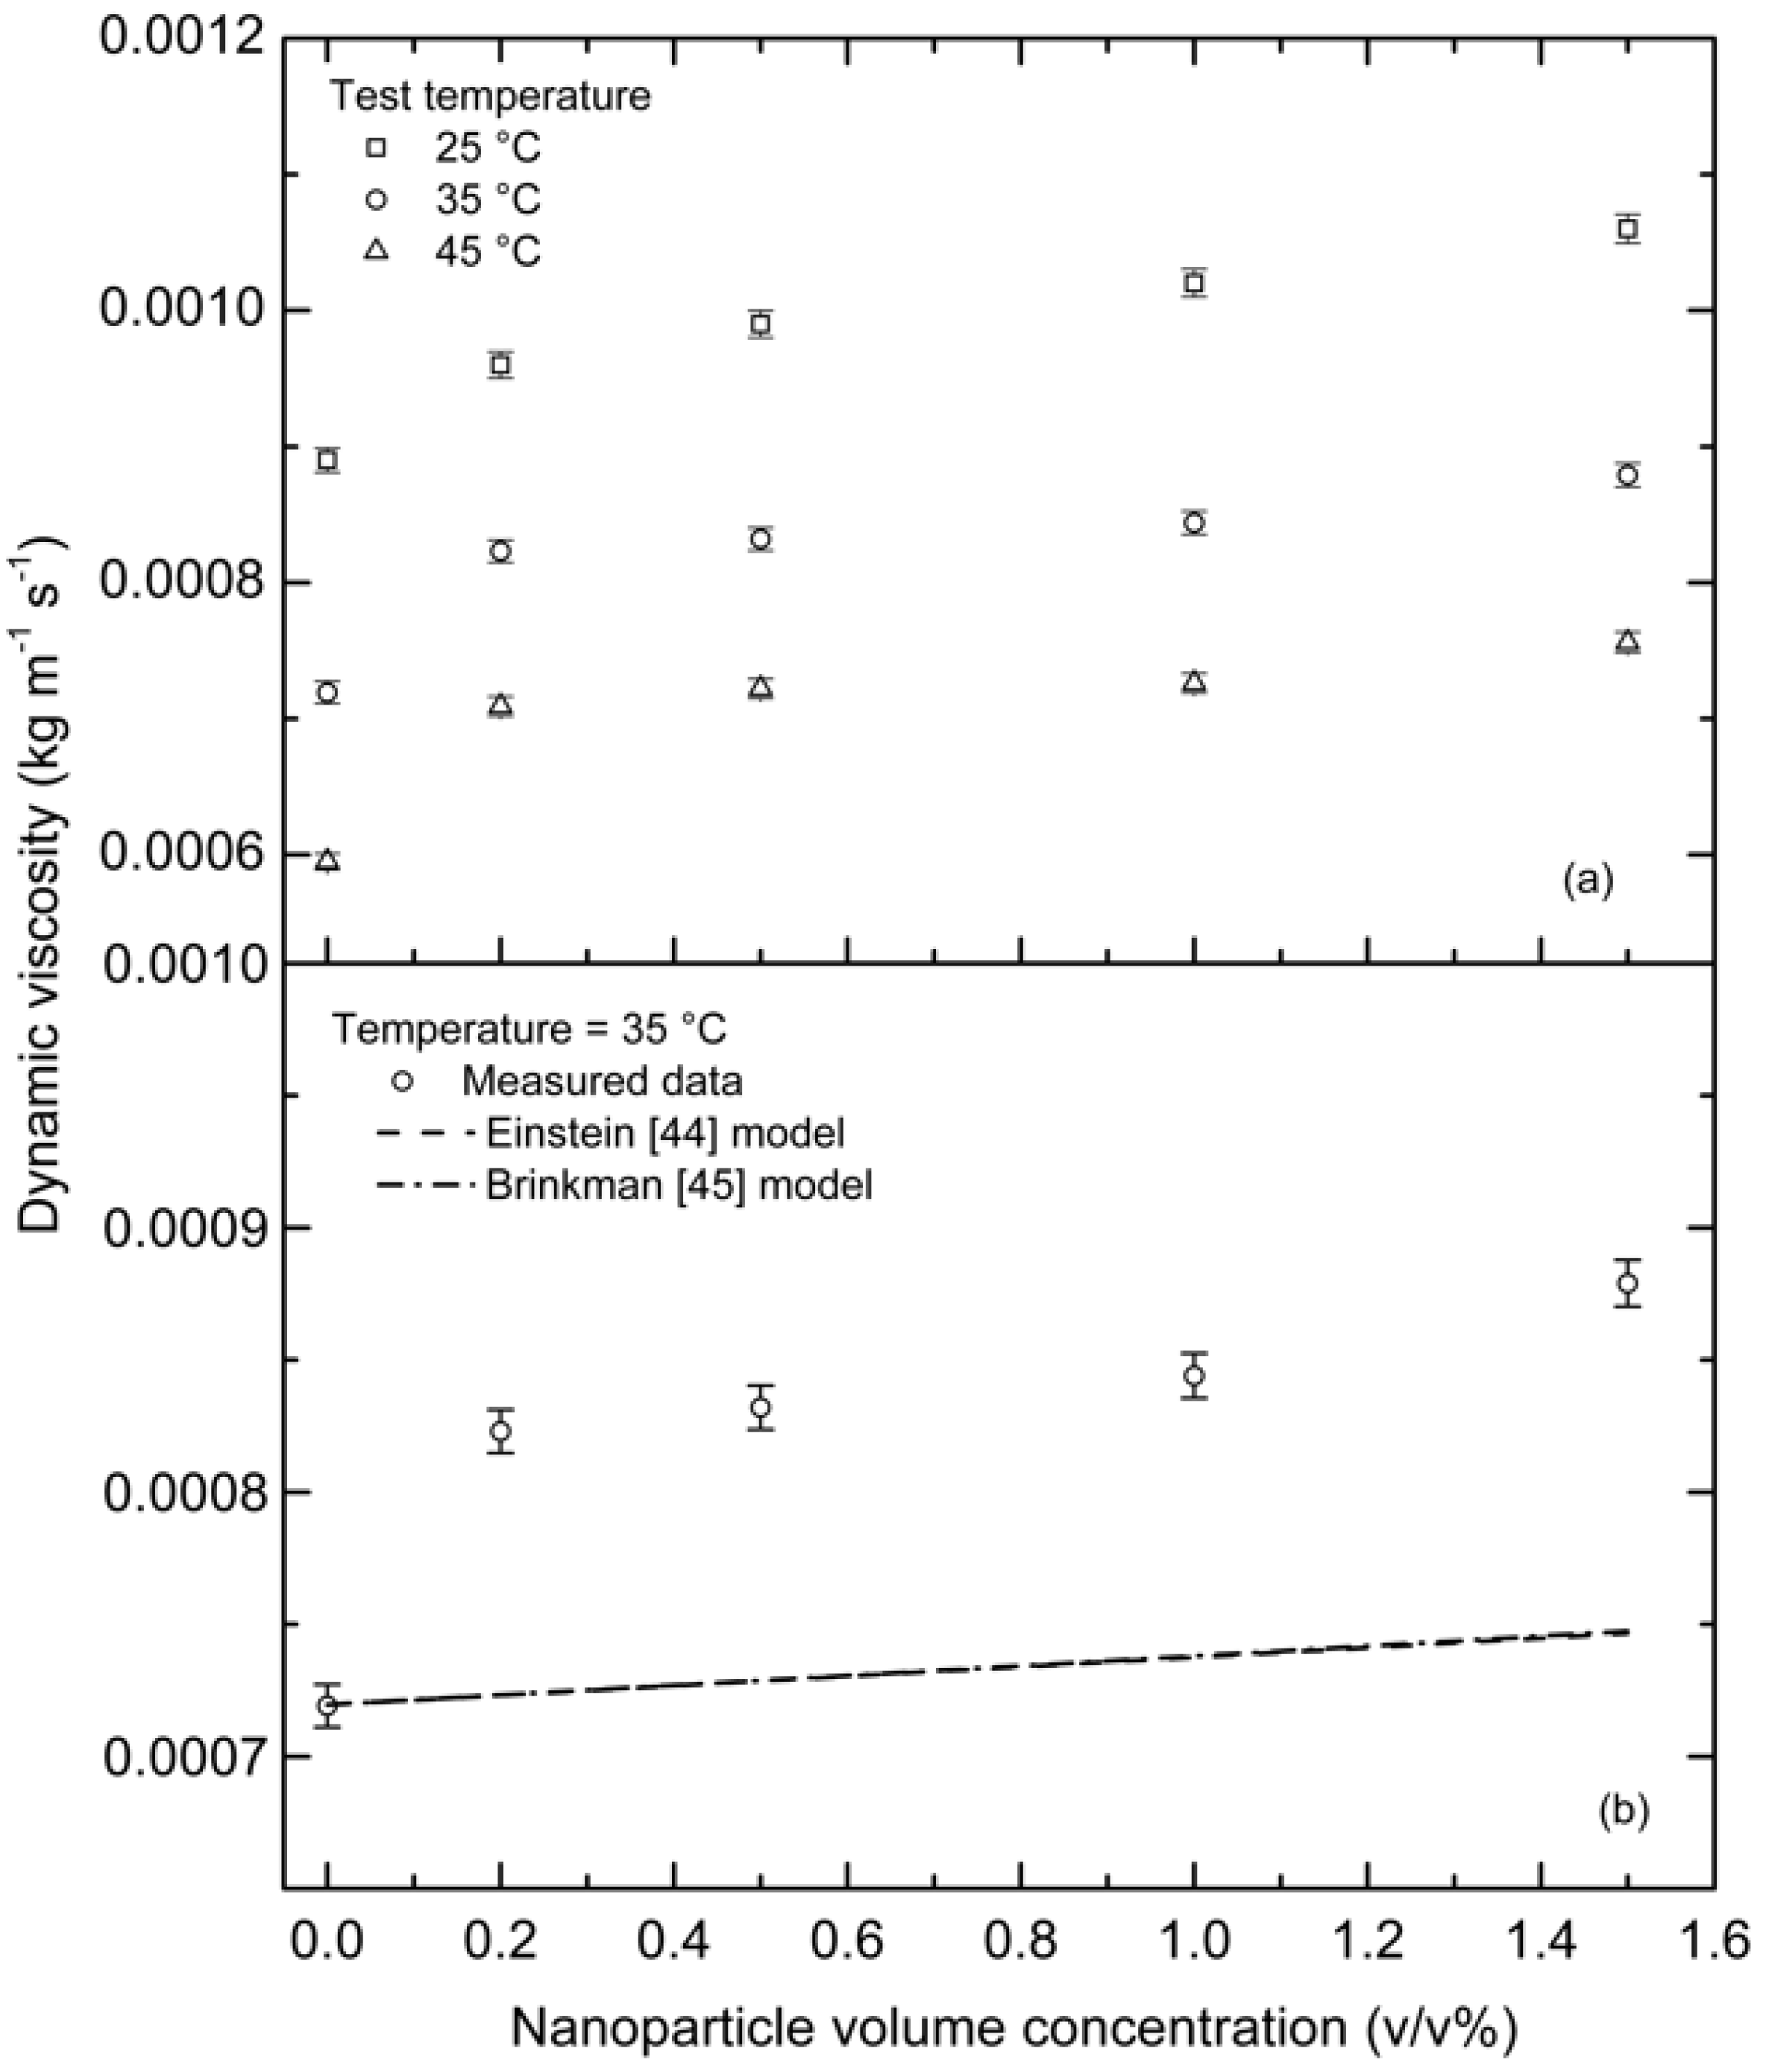
Figure 8.
(a) Experimental density of TiO2–W NFs as a function of temperature and NP volume concentration. (b) Comparison of the measured density at 35 °C and that predicted by the mixture rule principle [48].
Figure 8.
(a) Experimental density of TiO2–W NFs as a function of temperature and NP volume concentration. (b) Comparison of the measured density at 35 °C and that predicted by the mixture rule principle [48].
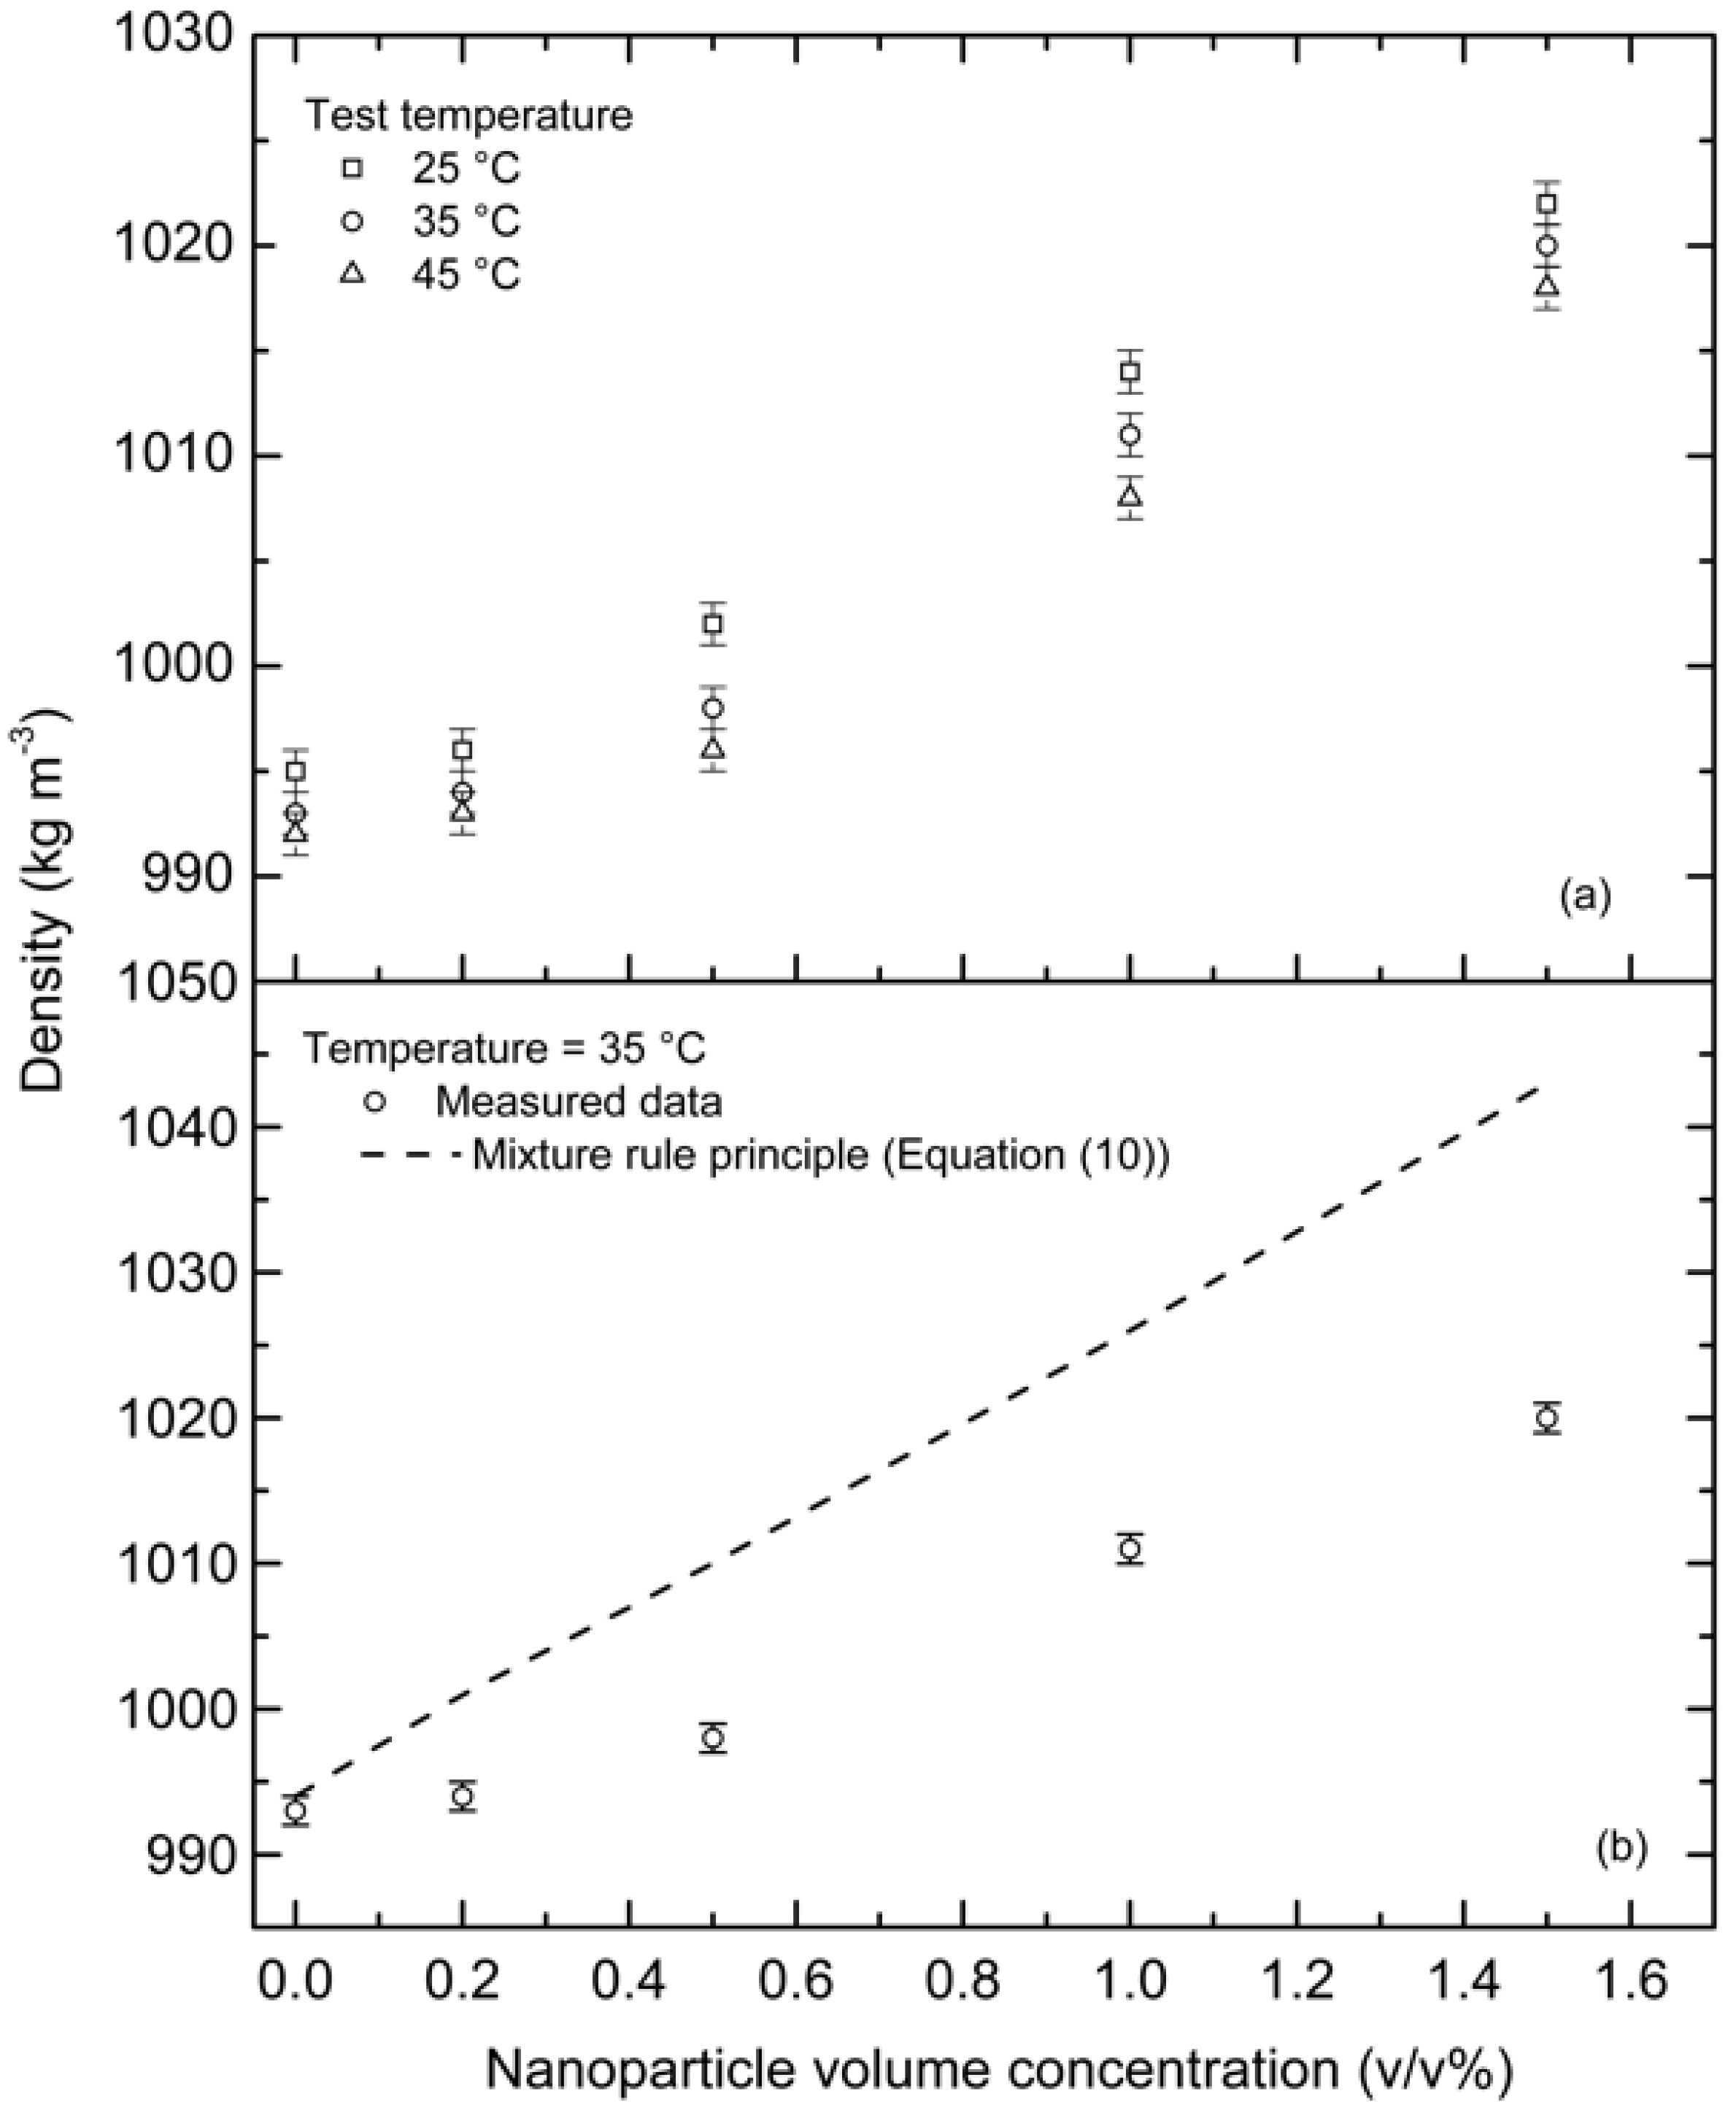
Figure 9.
(a) Experimental specific heat of TiO2–W NFs as a function of temperature and NP volume concentration. (b) Comparison of the measured specific heat at 35 °C and that predicted by the Xuan and Roetzel [51] model.
Figure 9.
(a) Experimental specific heat of TiO2–W NFs as a function of temperature and NP volume concentration. (b) Comparison of the measured specific heat at 35 °C and that predicted by the Xuan and Roetzel [51] model.
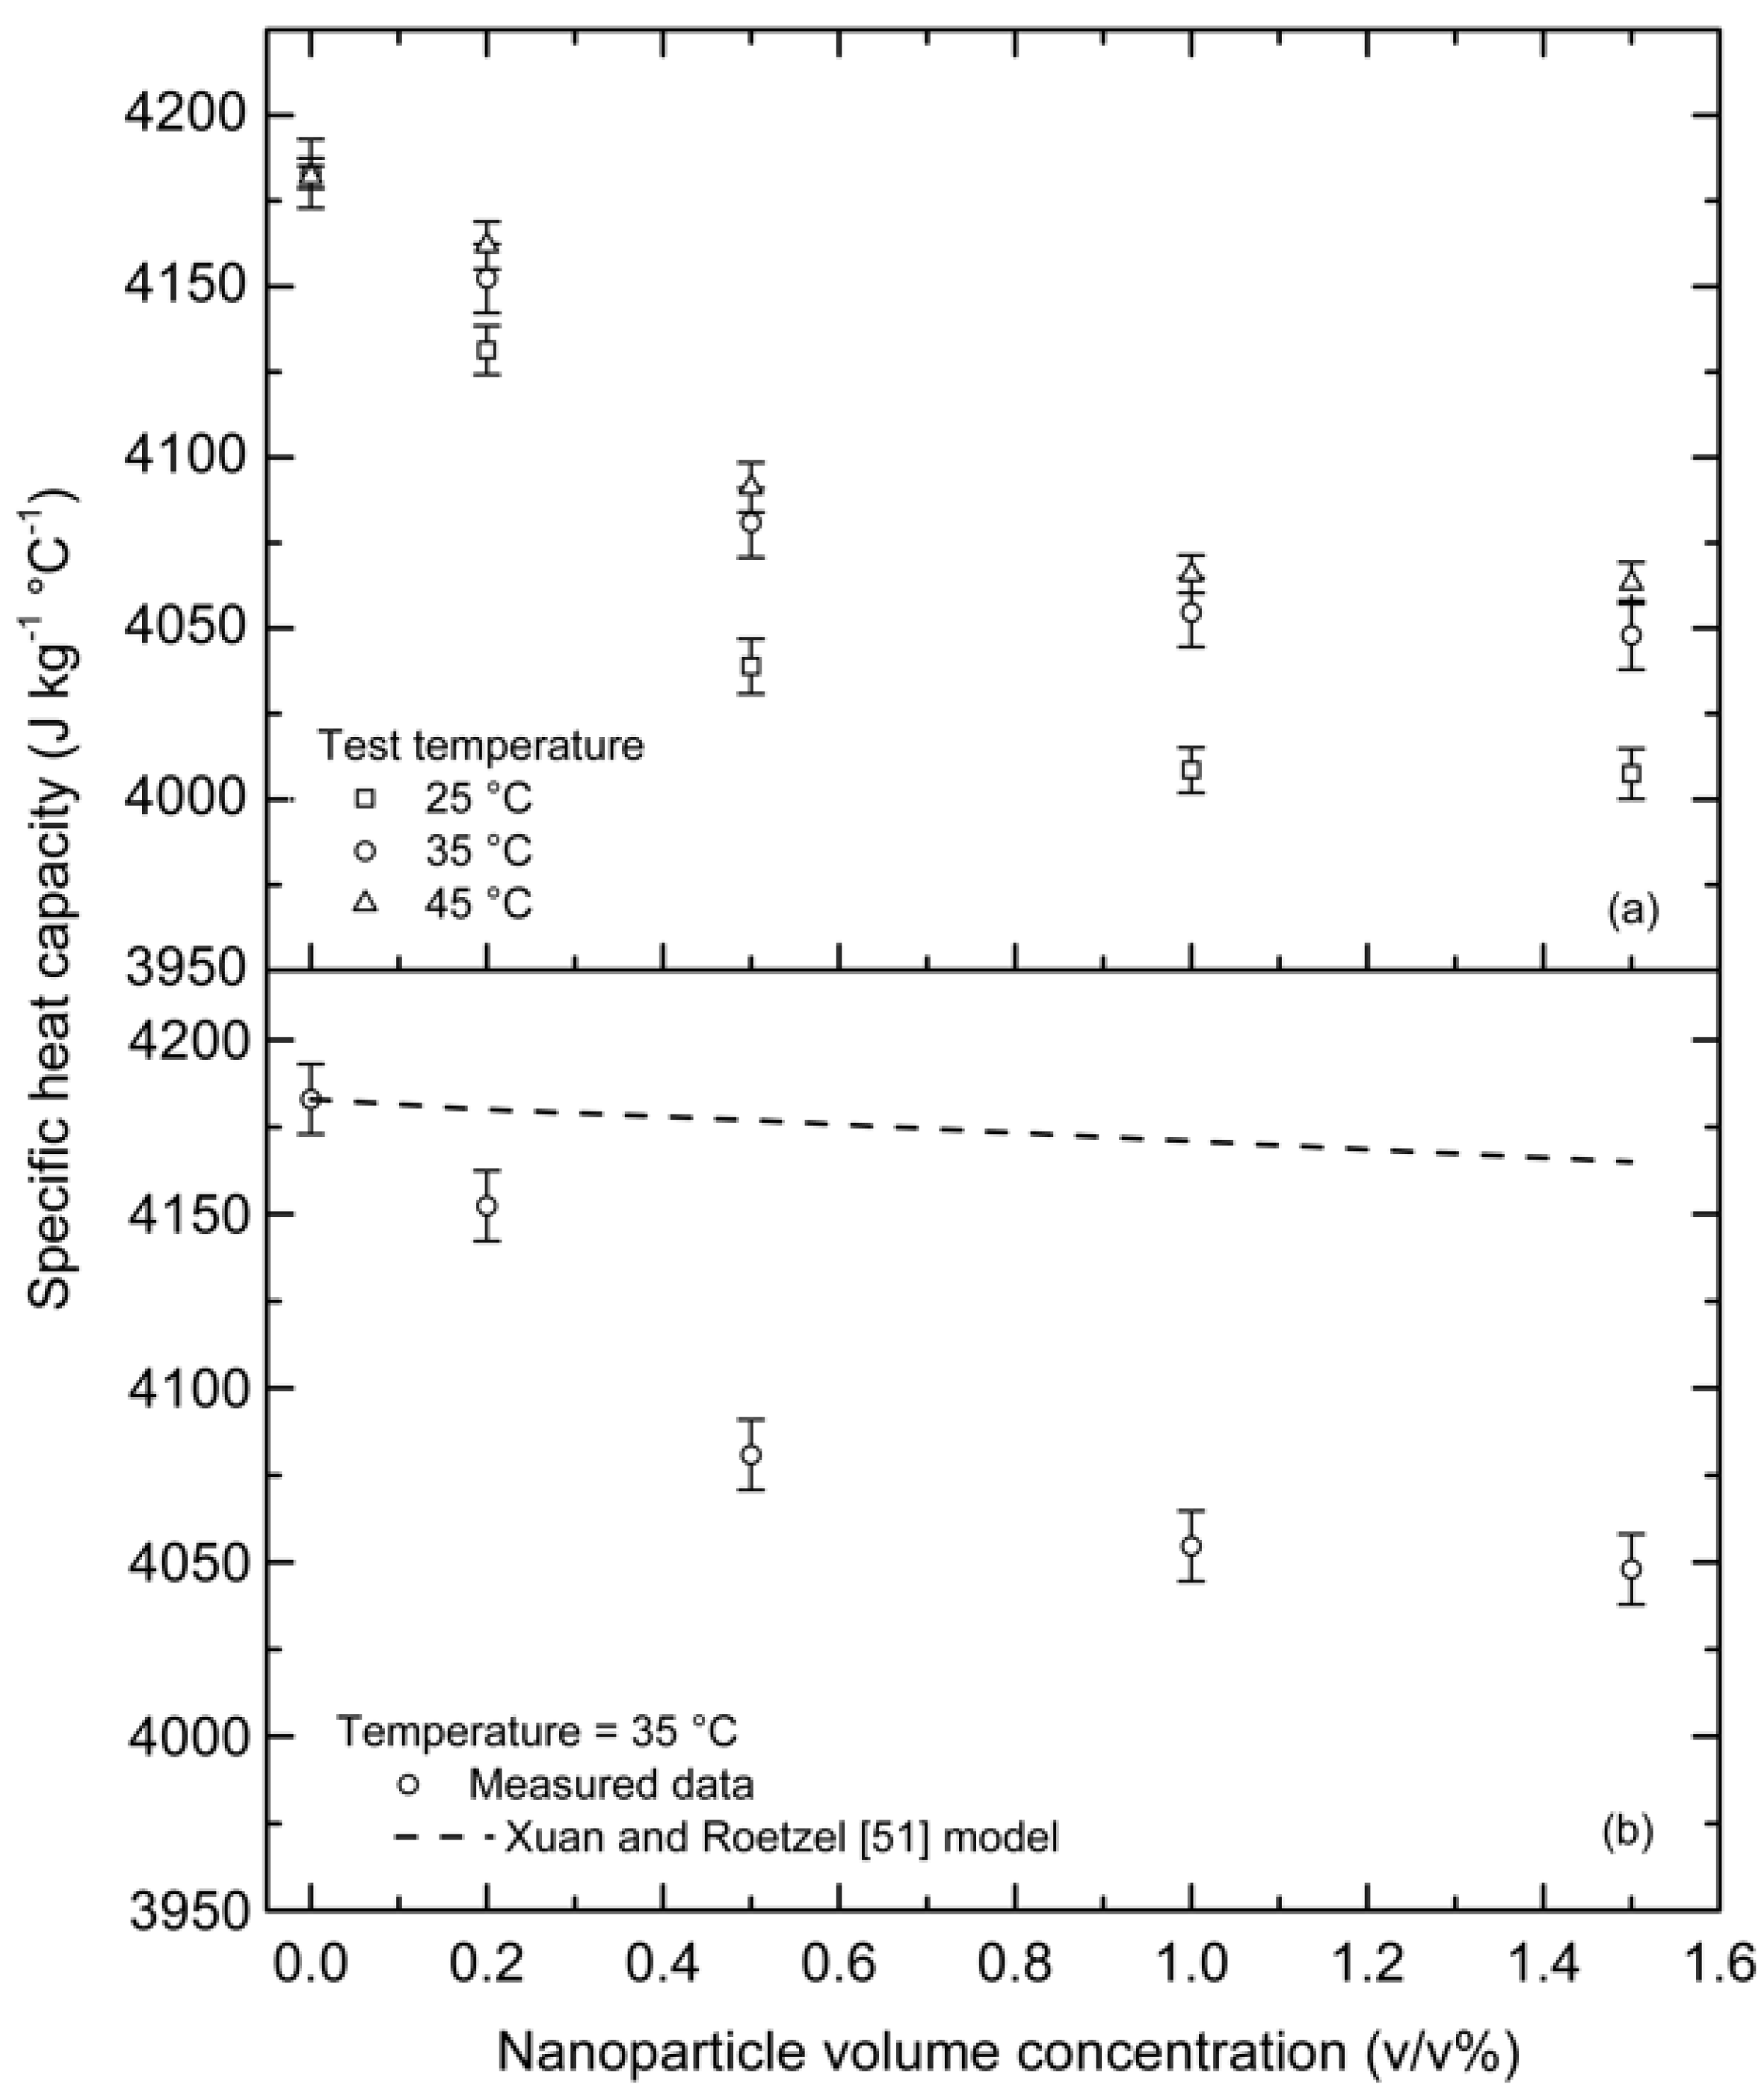
Figure 10.
Experimental versus in water and TiO2–W NFs.
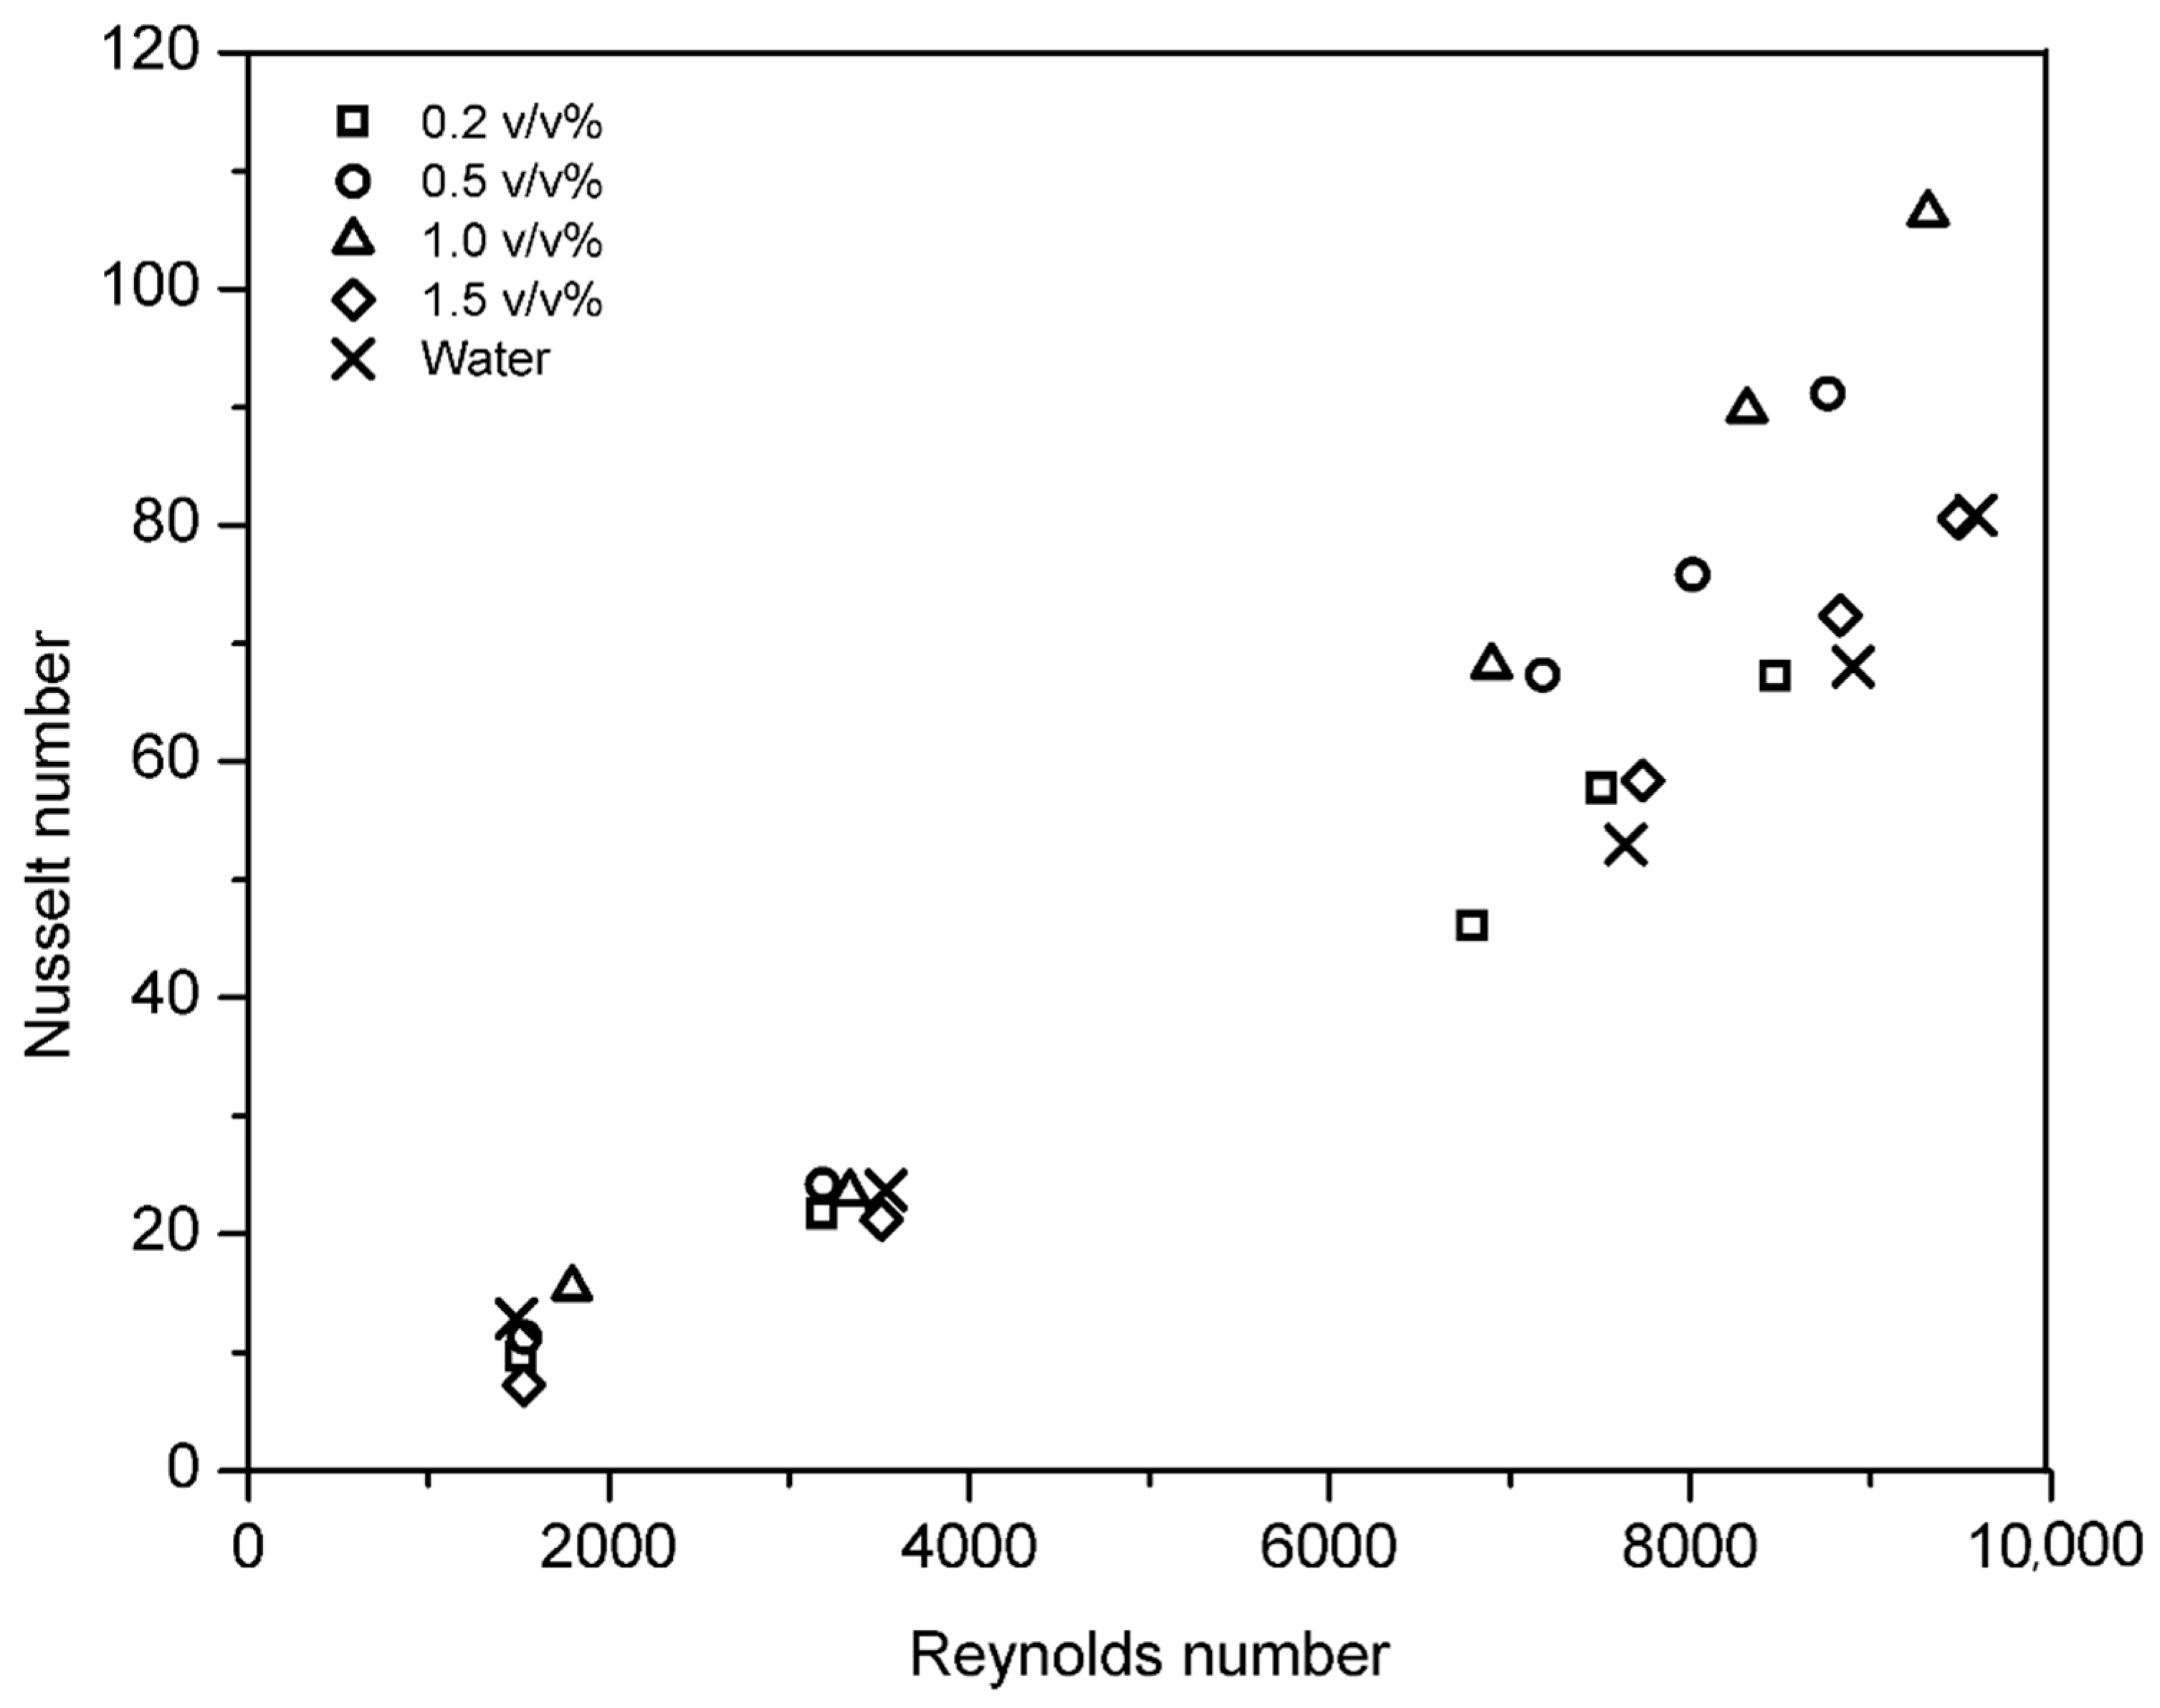
Figure 11.
Deviation between the experimental and predicted values of TiO2–W flows. The predicted values were obtained by the proposed empirical correlations: Equation (12) in (a) and Equation (13) in (b).
Figure 11.
Deviation between the experimental and predicted values of TiO2–W flows. The predicted values were obtained by the proposed empirical correlations: Equation (12) in (a) and Equation (13) in (b).
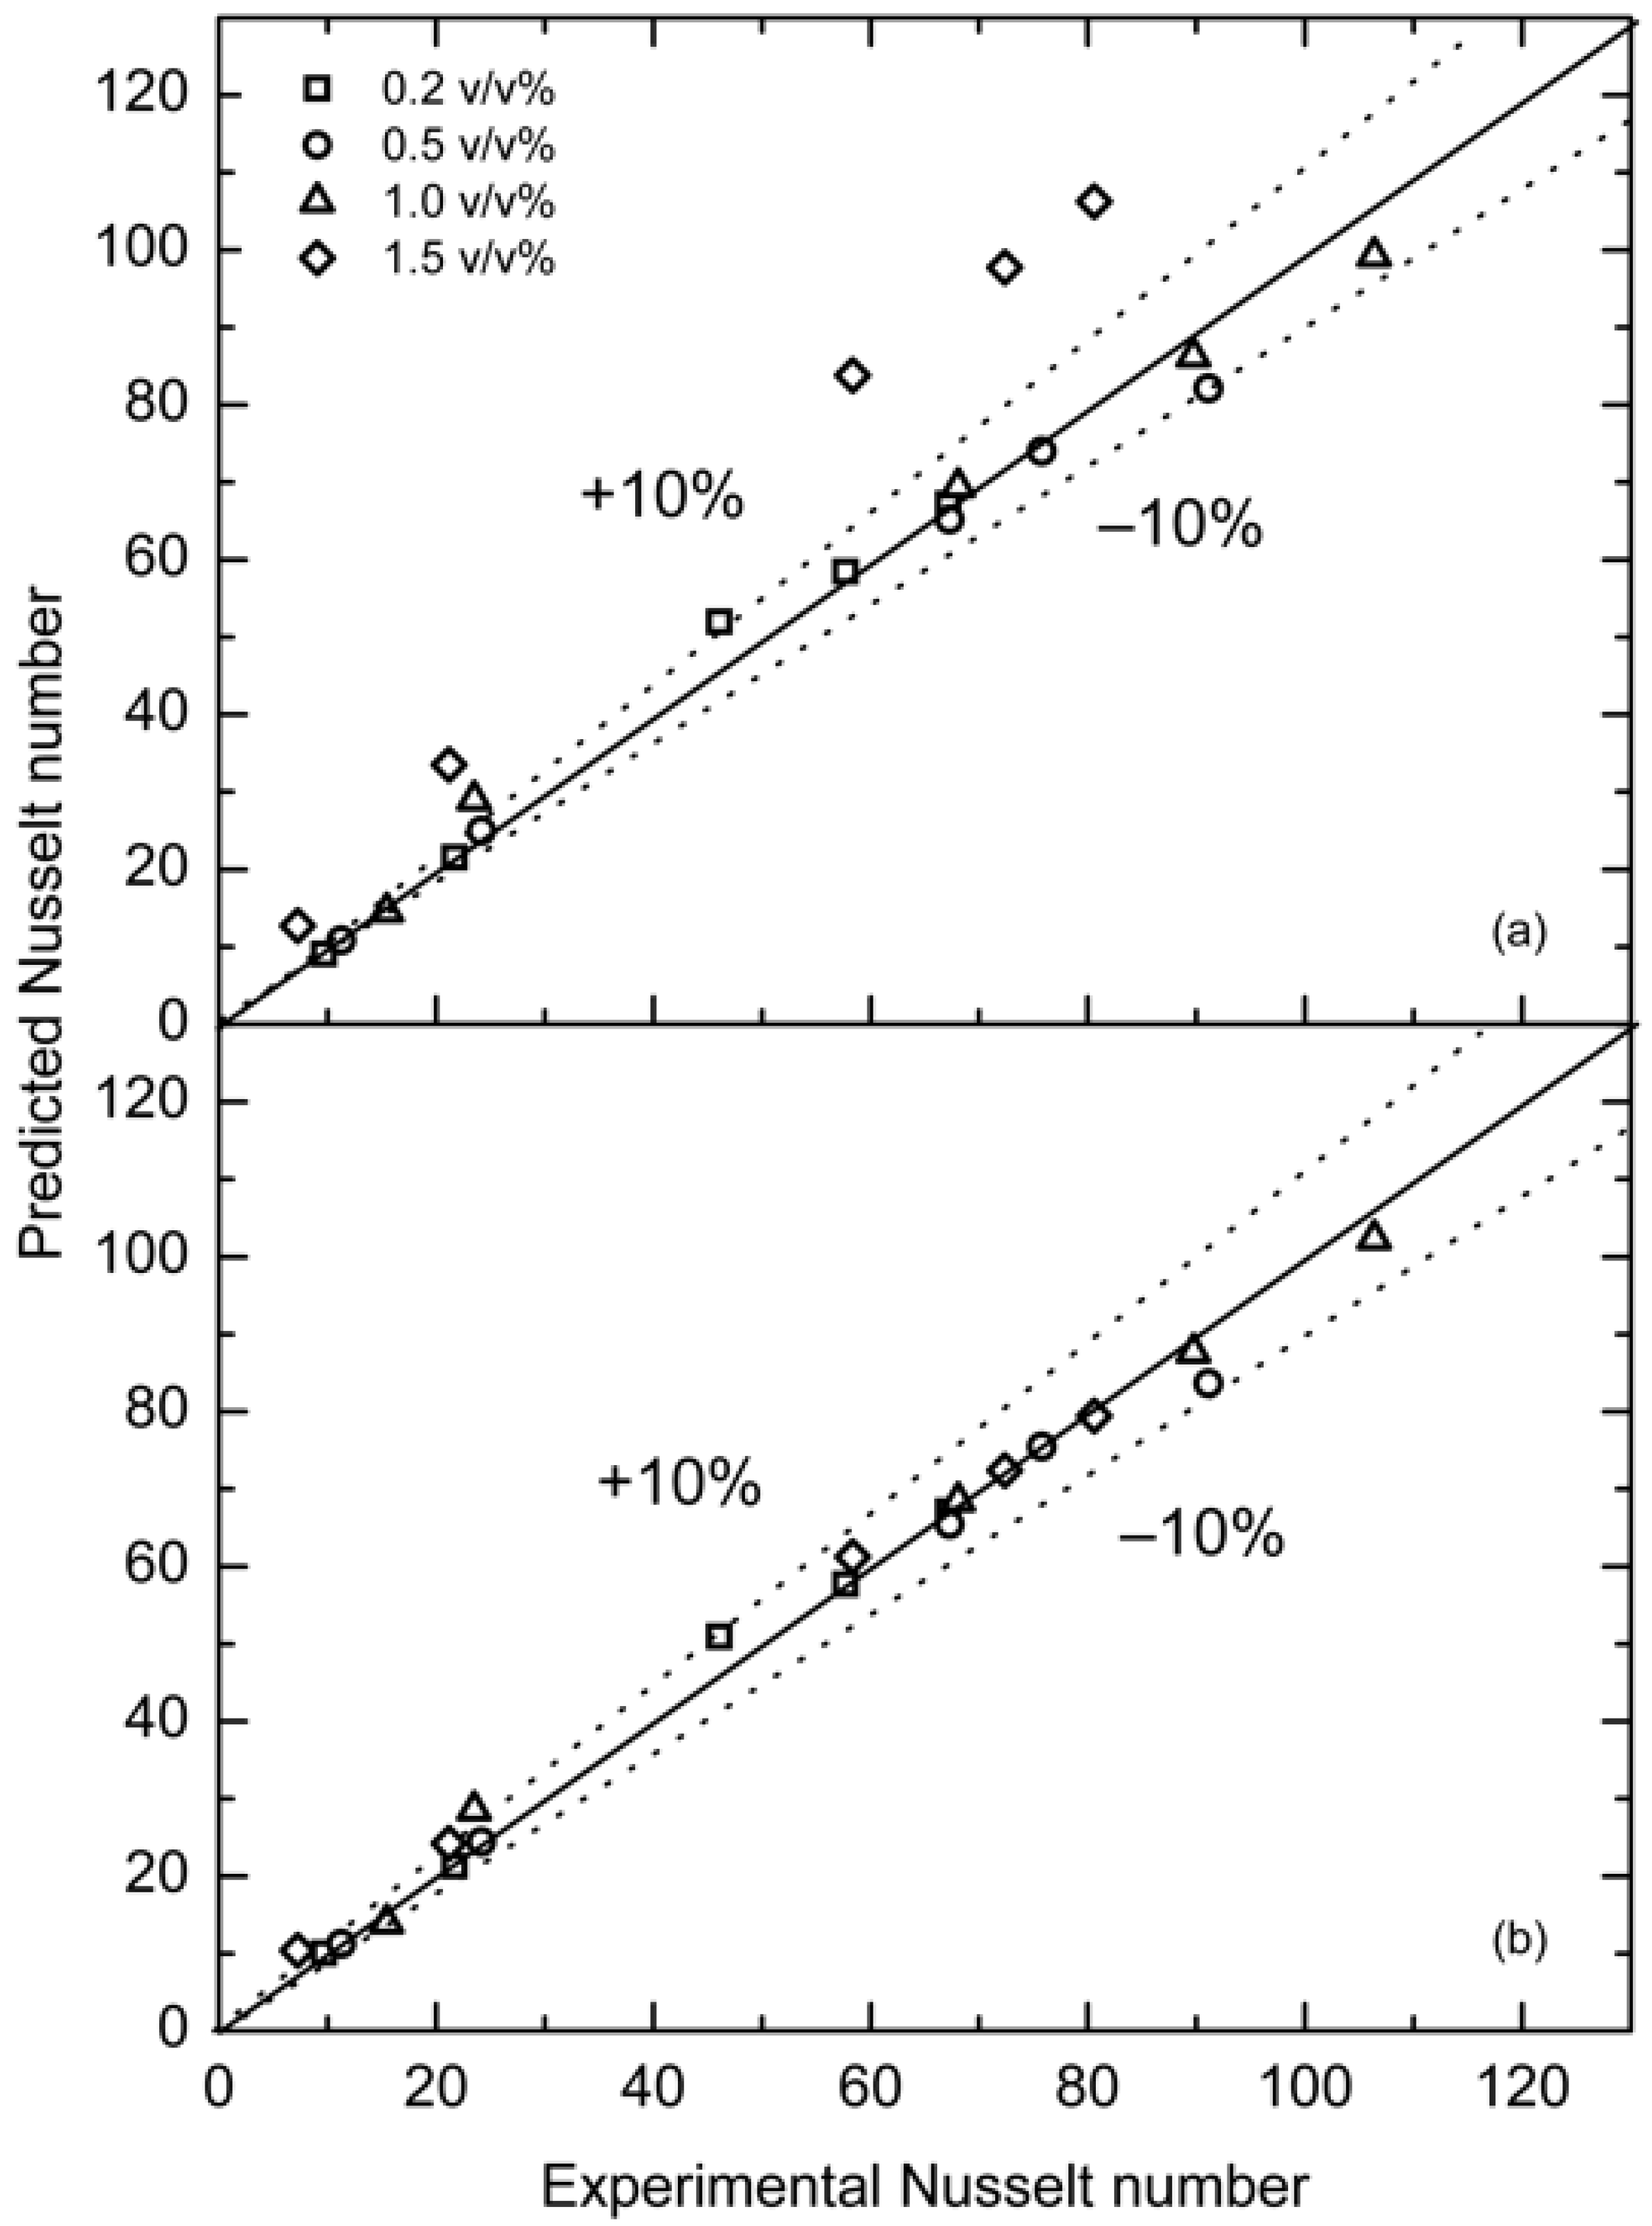
Figure 12.
Plots of versus . The symbols are the experimental data and the curves were calculated by Equation (12) in (a–a.iv) and Equation (13) in (b–b.iv). Cumulative results (a,b), and the results of NFs with a NP concentration of 1.5 v/v% (a.i,b.i), 1.0 v/v% (a.ii,b.ii), 0.5 v/v% (a.iii,b.iii), and 0.2 v/v% (a.iv,b.iv). Legends as shown in (a,b).
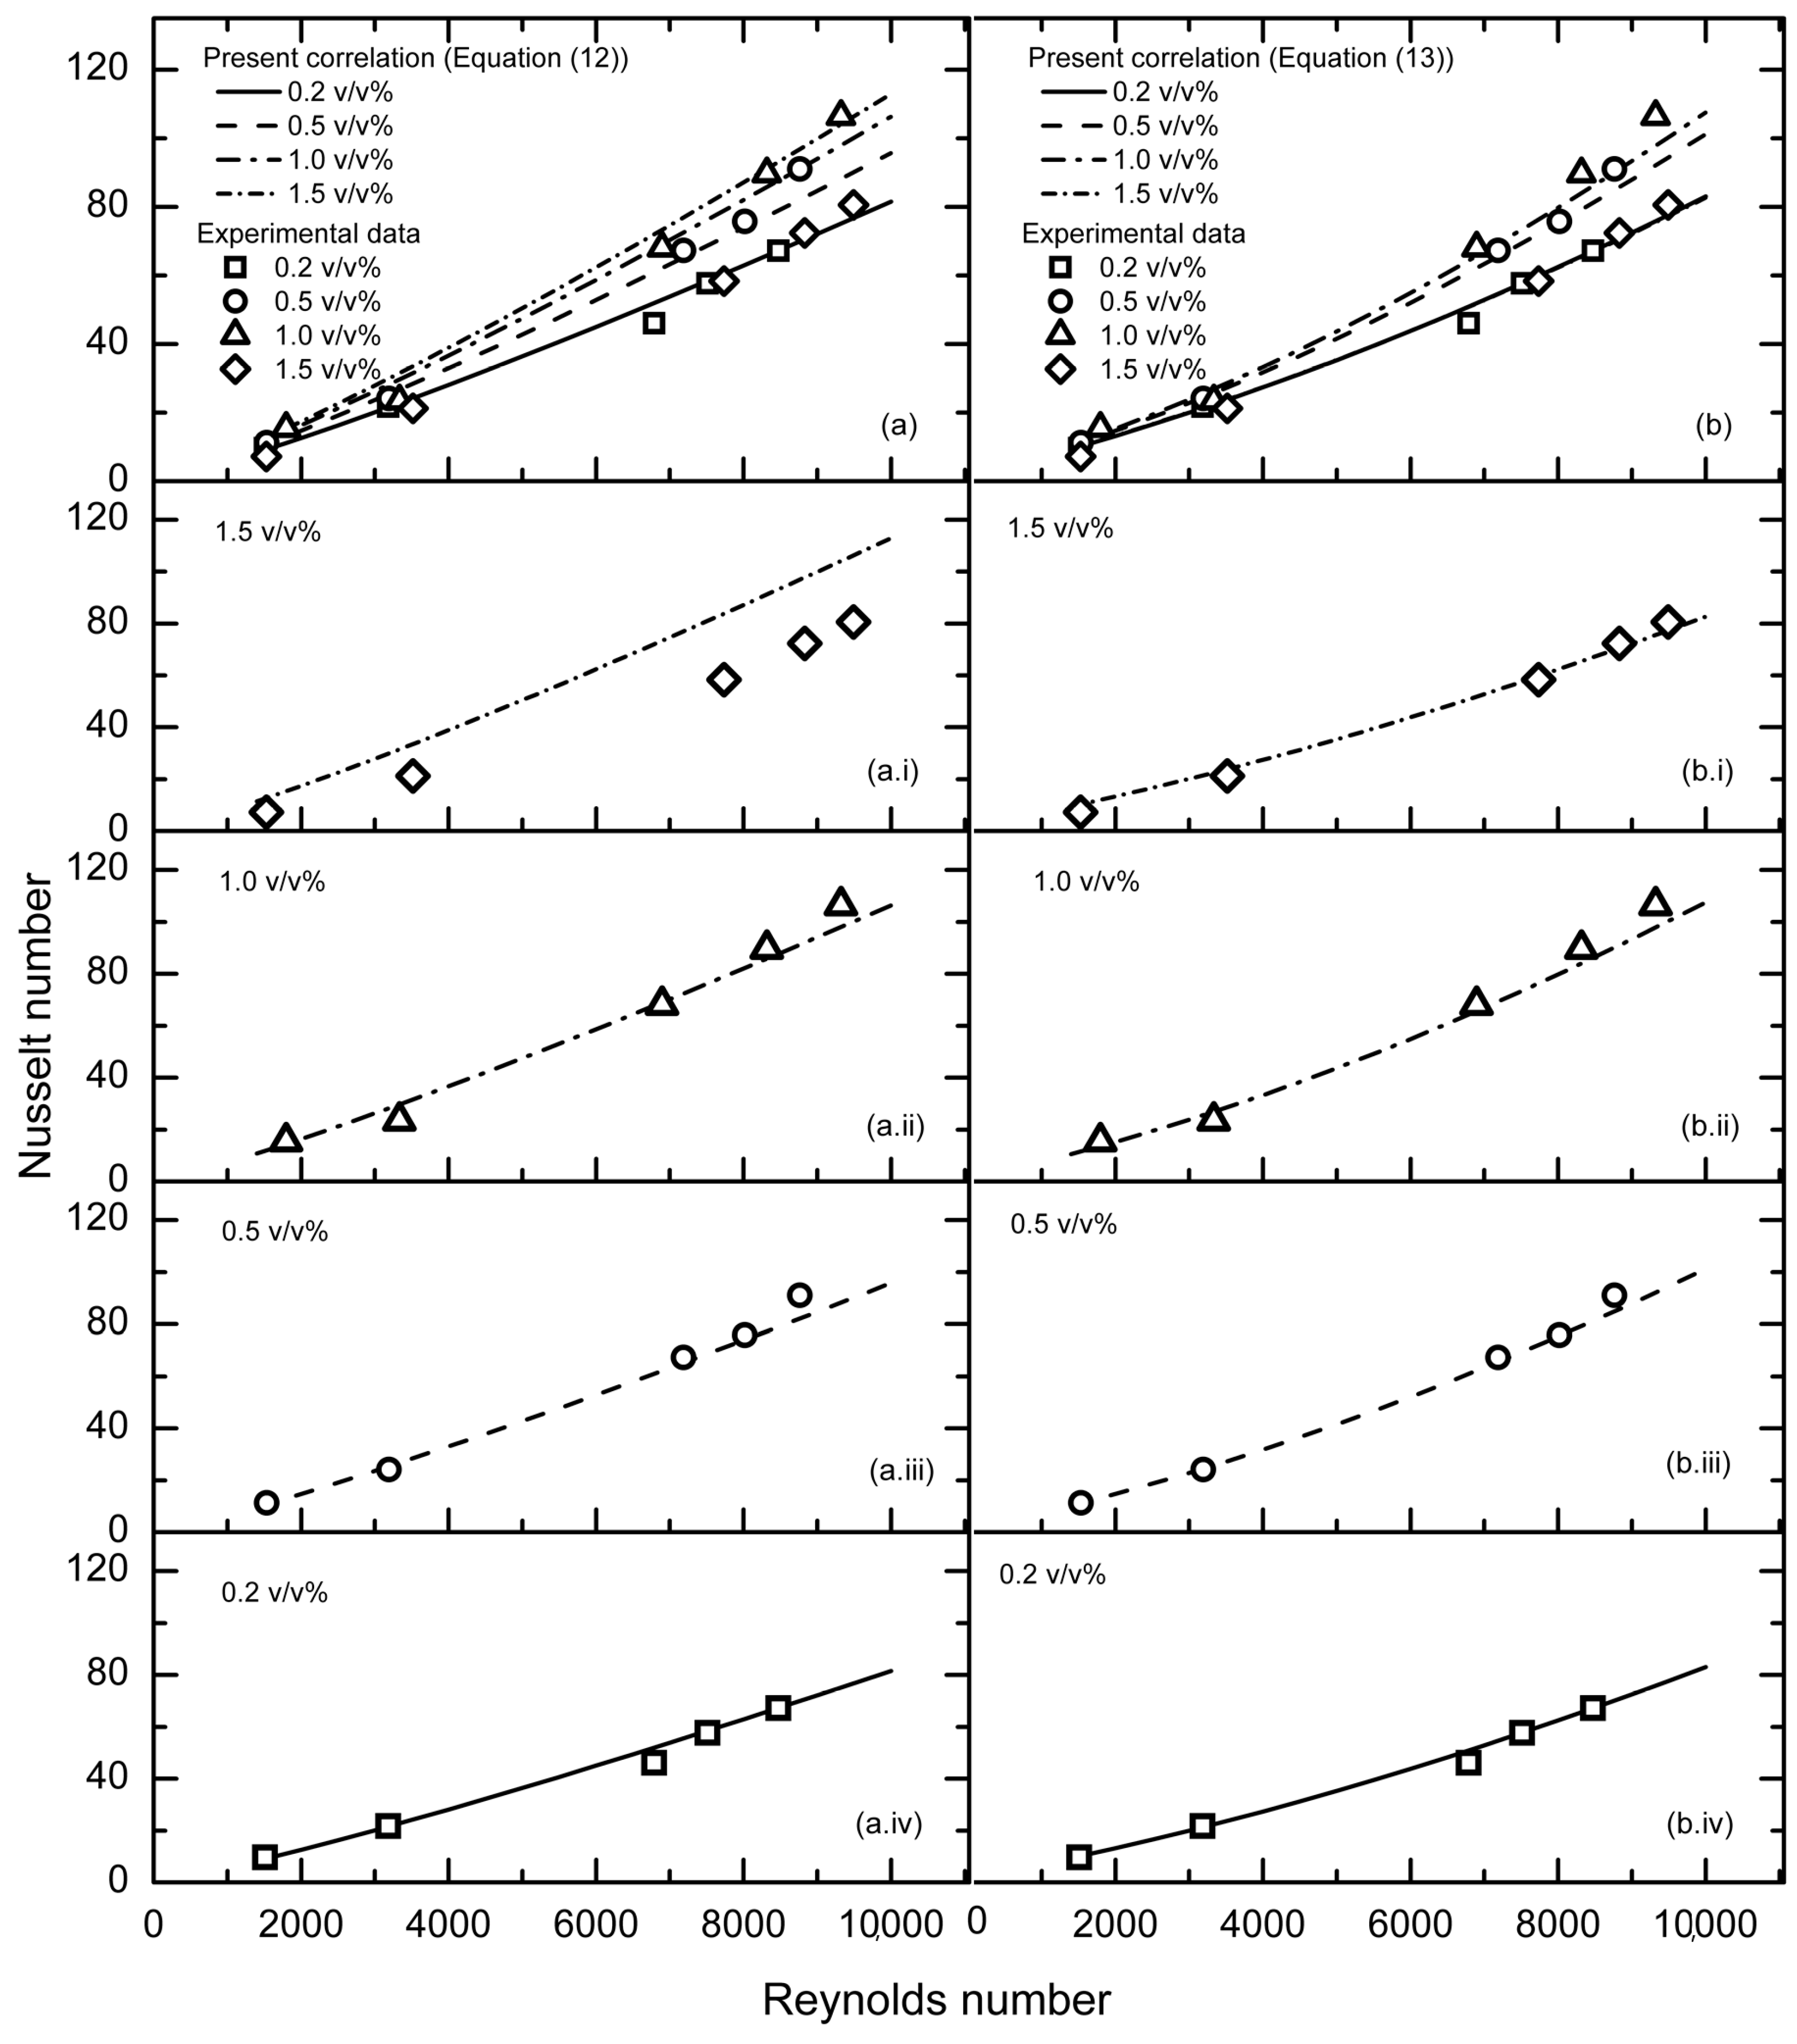
Figure 13.
Plots of versus . The symbols are the experimental data and the curves were calculated by Equation (12) in (a–a.iv) and Equation (13) in (b–b.iv). Cumulative results (a,b), and the results of NFs with an NP concentration of 1.5 v/v% (a.i,b.i), 1.0 v/v% (a.ii,b.ii), 0.5 v/v% (a.iii,b.iii), and 0.2 v/v% (a.iv,b.iv). Legends as shown in (a,b).
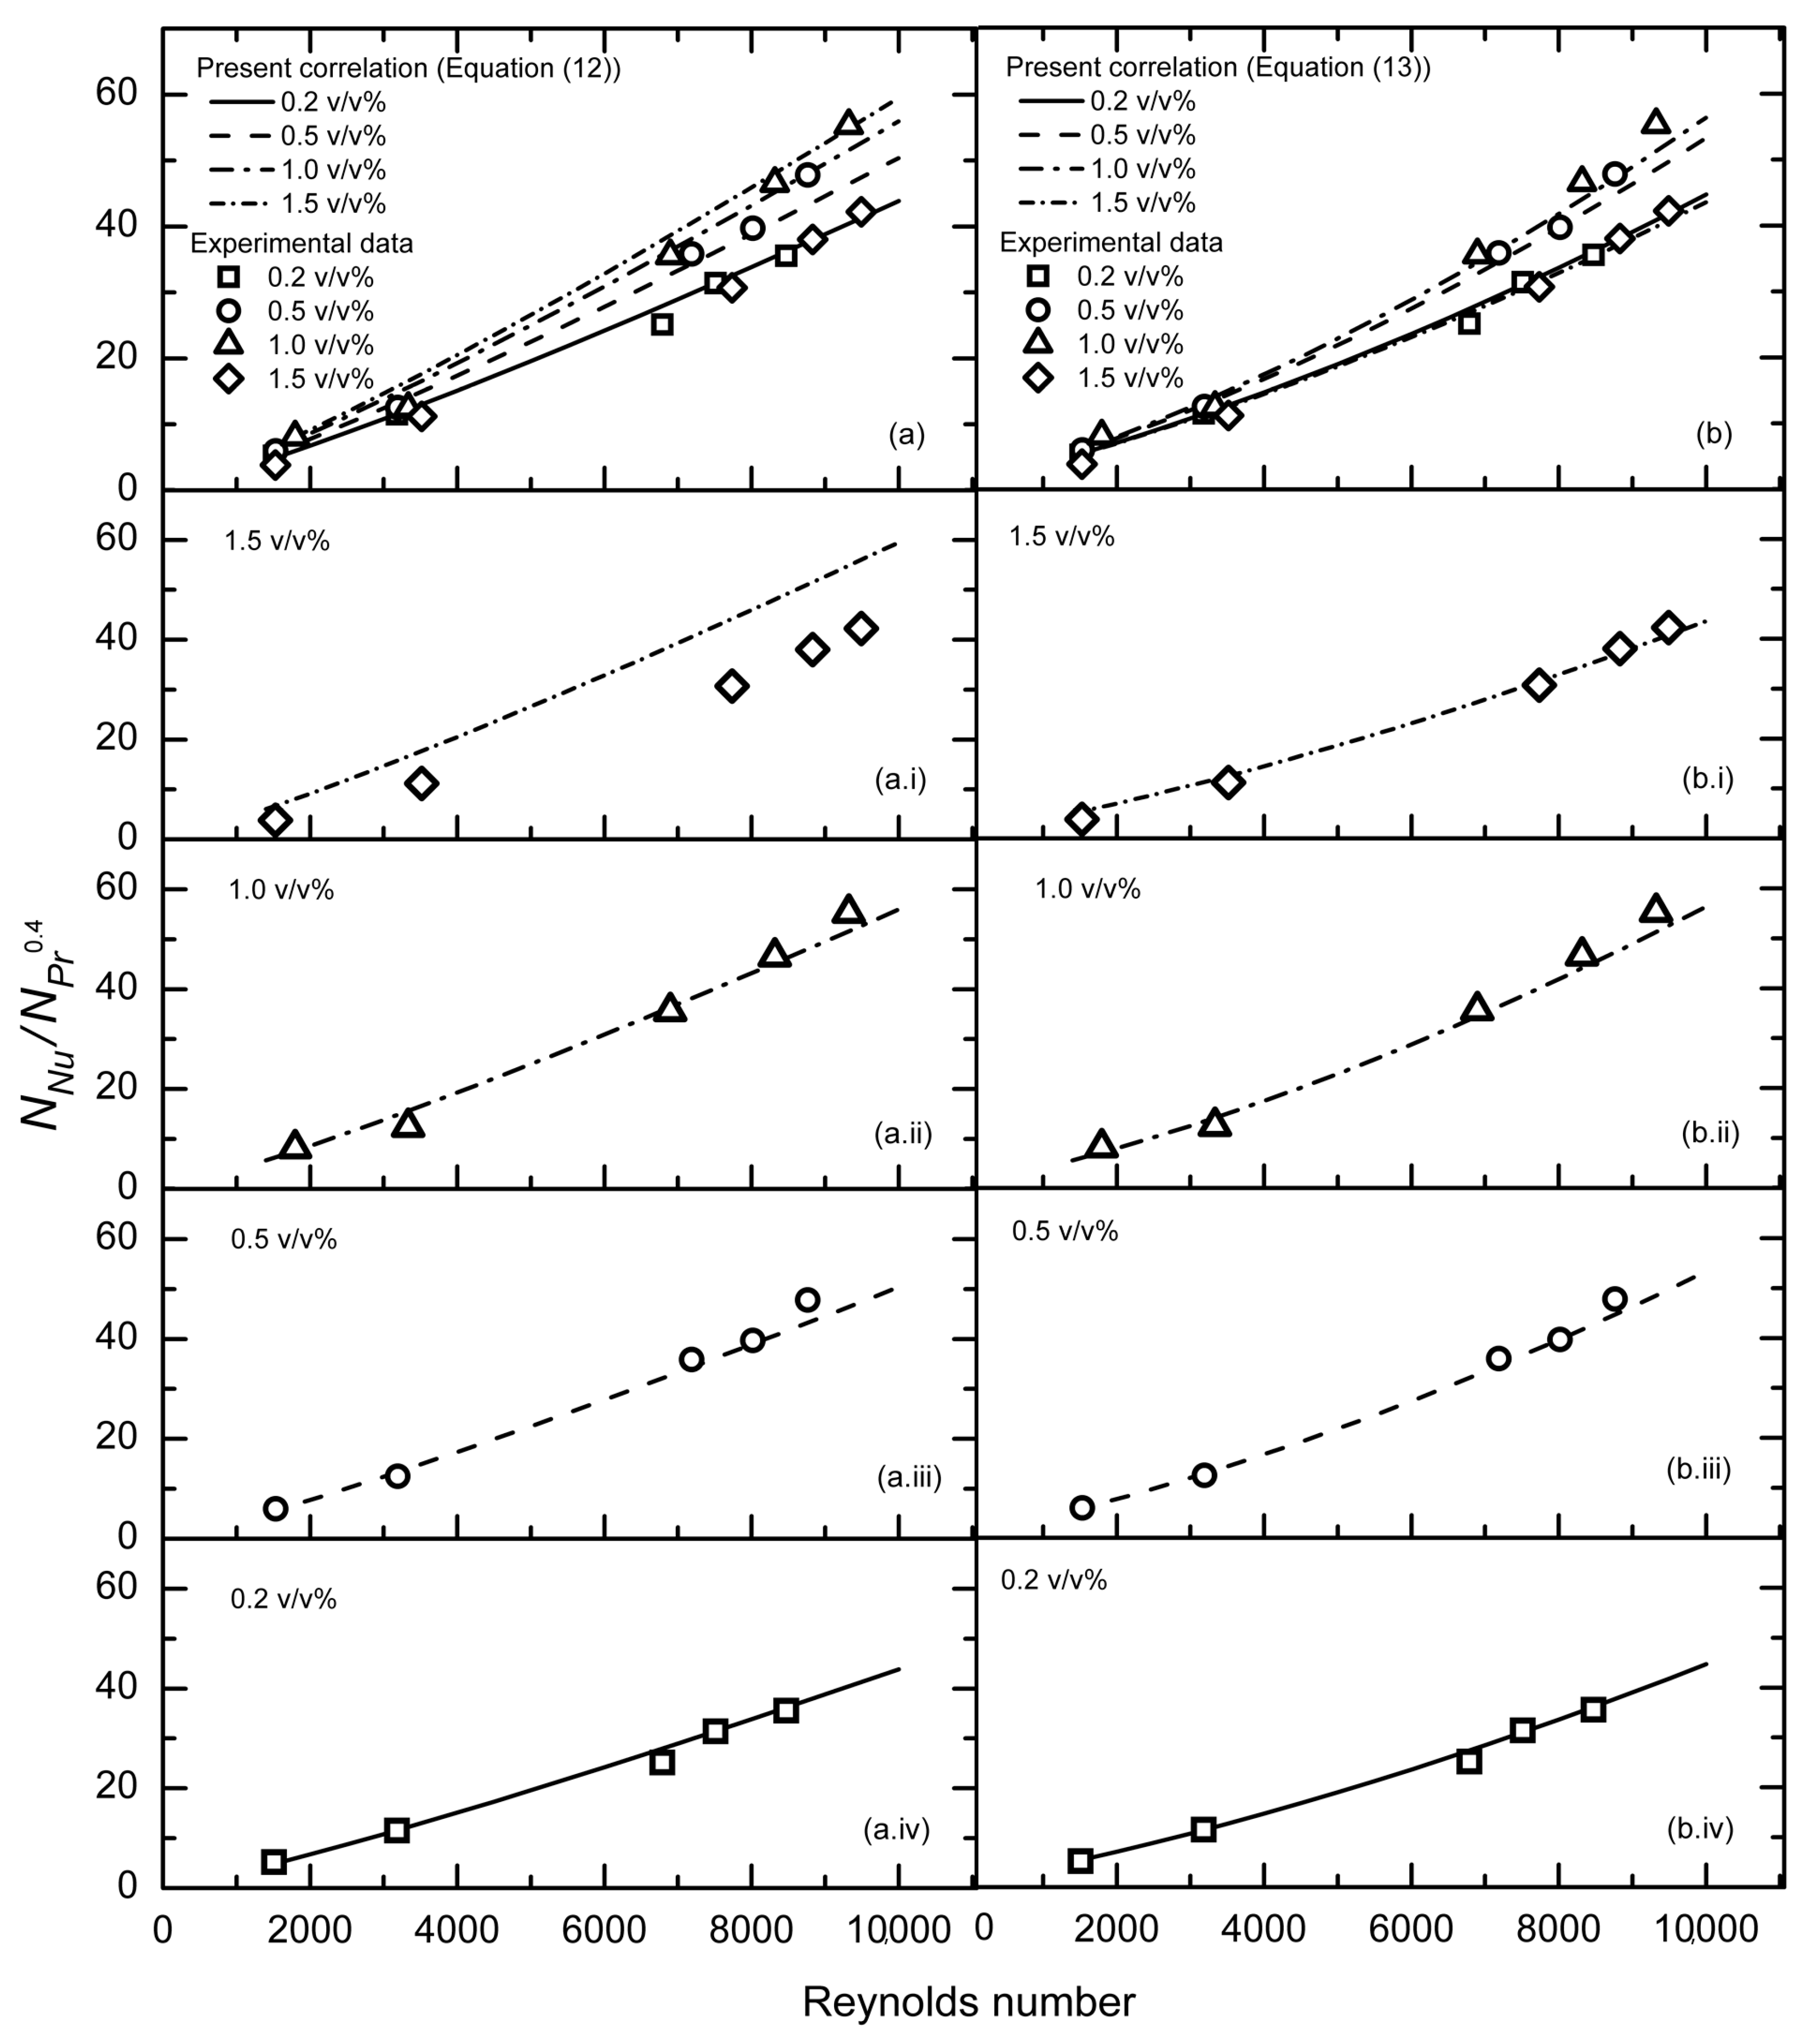
Figure 14.
versus of 1.0 v/v% TiO2–W NF in the coiled flow inverter (CFI) set, obtained in the present experiment (symbols) and predicted by the present correlations (Equation (12) shown using a dashed curve and Equation (13) shown using a short dashed curve), 1.0 v/v% TiO2–W NF tested by Duangthongsuk and Wongwises [54] in a straight tube (Equation (14) shown using a solid curve), and water in a helical coiled tube evaluated by Shchukin [56] (Equation (15) shown using a dotted curve).


Table 1.
Experimental conditions in the present study.
| Parameters | Value |
|---|---|
| TiO2 volume concentration (v/v%) | 0.2–1.5 |
| Reynolds number range | 1400–9500 |
| Working fluid inlet temperature (°C) | 18–32 |
| Heating bath water (°C) | 70 |
Table 2.
Constant values of Equation (13).
| NP Volume Concentration in TiO2–W NFs | Constants | ||
|---|---|---|---|
| 0.002 ≤ ϕ ≤ 0.015 | |||
| 0.000783 | 0.8933 | 0.24 | |
© 2020 by the authors. Licensee MDPI, Basel, Switzerland. This article is an open access article distributed under the terms and conditions of the Creative Commons Attribution (CC BY) license (http://creativecommons.org/licenses/by/4.0/).
Share and Cite
MDPI and ACS Style
Arevalo-Torres, B.; Lopez-Salinas, J.L.; García-Cuéllar, A.J. Experimental Study of Forced Convective Heat Transfer in a Coiled Flow Inverter Using TiO2–Water Nanofluids. Appl. Sci. 2020, 10, 5225. https://doi.org/10.3390/app10155225
AMA Style
Arevalo-Torres B, Lopez-Salinas JL, García-Cuéllar AJ. Experimental Study of Forced Convective Heat Transfer in a Coiled Flow Inverter Using TiO2–Water Nanofluids. Applied Sciences. 2020; 10(15):5225. https://doi.org/10.3390/app10155225
Chicago/Turabian StyleArevalo-Torres, Barbara, Jose L. Lopez-Salinas, and Alejandro J. García-Cuéllar. 2020. "Experimental Study of Forced Convective Heat Transfer in a Coiled Flow Inverter Using TiO2–Water Nanofluids" Applied Sciences 10, no. 15: 5225. https://doi.org/10.3390/app10155225
Note that from the first issue of 2016, this journal uses article numbers instead of page numbers. See further details here.