Article

Optical and Electrochemical Characterization of Nanoporous Alumina Structures: Pore Size, Porosity, and Structure Effect

1
Unidad de Nanotecnología, SCBI Centro, Universidad de Málaga, E-29071 Málaga, Spain
2
Departmento de Física, Facultad de Ciencias, Universidad de Oviedo, E-33007 Oviedo, Spain
3
Laboratorio de Membranas Nanoporosas, Servicicios Científico-Técnicos, Universidad de Oviedo, E-33006 Oviedo, Spain
4
Departmento de Física Aplicada I, Facultad de Ciencias, Universidad de Málaga, E-29071 Málaga, Spain
*
Author to whom correspondence should be addressed.
Appl. Sci. 2020, 10(14), 4864; https://doi.org/10.3390/app10144864
Submission received: 31 May 2020 / Revised: 5 July 2020 / Accepted: 13 July 2020 / Published: 15 July 2020
(This article belongs to the Special Issue Characterization and Application of Nanoporous Materials)

Abstract

:
Three nanoporous alumina structures (NPASs) obtained by the two-step anodization method were optically and electrochemically characterized. Two of the structures were symmetric (NPAS-Sf and NPAS-Ph) and one was asymmetric (NPAS-And); pore size ranged from 10 nm to 100 nm and porosity was 12% in the case of the symmetrical NPAS and 23% and 30% for each surface of the asymmetric structure NPAS-And(A) and (B), respectively. Optical parameters of the studied samples (refraction index and extinction coefficient) were obtained from ellypsometric spectroscopy measurements carried out for wavelengths ranging between 250 nm and 1700 nm (visible and near infrared regions), with the total average refraction indices being 1.54, 1.52, 1.14, and 1.05 for NPAS-Sf, NPAS-Ph, NPAS-And(A), and NPAS-And(B), respectively, which indicates porosity control of refraction index values. Electrochemical characterizations (concentration potential and impedance spectroscopy measurements) were performed with NaCl solutions, and they allowed us to estimate samples of effective fixed charge concentration (1.22 × 10⁻² M, 1.13 × 10⁻³ M, and 1.15 × 10⁻³ M), ion transport numbers, permselectivity (33.0%, 3.1%, and 9.6%), and the electrical resistance of each solution/sample system as well as the interfacial effects associated to solution concentration–polarization, which seems to be mainly controlled by pore size and sample symmetry.

1. Introduction

Nanoporous alumina structures (NPASs) obtained by electrochemical anodization of aluminum foils according to the two-step anodization method [1,2] are of great interest due to their application as nanofilters, drug deliverers, templates for nanoparticles, nanotubes, nanowires, platforms for sensors, and medical devices [3,4,5,6,7,8,9]. Lately, other applications of NPASs such as spintronics, solar cells, light emitting diodes, and photonic crystals have been studied [10,11,12,13,14,15,16]. Most of these applications are related to the high structural regularity of NPAS, which exhibit almost ideal cylindrical pores with narrow pore radius distribution and without tortuosity, but their thermal and chemical resistance are also of great interest when used as nanofilters or membranes due to their stability under cleaning protocols commonly used to reduce fouling (adsorption/deposition of transported molecules or particles), which is the main problem in such applications [17,18]. The two-step anodization method creates samples with a wide range of pore radii (rp ranging between 10 nm and 200 nm) and interpore distances (Dint, between 20 nm and 1000 nm) depending on the electrolyte solution, applied voltage, and temperature used during the first step, while pore length (lp) and film thickness, which usually range between 10 µm and 100 µm, are basically associated to the second anodization step duration [2]. Although small differences in pore radii of both NPAS surfaces can exist due to the etching process needed for back pore opening, they are considered symmetric structures [19]. However, the use of asymmetric commercial alumina membranes for diffusive transport of specific cations (terbium, americium, europium…), as well as NPASs with sequential gradation of pore radii and porosity for improving retention efficiency in drug delivery or gas permeation reduction have also been reported [20,21,22].
Another significant characteristic of NPASs is the easy modification of geometrical and/or functional parameters by surface coverage/modification using different techniques such as dip coating, chemical vapor deposition, or atomic layer deposition (ALD), which can be selected depending on layer characteristics or specific NPAS application [23,24,25,26,27,28]. Particularly, surface coverage of NPASs with an Al2O3 layer by the ALD method for pore size/porosity reduction was performed, and these results indicate only a small effect on diffusive ionic transport as determined by concentration potential measurements, but surface coverage with layers of other ceramic oxides (SiO2, TiO2, Fe2O3, or ZnO) seems to affect electrochemical transport parameters [26,28,29,30]. Moreover, NPASs coverage with monolayers and bilayers of different ceramic oxides seems to modify characteristic optical parameters such as the refraction index or the extinction coefficient of the original sample according to spectroscopic ellipsometry (SE) results [29,30]. In this context, changes in different optical characteristics of NPASs associated to differences in their geometrical parameters (pore size, porosity, and thickness) have also been reported [15,31,32,33].
SE is a non-destructive and non-invasive technique commonly used for optical characterization of thin films, since it allows for the estimation of modifications related to both film surface and bulk phase by measuring changes in light polarization due to its reflection from a solid structure, although it has also been employed for optical analysis of thicker samples (around 15 μm) [34]. SE results allow for the estimation of different optical parameters (refraction index, extinction coefficient, or real and imaginary parts of the dielectric constant) as well as layer thickness [34,35].
In this work, the effect of pore radii/porosity and asymmetry on both optical and electrochemical characteristic parameters of NPASs were analyzed. For that reason, three different NPASs of similar thickness (~60 μm) were studied, one commercial asymmetric membrane (AnodiscTM, with nominal pore radii of 10 nm for one surface and 100 nm for the opposite surface) and two experimental samples with symmetrical structure and average pore radii around 10 nm (NPAS-Sf sample) and 100 nm (NPAS-Ph sample), similar to those corresponding to each surface of the commercial sample. Optical characterization was performed by spectroscopic ellipsometry (SE) measurements, and the comparison of results obtained for the different samples can give information on the influence of pore size/porosity and sample asymmetry on samples optical behavior. For that reason, chemical surface analysis by X-ray photoelectron spectroscopy (XPS) was also carried out. The refraction index and extinction coefficient were determined from SE results. Moreover, electrochemical characterization of the three selected samples by concentration potential measurements, using NaCl solutions at different concentrations, was also performed to estimate the effect of the films’ geometry and asymmetry on characteristic electrochemical parameters such as ionic transport numbers and permselectivity. The obtained results, showing the predominance of porosity or pore size on optical or electrochemical parameters, respectively, might be of interest for different NPASs applications.

2. Materials and Methods

2.1. Materials

Three nanoporous alumina structures with similar thickness (~60 μm) were studied: an asymmetric commercial membrane (AnodiscTM 25 from Whatmann, Maidstone, UK, sample NPAS-And) and two symmetric structures manufactured in the Nanoporous Membranes Laboratory of the Nanotechnology Division, Universidad de Oviedo, Spain (samples NPAS-Sf and NPAS-Ph).
NPAS-Sf and NPAS-Ph samples were fabricated by the two-step aluminum anodization method [1] using an electrochemically polished high purity Al foil (Al 99.999%, Goodfellow, Huntingdon, UK), which was cleaned by sonication in isopropanol and ethanol prior to the first anodization process (see Figure 1a). The NPAS-Sf sample was obtained by establishing a constant anodization potential of 25 V between the Al foil and a Pt counter-electrode in a 0.3 M sulfuric acid solution, while these parameters in the case of the NPAS-Ph sample were 0.1 M phosphoric acid and 195 V. The electrolyte temperature was maintained around 1 °C by an external recirculation bath. The first anodization step lasted for 24 h, guaranteeing the development of highly ordered nanopore domains following a close-packed hexagonal arrangement. The aluminum oxide layer during the first anodization step was then removed by selective chemical etching in an aqueous solution of 0.18 M CrO3 and 0.61 M phosphoric acid, respectively. The as-obtained nanostructured Al substrate was exposed to a second anodization step until a nanoporous structure with a thickness of around 60 µm was obtained (Figure 1b). The remaining un-oxidized Al substrate at the bottom of the samples was selectively dissolved by submitting it to a wet chemical etching step (0.14 M CuCl2 and 4 M HCl aqueous solutions). The etching was stopped when the samples became transparent, thus evidencing the complete removal of the Al substrate. This procedure was carried out in an area of approximately 1 cm2 placed at the center of the sample, in order to keep a surrounding Al ring that allowed for straight-forward handling of the 60 micron thick samples (Figure 1c). Finally, the alumina barrier layer that occluded pore bottoms was dissolved by floating the samples in a 10 wt % phosphoric acid solution at room temperature under static conditions, which allowed for opening of the nanopores by the two sides. The complete opening of the barrier layer (Figure 1c) was indicated by the fact that the etching solution was able to flow through the nanopores, which wets the upper surface of the samples.

2.2. Chemical Surface and Morphological Characterizations

Chemical characterization of the samples surfaces was performed by analyzing X-ray photoelectron spectroscopy (XPS) spectra. A Physical Electronics Spectrometer VersaProbe II (Physical Electronics, Chigasaki, Japan) spectrometer using monochromatic Al-Kα radiation (200 µm 49.1 W, 15 kV, and 1486.6 eV) with a hemispherical multichannel detector was used for core-level signals analysis. The sample spectra were recorded with a constant pass energy value at 29.35 eV, using a 200 µm diameter circular analysis area, at a take-off angle of 45°. The diameter of the analyzed area was 720 µm, and each spectral region was scanned several times (low noise ratio). The residual pressure in the analysis chamber was maintained below 5 × 10⁻⁷ Pa during data acquisition, and binding energies (accurate ± 0.1 eV) were determined with respect to the position of the adventitious C 1s peak at 285.0 eV. The PHI ACCESS ESCA-V 8.0 F software package was used for data acquisition and analysis [36].
Morphological characterization of the samples surfaces (top and bottom) and cross-sections was performed by analyzing scanning electron microscopy (SEM) micrographs obtained using a JEOL-5600 Scanning Microscope (Akishima, Tokyo, Japan), working at a voltage of 20 kV and equipped with an Energy Dispersive X-ray Spectrometer (EDX) INCA Energy 200 (Oxford Instruments, Abingdon, UK), after being coated with a thin gold layer by means of a sputtering (Polaron SC7620, Quorum Technologies, Laughton, UK) process to make them conductive. Geometrical parameters (nanopore size and spatial arrangement) were determined by using ImageJ software (v 1.50i) for image analysis [37].

2.3. Optical Characterization

Spectroscopic ellipsometry (SE) measurements, directly performed on the samples without employing any other substrate, were carried out with a spectroscopic ellipsometer (GES-5E, Sopra-Semilab, Budapest, Hungary) using wavelengths in a range from 250 nm to 1700 nm, covering visible and near infrared (NIR) regions, at an incident angle of 70°. Due to the asymmetric structure of the NPAS-And sample, SE measurements were performed for both surfaces.
Ellipsometry measures changes in light polarization due to its reflections or transmission across a solid structure. Measured angles, Ψ and Δ, are related to the ratio of Fresnel reflection coefficients, rp and rs, of polarized light (p for parallel and s for perpendicular) by [38]:
tan(Ψ)eiΔ = rp/rs
SEA (accuracy ± 0.0001) software from Semilab (Budapest, Hungary) was used for data fit by considering Fresnel equations, Snell law, and complex refractive index n ˜ = n + i k . A scheme of SE measurements as well as expressions for Fresnel reflection coefficients are given in the Supplementary Information (Figure S1).

2.4. Electrochemical Characterization

The electrochemical test-cell that was used for electrochemical characterization (concentration potential and impedance spectroscopy measurements) is schematized in the Supplementary Information (Figure S2a). The studied samples were placed between both half-cells, which were filled with NaCl aqueous solutions, stirred at 540 rpm to minimize interfacial effects, and a reversible Ag/AgCl electrode was introduced in each half-cell. Measurements were carried out at room temperature (25 ± 2 °C) and standard pH (5.8 ± 0.3). Figure S2b in the Supplementary Information shows a scheme of solid sample/electrolyte electrical distribution and interfacial effects.
Concentration potentials (ΔE) measurements were performed with different NaCl solutions (concentrations cc and cv) in each half-cell (cc = 0.01 M for all measurements, while cv ranged between 0.002 M and 0.1 M), and the Ag/AgCl electrodes were connected to a digital voltmeter (Yokohama 7552, 1 GΩ input resistance, Tokyo, Japan) to measure electrical potential values [39]. When reversible electrodes are used in this kind of measurements, ΔE values also include the electrode potential, ΔΦelec = (RT/zF)ln(cf/cv)), where z represents the valence of reversible ion, while R and F are the gas and Faraday constant and T is the temperature of the system [40]. Consequently, the nanostructure contribution can be determined by subtraction of electrode potential to measured values: ΔΦ = ΔE − ΔΦelec. The analysis of ΔΦ values was carried out by taking into account potentials for both the solution/sample interface and diffusion in the pores, plus electroneutrality condition, [26] and it is described in detail in Section 3.3. Electrochemical Characterization.
Electrochemical impedance spectroscopy (EIS) measurements were carried out by connecting the electrodes to a Frequency Response Analyzer (FRA, Solartron 1260, Farnborough, England) controlled by a computer. Up to 100 different frequencies ranging between 1 Hz and 107 Hz at maximum voltage of 0.01 V were recorded for the system: electrode//0.002 M NaCl solution//NPAS sample//0.002 M NaCl solution//electrode [41]. EIS data were corrected by software and the influence of connecting cables and other parasite capacitances. ZView 2 data analysis program (Scribner, Southern Pines, NC, USA) was used for electrical parameters determination.
The impedance (Z) is a complex number, Z = Zreal + j Zimg, and real (Zreal) and imaginary (Zimg) parts can be separately obtained by algebra rules. These components are related to the transport of charge across the system (electrical resistance, R) and charge storage (capacitance, C) by the following expressions:
Zreal = R/[1 + (ωRC)2]
Zimg = −ωR2C/[1 + (ωRC)2]
where ω = 2πf is the angular frequency. The analysis of the impedance data was performed by using the Nyquist plot in the complex plane (−Zimg versus Zreal), where a parallel resistance–capacitance circuit (RC) corresponds to a semi-circle with intercepts on the Zreal axis at R (ω→∞) and Ro (ω→0), with R = 0.5(Ro–R) being the resistance of the system, while the maximum of the semi-circle occurs at such a frequency that ωRC = 1 [42]. This description is valid for systems with a unique relaxation time (homogeneous systems), while a depressed semi-circle due to a distribution of relaxation times is obtained in the case of non-homogeneous systems [42,43].

3. Results and Discussion

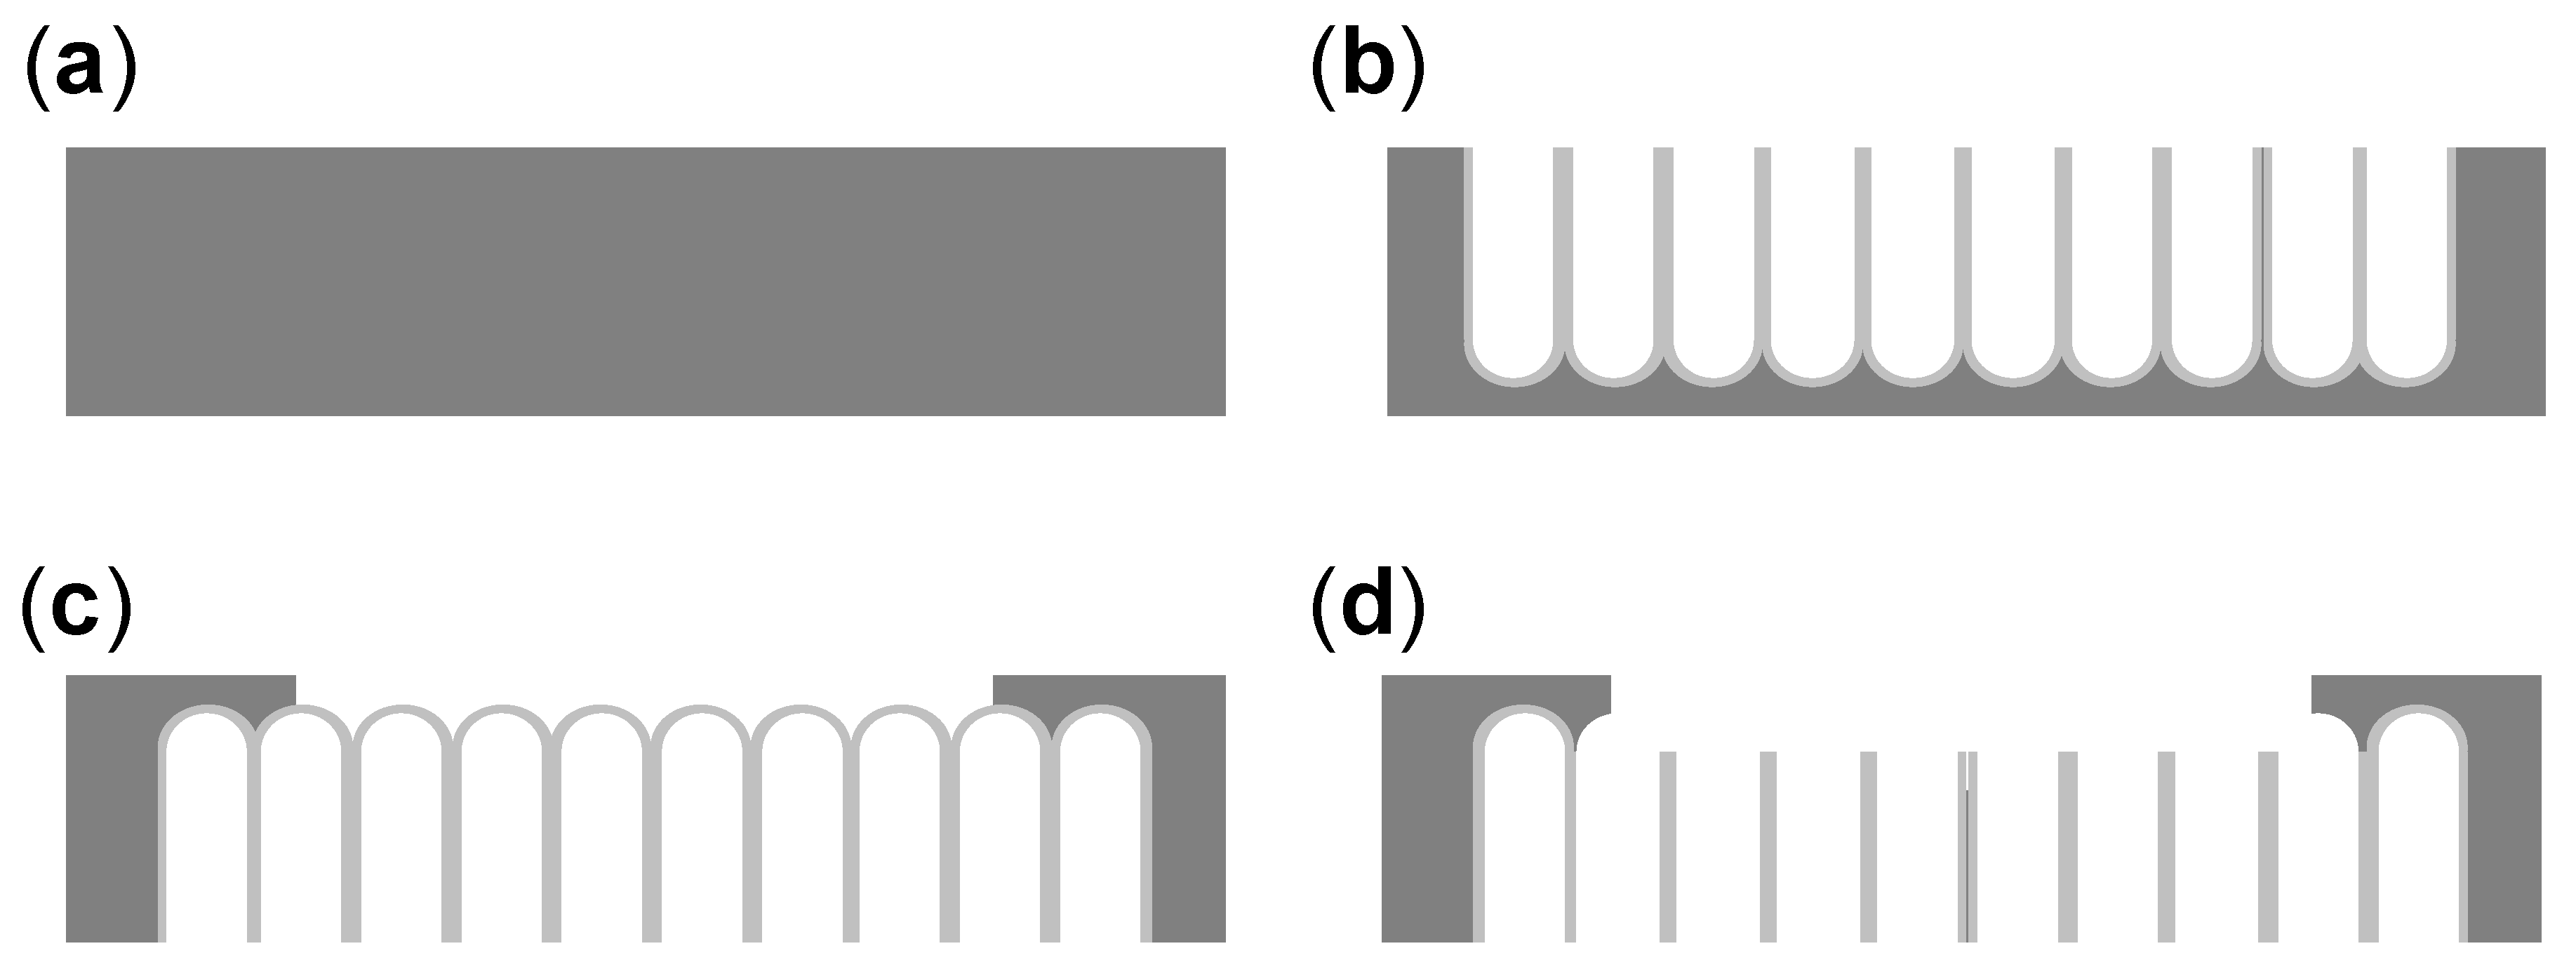
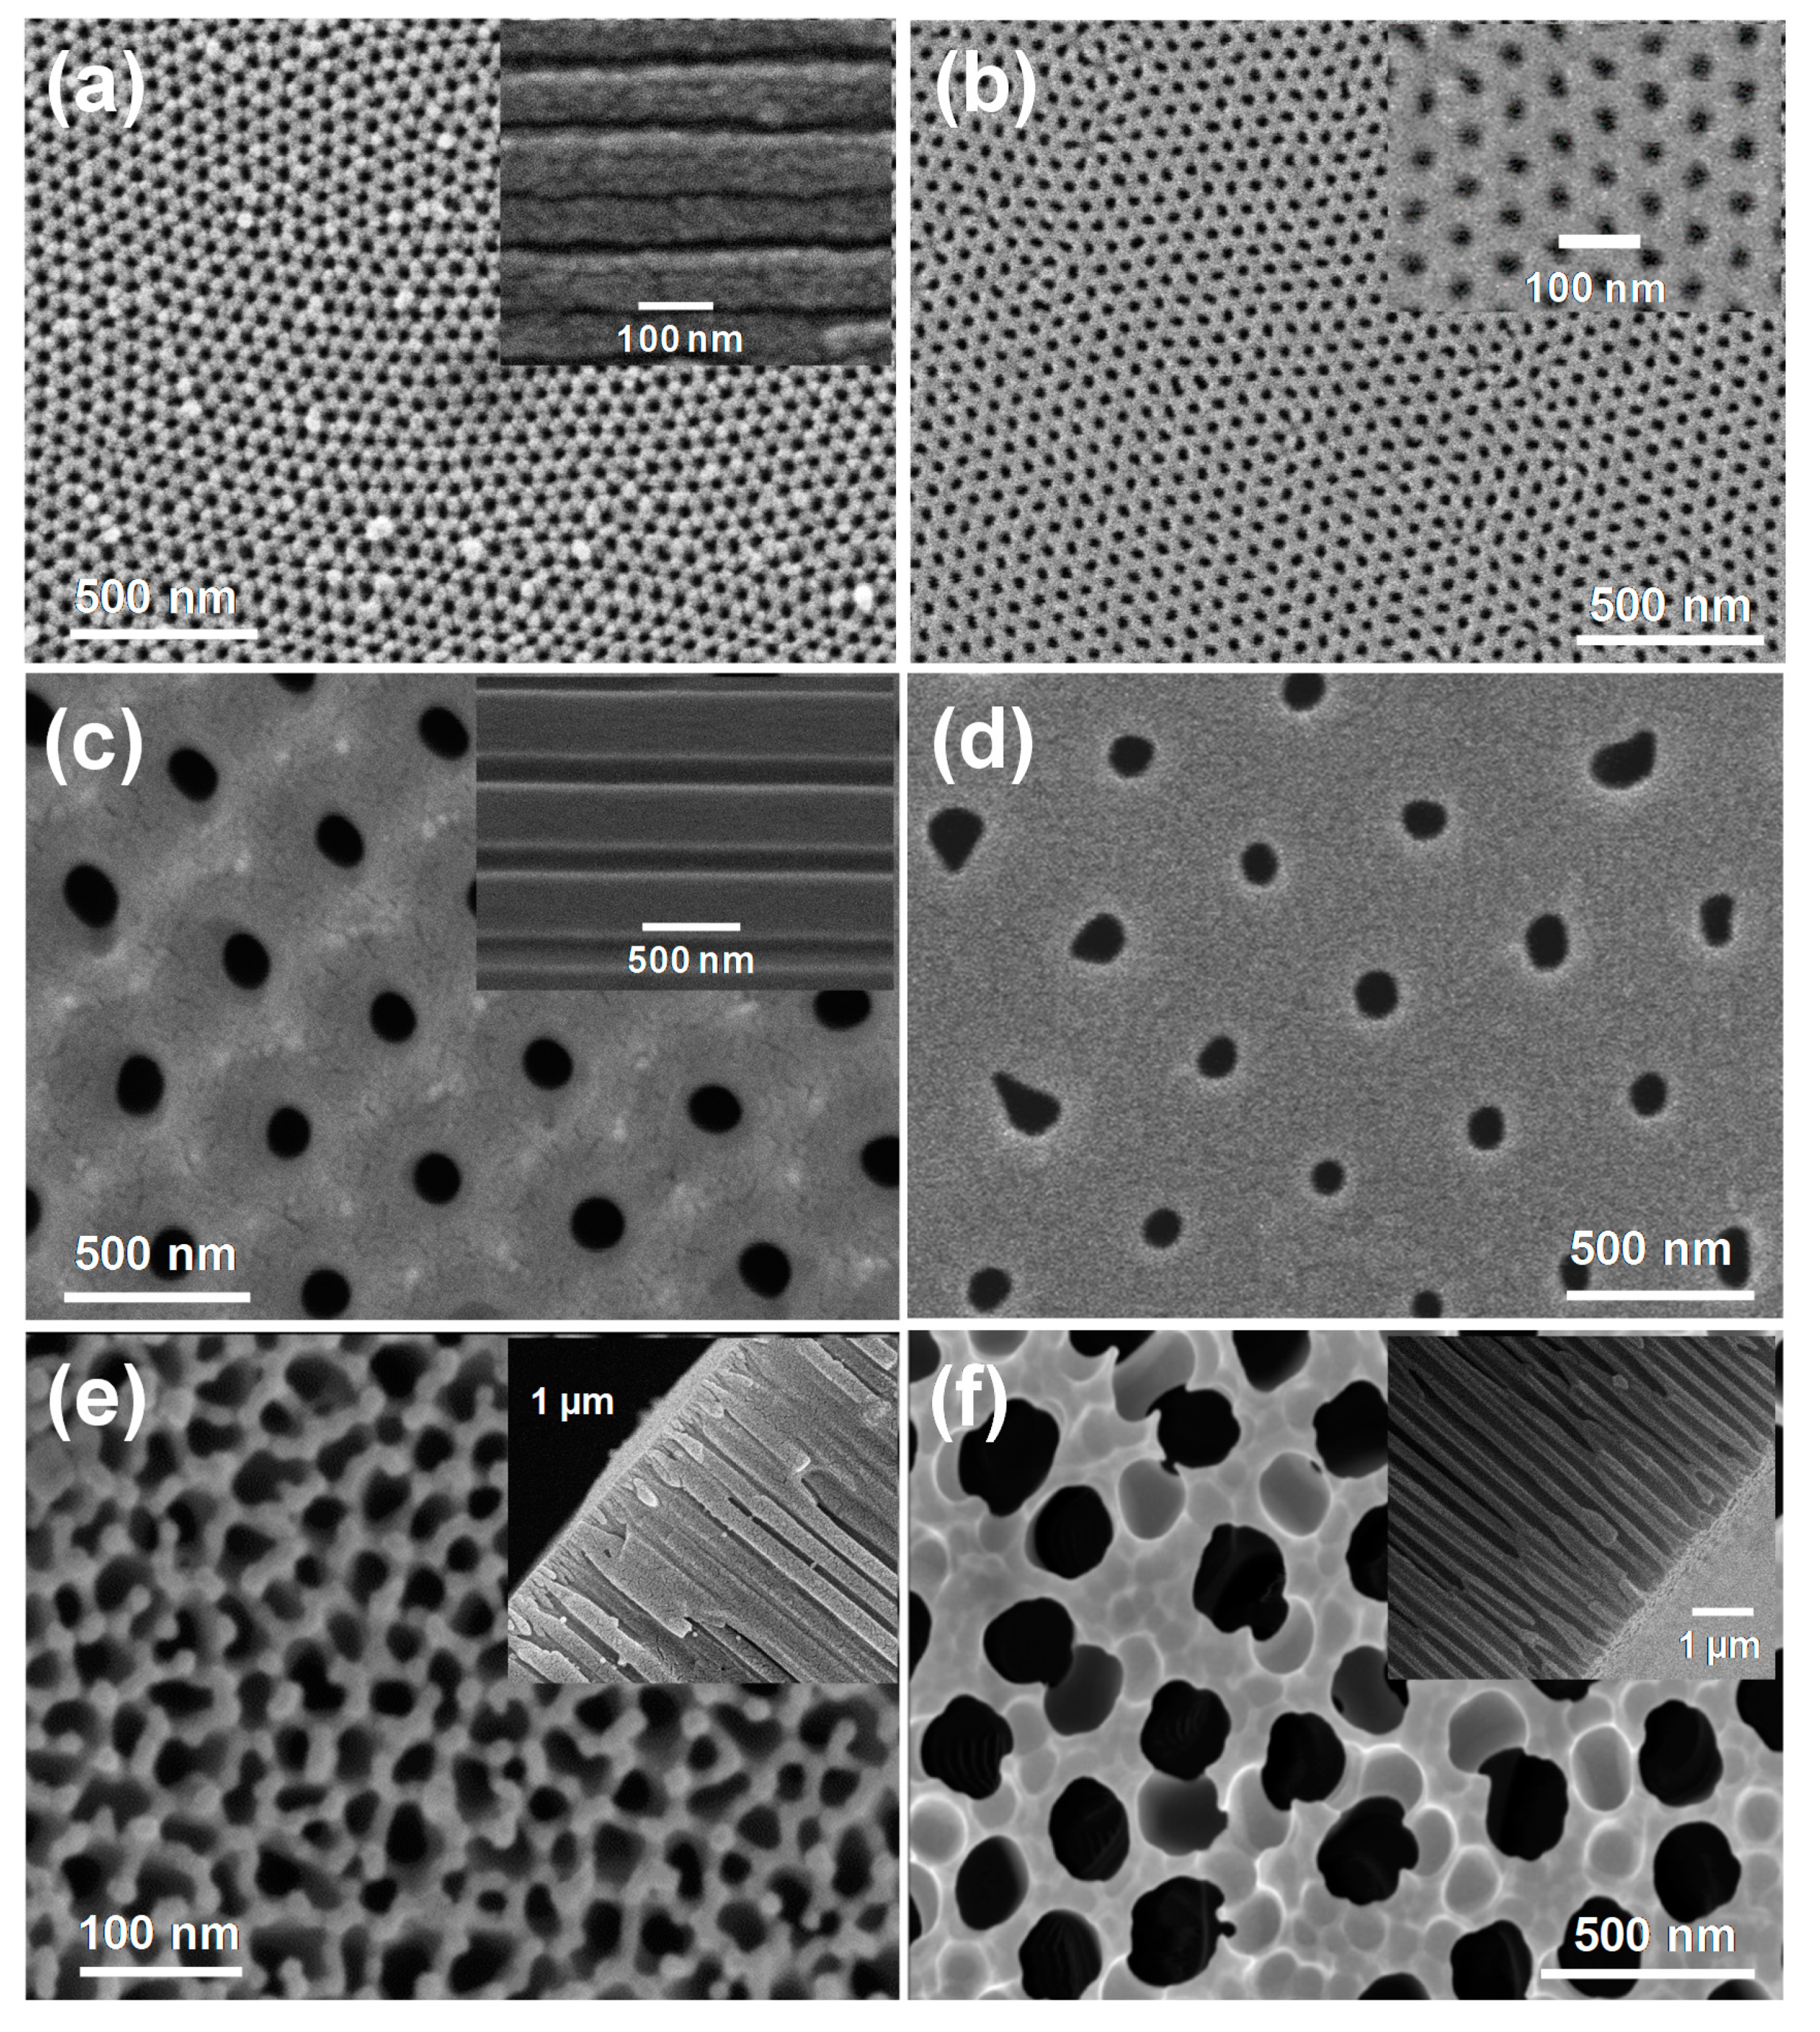
3.1. Chemical Surface and Morphological Characterizations

Chemical characterization of NPASs surfaces was performed by XPS. The analysis of the core level spectrum obtained for each element found on the sample surface permits us to estimate its atomic concentration percentage (A.C. (%)). Table 1 presents the average values obtained for the main chemical elements found as well as the corresponding O/Al ratio. The presence of non-characteristic sample elements, such as nitrogen and carbon (this latter in a high percentage), is associated to both environmental [44] and fabrication process contaminations, with the latter being the reason for sulphur and phosphorus presence (phosphoric acid solutions are employed as etching agents for the removal of the oxide barrier layer); small percentages (≤0.6%) of other non-characteristic elements (N, Cr,…) were also found. Moreover, slight oxidation of the samples surfaces was also observed when comparing the experimental O/Al ratio and the theoretical one ((O/AL)T = 1.5).
Surface morphology of the NPASs was determined by analyzing SEM micrographs such as those shown in Figure 2. Pore radii distributions, obtained by computer-assisted image analysis [37], are displayed in the Supplementary Information (Figure S3). It is worth noting that experimental NPAS-Sf and NPAS-Ph samples displayed a highly ordered hexagonal pore arrangement and a monodispersive pore radii distribution, whereas the pore arrangement in the Anodisc commercial sample was randomly distributed, and it displayed two or more peaks in the pore size distribution at both sides, which might be associated to these pores that are occluded or stop growing during the membrane fabrication process. Furthermore, experimental NPAS samples only showed small differences in pore radii for top and bottom surfaces according to their symmetric structure, as was already reported in previous works [19,45,46,47], but they were significantly different in the case of the asymmetric Anodisc sample. Values of morphological parameters (pore radii (rp), interpore distance (Dint), and porosity (Θ = (2π/√3)(rp/Dint)2) [48] obtained for each NPAS are summarized in Table 2, where average values of rp and Θ are indicated in the case of NPAS-Sf and NPAS-Ph samples. For these two experimental samples, the obtained values were in good agreement with those previously reported for nanoporous alumina layers synthesized under similar conditions, and they showed similar porosities of around 10% [2,48]. However, due to the random pore distribution and lower geometrical reproducibility of the NPAS-And sample, precision in the estimated values of the morphological parameters for each opposite surface was remarkably lower than those measured for the highly ordered NPAS samples. In this particular sample, alternative techniques based on gas penetration seem to confirm our results, indicating an average porosity of 29.3 ± 0.5% for similar NPAS-And samples [49], thus being consistent with our estimations based on SEM image analysis. Finally, it should be pointed out that thickness of the different NPASs under study were approximately constant at around 60 µm.

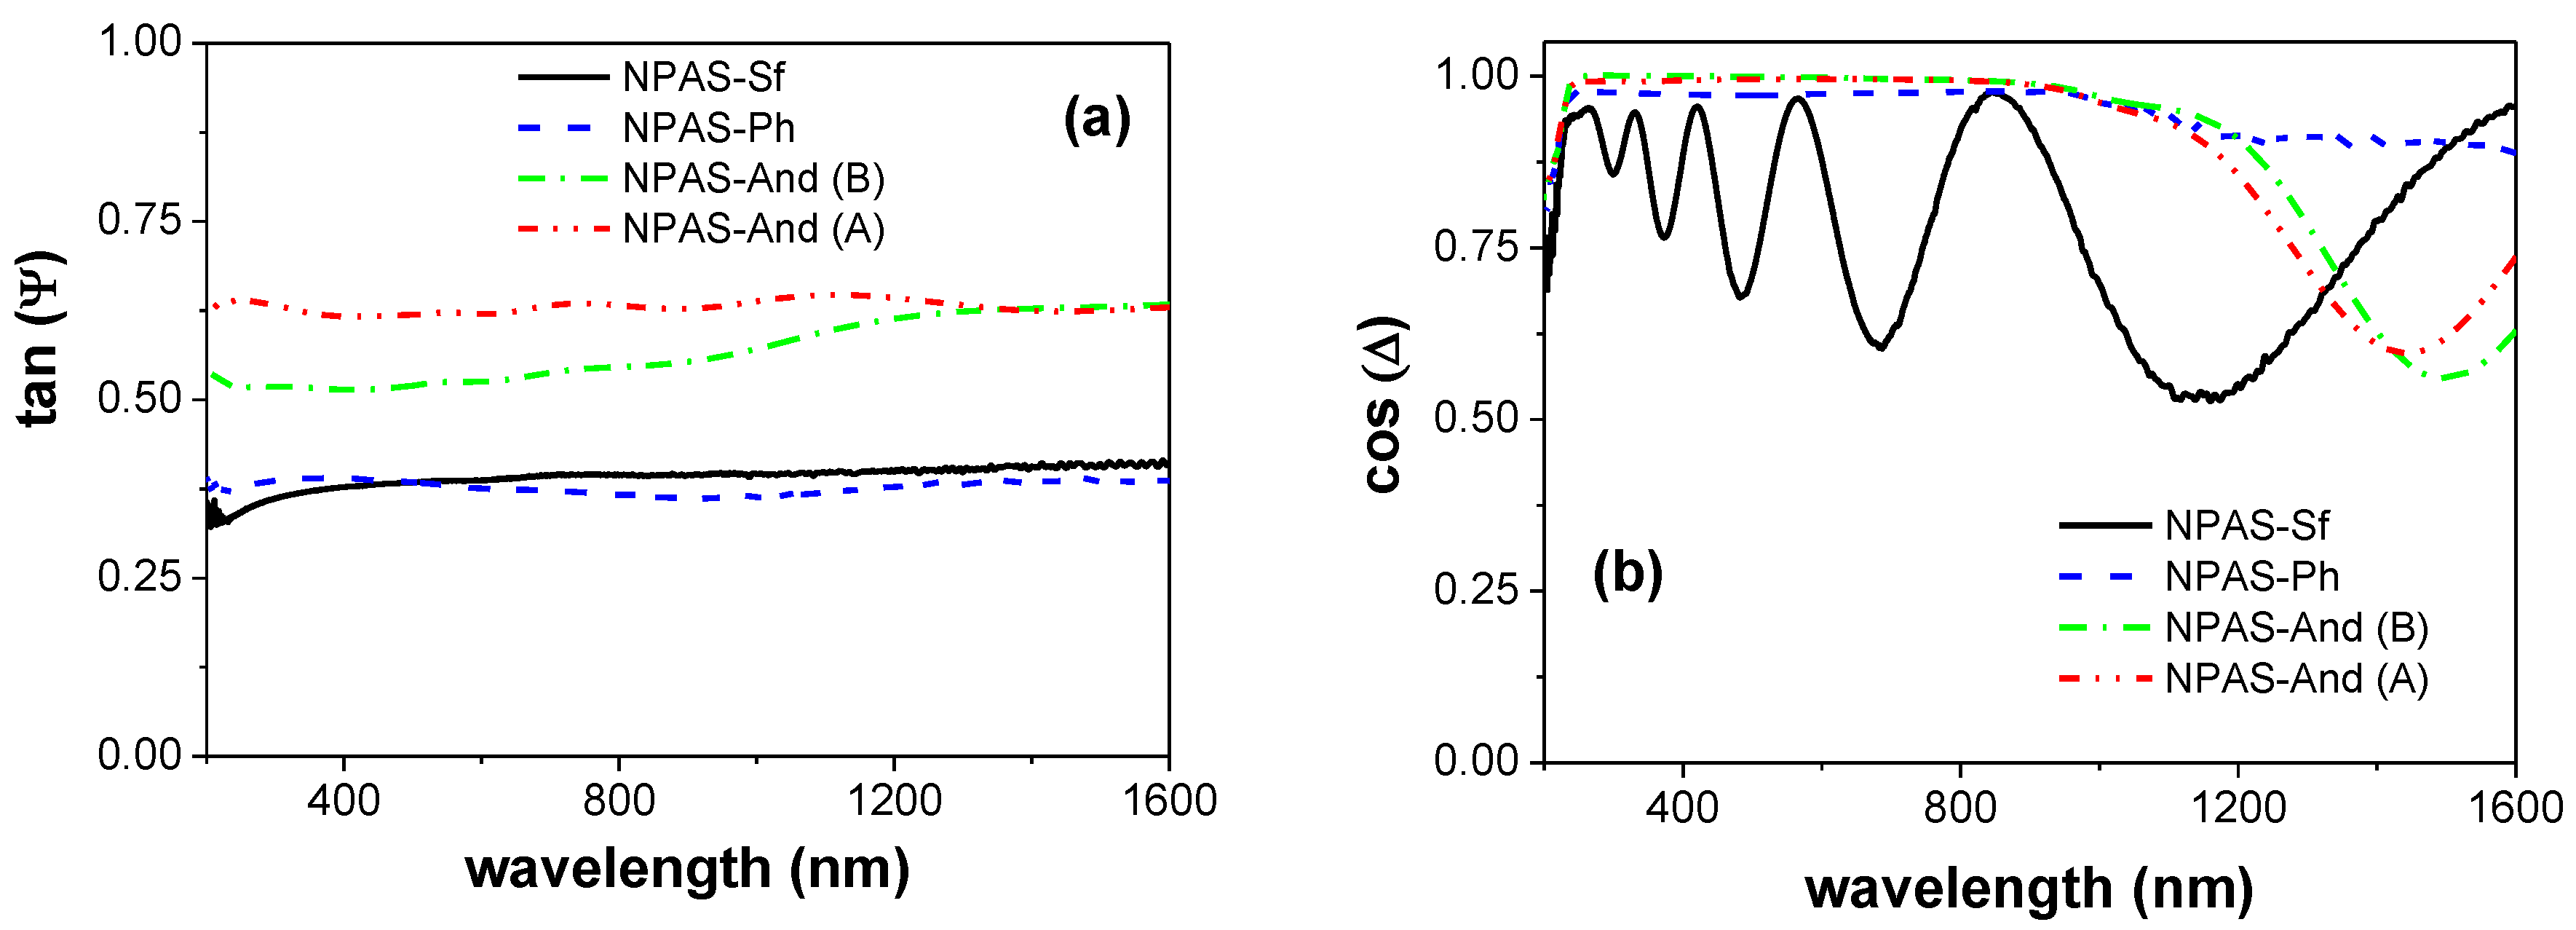
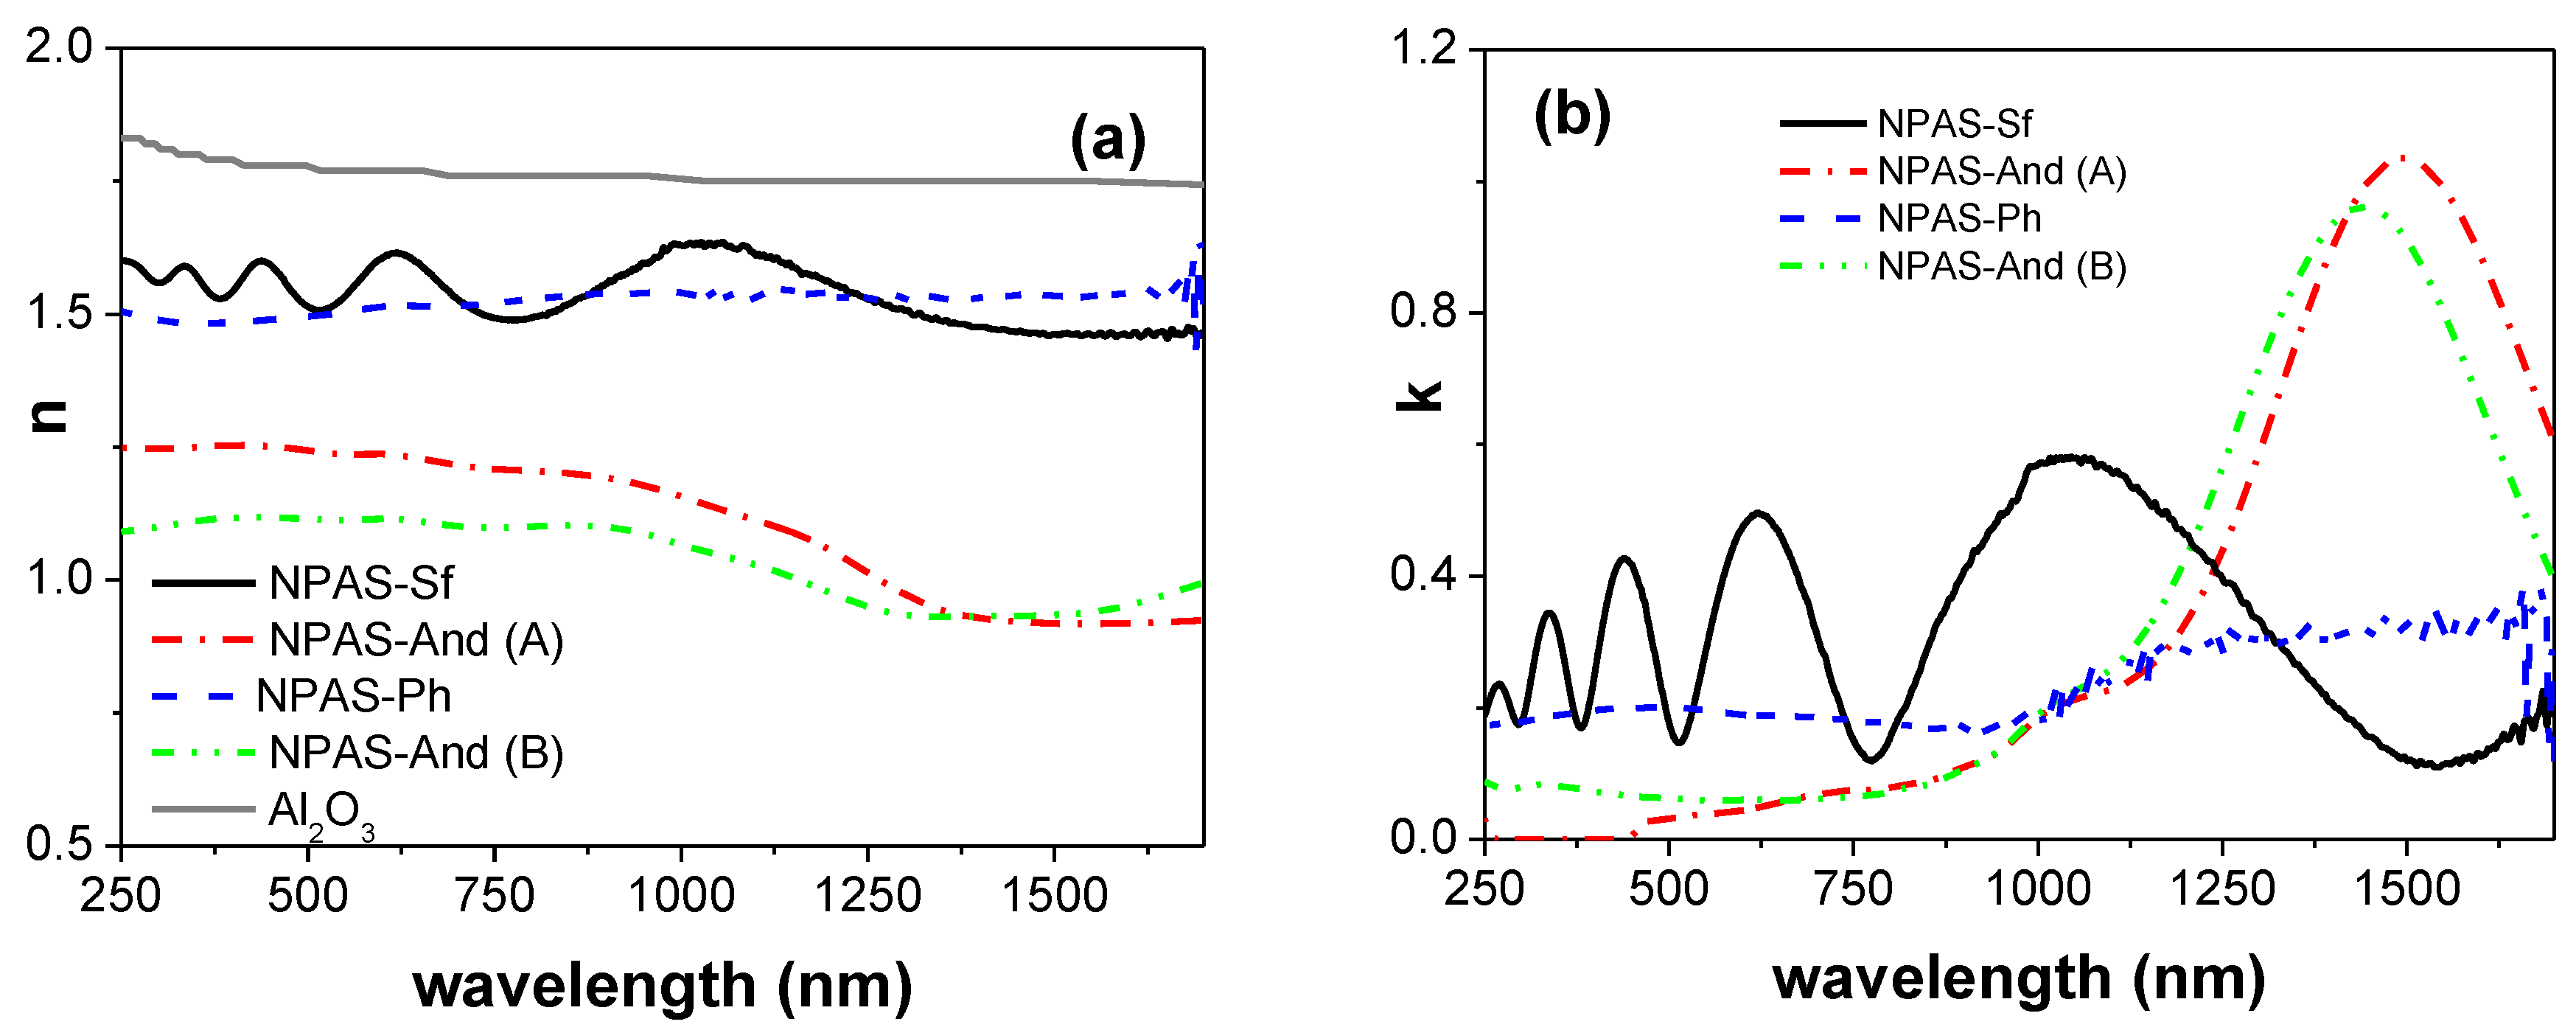
3.2. Optical Characterization

Spectroscopic ellipsometry (SE) is a technique used for the characterization of thin films, since it allows for estimating electrical/optical changes associated to both film surface and bulk phase modifications. Experimental SE parameters are Ψ and Δ angles, which are related with differential changes in amplitude and phase between light waves according to Equation (1) [38]. Figure 3 shows a comparison of wavelength dependence of measured parameters (tanΨ in Figure 3a and cosΔ in Figure 3b) for the different samples, where slight differences depending on geometrical parameters for symmetric samples and surface geometry in the case of the asymmetric one were obtained. It should be pointed out that the oscillatory character of cos(Δ) has already been reported in the literature for anodized nanoporous alumina films, being the increase of oscillatory cycles related with pore size reduction, whereas sample impurities and roughness may also affect these values [50]. In the case of cos(Δ) values, differences depending on sample structure and optical region (visible or near infrared) seem also to exist.
From experimental tan(Ψ) and cos(Δ) values, the refraction index (n) and the extinction coefficient (k) for the studied samples can be determined [50,51]. Figure 4 shows the dependence of the refraction index, n, and the extinction coefficient, k, with the wavelength; for comparison, the theoretical wavelength dependence for the refraction index of pure alumina is also shown in Figure 4a (grey dense line). Since the analyzed NPASs do not consist of a unique material, but rather have a dense alumina structure (n ~ 1.77) and air in the nanopores (n = 1), differences in refraction index values depending on sample pore size or porosity are expected, which would support differences in n values obtained for both surfaces of the Anodisc sample due to its asymmetric structure.
The average values of the refraction index for the whole range of frequencies as well as for frequencies ranging between 250–800 nm (visible) and 800–1700 nm (near infrared) regions for the studied samples are indicated in Table 3. The reduction sequence obtained for <n> values is in agreement with the increase of sample porosity, that is, with the higher air content of the samples. However, although <n> values for NPAS-Sf and NPAS-Ph samples were practically independent on wavelength and optical region, slight differences were observed in the visible region between both surfaces of the NPAS-And sample. The effect of porosity on other optical properties of NPASs such as solar absorptivity has already been reported [32]. The obtained values for the refraction index of NPAS-Sf and NPAS-Ph samples were in agreement with those reported for other thick, low porosity alumina nanoporous samples (15 nm pore radii, 9% porosity and thickness ranging between 9 µm and 45 µm) obtained by optical transmission spectra, ranging in such cases with n values between 1.52 and 1.62 [15].
In the case of the extinction coefficient, k, curve shapes and values seem to depend on both pore size and optical region. Its average value, <k>, in the visible region for samples NPAS-Ph, NPAS-And(A), and NPAS-And(B) were 0.18 ± 0.02, 0.08 ± 0.01, and 0.06 ± 0.04, respectively; this value slightly increases to <k> = 0.26 ± 0.08 for sample NPAS-Ph in the NIR region. However, the NPAS-Sf sample exhibits oscillating behavior for the whole range of wavelengths, while values obtained for both sides of the NPAS-And in the NIR region also show similar tendencies, which would indicate the higher influence of lower pore size in that optical region.

3.3. Electrochemical Characterization

Molecular/ion transport across nanoporous structures is the basis of drug delivery, chemical sensors, and nanofluidic applications, with the nanostructure/solute ratio being a critical point for mass transport control [52,53,54]. However, in the case of ions or charged molecules transport, electrical interactions with the nanoporous structures can also play a relevant role, favoring the reduction/increase of co-ions/counter-ions, that is, ions/particles with a similar/opposite sign than that of the nanostructure fixed charge [20,28,55].
Effective fixed charge concentrations (Xef) and other characteristic diffusive transport parameters such as ion diffusion coefficients (Di) and transport numbers (ti), which represent the fraction of the total current associated to the movement of an ion (ti = Ii/IT), are usually determined by concentration potential (ΔE) experiments, measuring the electrical potential difference (ΔE) at both sides of the nanostructure when it is separating two solutions of the same electrolyte but different concentrations (cf and cv). The analysis of ΔΦ values (ΔΦ = ΔE – ΔΦelec, as was previously indicated in the Section 2.4) was carried out assuming that ΔΦ consists of the addition of several terms [56,57]: (i) the electrical potential difference associated to the different mobility/transport number of solution ions into the nanopores (diffusion potential) and (ii) the interfacial potential at each solution/sample surface (Donnan potential), which is strongly dependent on sample fixed charge and could provoke almost the total exclusion of the ions with the same sign as the fixed charge when Xef is much higher than the external solution concentration (Donnan exclusion). The following expression relates ΔΦ values and characteristic transport parameters [40]:
Δ Φ = R T w z F [ U ln 4 y v 2 + 1   + w U 4 y f 2 + 1   + w U ln c f c v 4 y v 2 + 1   + w 4 y f 2 + 1   + w ]
where w = (+1)/(−1) depends on the sample electrical character (positive/negative fixed charge), while the parameters U and yi are related to the ions transport numbers, the effective fixed charge concentration, and the electrolyte concentration [40]. Data analysis was performed according to that already reported [26,58]
Figure 5 shows the variation of ΔΦ values with NaCl concentration ratio (cv/cc = cv/0.01) for the three analyzed NPASs, and differences depending on the sample can be observed. For comparison reasons, diffusion potential values for the NaCl solution (due to the different transport number of Na+ and Cl in solution (without NPAS), that is, tNa+o and tCl−o, respectively) and those for an ideal anion-exchange structure (positively charged, with total cation (co-ions) exclusion, tNa+ = 0 and tCl− = 1 into the pores) are also indicated in Figure 5a by a dashed line and a solid line, respectively. Values in Figure 5a clearly show differences in ΔΦ values associated to both pore size and sample asymmetry. The effects of ions distribution in charged nanoporous structures as a function of pore size, porosity, or charge are schematically shown in Figure 5b,c.
According to the values shown in Figure 5a, the NPAS-Sf sample behaves almost like an ideal anion-exchanger at NaCl concentrations lower than 0.01 M, while ΔΦ values for NAPS-Ph and NPAS-And samples hardly differ with solution diffusion potentials, which is an indication of their almost neutral character; moreover, the similarity in the electrical potential values determined for these two latter samples seems to indicate the higher effect of larger pore size in these results. The effective fixed charge, Xef, as well as anion and cation transport numbers (tCl− and tNa+ = 1 − tCl−) across the studied NPASs were determined by fitting the values presented in Figure 5a to Equation (4) by means of a non-linear procedure [26,28]. Ionic diffusion coefficients ratio (D/D+ = t/t+) and ionic permselectivity (PS) were also determined, and the obtained values for each sample are indicated in Table 4. Ionic permselectivity is defined as PS = (tCl− − toCl−)/toNa+, where tCl−, toCl−, and toNa+ are the counter-anion transport number into sample pore, and the solution anion and cation transport numbers, respectively [40]. Although all samples exhibit electropositive character, the higher value of the NPAS-Sf fixed charge significantly increased the anion transport number into the nanopores with respect to solution (toCl− = 0.615 and toNa+ = 0.385; (DNa+/DCl−)o = 0.626 [59]), but this effect was much more reduced in the case of the two samples with higher pore size/porosity; on the other hand, anionic permselectivity values permit a more clear distinction of nanosample structure on diffusive transport behavior. These results show the influence of the open surface for the asymmetric sample in the diffusive transport of ions. The obtained values agree with those previously determined for a NPAS with similar thickness but slightly different pore size (16 nm) and porosity (8%): Xef, =+1.0 × 10⁻² M, tCl− = 0.737 and PSCl− = 40.0% [28].
Transport of electrolyte solutions through nanopores involves both electrical and frictional interactions, the first related to effective fixed charge and the latter to pore size. In a previous paper, analysis of diffusive transport with tritiated water through the NPAS-Sf sample was performed to obtain information on solute–pore wall interactions [45]. Figure S4 in the Supplementary Information shows a comparison of time evolution of radioactive water activity for NPAS-Sf and NPAS-And samples and the estimation of water permeability for both samples. Tritiated water permeability values were Pw(NPAS-Sf) = 3.6 × 10⁻⁶ m/s and Pw(NPAS-And) = 7.9 × 10⁻⁶ m/s, which proves the lower frictional effect through the asymmetric NPAS-And sample, probably associated to its partial opener structure.
The influence of pore radii and porosity on interfacial effects and diffusive transport have already been analyzed in a previous paper [47], and it is schematically shown in the Supplementary Information in Figure S2b. The partial exclusion of co-ions from nanopores due to electrical interactions causes an increase of solution concentration at the solid–liquid interfaces (concentration polarization), which can be minimized by solutions stirring; consequently, a comparison of ΔΦ values obtained for the same external solution concentrations under stirring and no-stirring conditions might give information on interfacial effects. Figure 6 shows a comparison of ΔΦ values determined for the NPASs under both experimental conditions, where slight differences depending on sample structure can be observed. Reductions of around 17% and 10% in ΔΦ values at a high NaCl solution concentration (cv > 0.03 M) were obtained for NPAS-Sf and NPAS-And samples, respectively, as a result of concentration-polarization, but no differences seemed to exist at the solution/NPAS-Ph interfaces due to its larger pore size.
Electrochemical impedance spectroscopy (EIS) is an alternating current (a.c.) technique commonly used for electrical characterization of homogeneous and heterogeneous systems, which allows for the estimation of sample/solution electrical resistance and capacitance by using equivalent circuit models as well as interfacial effects [42,43]. Figure 7 shows the impedance plots, Nyquist plot (−Zimg vs. Zreal, Figure 7a), and Bode plots (Zreal vs. frequency, Figure 7b, and −Zimg vs. frequency, Figure 7c), where slight differences for the bulk contribution of the system sample/0.002 M NaCl solution can be observed; however, more significant differences existed in the case of the NPAS-Sf/solution sample when the interface contribution (f < 4 kHz) was considered, this fact was attributed to the higher solution concentration–polarization presented by this sample, in agreement with concentration potential results previously discussed. For comparison reasons, in Figure 7b,c, values obtained for the NaCl solution alone (without any sample in the test-cell) are also indicated.
A clear relaxation process that corresponds to a semicircle in the Nyquist plot for frequencies higher than 4 kHz (fmax: 1–2 MHz) can be observed in Figure 7c for the three solution/sample systems (s/s), which corresponds to the parallel association of a resistance (R, associated to charge transport) and a capacitor (C, associated to charge adsorption), and it is in agreement with Nyquist plots reported in the literature for porous systems, where the contribution of the electrolyte solution between the electrodes and the solid surface is also included [43]. The fit of these values allows us to estimate the electrical resistance and capacitance associated to each solution/sample system [43,60,61], and these values are indicated in Table 5. The higher electrical resistance and capacitance values exhibited by the NPAS-Sf sample are associated to its more compact structure, with lower content of NaCl solution ions (mobile charge), while the increase of solution percentage in the sample increased its conductivity (electrical resistance reduction). It should be indicated that similar impedance curves, with a unique semicircle for the sample/solution system, were previously reported for two commercial inorganic membranes (a fibrous stainless steel structure as support covered by alumina nanoparticles plus an external layer of ZrO2 nanoparticles [62], which have 80–100 μm of nominal thickness, 25 nm or 100 nm pore size, and 25% or 45% porosity [63]) and even for a regenerated cellulose nanoporous membrane (2.5–3.0 nm pore size and (56 ± 2) μm thickness [39]) mainly due to the high hydrophilic character of the polymer; however, three separated contributions were obtained by analyzing the Nyquist plots obtained for a solution/nanofiltration membrane, which corresponded to dense and porous sublayers of the composite polyamide/polysulfone nanofiltration membrane, respectively, and there was the contribution of the electrolyte solution placed between the electrode and the membrane surface [64], due to the very thin (100–150 nm) and compact structure of the dense layer needed for water desalination (~98% NaCl rejection). All these measurements were performed with the same equipment as those used in this work.

4. Conclusions

The analysis of optical and electrochemical measurements carried out with three nanoporous alumina structures (NPASs) with different average pore size, porosity, and symmetric/asymmetric structure (NPAS-Sf: 12 nm, 12%, symmetric; NPAS-Ph: 90 nm, 12%, symmetric; NPAS-And: 10 nm, 23% side (A) and 100 nm 30% size (B), asymmetric) allowed us to establish the effect of sample geometry on characteristic parameters such as the refraction index, extinction coefficient, ion transport number, and permselectivity, as well as interfacial effects, which are of interest in different nanostructure applications.
In particular, the refraction index seems to depend on sample porosity in the whole range of wavelengths studied (250–1700 nm), but smaller pore size might control the extinction coefficient in the near infrared region.
With respect to electrochemical characterization using NaCl solutions, pore size clearly controls both diffusive ionic (Cl and Na+) transport through the NPASs and interfacial effects. Consequently, sample NPAS-Sf presents higher anionic permselectivity (Na+ exclusion) due to its higher positive effective fixed charge and solution concentration–polarization effect. It also exhibits higher electrical resistance ascribed to its lower solution content due to its small pore size. These results prove that the optical and diffusive transport functional properties of NPASs can be controlled by tuning their porosity or pore size, respectively, which might be of significant interest for technological applications of these nanoporous structures.

Supplementary Materials

The following are available online at https://www.mdpi.com/2076-3417/10/14/4864/s1, Figure S1: Scheme of spectroscopy ellipsometry measurement for a homogeneous sample, Figure S2: Scheme of a) electrochemical test-cell and b) solid sample/electrolyte electrical distribution and interfacial effects, Figure S3: Analysis of the pore radii distribution for the studied samples, Figure S4: Time evolution of tritiated water activity in donor and receiver solutions for NPAS-Sf and NPAS-And.

Author Contributions

V.M.P. and J.B. designed and coordinated the experiments; A.S.G. and V.V. synthesized experimental NPAS and performed electron microscopy characterization of the samples; membrane potential and electrochemical impedance spectroscopy measurements and data analysis were performed by J.B.; A.L.C. carried out spectroscopic ellipsometry measurements; all authors have read and agreed to the published version of the manuscript. All authors have read and agreed to the published version of the manuscript.

Funding

This work has been supported by MINECO and ISCIII under Research Projects No. MAT2016-76824-C3-3-R and FISS-19-DTS19/00088, respectively.

Acknowledgments

Scientific support from the SCT’s of the University of Oviedo (Nanoporous Membranes Laboratory and Electronic Microscopy units) and the SCBI (Supercomputer and Bioinformatics Service) of Málaga University are acknowledged.

Conflicts of Interest

The authors declare no conflict of interest.

References

  1. Masuda, H.; Fukuda, K. Ordered metal nanohole arrays made by a two-Step replication of honeycomb structures of anodic alumina. Science 1995, 268, 1466–1468. [Google Scholar] [CrossRef] [PubMed]
  2. Lee, W.; Park, S.J. Porous anodic aluminum oxide: Anodization and templated synthesis of functional nanostructures. Chem. Rev. 2014, 114, 7487–7556. [Google Scholar] [CrossRef] [PubMed]
  3. Badini Confalonieri, G.A.; Vega, V.; Ebbing, A.; Mishra, D.; Szary, P.; Prida, V.M.; Petracic, O.; Zabel, H. Template-assisted self-assembly of individual and clusters of magnetic nanoparticles. Nanotechnology 2011, 22, 285608. [Google Scholar] [CrossRef] [PubMed] [Green Version]
  4. Zierold, R.; Wu, Z.; Biskupek, J.; Kaiser, U.; Bachmann, J.; Kril, C.E., III; Nielsch, K. Magnetic, Multilayered Nanotubes of Low Aspect Ratios for Liquid Suspensions. Adv. Mater. 2010, 21, 226–232. [Google Scholar] [CrossRef]
  5. Bae, C.; Zierold, R.; Montero-Moreno, J.M.; Kim, H.; Shin, H.; Bachmann, J.; Nielsch, K. Multisegmented nanotubes by surface-selective atomic layer deposition. J. Mater. Chem. C 2013, 1, 621–625. [Google Scholar] [CrossRef]
  6. Sousa, C.T.; Leitao, D.C.; Proenca, M.P.; Ventura, J.; Pereira, A.M.; Araujo, J.P. Nanoporous alumina as templates for multifunctional applications. Appl. Phys. Rev. 2014, 1, 031102. [Google Scholar] [CrossRef]
  7. Mendez, M.; Gonzalez, S.; Vega, V.; Teixeira, J.M.; Hernando, B.; Luna, C.; Prida, V.M. Ni-Co Alloy and Multisegmented Ni/Co Nanowire Arrays Modulated in Composition: Structural Characterization and Magnetic Properties. Crystals 2017, 7, 66. [Google Scholar] [CrossRef] [Green Version]
  8. Law, C.S.; Lim, S.Y.; Abell, A.D.; Voelcker, N.H.; Santos, A. Nanoporous Anodic Alumina Photonic Crystals for Optical Chemo- and Biosensing: Fundamentals, Advances, and Perspectives. Nanomaterials 2018, 8, 788. [Google Scholar] [CrossRef] [PubMed] [Green Version]
  9. Hoess, A.; Thormann, A.; Friedmann, A.; Heilmann, A. Self-supporting nanoporous alumina membranes as substrates for hepatic cell cultures. J. Biomed. Mater. Res. Part A 2012, 100, 2230–2238. [Google Scholar] [CrossRef]
  10. Galdun, L.; Vega, V.; Vargová, Z.; Barriga-Castro, E.D.; Luna, C.; Varga, R.; Prida, V.M. Intermetallic Co2FeIn Heusler Alloy Nanowires for Spintronics Applications. ACS Appl. Nano Mater. 2018, 1, 7066–7074. [Google Scholar] [CrossRef] [Green Version]
  11. Salaheldeen, M.; Mendez, M.; Vega, V.; Fernandez, A.; Prida, V.M. Tuning nanohole sizes in Ni hexagonal antidot arrays: Large perpendicular magnetic anisotropy for spintronic applications. ACS Appl. Nano Mater. 2019, 2, 1866–1875. [Google Scholar] [CrossRef]
  12. Aguilera, A.; Jayaraman, V.; Sanagapalli, S.; Singh, R.S.; Singh, V.; Singh, K.; Singh, V.P. Porous alumina templates and nanostructured CdS for thin film solar cell applications. Sol. Energy Mater. Sol. Cells 2006, 90, 713–726. [Google Scholar] [CrossRef]
  13. Hsu, W.-L.; Cheng, C.-H.; Wu, C.-L.; Pai, Y.-H.; Lin, G.-R. Nano-porous MOSLEDs with spatially confined Si quantum dots buried in anodic aluminum oxide membrane. IEEE J. Sel. Top. Quantum Electron. 2017, 23, 1–7. [Google Scholar] [CrossRef]
  14. Chen, Q.; Yang, F.; Wan, R.; Fang, D. Improving lumen maintenance by nanopore array dispersed quantum dots for on-chip light emitting diodes. Appl. Phys. Lett. 2017, 111, 243505. [Google Scholar] [CrossRef]
  15. Marsal, L.F.; Vojkuvka, L.; Formentin, P.; Pallarés, J.; Ferré-Borrul, J. Fabrication and optical characterization of nanoporous alumina films annealed at different temperatures. Opt. Mater. 2009, 31, 860–864. [Google Scholar] [CrossRef]
  16. Yang, T.; Wang, X.; Liu, W.; Shi, Y.; Yang, F. Double-layer anti-reflection coating containing a nanoporous anodic aluminium oxide layer for GaAs solar cells. Opt. Express 2013, 21, 18207–18215. [Google Scholar] [CrossRef] [Green Version]
  17. Li, Q.; Elimelech, M. Organic Fouling and Chemical Cleaning of Nanofiltration Membranes:  Measurements and Mechanisms. Environ. Sci. Technol. 2004, 38, 4683–4693. [Google Scholar] [CrossRef] [PubMed]
  18. Tin, M.M.M.; Anioke, G.; Nakagoe, O.; Tanabe, S.; Kodamatani, H.; Nghiem, L.D.; Fujioka, T. Membrane fouling, chemical cleaning and separation performance assessment of a chlorine-resistant nanofiltration membrane for water recycling applications. Sep. Purif. Tech. 2017, 189, 170–175. [Google Scholar] [CrossRef] [Green Version]
  19. Romero, V.; Vega, V.; García, J.; Prida, V.M.; Hernando, B.; Benavente, J. Ionic transport across tailored nanoporous anodic alumina membranes. J. Colloid Interface Sci. 2012, 376, 40–46. [Google Scholar] [CrossRef] [PubMed]
  20. Bluhm, E.A.; Schroeder, N.C.; Bauer, E.; Fife, J.N.; Chamberlin, R.M.; Abney, K.D.; Young, J.S.; Jarvinen, G.D. Surface Effects on Metal Ion Transport across Porous Alumina Membranes. 2. Trivalent Cations:  Am, Tb, Eu, and Fe. Langmuir 2000, 16, 7056–7060. [Google Scholar] [CrossRef]
  21. Porta-i-Batalla, M.; Xifré-Pérez, E.; Eckstein, C.; Ferré-Borrull, F.; Marsal, L.F. 3D Nanoporous Anodic Alumina Structures for Sustained Drug Release. Nanomaterials 2017, 7, 227. [Google Scholar] [CrossRef] [PubMed]
  22. Petukhov, D.I.; Napolskii, K.S.; Eliseev, A.A. Permeability of anodic alumina membranes with branched channels. Nanotechnology 2012, 23, 335601. [Google Scholar] [CrossRef] [PubMed]
  23. Seo, I.; Kwon, C.; Lee, H.H.; Kim, Y.; Kim, K.; Yoon, T. Assembly of Colloidal Nanoparticles into Anodic Aluminum Oxide Templates by Dip-Coating Process. IEEE Trans. Nanotech. 2009, 8, 707–712. [Google Scholar] [CrossRef]
  24. Kumeria, T.; Santos, A.; Losic, D. Nanoporous anodic alumina platforms: Engineered surface chemistry and structure for optical sensing applications. Sensors 2014, 14, 11878–11918. [Google Scholar] [CrossRef] [PubMed] [Green Version]
  25. Fang, J.; Levchenko, I.; van der Laan, T.; Kumar, S.; Ostrikov, K. Multipurpose nanoporous alumina–carbon nanowall bi-dimensional nano-hybrid platform via catalyzed and catalyst-free plasma CVD. Carbon 2014, 78, 627–632. [Google Scholar] [CrossRef]
  26. Romero, V.; Vega, V.; García, J.; Zierold, R.; Nielsch, K.; Prida, V.M.; Hernando, B.; Benavente, J. Changes in Morphology and Ionic Transport Induced by ALD SiO2 Coating of Nanoporous Alumina Membranes. ACS Appl. Mater. Interfaces 2013, 5, 3556–3564. [Google Scholar] [CrossRef]
  27. Vázquez, M.I.; Romero, V.; Benavente, J.; Romero, R.; Hierrezuelo, J.; López-Romero, J.M.; Contreras-Cáceres, R. Characterization and stability of a bioactivated alumina nanomembrane for application in flow devices. Microporous Mesoporous Mater. 2016, 226, 88–93. [Google Scholar] [CrossRef]
  28. Vega, V.; Gelde, L.; González, A.S.; Prida, V.M.; Hernando, B.; Benavente, J. Diffusive transport through surface functionalized nanoporous alumina membranes by atomic layer deposition of metal oxides. J. Ind. Eng. Chem. 2017, 52, 66–72. [Google Scholar] [CrossRef]
  29. Gelde, L.; Cuevas, A.L.; Martínez de Yuso, M.D.V.; Benavente, J.; Vega, V.; González, A.S.; Prida, V.M.; Hernando, B. Influence of TiO2-Coating Layer on Nanoporous Alumina Membranes by ALD Technique. Coatings 2018, 8, 60. [Google Scholar] [CrossRef] [Green Version]
  30. Cuevas, A.L.; Martínez de Yuso, M.V.; Vega, V.; González, A.S.; Prida, V.M.; Benavente, J. Influence of ALD Coating Layers on the Optical Properties of Nanoporous Alumina-Based Structures. Coatings 2019, 9, 43. [Google Scholar] [CrossRef] [Green Version]
  31. Gâlcă, A.C.; Kooij, E.S.; Wormeester, H.; Salm, C. Structural and optical characterization of porous anodic aluminum oxide. J. Appl. Phys. 2003, 94, 4296–4305. [Google Scholar] [CrossRef]
  32. Moghadam, H.; Samimi, A.; Behzadmehr, A. Effect of nanoporous anodic aluminum oxide (AAO) characteristics on solar absorptivity. Transp. Phenom. Nano Micro Scales 2013, 1, 110–116. [Google Scholar] [CrossRef]
  33. Hierro-Rodriguez, A.; Rocha-Rodrigues, P.; Valdés-Bango, F.; Alameda, J.M.; Jorge, P.A.S.; Santos, J.L.; Araujo, J.P.; Teixeira, J.M.; Guerreiro, A. On the anodic aluminium oxide refractive index of nanoporous templates. J. Phys. D Appl. Phys. 2015, 48, 455105. [Google Scholar] [CrossRef] [Green Version]
  34. Gioti, M.; Laskarakis, A.; Logothetidis, S. IR-FUV ellipsometry studies on the optical, electronic and vibrational properties of polymeric membranes. Thin Solid Films 2004, 455, 283–287. [Google Scholar] [CrossRef]
  35. Ogielo, W.; Wormeester, H.; Wessling, M.; Benes, N.E. Spectroscopic ellipsometry analysis of a thin film composite membrane consisting of polysulphone on a porous α-alumina support. ACS Appl. Mater. Interfaces 2012, 4, 935–943. [Google Scholar] [CrossRef] [PubMed]
  36. Briggs, D.; Seah, M.P. Practical Surface Analysis. In Auger and X-Ray Photoelectron Spectroscopy, 2nd ed.; John Wiley & Sons: Chichester, UK, 1995; ISBN 9780471953401. [Google Scholar]
  37. Schneider, C.A.; Rasband, W.S.; Eliceiri, K.W. NIH Image to ImageJ: 25 years of image analysis. Nat. Methods 2012, 9, 671–675. [Google Scholar] [CrossRef] [PubMed]
  38. Logothetidis, S.; Gioti, M.; Gravalidis, C. Optical and electronic characterization on polymeric membranes. Synth. Met. 2003, 138, 369–374. [Google Scholar] [CrossRef]
  39. Romero, V.; Vázquez, M.I.; Benavente, J. Study of ionic and diffusive transport through a regenerated cellulose nanoporous membrane. J. Membr. Sci. 2013, 433, 152–159. [Google Scholar] [CrossRef]
  40. Lakshminarayanaiah, N. Transport Phenomena in Membranes; Academic Press Inc.: New York, NY, USA, 1970; ISBN 9780124342507. [Google Scholar]
  41. Benavente, J.; García, J.M.; Riley, R.; Lozano, A.E.; de Abajo, J. Sulfonated poly(ether ether sulfones): Characterization and study of dielectrical properties by impedance spectroscopy. J. Membr. Sci. 2000, 175, 43–52. [Google Scholar] [CrossRef]
  42. Macdonal, J.R. Impedance Spectroscopy; John Wiley: New York, NY, USA, 1987; ISBN 9780471831228. [Google Scholar]
  43. Benavente, J. Use of Impedance Spectroscopy for characterization of modified membranes. In Membrane Modification: Technology and Applications; Hilal, N., Kayet, M., Wright, C.J., Eds.; CRC Press: Boca Raton, FL, USA, 2012; ISBN 9781439866368. [Google Scholar]
  44. Fontyn, M.; van’t Riet, K.; Bijsterbosch, B.H. Surface spectroscopic studies of pristine and fouled membranes part 1. Method development and pristine membrane characterization. Colloids Surf. 1991, 54, 331–347. [Google Scholar] [CrossRef]
  45. Romero, V.; Vázquez, M.I.; Cañete, S.; Vega, V.; García, J.; Prida, V.M.; Hernando, B.; Benavente, J. Frictional and electrical effects involved in the diffusive transport through a nanoporous alumina membrane. J. Phys. Chem. C 2013, 117, 25513–25518. [Google Scholar] [CrossRef]
  46. Vázquez, M.I.; Romero, V.; Vega, V.; García, J.; Prida, V.M.; Hernando, B.; Benavente, J. Morphological, Chemical Surface, and Diffusive Transport Characterizations of a Nanoporous Alumina Membrane. Nanomaterials 2015, 5, 2192–2202. [Google Scholar] [CrossRef] [PubMed]
  47. Romero, V.; Vega, V.; García, J.; Prida, V.M.; Hernando, B.; Benavente, J. Effect of Porosity and Concentration Polarization on Electrolyte Diffusive Transport Parameters through Ceramic Membranes with Similar Nanopore Size. Nanomaterials 2014, 4, 700–711. [Google Scholar] [CrossRef] [PubMed] [Green Version]
  48. Nielsch, K.; Choi, J.; Schwirn, K.; Wehrspohn, R.B.; Gösele, U. Self-ordering regimes of porous alumina: The 10% porosity rule. Nano Lett. 2002, 2, 677–680. [Google Scholar] [CrossRef]
  49. Palacio, L.; Prádanos, P.; Calvo, J.I.; Hernández, A. Porosity measurements by a gas penetration method and other techniques applied to membrane characterization. Thin Solid Films 1999, 348, 22–29. [Google Scholar] [CrossRef]
  50. Tompkins, G.; Hilfiker, J.N. Spectroscopic Ellipsometry: Practical Application to Thin Film Characterization, 1st ed.; Momentum Press: New York, NY, USA, 2016; pp. 57–70. ISBN 9781606507278. [Google Scholar]
  51. Fujiwara, H. Spectroscopic Ellipsometry Principles and Applications; John Wiley & Sons: Chischester, UK, 2007; ISBN 9780470016084. [Google Scholar]
  52. Holbein, J.; Steinhart, M.; Schiene-Fisher, C.; Benda, A.; Hof, M.; Hübner, C.G. Confined diffusion in ordered nanoporous membranes. Small 2007, 3, 380–385. [Google Scholar] [CrossRef] [PubMed]
  53. Jiang, X.; Mishra, N.; Turner, J.N.; Spencer, M.G. Diffusivity of sub-1,000 Da molecules in 40 nm silicon-based alumina pores. Microfluid. Nanofluid. 2008, 5, 695–701. [Google Scholar] [CrossRef]
  54. Kipke, S.; Schmid, G. Nanoporous alumina membranes as diffusion controlling systems. Adv. Funct. Mater. 2014, 14, 1184–1190. [Google Scholar] [CrossRef]
  55. Helfferich, F.G. Ion Exchange; McGraw-Hill: New York, NY, USA, 1962; ISBN 9780070280700. [Google Scholar]
  56. Meyer, K.H.; Sievers, J.F. La perméabilité des membranes I. Théorie de la perméabilité ionique. Helv. Chim. Acta 1936, 19, 649–664. [Google Scholar] [CrossRef]
  57. Teorell, T. Transport phenomena in membranes eighth Spiers Memorial Lecture. Discuss. Faraday Soc. 1956, 21, 9–26. [Google Scholar] [CrossRef]
  58. Lanteri, Y.; Szymczyk, A.; Fievet, P. Influence of Steric, Electric, and Dielectric Effects on Membrane Potential. Langmuir 2008, 24, 7955–7962. [Google Scholar] [CrossRef] [PubMed]
  59. Robinson, R.A.; Stokes, R.H. Electrolyte Solutions; Butterworths: London, UK, 1970; ISBN 9780408184908. [Google Scholar]
  60. Sarker, S.; Ahammad, A.J.S.; Seo, H.W.; Kim, D.M. Electrochemical Impedance Spectra of Dye-Sensitized Solar Cells: Fundamentals and Spreadsheet Calculation. Int. J. Photoenergy 2014, 2014, 851705. [Google Scholar] [CrossRef] [Green Version]
  61. Zhao, S.; Berry-Gair, J.; Li, W.; Guan, G.; Yang, M.; Li, J.; Lai, F.; Corà, F.; Holt, K.; Brett, D.J.L.; et al. The Role of Phosphate Group in Doped Cobalt Molybdate: Improved Electrocatalytic Hydrogen Evolution Performance. Adv. Sci. 2020, 7, 1903674. [Google Scholar] [CrossRef] [PubMed]
  62. Vázquez, M.I.; de Lara, R.; Benavente, J. Characterisation of two microporous ceramic membranes with different geometrical parameters: Effect of protein adsorption on electrochemical parameters. J. Eur. Ceram. Soc. 2007, 27, 4245–4250. [Google Scholar] [CrossRef]
  63. Augustin, S.; Hennige, V.; Hörpel, G.; Hying, C. Ceramic but flexible: New ceramic foils for fuel cells and batteries. Desalination 2002, 146, 23–28. [Google Scholar] [CrossRef]
  64. Benavente, J.; Silva, V.; Prádanos, P.; Palacio, L.; Hernández, A.; Jonson, G. Comparison of the Volume Charge Density of Nanofiltration Membranes Obtained from Retention and Conductivity Experiments. Langmuir 2010, 26, 11841–11849. [Google Scholar] [CrossRef]
Figure 1. Schematic drawing of the synthesis of experimental nanoporous alumina structure (NPAS) samples: (a) Starting Al substrate; (b) nanoporous alumina structure obtained after two-step anodization method; (c) selective removal of unoxidized aluminum substrate; (d) removal of barrier layer and pore opening.
Applsci 10 04864 g001
Figure 2. SEM micrographs of NPASs: NPAS-Sf top view (a) and bottom view (b); NPAS-Ph top view (c) and bottom view (d); Anopore: bottom view (e) and top view (f). The insets in (a,c,e,d) show cross section views of the respective samples. The inset in (b) shows a higher magnification image to make pore size clearly visible.
Applsci 10 04864 g002
Figure 3. Wavelength dependence of (a) tan(Ψ) and (b) cos(Δ) experimental values for samples: NPAS-Sf (black dense line), NPAS-Ph (blue dashed line), NPAS-And surface A (green dashed-dotted line), and NPAS-And surface B (red dashed-dotted-dotted line).
Applsci 10 04864 g003
Figure 4. Wavelength dependence of (a) refraction index and (b) extinction coefficient values for samples: NPAS-Sf (black dense line), NPAS-Ph (red dashed line), NPAS-And surface A (blue dashed-dotted line), and NPAS-And surface B (green dashed-dotted-dotted line). For comparison reasons the refraction index of pure Al2O3 is indicated in (a) as a grey dense line.
Applsci 10 04864 g004
Figure 5. (a) Variation of ΔΦ values with concentration ratios for NPAS-Sf (●), NPAS-Ph (▼), and NPAS-And (◊). Dashed line: NaCl solution diffusion potentials; solid line: ideal anion-exchanger (t = 1 and t+ = 0). Scheme of ions distribution in charged nanoporous structures as a function of (b) charge and porosity for samples with similar pore size; (c) pore size and porosity for samples with similar surface charge.
Applsci 10 04864 g005
Figure 6. Effect of solution stirring on ΔΦ values. (a) NPAS-Sf: (●) solutions stirred, (○) solutions not stirred; (b) NPAS-Ph: (■) solutions stirred, (□) solutions not stirred; (c) NPAS-And: (♦) solutions stirred, (◊) solutions not stirred. The inset shows possible concentration–polarization effect.
Applsci 10 04864 g006
Figure 7. Impedance curves for the electrode/0.002 M NaCl solution/NPAS/0.002 M NaCl solution/electrode system. Nyquist plot (a); Bode plots: (b,c). NPAS-Sf (●), NPAS-Ph (▼), and NPAS-And (◊). ω = 2πf.
Applsci 10 04864 g007
Table 1. Average atomic concentration percentages of the main chemical elements found on NPASs surfaces.
SampleC (%)O (%)Al (%)N (%)S (%)P (%)O/Al
NPAS-Sf16.953.025.70.72.11.92.07
NPAS-Ph19.251.727.20.6 0.91.90
NPAS-And16.650.827.80.5 3.11.83
Table 2. Average pore size (<rp>), average interpore distance (<Dint>), and average porosity (<Θ >) for the studied NPASs.
Sample<rp> (nm)<Dint> (nm)<Θ > (%)
NPAS-Sf12 ± 265 ± 512
NPAS-Ph90 ± 20490 ± 3012
NPAS-And (A)10 *40 ± 1023
NPAS-And (B)100 *360 ± 8030
* Manufacturer indication.
Table 3. Average values of the refraction index determined for the studied samples for the whole range of wavelength as well as for visible and near infrared optical regions.
Sample<n><n><n>
(250–1700) nm(250–00) nm(800–1700) nm
NPAS-Sf1.54 ± 0.061.55 ± 0.041.53 ± 0.06
NPAS-Ph1.52 ± 0.021.52 ± 0.021.53 ± 0.02
NPAS-And (A)1.14 ± 0.091.24 ± 0.021.08 ± 0.09
NPAS-And (B)1.05± 0.051.11 ± 0.021.06 ± 0.05
Table 4. Effective fixed charge (Xef), counter-ion transport number (tCl−), ionic diffusion coefficient ratio (D/D+), and anionic permselectivity (PSCl−) for the studied samples.
SampleXef (M)tCl−DNa+/DCl−PSCl− (%)
NPAS-Sf+0.01220.7420.34833.0
NPAS-Ph+0.00130.6270.5953.1
NPAS-And+0.00150.6520.5349.6
Table 5. Values determined for the electrical resistance and capacitance of the three 0.002 M NaCl solution/sample (s/s) systems.
SampleRs/s (Ω)Cs/s (F)
NPAS-Sf88409.4 × 10−12
NPAS-Ph74008.3·× 10−12
NPAS-And78007.9·× 10−12

