1. Introduction
The rapid development of the residential sectors in the world, particularly housing units, has resulted in a high energy profile; during the construction phase, massive resources are used that cause a substantial amount of embodied energy or equivalent carbon emission [
1]. Degeneration of the environment, social industrialization, and economic development increase as global modernization expands, and more research topics aim to guide the industrial economic structure from an unsustainable to a sustainable development form [
2]. Similarly, a significant amount of operational energy is consumed during the entire lifecycle. It is estimated that the building construction in the world consumes approximately one-third of the total generated electricity, and that it emits 39% of the global annual greenhouse gases, which is about 2236 metric tons [
3]. The annual report of 2013 of the US Green Building Council (2013) indicated that the US building sector contribution to GHG emissions is 40% more than that made by the industrial and transportation industry. Therefore, global building construction is receiving much attention for producing green buildings by following the principles of sustainable development and minimizing the net impacts within the permissible thresholds of economic, environmental, and social factors [
4,
5].
The current trends in global industrial development have changed from achieving the highest economic performance to maximum compliance with the sustainable development agenda [
6]. Therefore, in designing and operating an industrial development, stakeholders strive to accommodate the related sustainable development for the success of the project. The fundamental principles of sustainable development dictate that progress should be built, and operate without compromising the supply and demand of the resources for future developments. Currently, a new development project is assessed for evaluating its impacts regarding environmental degeneration, disharmony in the social context, and economic crisis [
7]. Therefore, the measurement of sustainability of project development is defined by an integrated factor call the Eco-Efficiency Index (EEI), which is on top of other systems used for determining the sustainable development, such as the Green Building Index (GBI).
The Guardian newspaper, in 2018, revealed that the building construction sector is still causing an increase in annual emissions to the environment [
8]. The rise of the emission level is due to neglecting or only making minimal implementations of the sustainable development goals (SDG) in industrial development. An average emission level in some industrialized countries is estimated as 4.7% in China, approximately 2.5% in the US, and up to 6.3% in India, which indicates that almost all countries, and especially industrialized nations, are contributing more to the rise of the global carbon emission level. It was observed that, because of the rapid increase in industrial development since the 1990s, the carbon emission level of Malaysia has also sharply increased. For example, in the year 2000, it was estimated as 131.28 million MT, and in the year 2017, it measured as 255.78 million MT, which is almost double the earlier figure [
9]. There are possible consequences of the sharp rise in carbon emissions on climate change: for example, in the first quarter of 2019, the average temperature in Malaysia was measured between 33–35 °C [
10]. According to the Climate Change Performance Index (CCPI), Malaysia is recognized as one of the highest CO
2 emission producers in the world [
11].
Therefore, there was an urge to introduce a tool for measuring sustainability in analyzing development activities. Eco-efficiency is defined as an indicator that correlates economic activities and ecology, for measuring the sustainability of a project or development [
12]. The fundamental concept of eco-efficiency is based on the philosophy of using less resources, and producing a minimum amount of waste and pollution, as compared to that which is typically consumed in executing such a project. As discussed, achieving a substantial reduction in the energy consumption pattern in modern green buildings is associated with creating significant environmental and economic benefits. Therefore, the energy efficiency of a building considered a primary driving force in achieving sustainability in the building construction [
13]. Hypothetically, the construction industry is one of the sectors that perform non-environmental friendly activities [
14]. As a result of that, the government of Malaysia has encouraged professionals and various associations in the construction industry to adopt a sustainable development concept for establishing a safe and green environment. Such an idea could be adopted by acquiring adequate knowledge of sustainable practices by the engineering professionals and developers who initiate projects [
1]. The construction industry in Malaysia has adopted the Green Building Index (GBI) as the ratings tool for the environmental performance of any building. The reason is that the structural design of any project is influenced mainly by the appropriate selection of materials [
4,
5].
Similarly, the structural design concept also affects the speed and quality of construction. Sometimes, inefficient structural concepts may cause the consumption of high material volume, because it is either over-designed, or unnecessarily high factor of safety is imposed on the design [
4]. In order to achieve the target, the green building system is one of the most effective methods that considers all three criteria for promoting sustainable development [
15]. The eco-efficiency measurement is considered a useful means for assessing the sustainability of a project, because it links together economic activities and the ecosystem impacts. Usually, eco-efficiency dictates the concept of developing or building a project with the aid of an optimum amount of resources, compared to that utilized in traditional projects. It also aims to generate less waste and pollution. In general, the principal concept for designing green buildings is the achievement of environmental friendliness [
16]. In several countries, various standards are implemented for the assessment of buildings. In China, the standard called Evaluation Standard Green Building (ESGB) is practiced, whereas Leadership in Environmental and Energy Design (LEED) is a recommended method in the United States.
Similarly, the Building Research Establishment’s Environmental Assessment Method (BREEAM) is implemented in the United Kingdom, Australian practitioners use the Green Star system, and the Green Building Index (GBI) is adopted in Malaysia. The concept of sustainable design has a lot of potential for benefiting the environment, economy, and the social community. For example, for comfortable living, it is essential to minimize and reduce the current level of carbon emissions, which is only possible by implementing the rules of sustainable development. Furthermore, sustainable development emphasizes creating an equilibrium between the economic, environmental, and social costs of a project. The development of eco-efficient self-compacting concrete with marble sludge have been done, and it shows that changing the M/C ratio affects the compressive strength around 15%, and it shows the W/C has a greater effect than the M/C ratio on the compressive strength [
17].
Design of Experiments (DOE) Made Easy, is a statistical software that offers a wide selection of graphs, including 3D graph, predicted vs. actual graph and contour graph which can help to better explain the data [
18].
It is necessary to introduce new concepts and approaches in the building design processes that can fulfill the criteria of sustainable development and facilitate the objectives of the green buildings, in compliance with the relevant standards. Malaysia is a tropical country, and more than 70% of the Malaysian population lives in a single or double story house. Almost 100% of houses are made reinforced concrete (RC) structure. Therefore, this research was aimed at assessing the environmental, economic, and social impacts of the typical design, and developing an approach for enhancing the eco-efficiency.
1.1. Assessing the Eco-Efficiency Index of Typical RC Structure of Malaysian Houses
A reinforced concrete structural form of a typical single story and double story residential house in Malaysia was chosen for this study. Typically, a building structure is composed of a foundation system, slabs, beams, and columns. For this study, two types of concrete were assigned; fly ash (FA) blended cement concrete, and blast furnace slag (BFS) concrete. In both types of concrete, the replacement level was kept at 15% partial replacement to cement [
19].
Figure 1 illustrates the procedure for performing the analysis for determining the eco-efficiency index of a reinforced concrete building structure.
For this study, the structural designs of twenty single story and twenty double story reinforced concrete houses were analyzed.
Concrete mix design and the characteristics compressive strength were chosen as the principal parameters for design optimization for achieving the maximum reduction in GHG emission (specifically equivalent carbon emission).
Table 1 shows the optimization of characteristic strength of concrete in the case of single story and double story residential houses.
The value of the characteristic compressive strength of concrete controls the size of the structural member (beams, columns, and slab), and hence, it also influences the content of the reinforcing steel bars. A higher value of the characteristic compressive strength reduces the effective depth of a flexural member, which reduces the concrete volume, and the amount of steel, so the carbon footprint is also reduced. It is important to optimize the concrete strength in designing the eco-efficient reinforced concrete structure.
1.2. Determination of the Cost of the Structural Work
Equation (1) shows a relationship for estimating the original cost of the structure (Cost,
ori), which is composed of the total cost of the material in this case reinforced concrete (Cost,
m), and the cost of the construction (Cost,
c). Cost,
m and Cost,
c is shown in Equations (2) and (3). The design approach influences the quantity of material in an RC structure and the assumptions made. The amount of the material should be separated in terms of the grade of concrete used and the diameter of steel reinforcement.
For reinforced concrete structures, material cost (Cost,m) is composed of the cost of concrete material and the embedded reinforcing steel bars. The concrete cost (Cost,cm) is the product of total concrete volume (Qci, m3) used in the structure and the unit price of concrete (Uci). In Malaysia, it is available in the Ringgit per cubic meter (RM/m3). For this study, unit prices of materials and workmanship were taken from the Cost Schedule developed by the public works department, Malaysia, which is called the JKR-20800 standard (Malaysian Price Standard) for the schedule of rates. This schedule of rates is updated from time to time, due to the fluctuations in the market rates and inflation. It is also observed that the unit price of concrete is also related to the concrete grade; higher-grade concrete costs more than the lower grade concrete. The cost of steel (Cost,sm) is determined as the product of the quantity of steel (Qsh) with a unit price of steel (Ush), for example, in RM/kg. The unit cost of steel is controlled by the bar diameter and steelwork in different structural members, such as beams, columns, and slab.
The construction cost (Cost,c) is the sum of the costs of concreting work (Cost,cw) and steelwork (Cost,sw). The general formula for estimating the cost of concrete work is summing-up the costs of concreting for foundation (Cost,cf), concreting for ground floor (Cost,cg), and concreting for other floors (Cost,cst). Similarly, the cost of steelwork (Cost,sw) is estimated as the summation of cost all types of steelwork. The cost of steelwork is controlled by the diameter of the reinforcing steel bars and steelwork for different components, such as beams, columns, slabs, and foundation.
The cost of alternative materials (Cost,
alt) is defined as the total cost of the alternative materials used in concrete. Alternative materials are classified as cement replacement materials (FA, slag). Equation (4) shows a simple relationship, which is the summation of the cost of the alternative material (Cost,
am) and the construction cost (Cost,
c).
where the cost component (Cost,
am) is calculated as the concrete cost (Cost,
c) plus the cost of new material (Cost,
nm) and the cost of steel (Cost,
s).
1.3. Determination of Equivalent Carbon Emission
The environmental impact assessment of any project is generally represented by the estimation of the carbon emissions caused by activities involved in that project. The term equivalent carbon emission is defined as the equivalent emission of all GHG involved in any activity with the carbon dioxide emission. The global warming potential (GWP) to CO
2 is assigned as one, whereas the GWP of other GHG is more than one. The equivalent CO
2 emission of the other GHG is the product of the GWP of that gas and the emission amount. Equation (6) shows an empirical relationship for estimating the equivalent carbon emission.
where EF
RC is termed as the emission factor of the reinforced concrete, which represents the carbon emission contributed by concrete and reinforcing steel. Since higher grade concrete uses a larger amount of cement, and the lower grade concrete requires low cement content; therefore, the emission factor of concrete, EF
C is varied with the concrete grades. The manufacturer usually provides the equivalent carbon emission of reinforcing steel bars. Generally, CO
2,Eq caused by reinforcing steel, is about 2.5 to 3 kg per kilogram of the steel. Therefore, if emission factors, EF
C and EF
S, are defined as Kg CO
2,Eq/kg, then the coefficient EF
RC is determined based on the content of steel and concrete in the unit volume (m
3) of reinforced concrete. The emission caused by reinforced concrete containing cement replacement materials is called CO
2,alt,, and it is calculated using Equation (7), where Q
ca is the total material quantity of concrete ingredients, including the amount of replacement materials such as fly ash. Q
Sh is the total quantity of steel used in the reinforced concrete structure. If EF
RC is defined in kgCO
2,Eq/kg, then all numbers are also described in (kg).
The emission factor of alternative reinforced concrete (EFRC) is shown in Equation (8), where it is the total emission factor of alternative concrete (EFac) and emission factor of steel (EFs) in kilograms of carbon dioxide per kilogram of material (kgCO2/kg).
1.4. Determination of Economic and Environmental Scores
The economic score describes the cost factor of reinforced concrete work in a building structure. The economic score includes the combined impact of the material cost and the workmanship cost. Since this study focused on the Malaysian housing sector, therefore, the schedule of rates (SOR), as presented in the document JKR-20800 [
10], were referred to for the calculation of the economic factor. Equation (9) was applied for calculating the economic scores (ECOs) of the reinforced concrete housing structures used in this study.
Similarly, the environmental score, ENVs, was calculated using Equation (10), which considered the total carbon emission, as discussed in Equations (6) and (7).
1.5. Determination of Eco-Efficiency Index
For reinforced concrete (RC) design, the eco-efficiency index, ECO
eff, is used as a reference for assessing the sustainability requirement of the project. The higher value of ECO
eff, indicates an economical design, together with the low environmental impacts [
20]. For this research study, an integrated relationship was established for analyzing the cost and CO
2 emission of typical RC structures used in Malaysian housing. Such a relationship would be a useful reference for decision-makers for developing the economically viable and eco-efficient design of RC structures in the typical housing projects. The established correlation for the Eco-Efficiency Index estimates the cost and CO
2 emission for different options of the RC structural system. It includes the assessment of the construction cost and the CO
2 emission for various design alternatives, calculation of the economic and environmental scores, which is defined by the cost and CO
2 emission reduction ratio during the assessment of multiple design options. The selection should be made based on the best scores achieved by a particular design alternative.
In this study, for determining the best design followed the methodology discussed by Pai et al. (2018) [
6], because this reference used the same parameter on the economic and environmental scores adopted in this study. In this analysis, Equation (11) was used to estimate the Eco-Efficiency Index, which indicates the efficiency of the design, based on the economic score ratio and the environmental score ratio.
where; Xi is economic score for each structural-design alternative, Yi is environmental score for each structural-design alternative, A is weight of the economic score, and B is weight of the environmental score.
1.6. Development of Response Surface Model
The development of the response surface model using the statistical method was integrated into the Design-Expert software that uses ANOVA for constructing the response surface models.
Figure 2,
Figure 3,
Figure 4,
Figure 5,
Figure 6,
Figure 7 and
Figure 8 shows the overall process of response surface model development for eco-efficiency index reinforced concrete residential house single story and double story cases. The whole data use in this analysis is based on the eco-efficiency design data for a reinforced concrete single story and double story building carried out in previous research work [
21,
22]. The development of a response surface model is explaining in the below steps:
Determination of the design option;
Determination number of run;
Determination number of response;
Data input for factor and response. This is the process to input the variable raw data that obtain from simulation or experimental work to run the statistical analysis using regression method;
Best fit analysis. Determination of the data relationship for the design parameter either linear, square or cubic;
Predicted vs. actual relationship. Determination of the data values obtained in the analysis between the predicted lines and low percentage of data outliers;
Surface model graph. This is development three-dimensional surface relationship of the parameter that have more than two variables and develop the variable relationships.
2. Results and Discussion
This chapter explains the results of an eco-efficiency analysis of reinforced concrete single story and double story residential houses and discussion about the results obtained. Furthermore, it also explains the data validation that reflect the overall analysis and simulation work done for this research work.
2.1. Eco-Efficiency Index (ECOeff) of Reinforced Concrete Houses
The results shown in
Table 2 are the estimated values of the ECO
eff for twenty single story reinforced concrete houses in Malaysia. For the analysis of the impact of the concrete mix proportions, two types of concrete were considered. A concrete mix containing either fly ash or blast furnace slag as the cement replacement material. A higher value of the eco-efficiency index indicates a better eco-efficiency performance of the housing unit. For each type of concrete member, sizes were analyzed using different grades of concrete, as well as the quantity of steel, which was calculated for each design. The results of the fifth housing unit (where the concrete grades used in the foundation were 30 MPa, slabs 20 Mpa, beams 30 Mpa, and columns 30 Mpa) showed the highest eco-efficiency index, ECO
eff. In this unit, both types of concrete using fly ash and blast furnace slag as alternative materials resulted in the eco-efficient design. The design optimization using a different grade of concrete has led to controlling the eco-efficiency in the design of the structure.
It has been observed that by increasing the grade of concrete to 5 Mpa, it has caused about a 3% increase in the equivalent carbon emission of concrete. For an eco-efficient structural design, the characteristic strength of concrete and steel reinforcement have caused significant impacts on the amount of equivalent carbon emission; the higher strength concrete produces a high amount of carbon emission. Therefore, using the optimum grade of concrete can control the economic and environmental factors in the structural design, which can facilitate achieving the desired eco-efficiency index of the reinforced concrete structure. In this analysis, it was further observed that the concrete contained blast furnace slag as cement replacement material resulted in an increase in the eco-efficiency of design, as compared to the designs based on fly ash based concrete, because of blast furnace slag, which caused higher positive impacts on the economic and environmental criteria.
Based on the above discussion, some observations are made for controlling the desired level of eco-efficiency of a given structural design project:
Choose a minimum specified value of the compressive strength of concrete for designing a structural element that meets the reinforced concrete design requirements for satisfying the ultimate limit state (ULS) design and serviceability limit state (SLS) design criteria.
An allowance of 5 MPa in the characteristic strength of concrete on the failure strength is suggested for achieving the desired level of eco-efficiency in the design. Otherwise, optimizing the dimensions of the structural elements would be an option for achieving the optimum cost of the structure.
For controlling the cost and eco-efficiency in the columns of a building structure, it has been observed that an increase of 5 MPa in the characteristic strength of concrete had a significant effect on the entire structural assessment. This is because the columns contributed about 42% of the total concrete volume used in the design.
Based on an analytical study for achieving an optimum value of eco-efficiency in the RC design for typical Malaysian housing units, the recommendation og 20 MPa for up to 150 mm thick slabs is suggested, as well as a 35 MPa characteristic strength of concrete for columns, which would control the amount of concrete volume and the weight of the steel reinforcement.
Other than the estimation of eco-efficiency, it is also critical to investigate the nature of production, and the source of the alternative materials should also be considered in the design. For example, either it is obtained from a natural source or an industrial byproduct. In this study, two types of alternative materials, i.e., blast furnace slag and fly ash, were used, and both of them are the byproducts. Blast furnace slag is produced during the processing of iron ore in a blast furnace, whereas fly ash is obtained as a result of coal firing in a power plant. For the last few decades, fly ash has been recognized by many codes and standards as a partial substitute for cement in producing concrete. Fly ash substantially enhances many properties of hardened concrete when used as a cement replacement material; for example, it can increase the compressive strength of concrete at the age of 28 days to about 15% or 30% [
19]. In addition to that, it is also crucial to optimize the amount of fly ash as cementitious material to be added in concrete, which is based on geographic location and the climatic conditions. As high as 30% to 50% fly ash content as a cement replacement was found to be suitable for application in massive structures, such as foundations and dams, to control the thermal effects in concrete. Therefore, understanding the production of alternative material is essential to acknowledge the performance is a reinforced concrete structure. Fly ash was defined as a byproduct material from coal power plants, and it was collected from the exhaust gases by mechanical and electrostatic precipitators. High temperature combusting used in the production of fly ash, where the temperature reaches up to approximately 1500 °C. In order to increase the performance of the structure, it is vital to use materials of suitable quality with high finesse and low carbon content, because it may reduce the water demand of concrete compared to ordinary concrete. Proportionate alternative materials were necessary to implement in the design, to ensure the optimum performance of the structural elements. It should be emphasized that these benefits could be realized in well-proportioned concrete [
23]. Therefore, it is recommended that various types of industrial byproducts may be added in concrete to enhance the technical benefits, as well as the eco-efficiency of the structure.
2.2. Validation of the Eco-Efficiency Index
The regression analysis was conducted for the validation and checking the reliability of the data obtained from the simulations.
Table 3 shows the summary of all analytical results, as obtained using linear regression for calculating the eco-efficiency index for single story and double story residential houses. All results showed that the data is significant; there is a minimum possibility of errors, which was required to satisfy the requirements for each analysis. Hence, the simulation was done accurately, and the data produced was reliable for this study. The F-value of 10.51 was determined for fly ash concrete applied in the single story houses; it implies that the model is significant. It estimated that there is only a 0.11% chance that the F-value could be affected by the noise.
Similarly, when a p-value of less than 0.0500 indicates that the model terms are significant. In this case, B is a significant model term. The predicted R2 of 0.4605 was found in a good agreement with the adjusted R2 of 0.5004, where the difference was obtained less than 0.2. The ratio of 10.054 indicates an adequate signal. An F-value of 227.95 was estimated for fly ash concrete used in the double story houses, which showed that the model is significant. There is only a 0.01% chance that an F-value could be affected due to noise. p-values less than 0.0500 indicate that the model terms are significant. In this case, A, B, AB, A2, A2B, AB2, A3 are the significant model terms. The ratio of 68.419 indicates an adequate signal. This model can be used to navigate the design space.
The F-value of 5891.61, as estimated for blast furnace slag concrete based single story houses, implies that the model is significant. There is only a 0.01% chance that the F-value could be affected due to noise. p-values less than 0.0500 indicate that the model terms are significant. In this case, B is a significant model term. The predicted R2 of 0.9978 is in reasonable agreement with the adjusted R2 of 0.998. That is, the difference is less than 0.2. The ratio of 222.975 indicates an adequate signal. The F-value of 23.84 for BFS based concrete used in the double story houses implies that the model is significant. There is only a 0.01% chance that the F-value could be due to noise. p-values less than 0.0500 indicate model terms are significant. In this case, A, AB, A2, A2B, A3 are significant model terms.
The lack of fit F-value of 935.88 implies that the lack of fit is significant. There is only a 2.54% chance that a lack of fit F-value could be due to noise. The ratio of 18.786 indicates an adequate signal. In the overall analysis, the p-values of each case are significant because the values are less than 0.1000. Adequate precision measures the signal to noise ratio where the average ratio greater than four is desirable. This model can be used to navigate the design space.
Further verification is essential to ensure the reliability of the data regarding the method used and the analysis of results. The different best fit that obtained in this study verified the model found to have different patterns, although the fundamental analysis used in this study is the same. Clarification of the best fit was developed in the overall relationship of the subject studied in this research.
2.3. Predicted vs. Actual
The predicted vs. actual graph shows the overall group of data verification that obtained from the experimental works or simulation works. It shows the effect of the model and compares it against the null model. Furthermore, this graph also determines the percentage or number of outlier data that is not reliable for the overall study.
Figure 9 and
Figure 10 show the predicted vs. actual graph for single story and double story eco-efficiency index of fly ash and blast furnace slag reinforced concrete residential house.
In addition to that, all cases found that all the points were close to the fitted line with narrow confidence bands. In other words, the values were statistically significant. All the data for all four types of residential houses were found in this study in a range of predicted lines that produce low outliers’ percentage which is less than 10%. It is essential to determine the outliers, to ensure the data found in this study can develop a satisfactory correlation and reliability. On the predicted versus actual analysis of eco-efficiency index for reinforced concrete residential houses, it was found that the actual values from the simulation work was found to be accurate and produced a good fit, because it close to the fitted line with narrow confidence bands of the relationship. It was found to be a good fit for all four cases of the eco-efficiency design. Points on the left or right of the plot, furthest from the mean, have the most leverage, and effectively try to pull the fitted line toward the point. Points that are vertically distant from the line represent possible outliers. Both types of point can adversely affect the fit. Therefore, all of the cases produce the best fit between predicted and actual, with fewer than 10 percent outliers and between the acceptable range.
2.4. Response Surface Model
The response surface model explains the three-dimensional correlation of the variables obtained from analysis of eco-efficiency index, in terms of cost to carbon emission and economical score to environmental score. Therefore, in these subtopics, it explains the results for the analysis of the correlation and discussion about the importance of the development the response surface model in three-dimensional relationships.
2.4.1. Cost to Carbon Emission Correlation
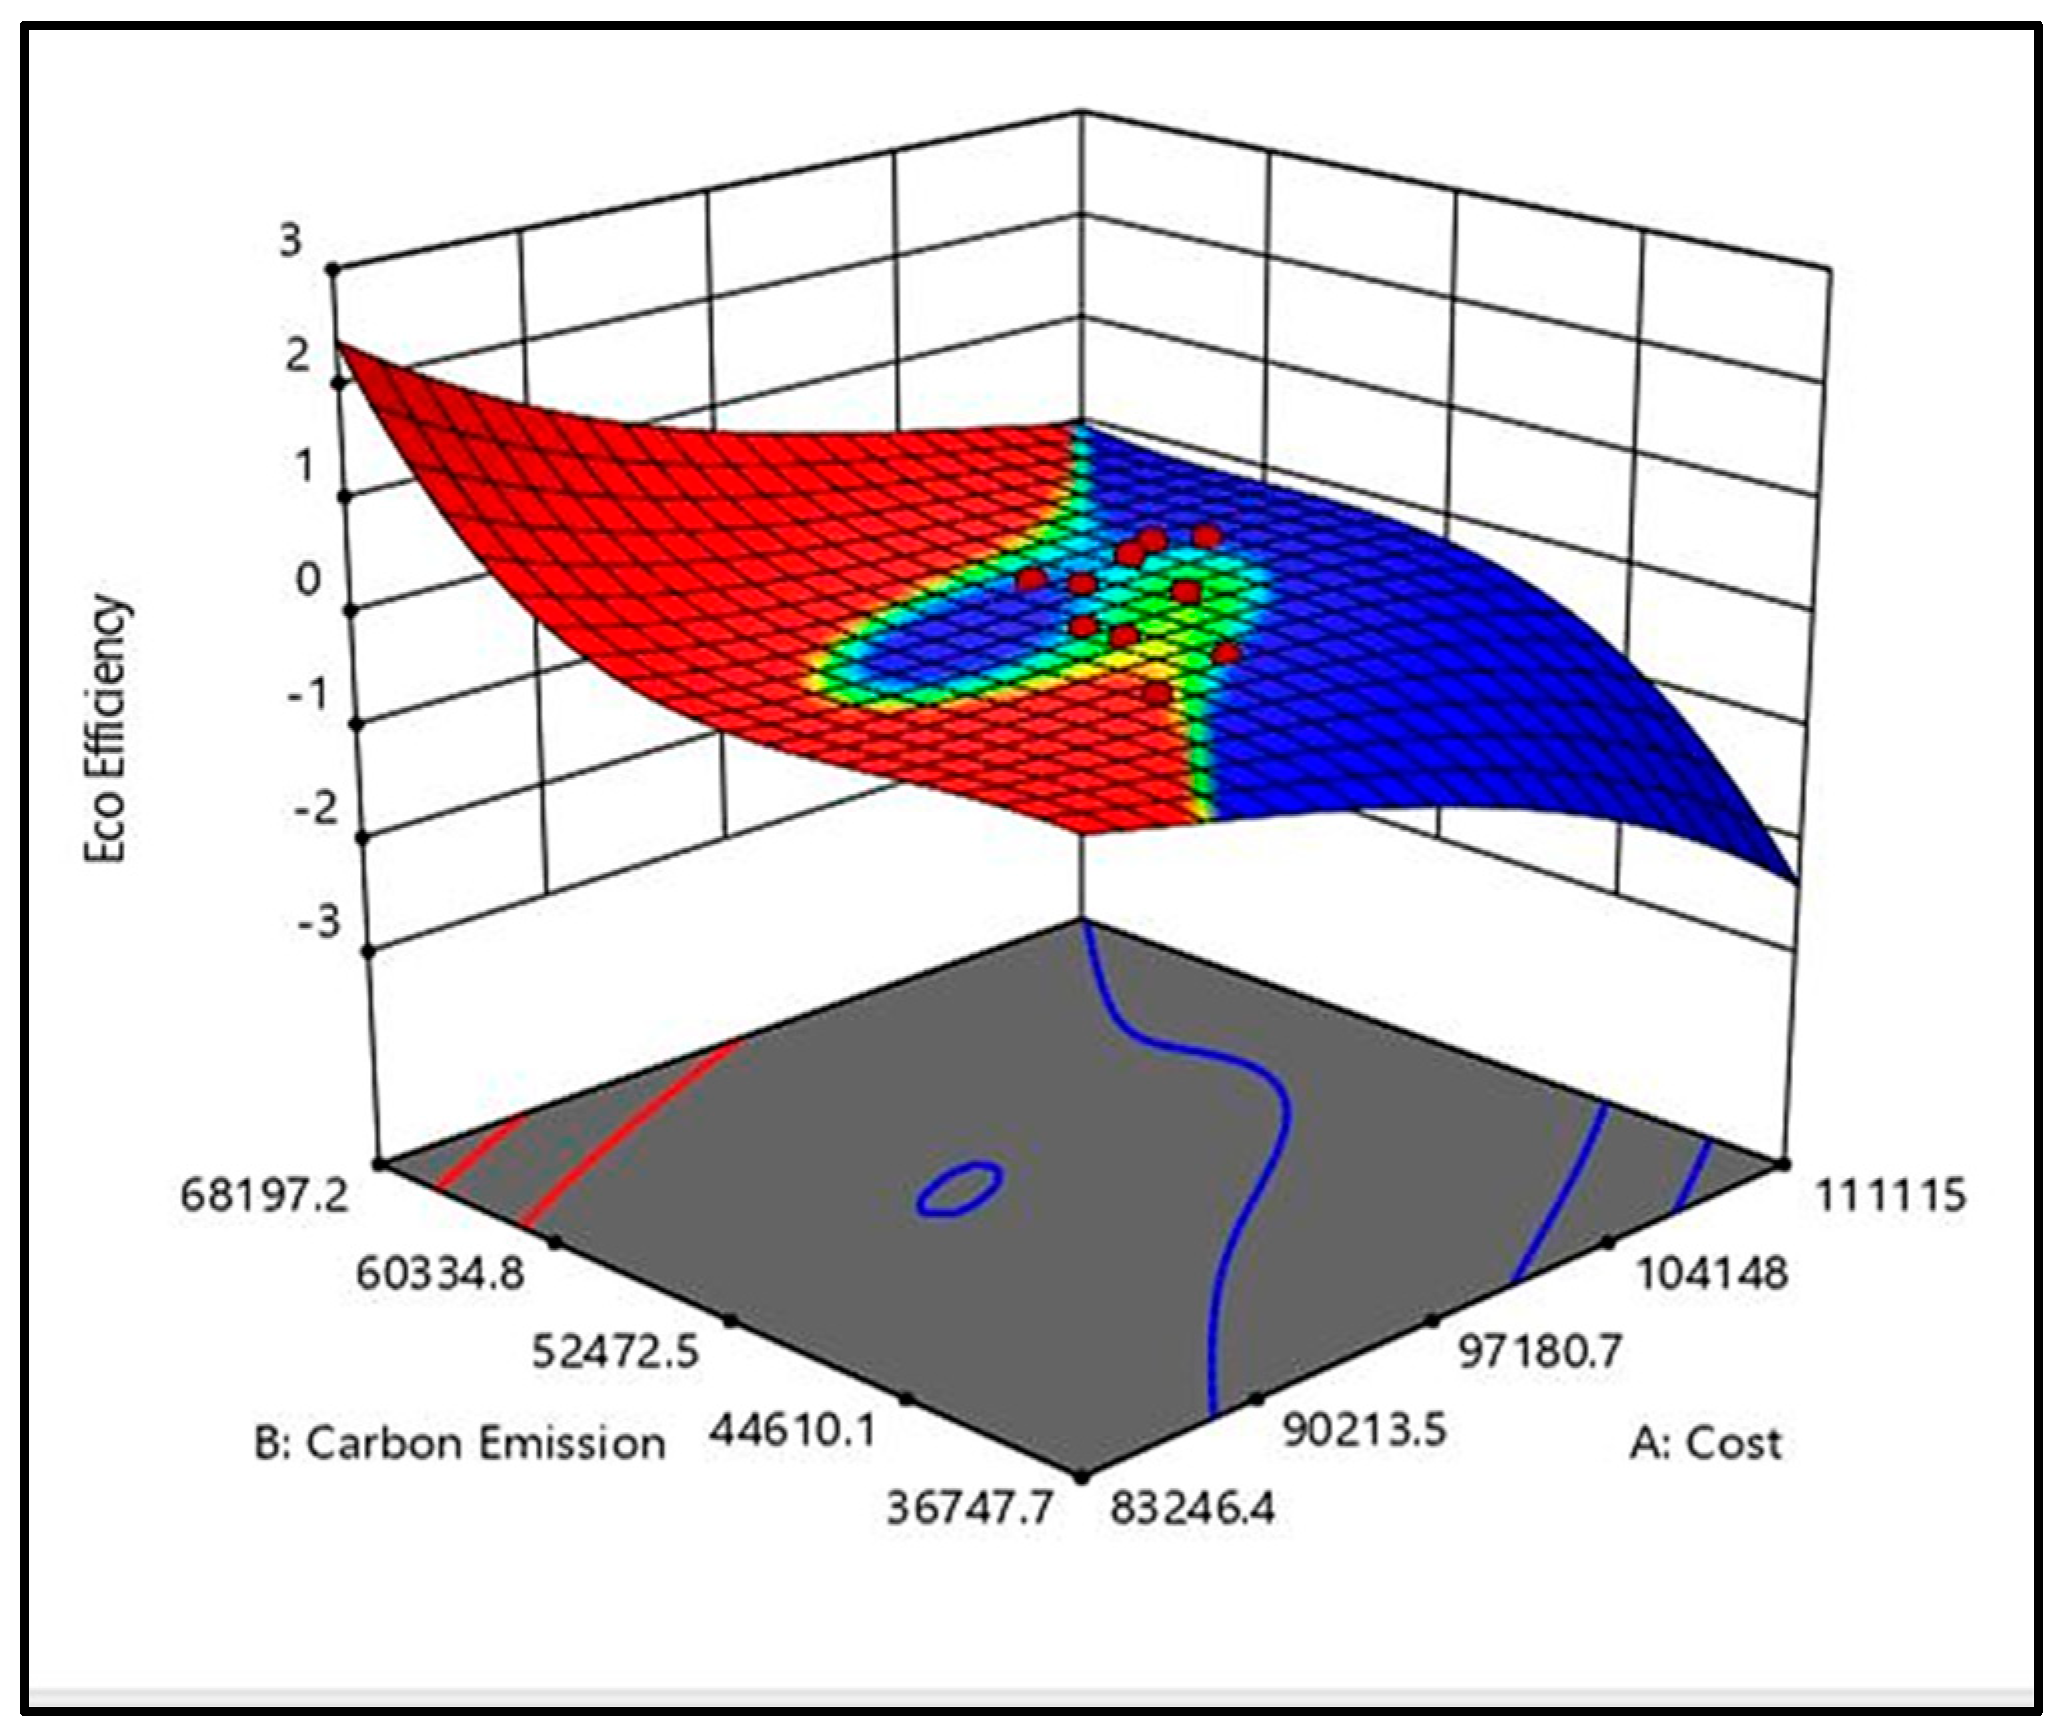
Data for cost and carbon emission correlation were developed using Design-Expert software. The 3D model graph for four main cases which are: fly ash based concrete, and blast furnace based concrete used in single story and double story residential houses. The data were collected from 20 single story houses constructed in the Perak state, Malaysia. Similarly, other data on 20 double story houses were obtained from a housing project in Pulau Pinang, Malaysia. The 3D graphs in
Figure 11 and
Figure 12 show the correlation between cost, carbon emission, and eco-efficiency of single story residential houses made with two types of concrete using fly ash or BFS. Similarly,
Figure 13 and
Figure 14 are the 3D plots for double story residential houses. For a single story house, the correlation of eco-efficiency significantly decreases with an increasing amount of carbon emissions, because high carbon emission harms the environmental score. In terms of cost correlation with eco-efficiency, it shows less cost on the element lead toward lower eco-efficiency values. The cost material might be lower due to low standard quality material use, which produces high carbon emission that causes eco-efficiency value to decrease. Eco-efficiency for fly ash shows that the material is not efficient for a reinforced concrete house, since it shows a negative value. The negative result from the amount of equivalent carbon emission for fly ash is higher than normal concrete (Ordinary Portland Cement).
In addition to that, eco-efficiency significantly decreases with an increasing amount of carbon emissions, because high carbon emission harms the environmental score. In terms of cost correlation with eco-efficiency, it shows less cost on the element lead toward lower eco-efficiency values. The cost material might be lower, due to low standard quality material use, which produces high carbon emission, which causes the eco-efficiency value to decrease. Eco-efficiency for BFS shows that the material is efficient for a reinforced concrete house, since the value for eco-efficiency is positive.
According to ANOVA analysis, the 3D model graph was plotted in cubic form for a double story house, as shown in
Figure 13 and
Figure 14. High carbon emission with the lowest cost of material results in a positive value of eco-efficiency. However, low carbon emission and high cost of material result in a negative value of eco-efficiency, because there is a relationship between the carbon emission, mean score, and eco-efficiency that represent an environmental, economic score, and eco-efficiency, respectively. The value of carbon emissions produced might be too low to overcome the extremely high-cost material used. The data plotted was mainly located at a negative value of eco-efficiency, hence, proving that fly ash is not an excellent alternative material for the reinforced concrete house.
Furthermore, high carbon emissions with the lowest cost of material and low carbon emission with low cost results in a positive value of eco-efficiency. However, low carbon emissions and the high cost of material result in a negative value of eco-efficiency, because there is a relationship between the carbon emission, economic score, and eco-efficiency, that are represented in terms of the environmental, economic score, and eco-efficiency, respectively. The value of carbon emission produced might be too low to overcome the extremely high-cost material used. The data plotted was mainly located at a positive value of eco-efficiency, hence, proving that blast furnace slag is a good alternative material for the reinforced concrete house, compared to fly ash.
2.4.2. Correlations for Environmental Score and Economic Score
The response surface model was developed for creating a three-dimensional relationship of related parameters. Furthermore, by developing a response surface model, the overall view of the actual response for each case predicted would be reliable for the sustainable structural design of the building. The response surface model was developed for each case that comprised of the relationship of eco-efficiency with economic factors and the environmental factors.
Figure 15 and
Figure 16 shows the response surface model for a single story fly ash and blast furnace slag reinforced concrete residential houses, and
Figure 17 and
Figure 18 shows the response surface model for a double story fly ash and blast furnace slag reinforced concrete residential house.
The model developed in this study showed the suitability of the cubic relationship for fly ash double story residential houses. In contrast, the other three cases best fit was found to have a linear relationship. The different best fit was based on the overall F-value and
p-value of each case calculated in the analysis using ANOVA. Linear regression is suitable to estimate the conditional mean effects of a response variable, although there are violations of the underlying assumptions in this classical linear regression [
24].
A relationship for the single story house as obtained using RSM, showed a linear relationship, which is indicated in
Table 1. The three-dimensional surface relationship shows the economic score and environmental score for single story house significantly increase the eco-efficiency index level, if the optimization of the characteristic strength of concrete produced a small difference in each value because the size of floor area is small. Furthermore, in the analysis of the response surface relationship for a double story house, a cubic relationship was produced as the best fit that is suitable for this model, as shown in
Figure 17 and
Figure 18. The three-dimensional surface relationship produces a cubic relationship, because of the data produced in the economic score and environmental score have significant differences that reflect the cubic relationship of the eco-efficiency index. Other than that, the optimization of the characteristic strength of concrete found that the total material volume produced a significant difference for a few design cases, which results in a different best fit compared to single story houses. Overall, the response surface model produces a linear surface model for eco-efficiency in reinforced concrete single story houses and a cubic relationship for eco-efficiency in reinforced concrete double story houses. The slight difference between the corresponding contours is not large, which means that they are close to each other, and the loss value does not decrease that much between the contours. These flat regions will be high regions, because their color is coded in red, which indicates the error value will be high in these regions. The response surface model represents the overall performance of an economic score and an environmental score in the eco-efficiency index of the reinforced concrete structure.


