Mechanical System and Template-Matching-Based Position-Measuring Method for Automatic Spool Positioning and Loading in Welding Wire Winding

1
Faculty of Mechanical Engineering, Jiangnan University, Wuxi 214122, China
2
Jiangsu key laboratory of advanced food manufacturing equipment technology, Jiangnan University, Wuxi 214122, China
*
Author to whom correspondence should be addressed.
Appl. Sci. 2020, 10(11), 3762; https://doi.org/10.3390/app10113762
Submission received: 15 April 2020
/
Revised: 16 May 2020
/
Accepted: 25 May 2020
/
Published: 29 May 2020
(This article belongs to the Section Applied Industrial Technologies)
Abstract
:Featured Application
The mechanical system and position-measuring method designed and proposed in this paper could be applied to develop a fully automatic winding machine for mass production of welding wire.
Abstract
Welding wire is a major type of welding consumable, which needs to be winded onto spools for sale. Currently, the winding process is accomplished manually due to obstacles such as automatic spool loading and clamping. When loading the spool, the angular position of the spool is a prerequisite for matching the drive rod on the spindle and drive bore on the spool. Therefore, this paper proposes a template-matching method combined with area-based matching and feature-point detection to measure the angular position of the spool, and presents a mechanical system that can rotate the spool to match the drive rod and push the spool onto the spindle. A novel feature-point distribution density (FPDD) method was developed to accelerate the matching process and improve matching reliability by pre-locating the searching area. The robustness and accuracy of the template-matching-based measuring method were validated using a built prototype of the mechanical system. The comparison result shows that the proposed method was superior in robustness, accuracy, and speed, and it was efficient for automatic spool loading in the welding wire winding process.
1. Introduction
Welding is a major way to produce metal structures such as stiffened plate panels [1]. Thus, the global consumption of welding consumables is enormous, and the market was valued at USD 13.79 billion in 2018, according to market-watch research [2]. There are generally two kinds of welding consumables, categorized by shape: (1) stick, such as stick electrodes, and (2) wire, including solid wires, flux-cored wires, and submerged arc-welding (SAW) wires. Wire-shaped welding consumables such as metal–inert gas (MIG) welding wire are usually wound onto small plastic spools for sale, with final weights of about 5–30 kg [3].
However, the winding process currently relies on manual operation, as shown in Figure 1, resulting in limited capacity and high cost. Furthermore, the operation requires repetitive heavy work in a noisy workshop, which presents health risks to workers. Besides the repetitive operation of clamping-disk loading and unloading and nut tightening and loosing, there is another major obstacle for fully automatic welding wire winding, which the insertion of the main axle and drive rod on the spindle, as shown in Figure 2a, precisely into the main bore and drive bore of the spool, as shown in Figure 2b. Only after this operation is completed is the spool ready to be driven, rotating together with the spindle. This operation requires high speed, and accurate and robust measurement of the spool’s angular position.
Therefore, this paper proposes a template-matching-based method to measure the angular position of the spool and provide the rotational angle, and presents a mechanical system that can lift the spool coaxial onto the spindle and rotate the spool to match the drive rod. Moreover, a novel feature-point distribution density (FPDD) strategy is proposed to accelerate the matching process and improve matching reliability by pre-locating the searching area. The angular-position-measuring method was validated using a built prototype of the mechanical system.
The remainder of this paper is organized into the following structure: relevant work for this study is summarized in Section 2; the designed mechanical system is presented in Section 3; the proposed method is described in Section 4; the experimental comparison results are discussed in Section 5; and conclusions are summarized in Section 6.
2. Related Works
The method proposed in this research for measuring the spool’s angular position is a typical application of vision-based measurement (VBM), which is a rapidly developing technology due to the increasing affordability and capability of cameras and computing hardware/software [4]. A VBM system may apply machine learning [5], pattern recognition [6], template matching [7], or other algorithms to identify and obtain measurement results from a captured image or a video stream.
Template matching is a basic and popular method applied in many fields, including transportation [8], civil infrastructure [9], textiles [10], medicine [11], security [12], office settings [13], industrial automation [14], and the semiconductor industry [15]. The functions of visual template-matching systems are varied, including measurement of angular [16] and planar [17] positions, rotation speed [18], target detection [19], visual tracking [20], and so forth. Existing template-matching algorithms can be roughly grouped into two categories: area-based matching and feature-point matching.
Area-based matching methods, sometimes called correlation-like methods, match the template and source image by moving the template image one pixel per step in an exhaustive way, calculating a metric of the similarity between the template and the particular area of the source image after each move, and selecting the template location which has the maximum metric value. The metric is based on a correlation criteria, which generally contains (1) a cross-correlation (CC), such as CC, normalized cross-correlation (NCC) [21], or zero-normalized cross-correlation (ZNCC) [22]; (2) the sum of absolute differences (SAD) and its variants, like zero mean sum of absolute differences (ZSAD) or optimized sum of absolute difference (OSAD) [23]; and (3) the sum of squared differences (SSD) [24], normalized sum of squared differences (NSSD), or zero-normalized sum of squared differences (ZNSSD) [25].
Basic area-based matching methods are computationally time consuming; thus, multiple accelerating strategies have been developed. Wei and Lai [26] proposed a fast pattern-matching algorithm based on the NCC criterion by combining an adaptive multilevel partition with the winner-update scheme, and achieved efficient template searching. Fouda [27] presented a dimension-reducing algorithm to accelerate computation by calculating the SSD in horizontal and vertical directions separately. Lai et al. [28] proposed a method named A-MNS, based on majority neighbor similarity (MNS) and the annulus projection transformation (APT). These methods were found to be effective for color-rich or strongly contrasting images, which are quite different from those in the present study.
Feature-point matching is another template-matching algorithm with high efficiency and both geometric (rotation and scale) and photometric (brightness and exposure) invariance [29]. Instead of metric calculation for all the possible locations, feature points matching detects “special” points in the template and source, and then finds point correspondences based on their local appearance. Many kinds of features have been proposed in previous works, such as Harris, FAST (features from accelerated segment test), Hessian, SIFT (scale-invariant feature transform), SURF (speeded-up robust features), BRIEF (binary robust independent elementary features), and BRISK (binary robust invariant scalable keypoints) [30]. Furthermore, Alcantarilla et al. put forward the KAZE algorithm, which exploits non-linear scale space through non-linear diffusion filtering [31]. They also presented Accelerated-KAZE (AKAZE) which improves the KAZE by constructing the non-linear scale spaces using a computationally efficient framework called fast explicit diffusion (FED) [32]. However, it was found to be unreliable to measure spool angular position directly using a template-feature-point-matching method due to the multiple similar structures and shapes on the spool that can easily cause mismatching in this case.
The FPDD strategy proposed in this paper combines area-based matching and feature-point detection. It is critical to select appropriate feature-detection algorithms with high speed and robustness for machine vision systems in industrial applications. Many works have compared the performance of different features in different applications [33,34,35], and showed that result comparison was the most effective way. To this end, different features are compared in Section 5.
3. Mechanical System
The designed mechanical system is shown in Figure 3. In contains three main units: the spindle box, the tailstock, and the lifting device, mounted on the worktable. There is a clamping disk fixed on the spindle to clamp the spool together with the rotatable pushing disk on the tail stock. A drive rod with a tapered tip is installed on the disk plate to insert into the drive bore and drive the spool to wind. The rotatable pushing disk on the tailstock can be moved forward and backward by a pneumatic cylinder to load and unload the spool. The lifting device shown in the upright of Figure 3 comprises a cylinder-driven vertical slide and the angular measuring and adjusting device mounted on the slide. The angular measuring and adjusting device includes a lifting base, two V-shaped supports, two adjusting rollers driven by a step motor, and a camera.
Initially, the spool is put on the two adjusting rollers at a random angular position. The spindle is turned to the zero position where the drive rod is exactly below the spindle main axle. In addition, the lifting device is at the low position, as shown in Figure 4a. An image of the spool is taken and the template-matching-based angular position measurement is conducted. The step motor then drives the two adjusting rollers to rotate the spool to the desired position. After that, the lifting cylinder pushes up the spool on the angular measuring and adjusting device to make sure the spool is coaxial to the spindle, as shown in Figure 4b. The pushing disk on the tailstock is then moved forward to load the spool onto the spindle and clamp it. Finally, the lifting device descends to the lowest position and the spool is ready for winding.
4. The Proposed Measuring Method
There are six to eight rib plates connecting the main bore and the wire container, as shown in Figure 2b, according to the welding wire capacity. Generally, more ribs cause more variety in light and shadow, generating more measuring complexity; therefore, in this paper, a spool with eight rib plates was assumed. The areas near the rib plates are different to other areas in brightness and contrast, and the drive bore is located at one of the rib plates which actually indicates the spool’s angular position. Thus, locating the drive bore is the most direct way to measure the spool’s angular position. However, due to the low diversity of color and brightness of the captured spool image, it was found to be unreliable to locate the drive bore through circle-detecting methods like the Hough transform.
As mentioned above, template matching presents good performance in similar applications, but normal area-based template matching is computationally time-consuming and less robust to image rotation. In this case, the drive rod bore may be in any angular position, resulting in different brightness and shadow shape; multiple templates were therefore necessary to improve the accuracy, as discussed in Section 5. Moreover, due to the limited illumination and monotone color of the spool, it was found that matching credibility was not high enough.
To solve these problems, an FPDD strategy was proposed to initially locate the potential matching zone, and then the corresponding template was selected to conduct accurate template matching. The workflow of the proposed spool-angular-position-measuring method is shown in Figure 5, and the method is detailed in the following.
4.1. Image Pre-Processing
Initially, the captured RGB mode image was converted to grayscale using the following equation.
where , , and are intensity values of the R, G, and B components of point . A grayscale image of a spool with eight rib plates is shown in Figure 6a.
View transfer was then applied to reconstruct the front view image of the spool by perspective-transform principle using Equations (2) and (3) [36]. The process is shown in Figure 6b.
where (x,y) is the position of the point in the new coordinate corresponding to (u,v) in the original coordinate. Equation (2) is usually abbreviated as , where R is a homogeneous matrix calculated from given transform parameters.
The ideal ROI (region of interest) is an annulus area concentric with the center bore. To simplify the computation, a minimum enclosing rectangle range was intercepted as the real ROI, as shown in Figure 6c.
4.2. FPDD Strategy
Boundary-sensitive features such as SIFT, SURF, ORB (Oriented FAST and Rotated BRIEF), and AKAZE [37] were potential indicators of the rib plates and the drive bore. In addition, AKAZE [38] and MinEigen [39] algorithms have been to be found superior in feature-point density for remote sensing. AKAZE was finally adopted, and it is compared to other features in Section 5.
As shown in Figure 6c, the AKAZE algorithm was applied to detect feature points in the ideal ROI. It was found that the distribution densities of feature points near the rib plate were very high and few feature points could be found in the rib plate area. DBSCAN [40] (Density-Based Spatial Clustering of Applications with Noise) is a popular density-based clustering algorithm which has been successfully used in many real-world applications [41]. It was applied in this paper to cluster feature points into several groups corresponding to rib plates and drive bores, as shown in Figure 6c, where feature points in different clusters are marked in different colors. Some feature points away from the rib plate areas were eliminated as outliers.
Coordinate transformation was then conducted to convert feature points into polar coordinates ( and ), and the origin of the polar coordinates coincided with the center of the main bore. To keep pace with the drive bore position (), the zero degree line was downward from the center of the main bore and the clockwise direction was defined as the positive direction. The FPDD was defined as the standard deviation of angular position of feature points distributed in each cluster. The is defined in Equation (3).
where is the cluster () of feature points, is the total number of clusters, is a feature point, is the angular position of the feature point, and function represents the calculation of standard deviation.
The s calculated for the eight clusters when the drive bore was at zero position () are shown in Figure 7, in which the horizontal axis represents the mean angular position of feature points in each cluster. The horizontal axis value of the cluster with the highest () was regarded as the angular position of the drive bore.
We then defined as the error between actual spool angular position and the pre-located position in Equation (5).
To check the robustness of the FPDD strategy, we calculated for . The result is shown in Figure 8. We found that all values were in the range , presenting acceptable robustness.
4.3. Accurate Matching
Since was in the range , accurate matching was conducted in the range . The template was pre-intercepted from different angular spool positions at each degree from to . Thus, there were 360 templates in total. The exact template used for accurate matching was that closest to . The position where the matching metric reached the highest value was considered to be the drive bore location. The accurately matched spool angular position was then calculated by transforming the matched location to spool angular coordinate using Equation (6). The process is shown in Figure 9.
where () is the position of the center point of the matched template, and () is the position of the center of the main bore. The zero point is at the upper left corner of the image.
5. Experiments and Discussion
A prototype of the designed structure was built and tested. A servomotor is applied to drive the spindle, and a photoelectric sensor was used to indicate the initial position. A six-axis motion controller (Model SMC-48, ADHON Tech Co., Ltd., Ningbo, Zhejiang, China) was applied to provide pulse signals to drive the spindle and the adjusting roller, and to actuate the electromagnetic valves. The initial position was adjusted using a cross-line laser level meter. The spools used for experiments were white spools with 20 kg wire-containing capacity, eight rib plates, and 300 mm outer diameter. The mechanical system was tested for its capability to adjust the spool position, and to load and clamp the spool. The camera employed was a common commercial camera with 1280 × 720 resolution. Illumination was obtained using an LED lamp fixed on top of the spindle box. The machine-vision-based method was validated on a computer with an Intel(R) Core (TM) i7-8700 CPU @ 3.20GHz (Intel Corporation, Santa Clara, CA, USA), 16GB RAM and Windows 10 64-bit OS (Version 1909, Microsoft Corporation, Redmond, WA, USA). Algorithms were coded and run on Matlab 2019a (Version 9.6, The MathWorks, Inc., Natick, MA, USA).
5.1. Comparison of Feature-Detecting Algorithms
Different algorithms including SIFT, SURF, ORB, and MinEigen were selected and compared with AKAZE. The FPDD results where the spool was at zero position () are shown in Figure 10. It was found that SURF detected the fewest feature points, ORB detected more but was still insufficient for FPDD, SIFT performed better in number of feature points but the distribution location was away from the rib plates, and the MinEigen shows great feature-point density and good matching of the rib plates.
However, as shown in Figure 10f, when the actual drive rod position was , the MinEigen feature points distributed in two major groups, which were opposite to each other on the bore. Therefore, two clusters were generated and the pre-located position was far from the actual position. When taking a closer look at the feature points, it was found that there were far fewer MinEigen feature points compared to AKAZE in the designated area, where the arc-shaped edge generated by the contrast between the bore and shadow was found, as shown in Figure 10e. The reason for fewer MinEigen feature points is that, similarly to Harris [42] using Equation (7), MinEigen [43] detects corner features using Equation (8), which eliminates edge features that show a big difference between and .
where and are two Eigenvalues of matrix in the intensity change Equation (9).
where is the change of intensity when the corner of the detector window shifts with increment .
Both KAZE and AKAZE showed blurring in images at multiple scale levels while retaining the boundaries of regions by non-linear diffusion filtering. The KAZE detector applies a standard nonlinear diffusion formula, as shown in Equation (10), and AKAZE adopts a computationally efficient framework called fast explicit diffusion (FED).
where and are, respectively, the divergence and gradient operators, and is a conductivity function to make the diffusion adaptive to the local image structure.
5.2. Comparison of FPDD and Direct Template Matching
The proposed machine-vision-based method was validated when , and the result is shown in Figure 11. The displayed values are the errors between the measured values and actual values. We found that the measuring errors were in the range of [−1°, 0.5°], which was good enough to insert the drive rod into the drive bore. Moreover, the average time for each measurement was 0.868 s.
If we were to directly conduct template matching (cross-correlation criterion) using a single template, the drive bore at zero position () for instance, a lot of mismatching would be found. Even if we use eight templates, as shown in Figure 12, and select the matching with the highest correlation, there are still some mismatching results, as shown in Figure 13. Moreover, the average time for each measurement by direct template matching was 7.981 s.
6. Conclusions
This paper proposes a template-matching method combined with area-based matching and feature-point detection to measure the angular position of a welding wire spool, and presents a mechanical system that can rotate the spool to match the drive rod and push the spool onto the spindle. The robustness and accuracy of the template-matching-based measuring method were validated using a built prototype of the mechanical system. Based on the above, the following conclusions were made.
- (1)
- A novel feature-point distribution density (FPDD) strategy was developed to accelerate the matching process and to improve matching reliability by pre-locating the searching area. The FPDD strategy was based on the AKAZE feature-detection algorithm and the pre-locating accuracy was tested in range of [] with good robustness.
- (2)
- AKAZE was found to be the most suitable algorithm for this application due to its high efficiency, high feature density, and edge-preserving properties compared to other algorithms such as SIFT, SURF, ORB, and MinEigen.
- (3)
- The proposed method was superior in robustness, accuracy, and speed and it was efficient for automatic spool positioning in the welding wire winding process, with [−1°, 0.5°] accuracy and less than 1 s computation time.
- (4)
- Multi-template matching was unable to measure the angular position of welding wire spool due to too much mismatching, even with eight templates.
Author Contributions
Conceptualization, J.X.; Project administration, J.X.; Resources, W.J.; Software, X.H.; Writing—original draft, J.X.; Writing—review & editing, J.X. All authors have read and agree to the published version of the manuscript.
Funding
This research was funded by the National Natural Science Foundation of China [Grant No. 51805212] and the Natural Science Foundation of Jiangsu Province grant number BK20160182. And the APC was funded by the Natural Science Foundation of Jiangsu Province.
Acknowledgments
This research is supported by the National Natural Science Foundation of China [Grant No. 51805212] and the Natural Science Foundation of Jiangsu Province [Grant No. BK20160182].
Conflicts of Interest
The authors declare no conflicts of interest.
References
- Mondal, A.K.; Biswas, P.; Bag, S. Prediction of welding sequence induced thermal history and residual stresses and their effect on welding distortion. Weld. World 2017, 61, 711–721. [Google Scholar] [CrossRef]
- Welding Consumables Market: Global Industry Trends, Share, Size, Growth, Opportunity and Forecast 2019–2026. Available online: https://www.marketwatch.com/press-release/welding-consumables-market-global-industry-trends-share-size-growth-opportunity-and-forecast-2019-2026-2019-11-07 (accessed on 20 April 2020).
- Reeser, M.A. Welding Complete, Techniques, Project Plans & Instructions, 2nd ed.; Cool Springs Press: Brentwood, TN, USA, 2017; ISBN 159186691X. [Google Scholar]
- Shirmohammadi, S.; Ferrero, A. Camera as the instrument: The rising trend of vision based measurement. IEEE Instrum. Meas. Mag. 2014, 17, 41–47. [Google Scholar] [CrossRef]
- Cho, B.H.; Kaji, D.; Cheung, Z.B.; Ye, I.B.; Tang, R.; Ahn, A.; Carrillo, O.; Schwartz, J.T.; Valliani, A.A.; Oermann, E.K.; et al. Automated Measurement of Lumbar Lordosis on Radiographs Using Machine Learning and Computer Vision. Glob. Spine J. 2019. [Google Scholar] [CrossRef] [Green Version]
- Zhao, C.; Cheung, C.F.; Liu, M. Nanoscale measurement with pattern recognition of an ultra-precision diamond machined polar microstructure. Precis. Eng. 2019, 56, 156–163. [Google Scholar] [CrossRef]
- Huang, Y.; Gao, J.; Zhang, L.; Deng, H.; Chen, X. Fast template matching method in white-light scanning interferometry for 3D micro-profile measurement. Appl. Opt. 2020, 59, 1082. [Google Scholar] [CrossRef] [PubMed]
- Puranic, A.; Deepak, K.; Umadevi, V. Vehicle Number Plate Recognition System: A Literature Review and Implementation using Template Matching. Int. J. Comput. Appl. 2016, 134, 12–16. [Google Scholar] [CrossRef]
- Xu, Y.; Brownjohn, J.M.W. Review of machine-vision based methodologies for displacement measurement in civil structures. J. Civ. Struct. Health Monit. 2018, 8, 91–110. [Google Scholar] [CrossRef] [Green Version]
- Hanbay, K.; Talu, M.F.; Özgüven, Ö.F. Fabric defect detection systems and methods—A systematic literature review. Optik (Stuttg) 2016, 127, 11960–11973. [Google Scholar] [CrossRef]
- Bouget, D.; Allan, M.; Stoyanov, D.; Jannin, P. Vision-based and marker-less surgical tool detection and tracking: A review of the literature. Med. Image Anal. 2017, 35, 633–654. [Google Scholar] [CrossRef] [Green Version]
- Othman, N.; Dorizzi, B.; Garcia-Salicetti, S. OSIRIS: An open source iris recognition software. Pattern Recognit. Lett. 2016, 82, 124–131. [Google Scholar] [CrossRef]
- Sun, Y.; Mao, X.; Hong, S.; Xu, W.; Gui, G. Template Matching-Based Method for Intelligent Invoice Information Identification. IEEE Access 2019, 7, 28392–28401. [Google Scholar] [CrossRef]
- Shih, H.-C.; Yu, K.-C. A New Model-Based Rotation and Scaling-Invariant Projection Algorithm for Industrial Automation Application. IEEE Trans. Ind. Electron. 2016, 63, 4452–4460. [Google Scholar] [CrossRef]
- Huang, S.-H.; Pan, Y.-C. Automated visual inspection in the semiconductor industry: A survey. Comput. Ind. 2015, 66, 1–10. [Google Scholar] [CrossRef]
- Chen, Y.-S.; Wang, J.-Y. Computer Vision-Based Approach for Reading Analog Multimeter. Appl. Sci. 2018, 8, 1268. [Google Scholar] [CrossRef] [Green Version]
- Feng, D.; Feng, M.; Ozer, E.; Fukuda, Y. A Vision-Based Sensor for Noncontact Structural Displacement Measurement. Sensors 2015, 15, 16557–16575. [Google Scholar] [CrossRef]
- Guo, J.; Zhu, C.; Lu, S.; Zhang, D.; Zhang, C. Vision-based measurement for rotational speed by improving Lucas–Kanade template tracking algorithm. Appl. Opt. 2016, 55, 7186. [Google Scholar] [CrossRef]
- Zhang, T.; Li, J.; Jia, W.; Sun, J.; Yang, H. Fast and robust occluded face detection in ATM surveillance. Pattern Recognit. Lett. 2018, 107, 33–40. [Google Scholar] [CrossRef]
- Liu, F.; Gong, C.; Huang, X.; Zhou, T.; Yang, J.; Tao, D. Robust Visual Tracking Revisited: From Correlation Filter to Template Matching. IEEE Trans. Image Process. 2018, 27, 2777–2790. [Google Scholar] [CrossRef] [Green Version]
- Sarvaiya, J.N.; Patnaik, S.; Bombaywala, S. Image Registration by Template Matching Using Normalized Cross-Correlation. In Proceedings of the 2009 International Conference on Advances in Computing, Control, and Telecommunication Technologies, Bangalore, India, 28–29 December 2009; IEEE: Piscataway, NJ, USA, 2009; pp. 819–822. [Google Scholar]
- Di Stefano, L.; Mattoccia, S.; Tombari, F. ZNCC-based template matching using bounded partial correlation. Pattern Recognit. Lett. 2005, 26, 2129–2134. [Google Scholar] [CrossRef]
- Nikan, S.; Ahmadi, M. Partial Face Recognition Based on Template Matching. In Proceedings of the 2015 11th International Conference on Signal-Image Technology & Internet-Based Systems (SITIS), Bangkok, Thailand, 23–27 November 2015; IEEE: Piscataway, NJ, USA, 2015; pp. 160–163. [Google Scholar]
- Hisham, M.B.; Yaakob, S.N.; Raof, R.A.A.; Nazren, A.A.; Embedded, N.M.W. Template Matching using Sum of Squared Difference and Normalized Cross Correlation. In Proceedings of the 2015 IEEE Student Conference on Research and Development (SCOReD), Kuala Lumpur, Malaysia, 13–14 December 2015; IEEE: Piscataway, NJ, USA, 2015; pp. 100–104. [Google Scholar]
- Pan, B. Reliability-guided digital image correlation for image deformation measurement. Appl. Opt. 2009, 48, 1535. [Google Scholar] [CrossRef]
- Wei, S.D.; Lai, S.H. Fast normalized cross correlation based on adaptive multilevel winner update. In Lecture Notes in Computer Science (including subseries Lecture Notes in Artificial Intelligence and Lecture Notes in Bioinformatics); Springer: Berlin/Heidelberg, Germany, 2007; Volume 4810 LNCS, pp. 413–416. [Google Scholar] [CrossRef]
- Fouda, Y.M. A Robust Template Matching Algorithm Based on Reducing Dimensions. J. Signal Inf. Process. 2015, 6, 109–122. [Google Scholar] [CrossRef] [Green Version]
- Lai, J.; Lei, L.; Deng, K.; Yan, R.; Ruan, Y.; Jinyun, Z. Fast and robust template matching with majority neighbour similarity and annulus projection transformation. Pattern Recognit. 2020, 98, 107029. [Google Scholar] [CrossRef]
- Feng, D.; Feng, M.Q. Computer vision for SHM of civil infrastructure: From dynamic response measurement to damage detection—A review. Eng. Struct. 2018, 156, 105–117. [Google Scholar] [CrossRef]
- Hassaballah, M.; Abdelmgeid, A.A.; Alshazly, H.A. Image Features Detection, Description and Matching; Springer: Cham, Switzerland, 2016; pp. 11–45. [Google Scholar]
- Alcantarilla, P.F.; Bartoli, A.; Davison, A.J. KAZE Features. In Lecture Notes in Computer Science (including Subseries Lecture Notes in Artificial Intelligence and Lecture Notes in Bioinformatics); Springer: Berlin/Heidelberg, Germany, 2012; Volume 7577 LNCS, pp. 214–227. ISBN 9783642337826. [Google Scholar]
- Alcantarilla, P.; Nuevo, J.; Bartoli, A. Fast Explicit Diffusion for Accelerated Features in Nonlinear Scale Spaces. In Proceedings of the British Machine Vision Conference 2013, Bristol, UK, 9–13 September 2013; British Machine Vision Association: Oxford, UK, 2013; pp. 13.1–13.11. [Google Scholar]
- Tareen, S.A.K.; Saleem, Z. A comparative analysis of SIFT, SURF, KAZE, AKAZE, ORB, and BRISK. In Proceedings of the 2018 International Conference on Computing, Mathematics and Engineering Technologies (iCoMET), Sukkur, Pakistan, 3–4 March 2018; IEEE: Piscataway, NJ, USA, 2018; Volume 2018-January, pp. 1–10. [Google Scholar]
- Bian, J.; Zhang, L.; Liu, Y.; Lin, W.-Y.; Cheng, M.-M.; Reid, I.D. Image Matching: An Application-oriented Benchmark. arXiv 2017, arXiv:1709.03917. [Google Scholar]
- Lumini, A.; Nanni, L. Recent Advances in Computer Vision; Studies in Computational Intelligence; Hassaballah, M., Hosny, K.M., Eds.; Springer International Publishing: Cham, Switzerland, 2019; Volume 804, ISBN 978-3-030-02999-9. [Google Scholar]
- Choi, B.D.; Han, J.W.; Kim, C.S.; Ko, S.J. Frame rate up-conversion using perspective transform. IEEE Trans. Consum. Electron. 2006, 52, 975–982. [Google Scholar] [CrossRef]
- Chien, H.-J.; Chuang, C.-C.; Chen, C.-Y.; Klette, R. When to use what feature? SIFT, SURF, ORB, or A-KAZE features for monocular visual odometry. In Proceedings of the 2016 International Conference on Image and Vision Computing New Zealand (IVCNZ), Palmerston North, New Zealand, 21–22 November 2016; IEEE: Piscataway, NJ, USA, 2016; pp. 1–6. [Google Scholar]
- Demchev, D.; Volkov, V.; Kazakov, E.; Alcantarilla, P.F.; Sandven, S.; Khmeleva, V. Sea Ice Drift Tracking From Sequential SAR Images Using Accelerated-KAZE Features. IEEE Trans. Geosci. Remote Sens. 2017, 55, 5174–5184. [Google Scholar] [CrossRef]
- Faraji, M.R.; Qi, X.; Jensen, A. Computer vision–based orthorectification and georeferencing of aerial image sets. J. Appl. Remote Sens. 2016, 10, 036027. [Google Scholar] [CrossRef]
- Ester, M.; Kriegel, H.-P.; Sander, J.; Xu, X. A density-based algorithm for discovering clusters a density-based algorithm for discovering clusters in large spatial databases with noise. In Proceedings of the 2nd International Conference on Knowledge Discovery and Data Mining, Portland, OR, USA, 2–4 August 1996; pp. 226–231. [Google Scholar]
- Schubert, E.; Sander, J.; Ester, M.; Kriegel, H.P.; Xu, X. DBSCAN Revisited, Revisited: Why and How You Should (Still) Use DBSCAN. ACM Trans. Database Syst. 2017, 42, 1–21. [Google Scholar] [CrossRef]
- Harris, C.; Stephens, M. A Combined Corner and Edge Detector. In Proceedings of the Alvey Vision Conference 1988, Manchester, UK, 31 August–2 September 1988; pp. 1–6. [Google Scholar]
- Shi, J. Tomasi Good features to track. In Proceedings of the IEEE Conference on Computer Vision and Pattern Recognition CVPR-94, Seattle, WA, USA, 21–23 June 1994; IEEE Computer Society Press: Los Alamitos, CA, USA, 1994; Volume 169, pp. 593–600. [Google Scholar]
Figure 1.
Manual operation of welding wire winding. The spool is installed onto the spindle, clamped by the clamping disk, and fastened by a nut. A swing arm is applied to assist the worker to load and unload the clamping disk.
Figure 1.
Manual operation of welding wire winding. The spool is installed onto the spindle, clamped by the clamping disk, and fastened by a nut. A swing arm is applied to assist the worker to load and unload the clamping disk.

Figure 2.
The spindle structure of a current winding machine (a) and the welding wire spool (b).
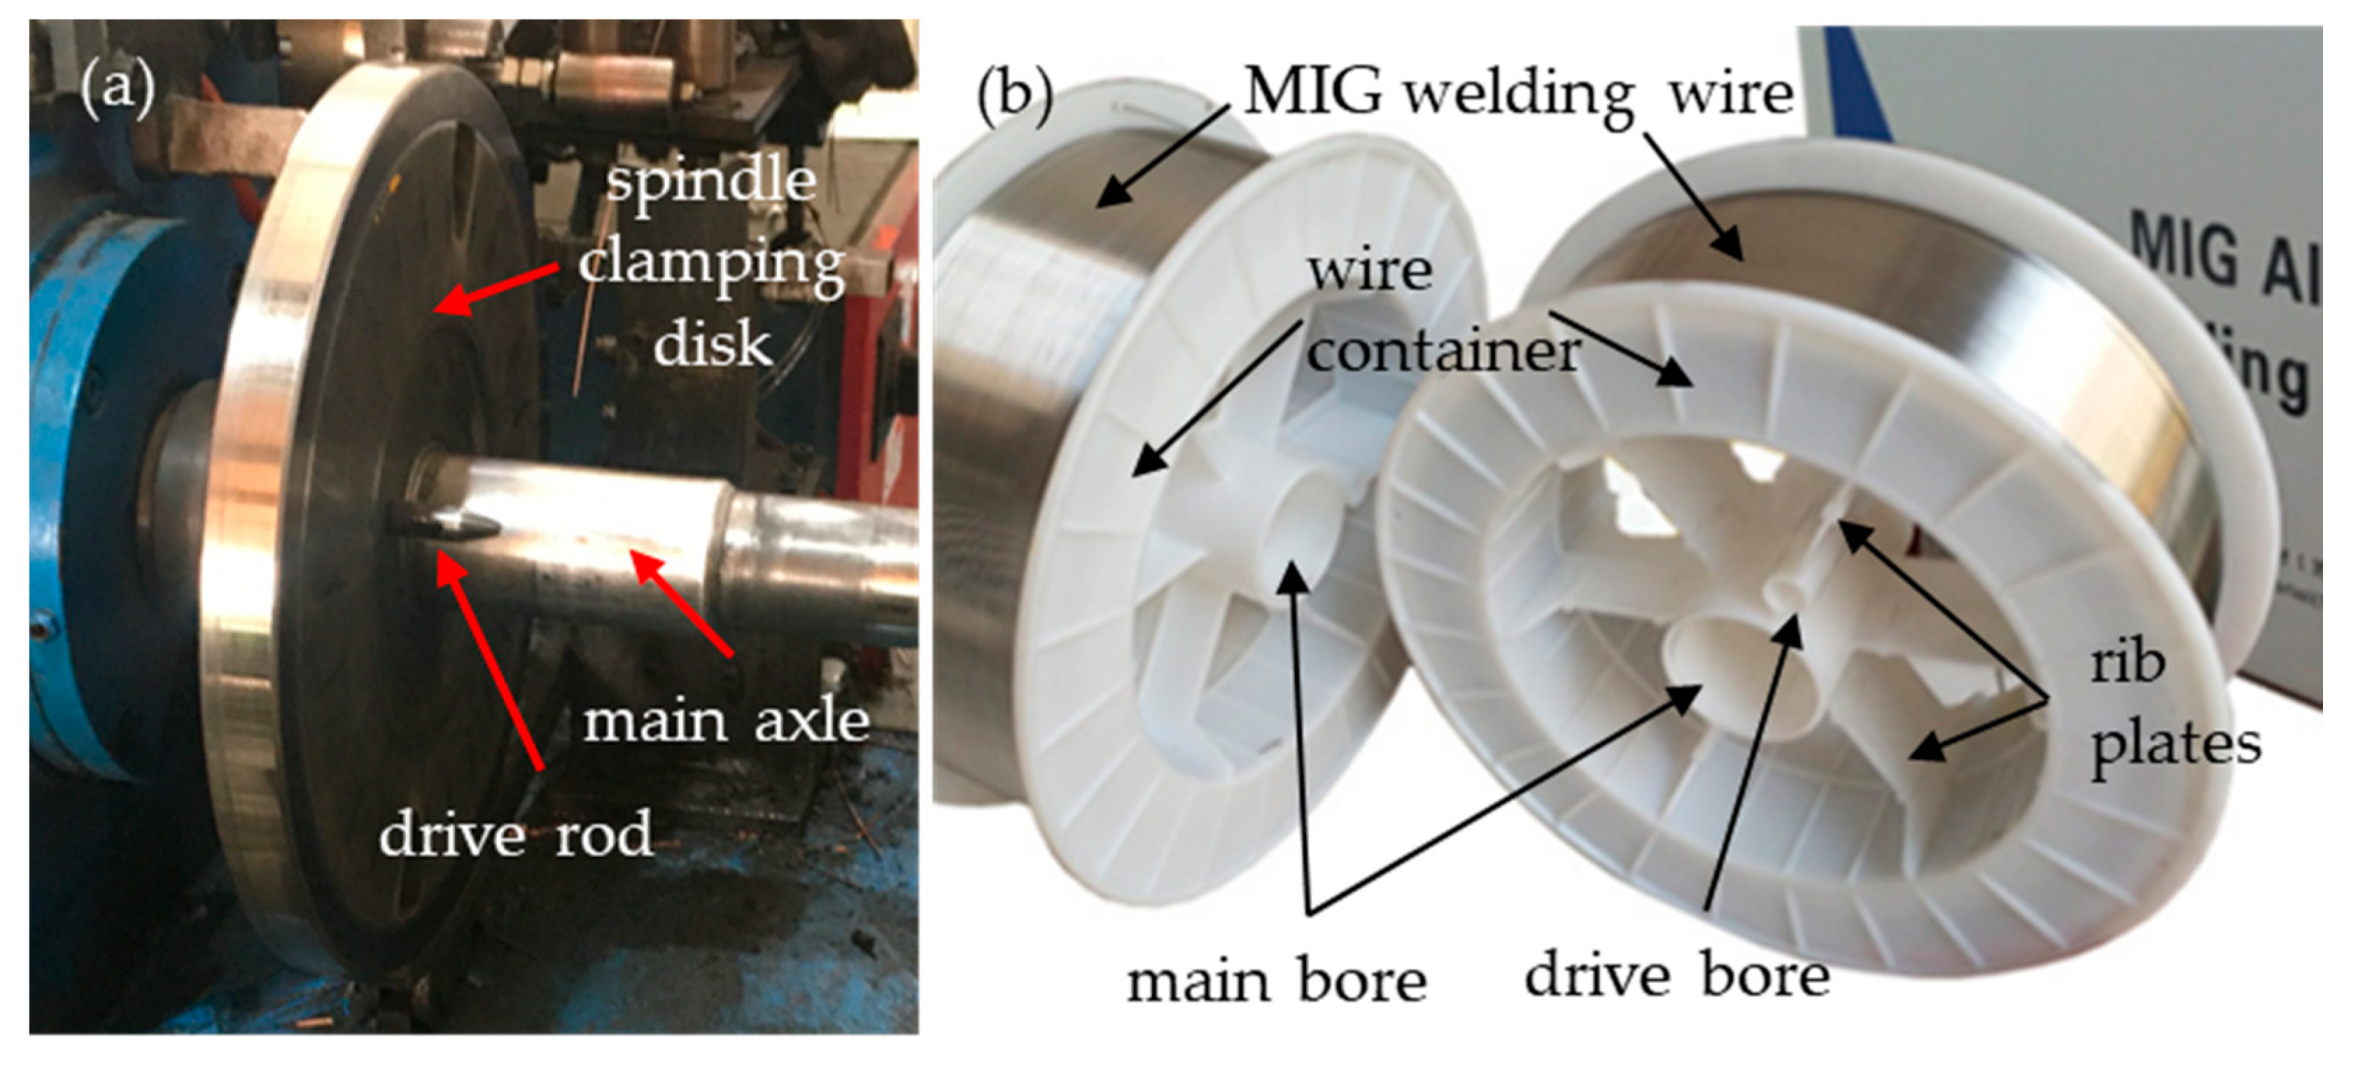
Figure 3.
The designed mechanical system for automatic spool loading and clamping.
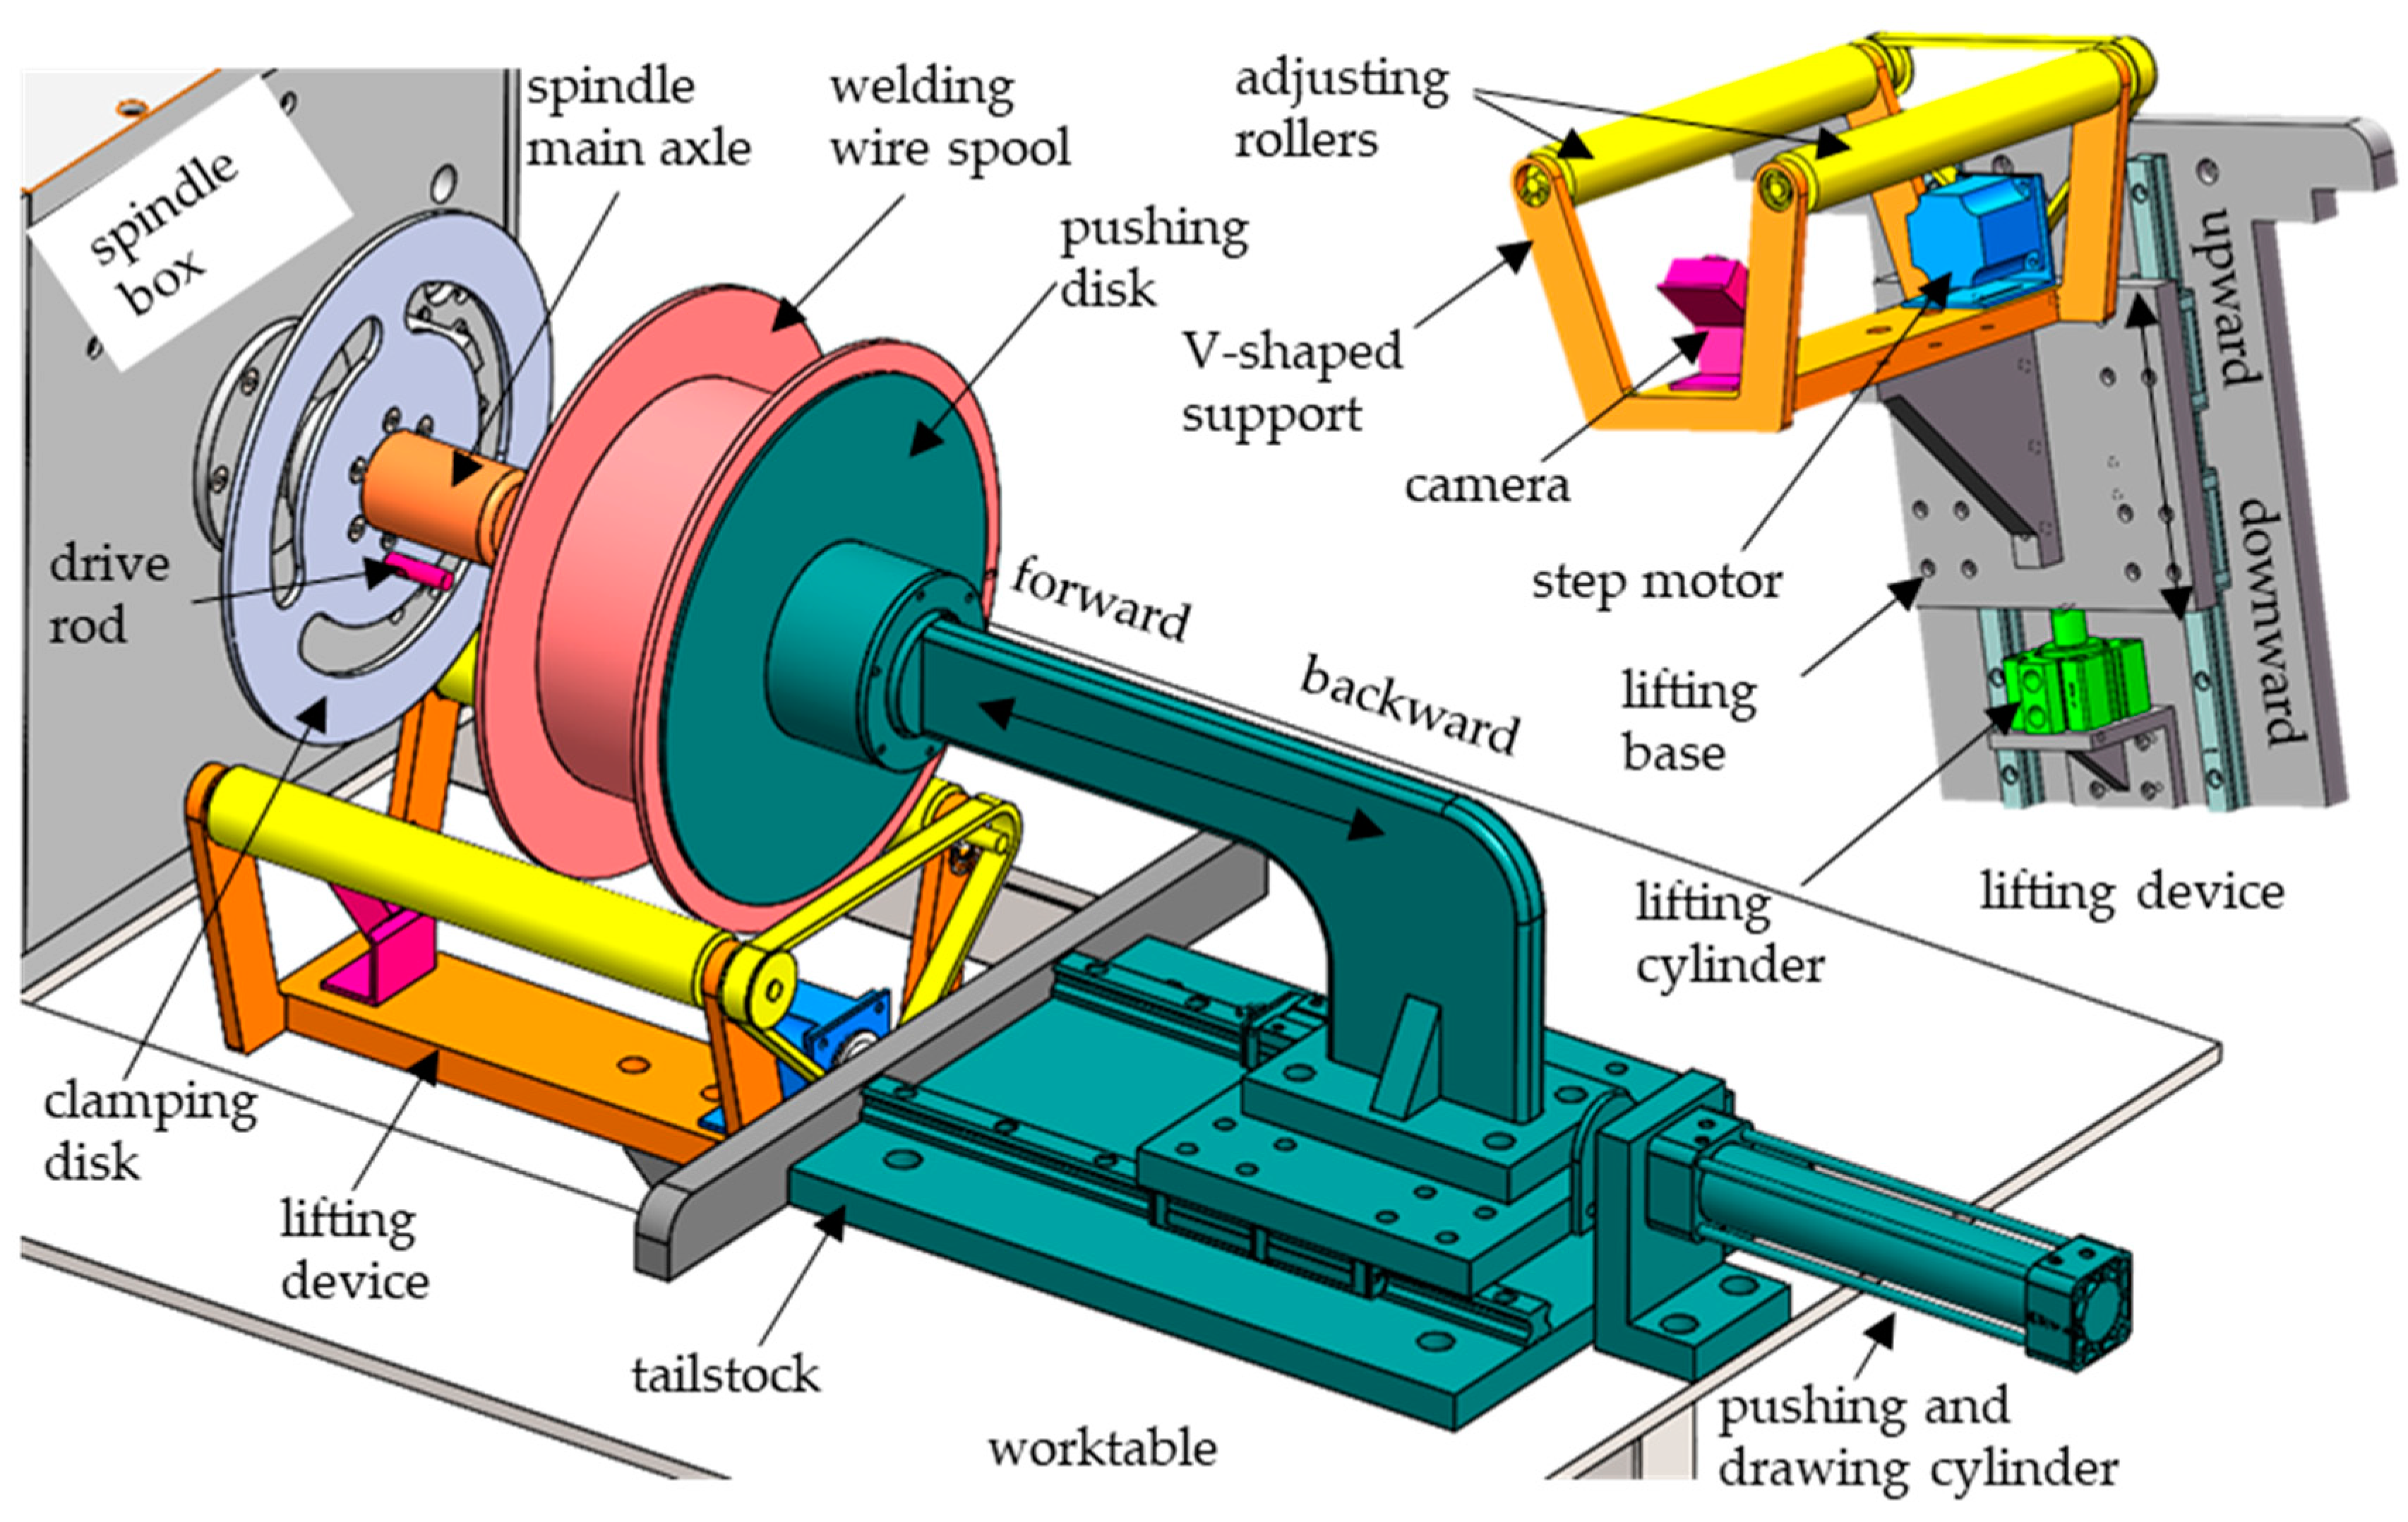
Figure 4.
Automatic spool positioning and loading process: (a) spool angular position measurement and adjustment; (b) spool loading and clamping.
Figure 4.
Automatic spool positioning and loading process: (a) spool angular position measurement and adjustment; (b) spool loading and clamping.
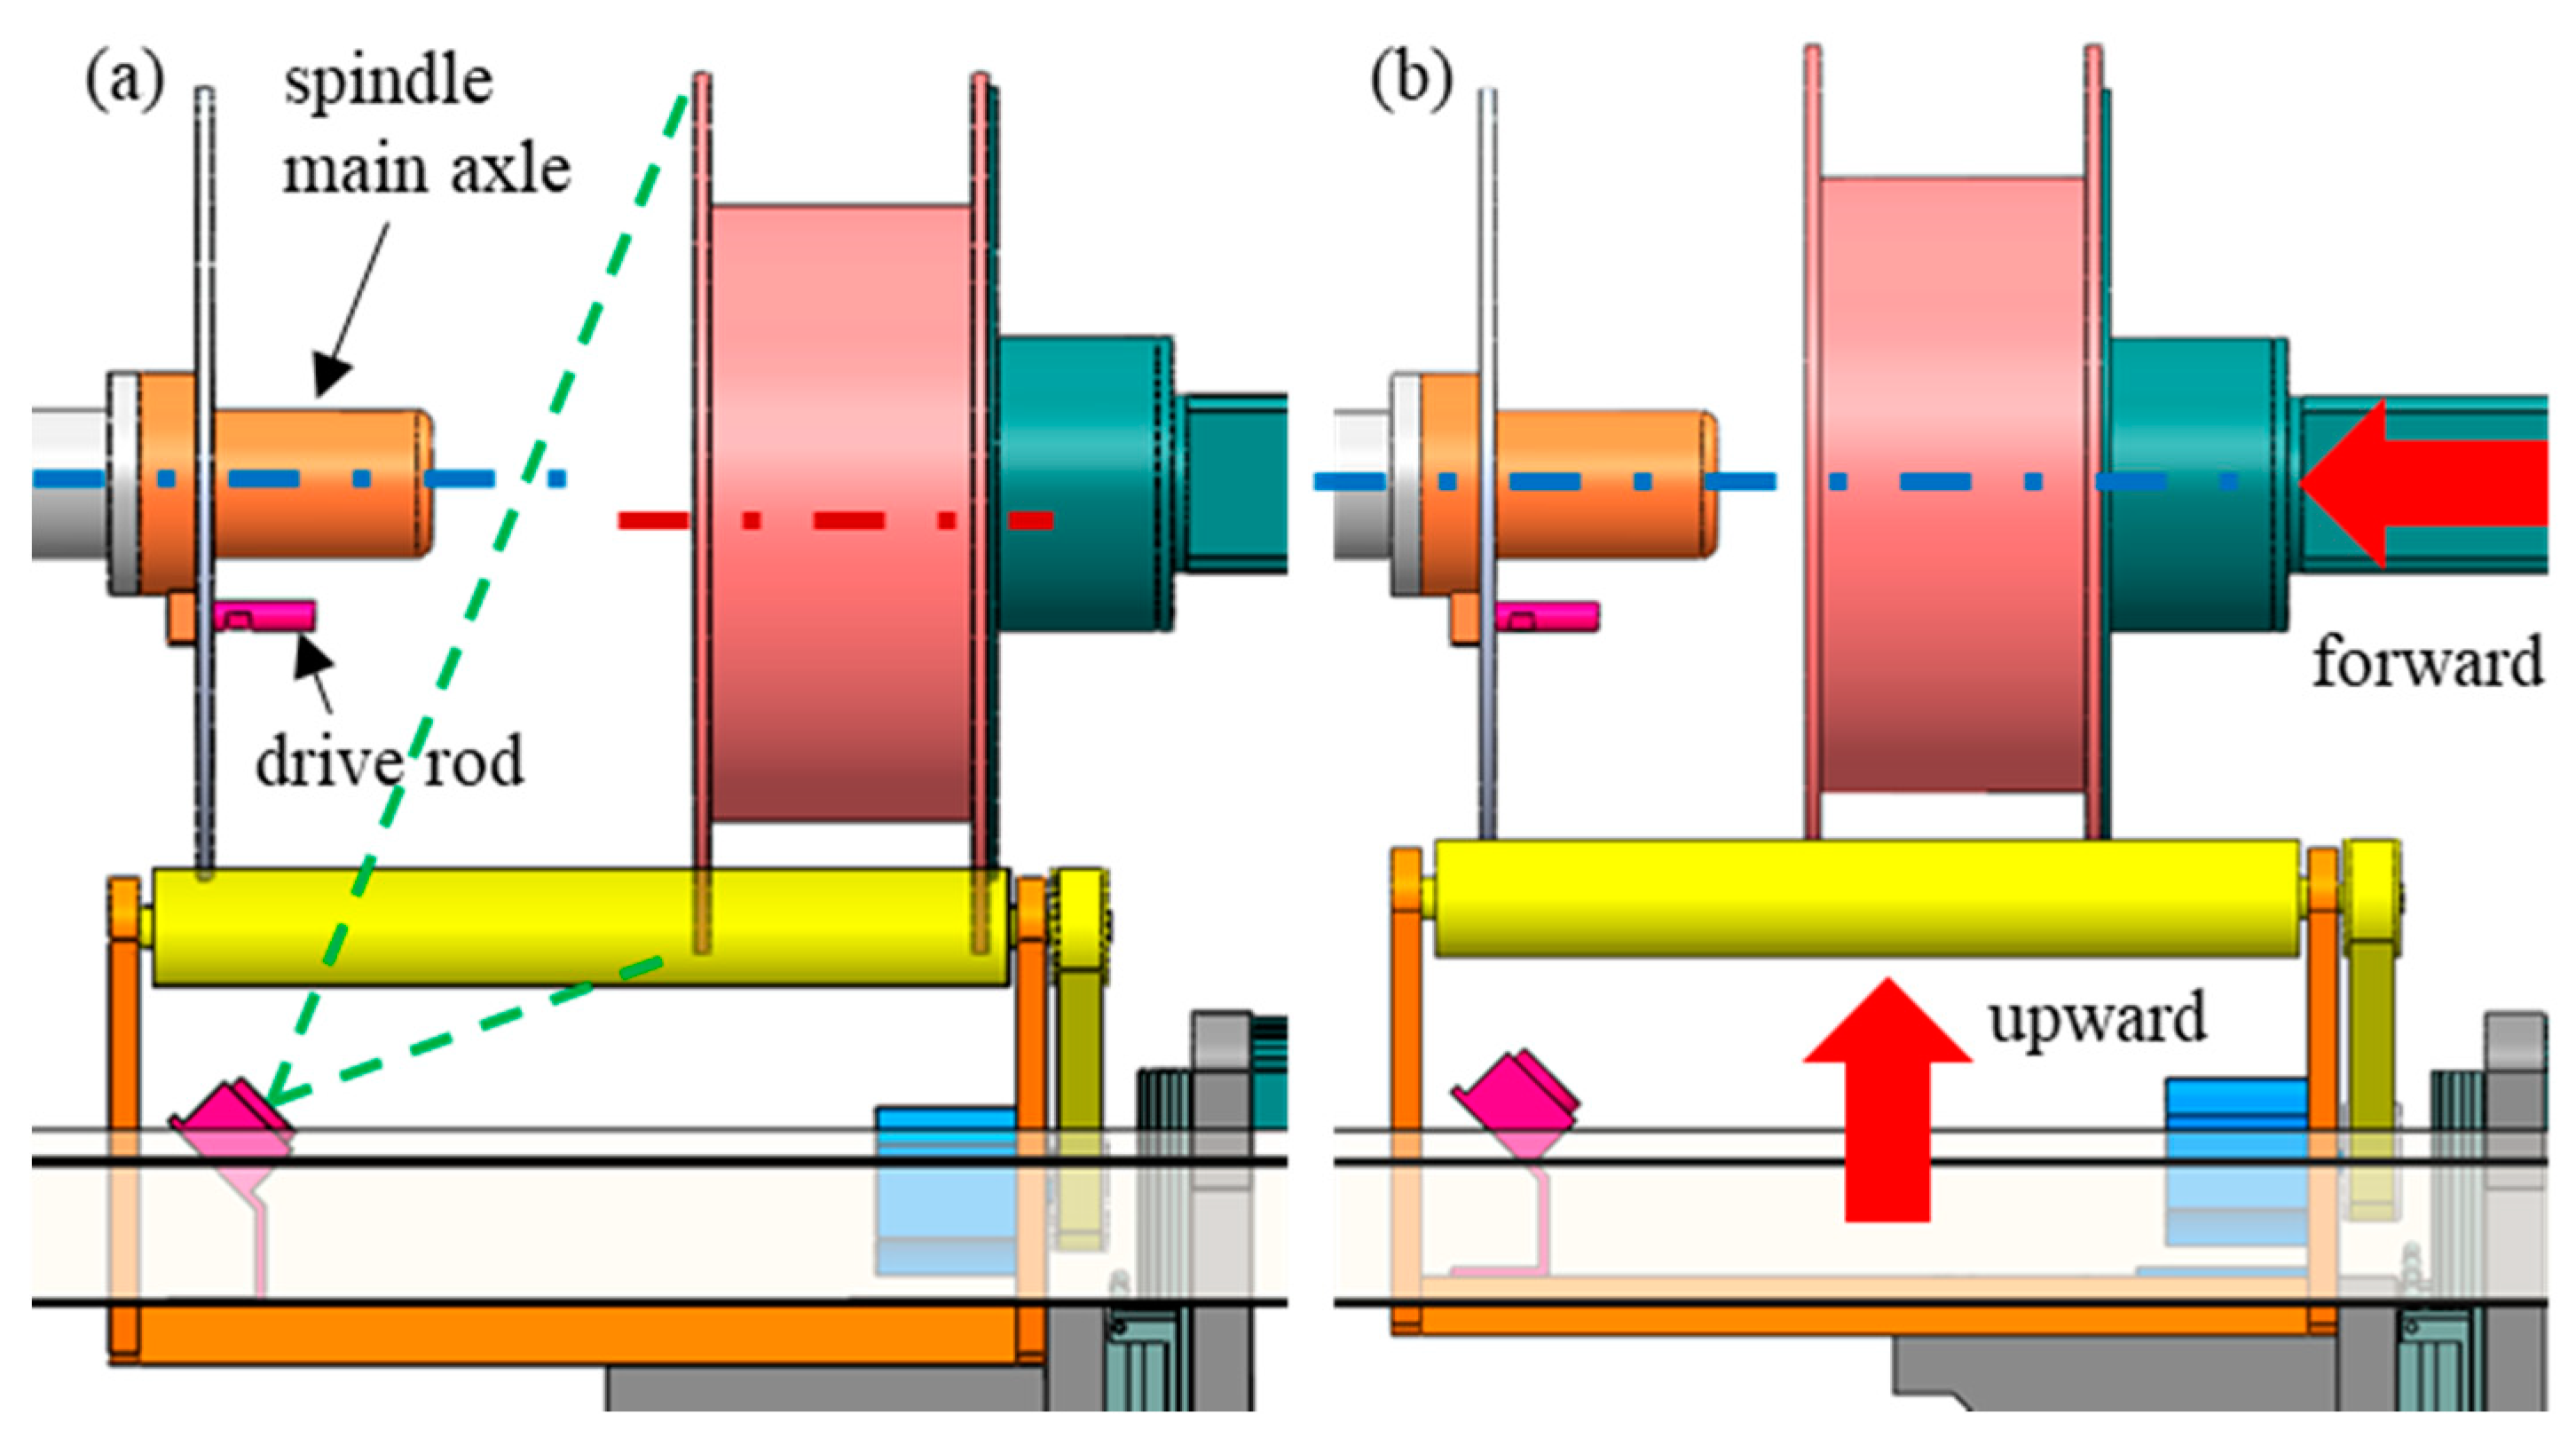
Figure 5.
Workflow of the proposed spool-angular-position-measuring method.
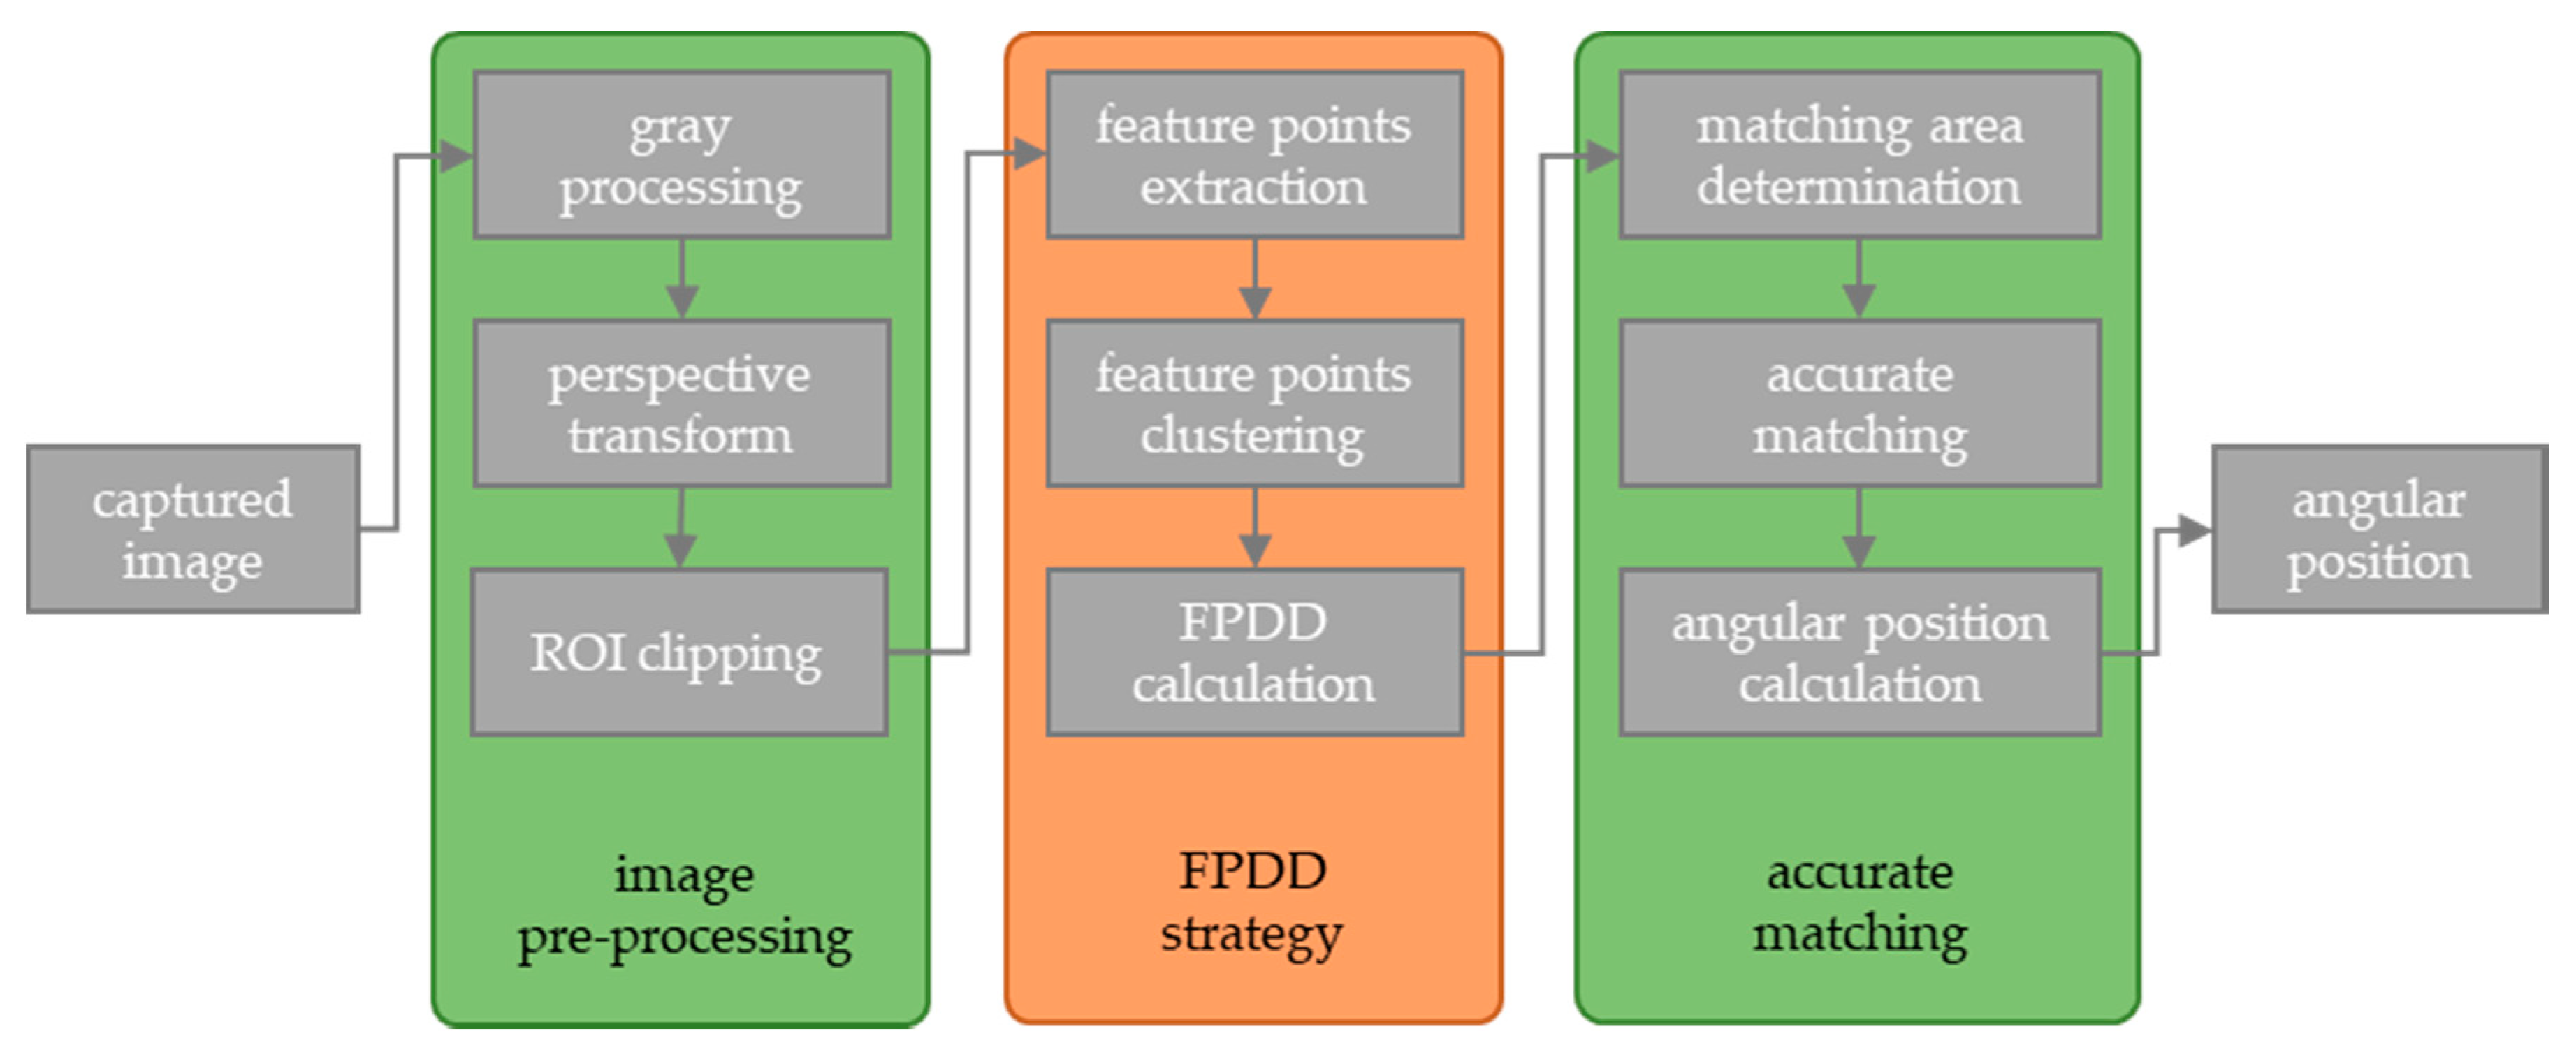
Figure 6.
Image pre-processing and FPDD: (a) original captured image, (b) perspective transform and the ROI, (c) the FPDD strategy. Points with same color are clustered into one group, and the isolated red point is recognized as outlier.
Figure 6.
Image pre-processing and FPDD: (a) original captured image, (b) perspective transform and the ROI, (c) the FPDD strategy. Points with same color are clustered into one group, and the isolated red point is recognized as outlier.
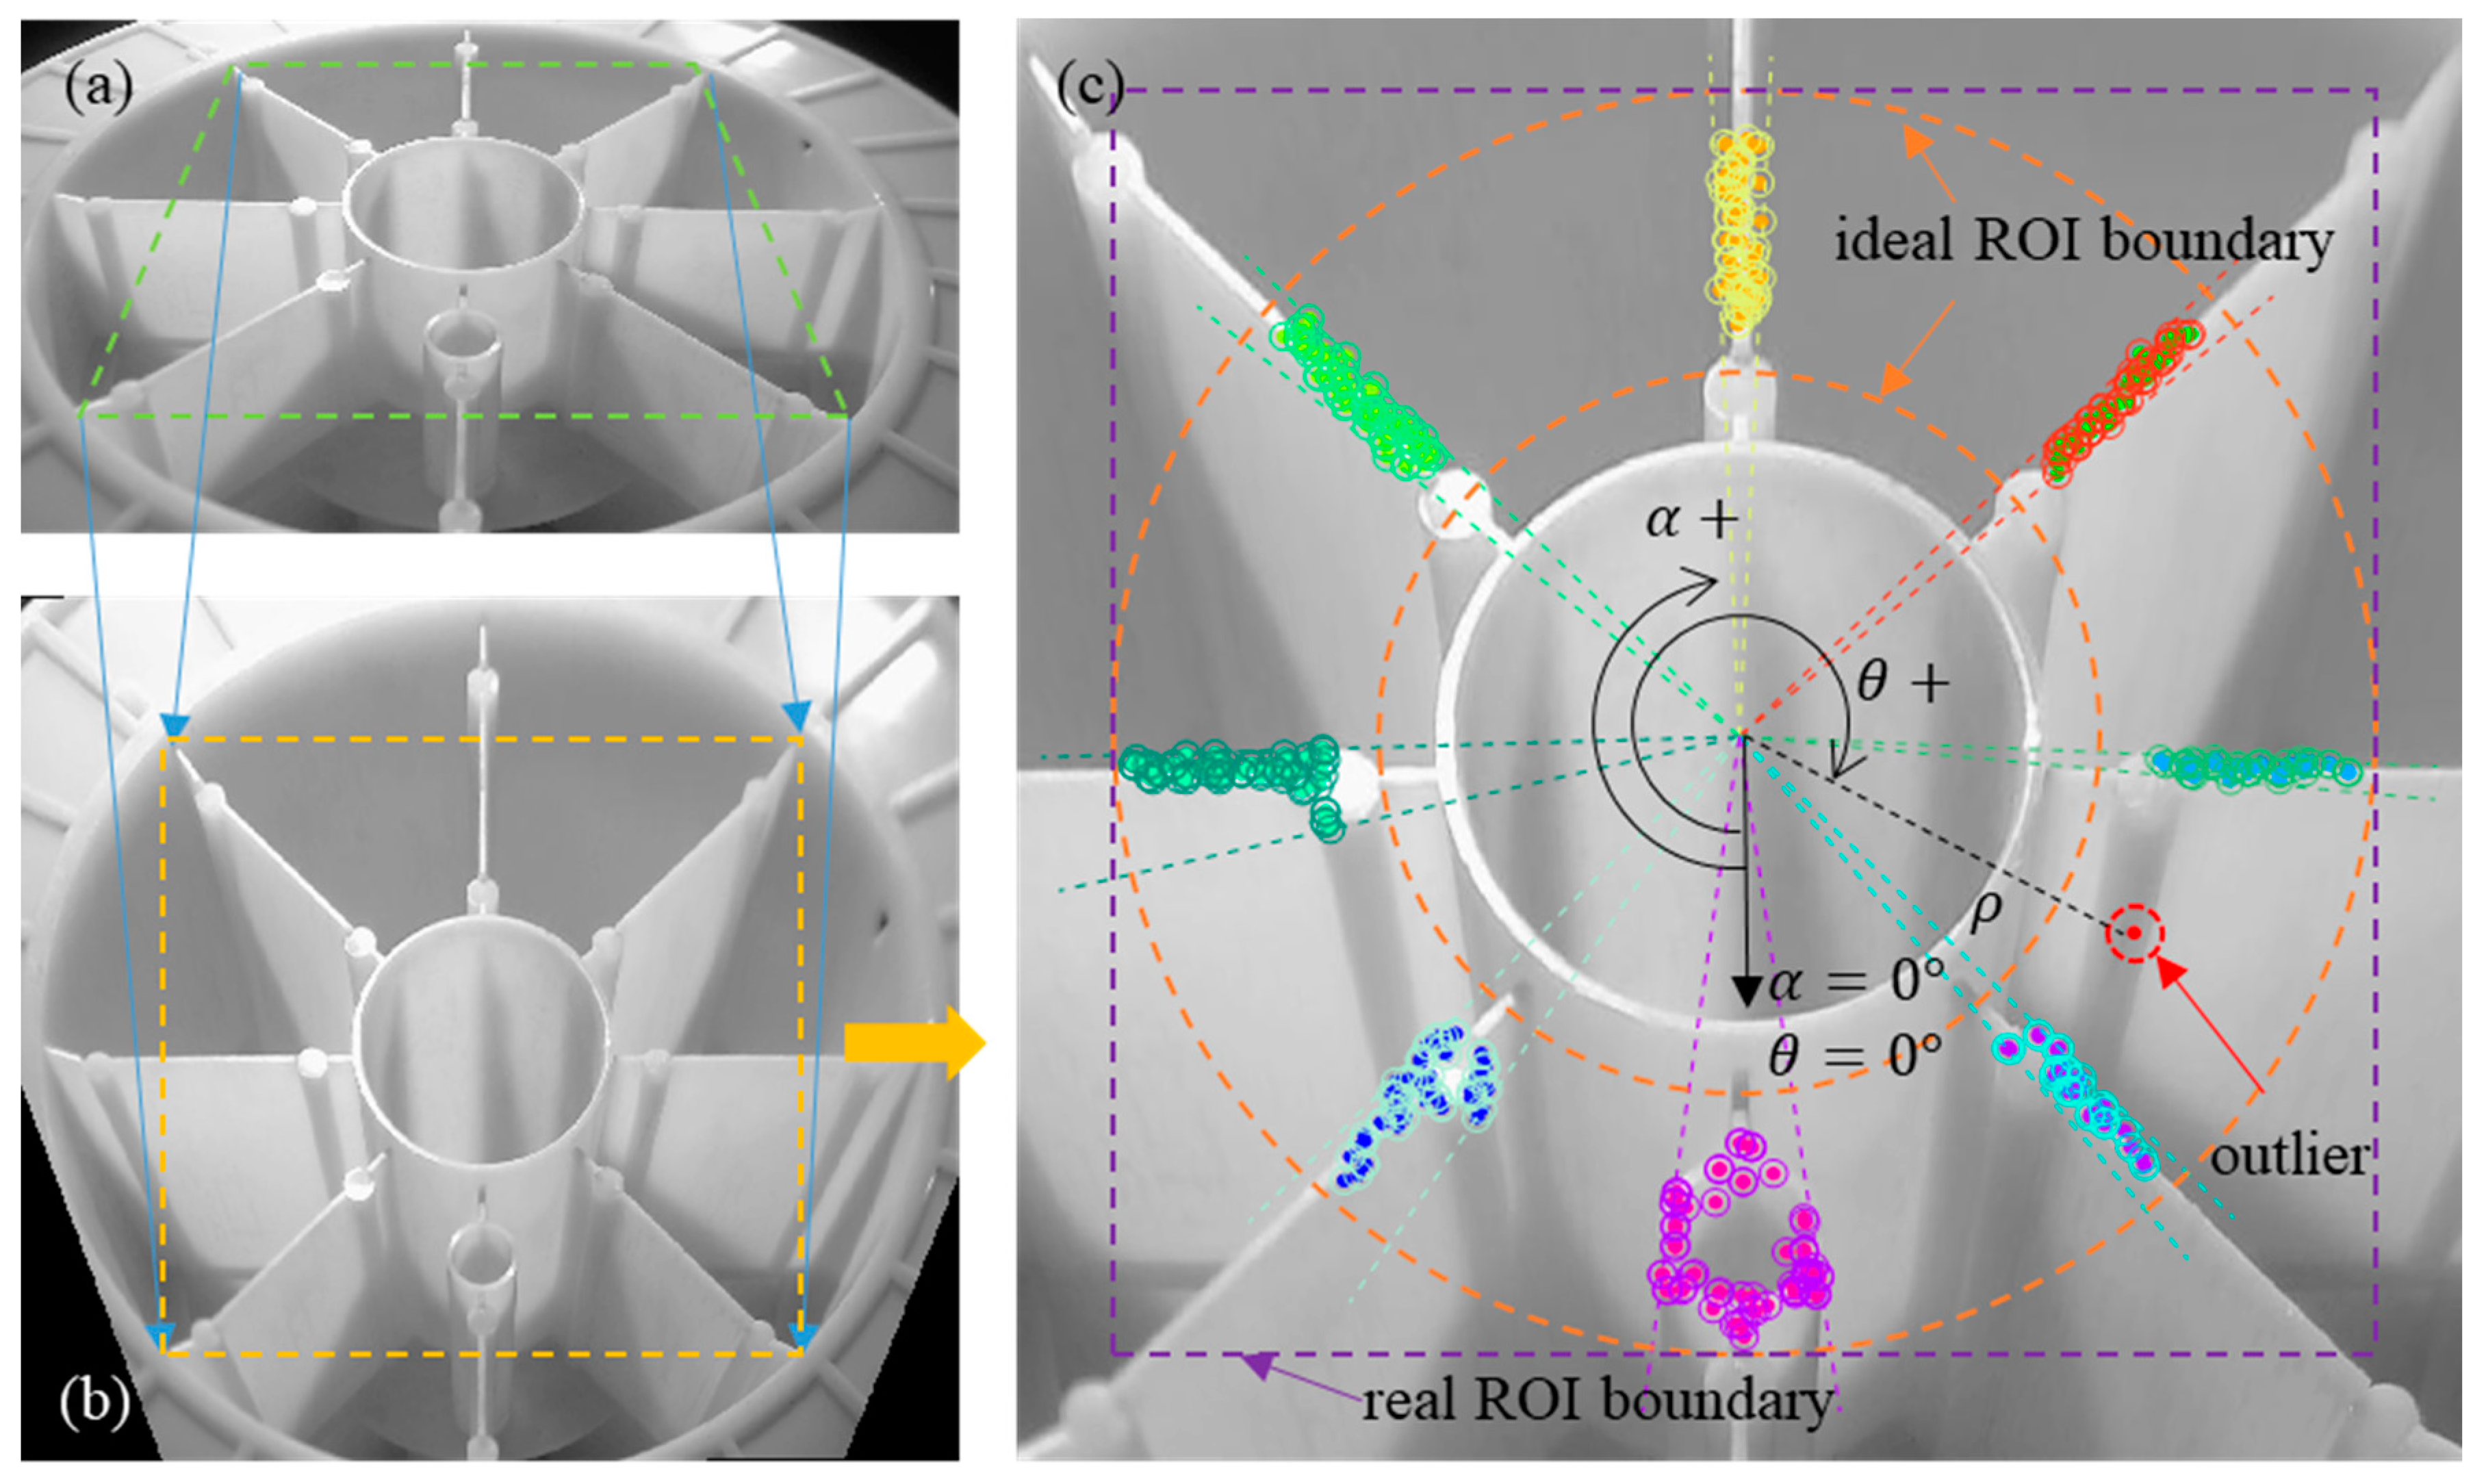
Figure 7.
Calculated FPDDs for eight feature-point clusters.

Figure 8.
Robustness investigation result for FPDD: for

Figure 9.
Accurate matching in pre-located area.
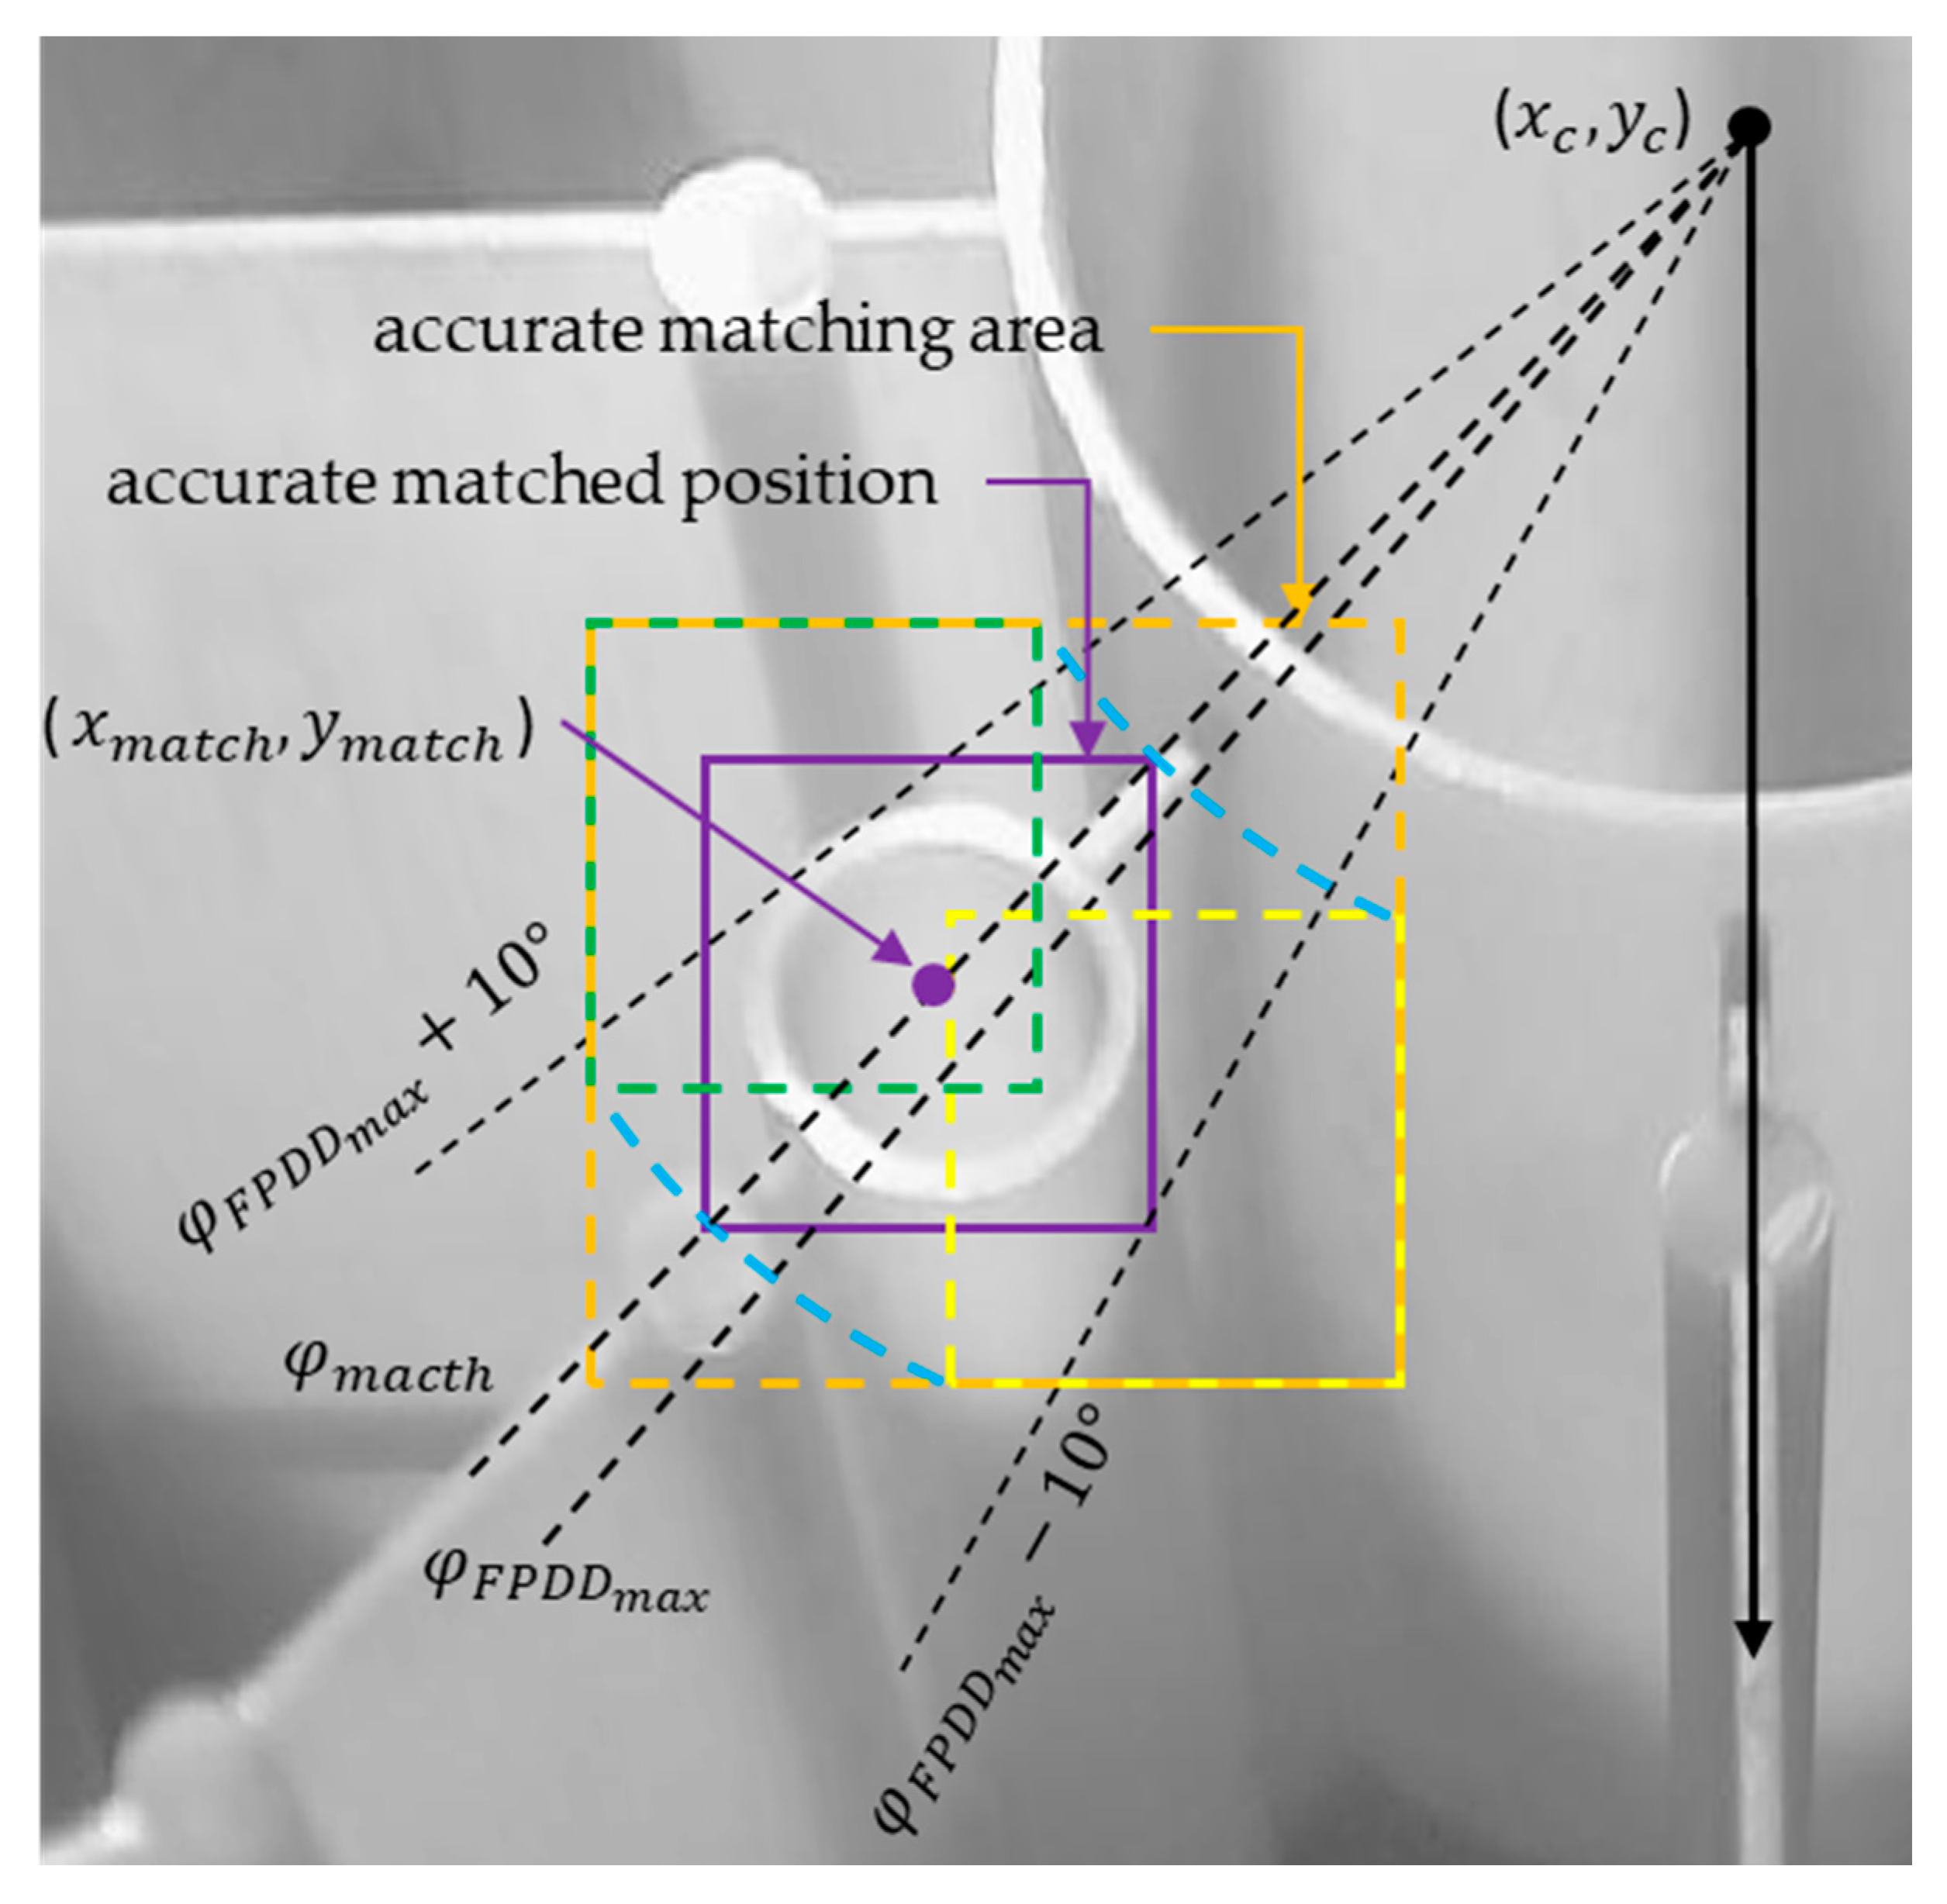
Figure 10.
FPDD results of (a) SIFT, (b) SURF, (c) ORB and (d) MinEigen (), and comparison of feature point distribution near drive bore for (e) AKAZE and (f) MinEigen ().
Figure 10.
FPDD results of (a) SIFT, (b) SURF, (c) ORB and (d) MinEigen (), and comparison of feature point distribution near drive bore for (e) AKAZE and (f) MinEigen ().
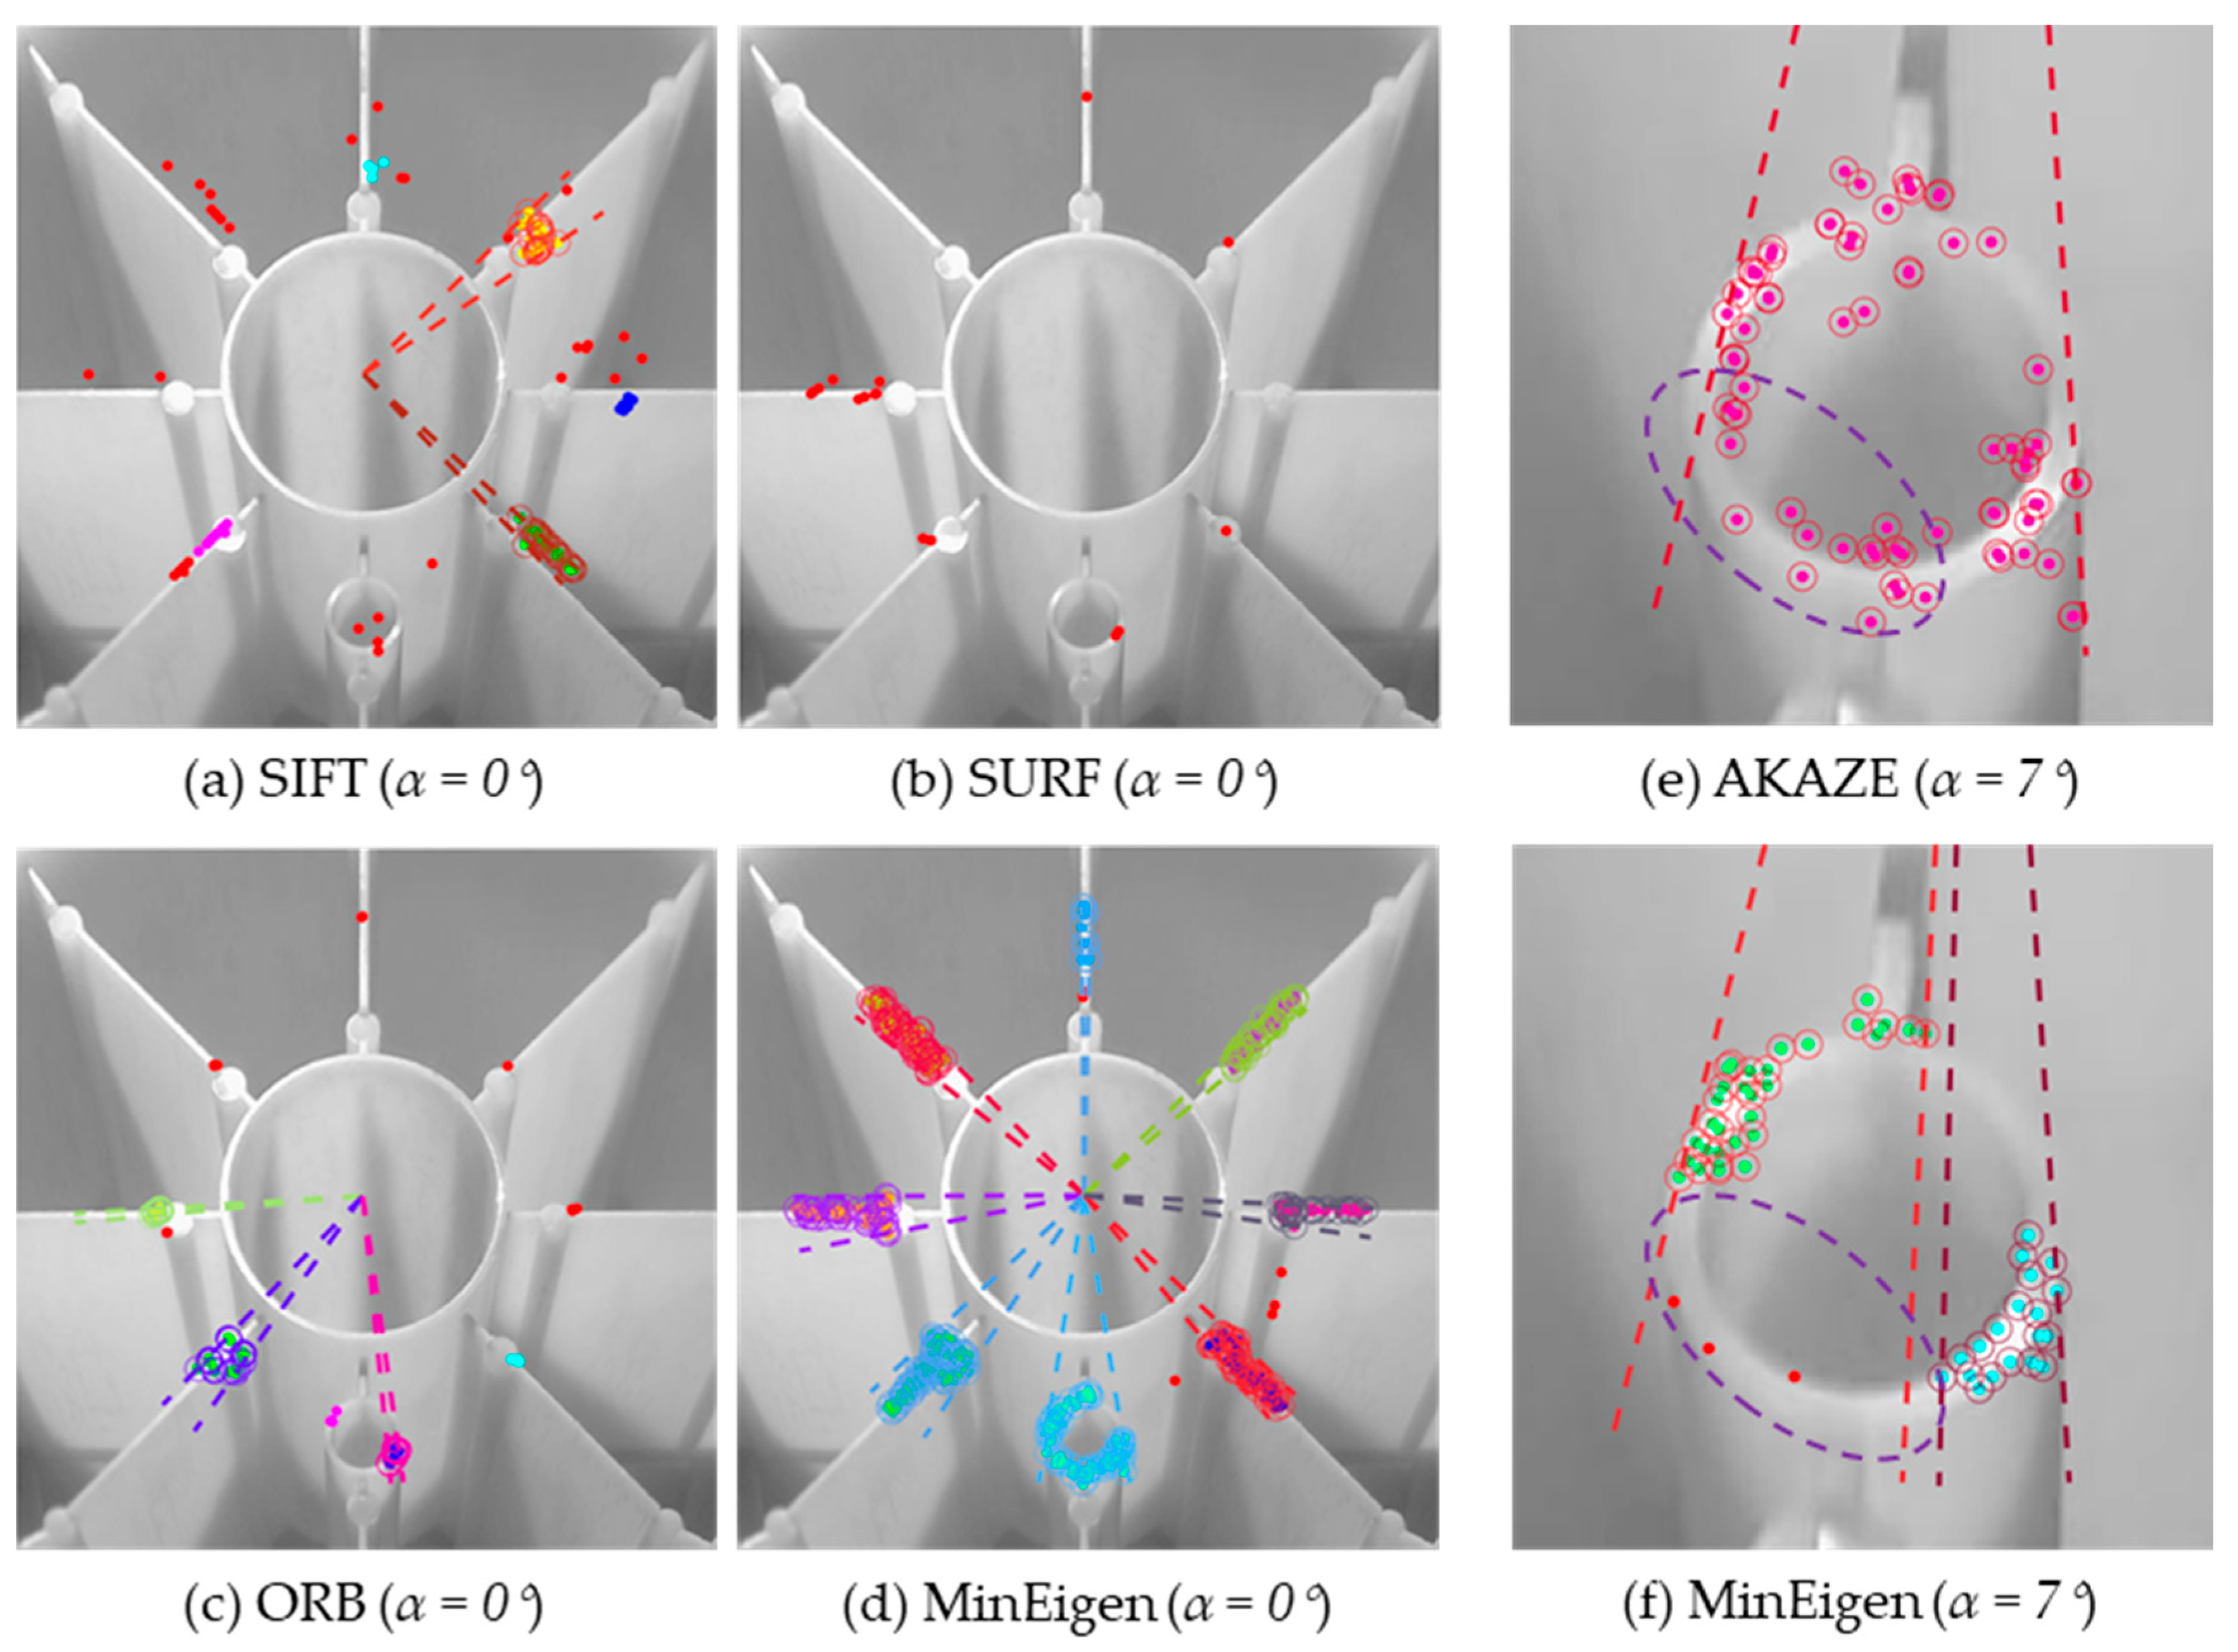
Figure 11.
The validation result of the proposed machine-vision-based measuring method.
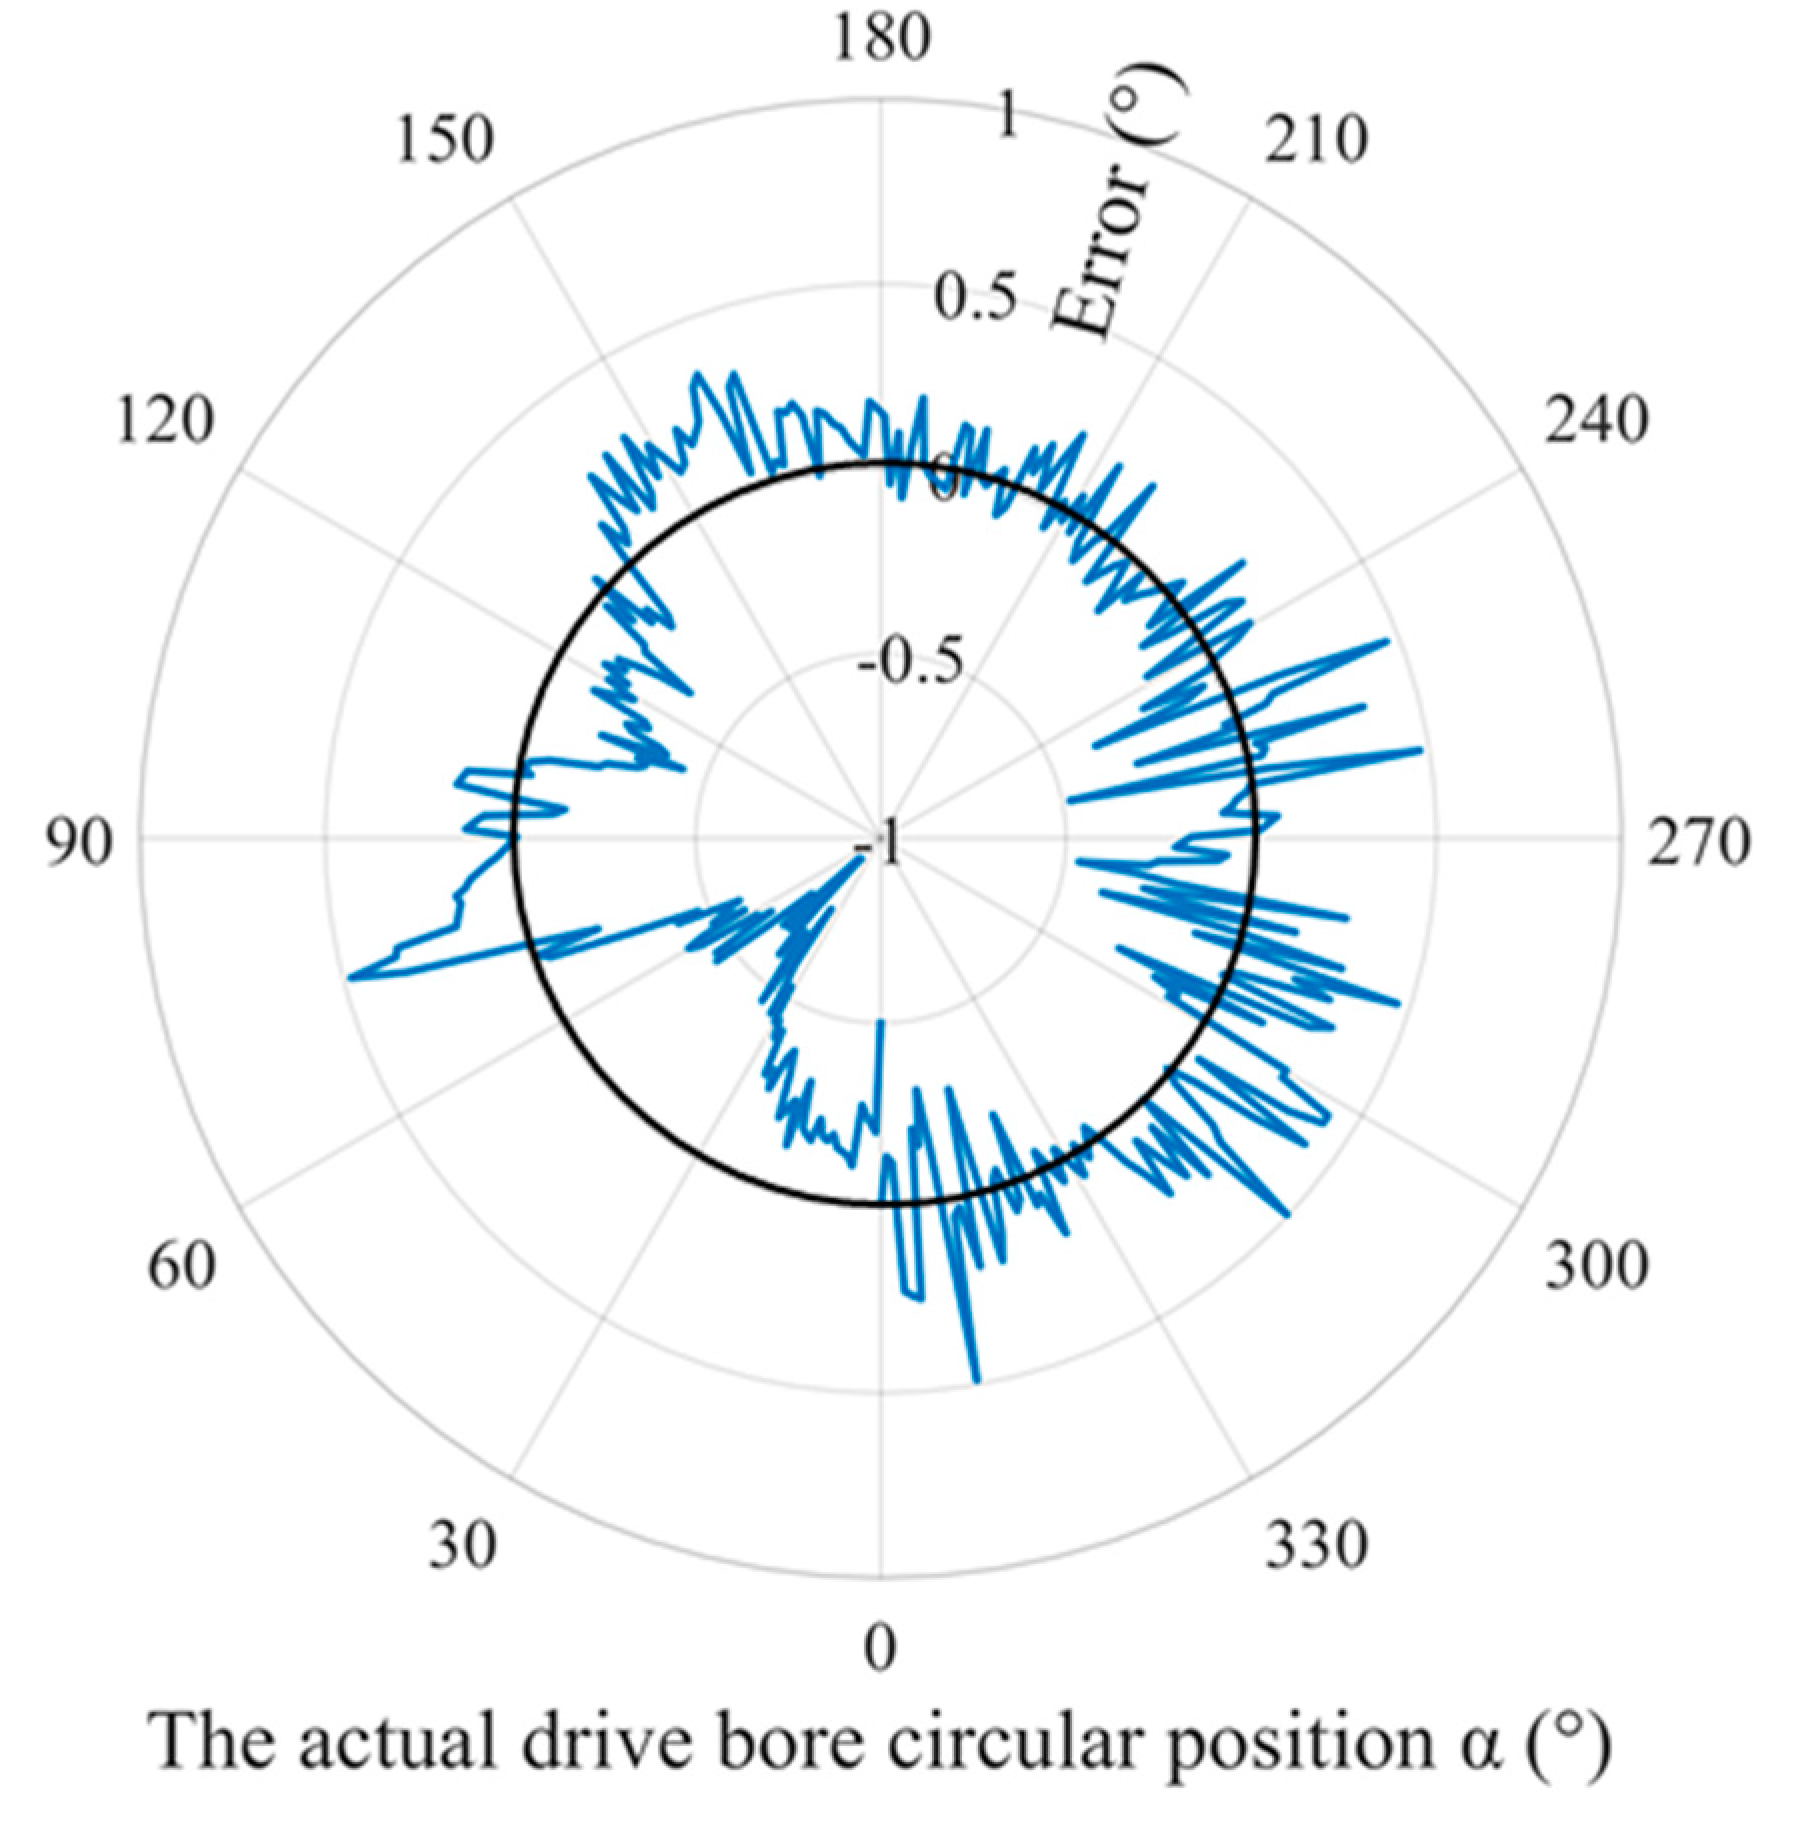
Figure 12.
Drive bore templates intercepted for direct template matching.
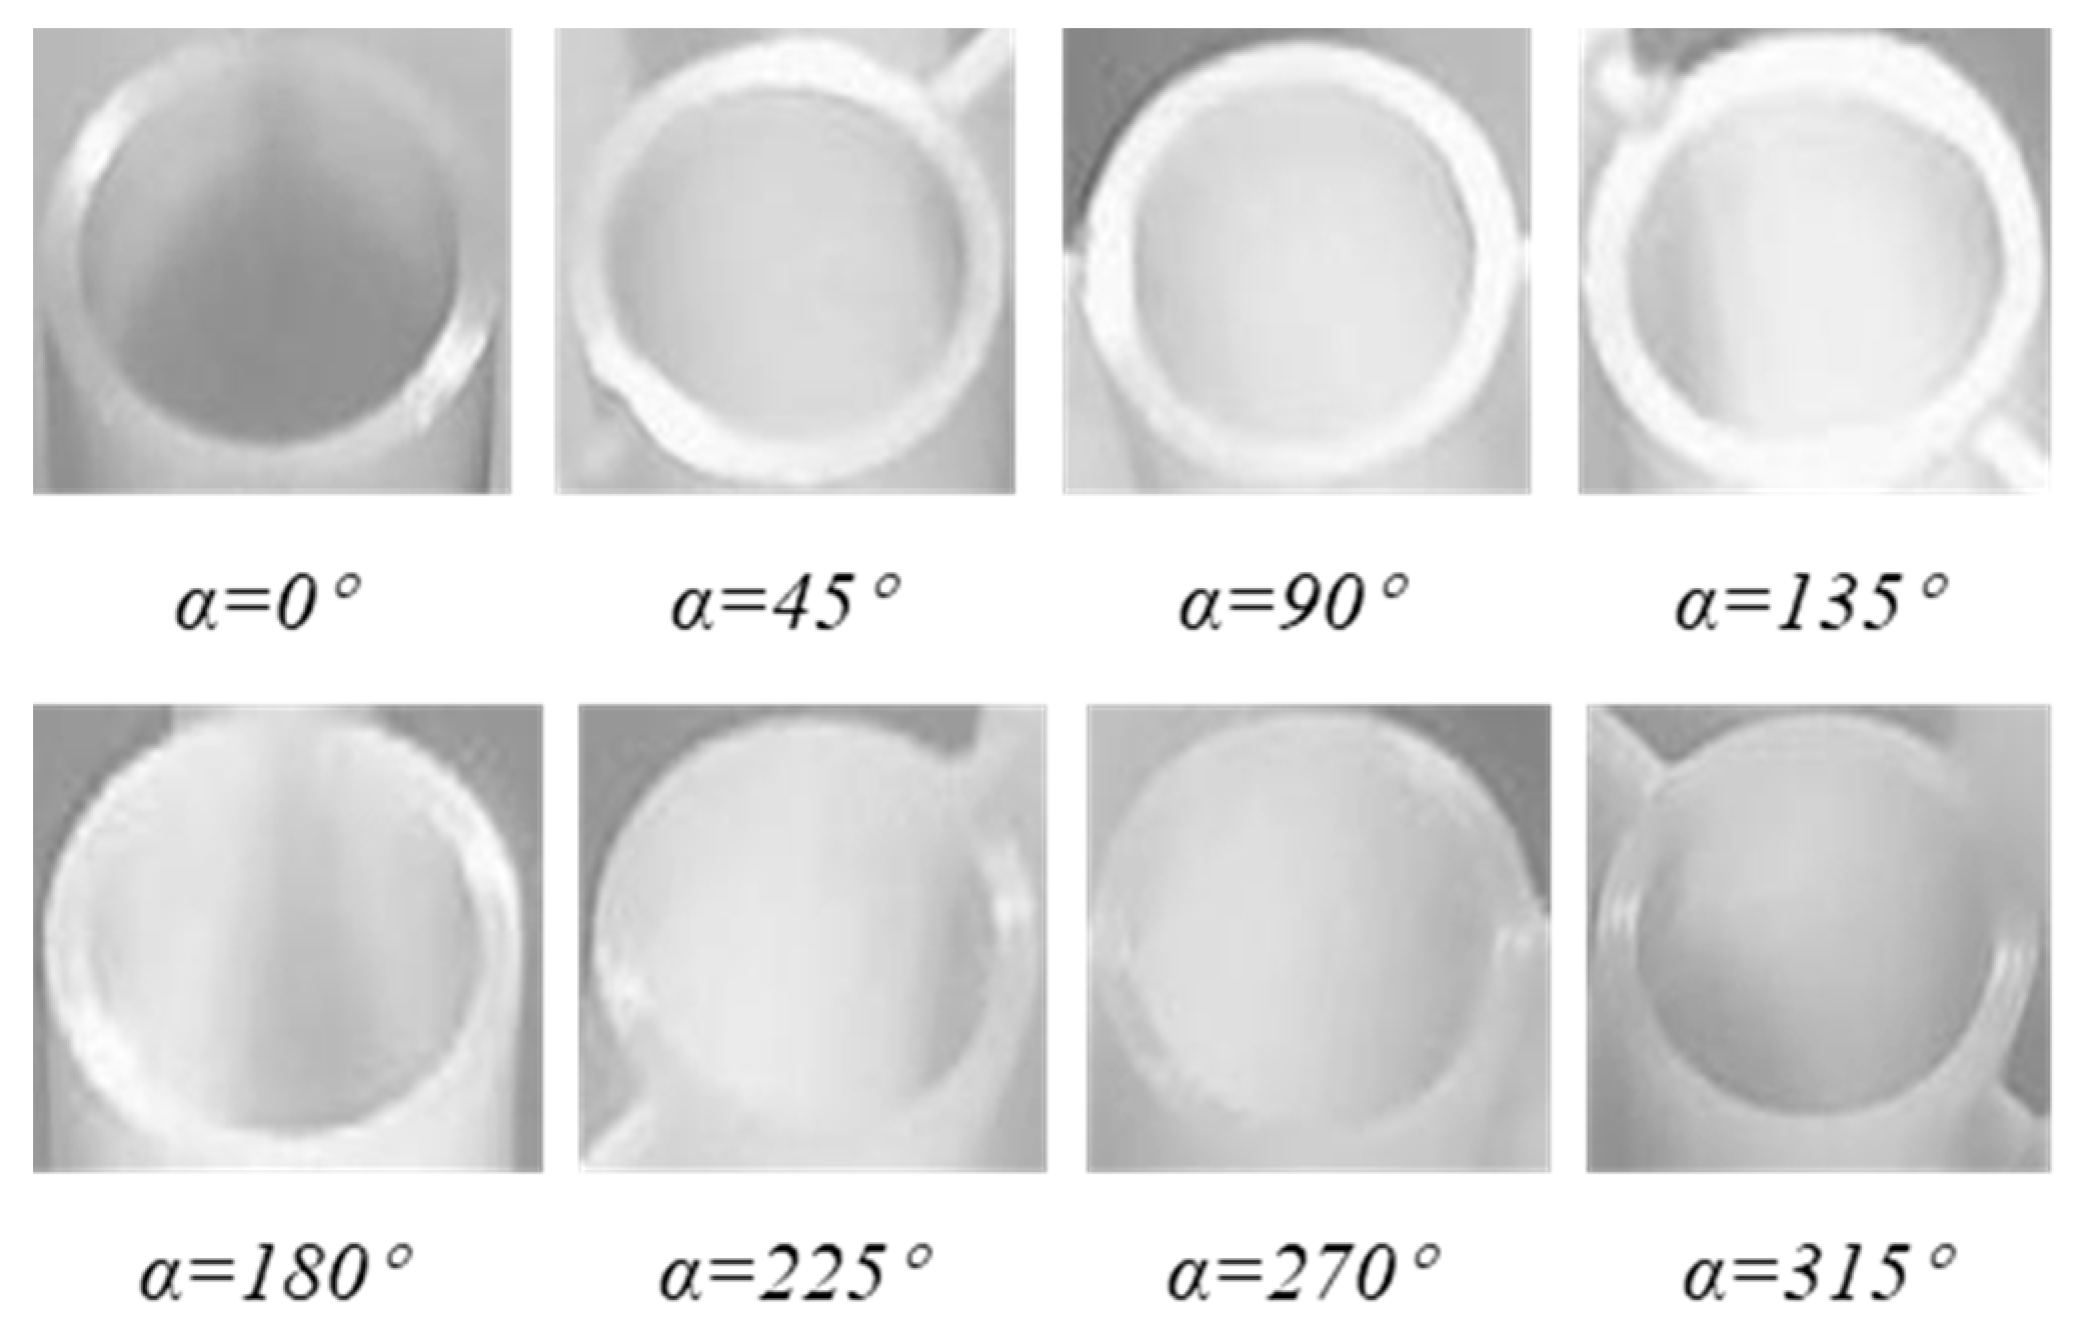
Figure 13.
Measuring result for direct template matching.

© 2020 by the authors. Licensee MDPI, Basel, Switzerland. This article is an open access article distributed under the terms and conditions of the Creative Commons Attribution (CC BY) license (http://creativecommons.org/licenses/by/4.0/).
Share and Cite
MDPI and ACS Style
Xu, J.; He, X.; Ji, W. Mechanical System and Template-Matching-Based Position-Measuring Method for Automatic Spool Positioning and Loading in Welding Wire Winding. Appl. Sci. 2020, 10, 3762. https://doi.org/10.3390/app10113762
AMA Style
Xu J, He X, Ji W. Mechanical System and Template-Matching-Based Position-Measuring Method for Automatic Spool Positioning and Loading in Welding Wire Winding. Applied Sciences. 2020; 10(11):3762. https://doi.org/10.3390/app10113762
Chicago/Turabian StyleXu, Jie, Xin He, and Weixi Ji. 2020. "Mechanical System and Template-Matching-Based Position-Measuring Method for Automatic Spool Positioning and Loading in Welding Wire Winding" Applied Sciences 10, no. 11: 3762. https://doi.org/10.3390/app10113762
Note that from the first issue of 2016, this journal uses article numbers instead of page numbers. See further details here.