Article

Evaluation of Microbial Load, Formation of Odorous Metabolites and Lipid Stability during Wet Preservation of Nannochloropsis gaditana Concentrates

Flemish Institute for Technological Research (VITO), 2400 Mol, Belgium
*
Author to whom correspondence should be addressed.
Appl. Sci. 2020, 10(10), 3419; https://doi.org/10.3390/app10103419
Submission received: 28 April 2020 / Revised: 11 May 2020 / Accepted: 12 May 2020 / Published: 15 May 2020
(This article belongs to the Special Issue New Trends on Algal Biotechnology for a Circular Economy)

Abstract

:
Wet preservation of algae allows us to bridge the time period between algae harvest and processing while avoiding the costs and nutritional losses associated with algae drying. This study aimed to identify suitable storage conditions for the wet preservation of Nannochloropsis gaditana concentrates. The impact of storage temperature, time and the way of closing the storage recipient was evaluated using a full factorial design. The effect of acetic acid addition was tested for one storage condition. Storage temperature was the main factor determining the microbial count and had a vast impact on the formation of odorous metabolites. Storage at 20 °C in closed recipients led to rapid O2 consumption, accumulation of malodorous short-chain fatty acids above their odor thresholds, and the production of H2S and methanethiol. These odorous metabolites were not formed or to a much lower extent during 4 °C and 8 °C storage in closed recipients. Acetic acid supplementation (50 mM) suppressed the formation of short-chain fatty acids during 8 °C storage in unsealed recipients and reduced the aerobic microbial count and the number of yeasts and molds by approximately one log unit after 14 days. Yet, acetic acid addition also induced lipid hydrolysis and decreased chlorophyll levels when algae were stored for more than one week. This study demonstrated that temperature control is needed and that acetic acid addition is a promising approach when N. gaditana concentrates are stored for less than one week.

1. Introduction

Nannochloropsis is of interest for commercial applications due to its high growth rate, high lipid levels and peculiar lipid profile [1]. Lipids constitute up to 60% of the Nannochloropsis biomass and contain a considerable amount of n-3 polyunsaturated fatty acids [2,3,4]. In particular, eicosapentaenoic acid (C20:5, EPA) is noteworthy as it exerts several important physiological functions and its consumption has beneficial effects on cardiovascular disease risk factors [5]. Nannochloropsis, and microalgae in general, also receive attention because of the sustainable nature of their cultivation. The use of agro-industrial waste streams or waste water for algal production enables the creation of a circular economy system, provided that safety concerns are addressed [6]. Autotrophic microalgae growth encompasses greenhouse gas capture without using arable land. It is a textbook example of sustainable land management, which is a critical aspect of mitigating the climate crisis according to the latest report from the intergovernmental panel on climate change [7]. Its sustainable cultivation and high lipid content make Nannochloropsis an interesting lipid source for food, feed and nutraceuticals [8]. It is furthermore under consideration for biofuel applications [9].
As shown by recently published reviews [8,10], there is a significant amount of literature available on Nannochloropsis cultivation and processing. Yet, less is known about how this alga should be stored in between these steps. Storage in a dried state will limit the growth of micro-organisms but drying is expensive [11,12]. Furthermore, heat based drying such as the commonly used spray-drying can destroy heat labile compounds like carotenoids [13,14]. Freeze-drying prevents such a thermal degradation and a better retention of heat-sensitive carotenoids can protect lipids from oxidation [13]. However, freeze-drying is even more expensive than spray-drying and difficult to perform on a large scale. Wet storage is therefore an attractive alternative for short term preservation. The storage and transport of algae in a liquid state allows for algae growth and processing at different locations without the need for installing expensive drying equipment at every growth location. Moreover, wet storage will better retain algae viability, which is an important advantage when algae are reared for aquaculture applications. Indeed, only living algae can produce dissolved oxygen and play a role in maintaining the quality and pH of the culture medium [15,16].
Most studies on the wet preservation of algae focus on lipid stability. Researchers reported that the total lipid content [17] and the fatty acid profile [18,19] of Nannochloropsis concentrates remained unchanged after wet storage at 4 °C for at least one month, while the total fatty acid content was constant or increased slightly [20,21]. However, Balduyck and coworkers demonstrated that Nannochloropsis lipids are sensitive to lipolysis under these conditions and that free fatty acids (FFA) are formed within a few days during wet storage at 20 °C [17]. These FFA can cause off-flavor formation, lipid oxidation [22,23] and are possibly involved in lipid polymerization during algae processing [24]. It is hence clear that lipolysis is a primary concern for the wet preservation of Nannochloropsis. Next to lipid quality, the odor, color and microbial load are also important quality attributes when applications in food or feed are envisioned. Surprisingly, there is little published data on the impact of wet preservation on these quality parameters. Camacho-Rodríguez et al. [21] studied the variation in total marine bacteria during the preservation of Nannochloropsis gaditana for aquaculture purposes. Concentrates incubated at 4 °C in plastic bags with regular medium and atmosphere renewal could be stored for up to four months and the bacterial load could be kept low by the addition of a mixture of streptomycin sulfate, penicillin G and ascorbic acid. However, other storage setups that can easily be scaled up are preferred for storage on a shorter term and antibiotic-free preservation techniques are desirable. Algae have a strong and specific odor [25], but to our knowledge, little information is available on how this changes during wet storage. Propionic acid and butyric acid, which have an unpleasant odor, were formed during 30 days of anaerobic storage of enzyme-supplemented Scenedesmus acutus [26]. It remains unclear whether such metabolites are also formed on a shorter term and when other algae species are stored under different conditions.
Against this background, this research aimed to identify good storage conditions for wet concentrates of N. gaditana produced for food or feed applications. The impact of (i) storage temperature, (ii) the way of sealing the storage recipient and (iii) the addition of acetic acid on algae stability was examined. In a first preservation study, the impact on the microbial load was studied and several metabolites that are known to have an off odor were monitored. Only the storage conditions that resulted in minimal formation of putrefying metabolites were evaluated in the next preservation test, where the lipid, FFA and chlorophyll contents were monitored in detail.

2. Materials and Methods

2.1. Algae Growth and Harvesting

Nannochloropsis gaditana was cultivated in the greenhouse in 300–1500 L photobioreactors in a brackish medium (1.2% w/v NaCl) and harvested by low shear membrane filtration (pore size: 0.08 µm). Two storage experiments were performed. For each storage experiment, a fresh batch of Nannochloropsis biomass was grown and concentrated by membrane filtration to a similar extent. The final organic matter and dry matter content was 5.9 ± 0.1% (total basis) and 7.8 ± 0.1%, respectively in the first study and 5.1 ± 0.1% (total basis) and 6.8 ± 0.1%, respectively in the second study. The dry matter content was measured by determining the weight loss after overnight drying at 105 °C, whereas organic matter content was assessed after overnight incubation at 550 °C.

2.2. Algae Storage

Algae concentrates (25 mL) were stored in 50 mL tubes that were either sealed with a cotton plug or a plastic cover, further referred to as open tubes and closed tubes, respectively. This enabled gas exchange with the environment in the first case but not in the latter. Algae samples were stored in the dark at 4 °C, 8 °C or 20 °C in an orbital shaker (New Brunswick, Innova 42/42R, Eppendorf) set at 150 rpm. In addition, for samples stored at 8 °C in open tubes, the impact of acetic acid addition (final concentration of 50 mM acetic acid in algae suspension) was tested. This concentration is in the range of organic acid dosages used for food products [27,28]. After storage at 4 °C, 8 °C or 20 °C, algae were immediately frozen and kept at −20 °C. Samples for lipid analysis were subsequently freeze-dried on another day.

2.3. Gas Analysis

The headspace O2 concentrations were monitored for algae stored in closed recipients using a gas Trace GC MPT-10286 (Interscience) equipped with a HayeSepQ column (80/100, 0.25 m × 1/8”, Alltech Associates, Inc., Columbia, MD, USA), a HayeSep N column (80/100, 1 m × 1/8”), a Molesieve 5A (80/100, 1 m × 1/8”) and a thermal conductivity detector.
In addition, headspace GC-MS analysis was performed for algae stored in closed recipients for 14 days. A gas-tight syringe was used to inject 0.2 mL of headspace on an Entech 7100A pre-concentrator (Entech, Simi Valley, CA, USA). This instrument was configured to remove moisture and CO2 from the sample prior to injecting it on the GC. After pre-concentration, the sample was transferred to an Agilent 6890 GC hyphenated with a 5973N mass spectrometer (Agilent technologies, Santa Clara, CA, USA) running in SIM mode (selected ion monitoring).

2.4. Short Chain Fatty Acid Analysis

An algae aliquot (2 mL) was combined with 0.5 mL H2SO4, 80 µL internal standard solution (2-methyl hexanoic acid, 5 g/L), a pinch of NaCl and 2 mL diethyl ether, after which the mixture was vortex mixed for 2 min, centrifuged (3 min, 1500 g) and the organic phase analyzed by GC using an AT-1000 column (15 m × 0.53 mm × 1.2 µm, Grace) and flame ionization detection (FID). Calibration standards contained (i) all straight-chain saturated monocarboxylic acids with 2 to 8 carbon atoms, (ii) isobutyric acid (iii) isovaleric acid and (iv) the internal standard.

2.5. Microbial Analysis

Microbial analysis was executed immediately after algae sampling. Microorganisms that form colonies in a rich solid medium (plate count agar) during aerobic incubation were enumerated according to ISO (international organization for standardization) procedure 4833-1:2013 [29]. Pour plating and inoculation was followed by a 72 h incubation at 30 °C and colony counting. In addition, the number of yeasts and molds was determined. To this end, aliquots of a dilution series were spread on the surface of a potato dextrose agar plate, which was incubated at 30 °C for 48 h prior to colony counting.

2.6. Lipid Content

The lipid content was determined gravimetrically according to the procedure of Ryckebosch et al. [30] using freeze-dried algae. Freeze-dried samples can easily be defrosted prior to analysis with a minimal risk of enzymatic reactions. Freeze-dried algae were extracted two times with chloroform:methanol (1:1, v/v) in the presence of water and two times without water. After centrifugation, the organic phases were transferred to a tared tube, dried under a nitrogen stream and weighed.

2.7. Free Fatty Acid Level

The free fatty acids (FFA) in the lipid fraction were quantified by GC-FID after their conversion to fatty acid diethylamides as detailed by Kangani et al. [31]. FFA were dissolved in dichloromethane and pentadecanoic acid (C15:0) was added as an internal standard. Diethylamine was the derivatizing amine while diisopropylethylamine and bis(2-methoxyethyl) aminosulfur trifluoride catalyzed the amide formation. Water addition stopped the reaction, after which hexane was added to extract the reaction products. For GC analysis, a famewax column (Restek, 30 m, 0.32 mm ID, 0.25 μm film thickness) was coupled with an FID detector and a lauric acid (C12:0) dilution series was used for detector calibration. No peaks were observed in the chromatograms before the C12:0 peak, indicating that the short-chain fatty acids (SCFA) that were analyzed after diethyl extraction (Section 2.4) gave no signal in the FFA chromatogram.

2.8. Chlorophyll Content

An aliquot of the chloroform:methanol extract (Section 2.6) was used for chlorophyll analysis. Extracts dried under nitrogen atmosphere were dissolved in ethanol, diluted and the absorbance measured at 665 nm, 649 nm and 750 nm with a UV-Vis spectrophotometer (Tecan Infinite 200 PRO, Tecan, Männedorf, Switzerland). For each sample, absorbance at 750 nm was compared with that of a blank sample to verify that the extract was transparent and that there was no interference due to light scattering or turbidity [32], and all spectrophotometric measurements were corrected for absorbance at 750 nm [33]. The equations described by Ritchie [33] were used to calculate chlorophyll levels in the ethanol extracts.

2.9. Statistics

The influence of the sealing type, storage time and storage temperature on algae stored in open and closed tubes were studied using a full factorial design. Factorial ANOVA (analysis of variance) was used to evaluate the impact of these factors and to detect possible interaction effects. Significance levels were set at 5%. In case of a positive omnibus test, a post-hoc Tukey test was used to compare the different levels within one factor. The effect of adding acetic acid was tested for 8 °C storage in open tubes. Data were compared with those of samples stored under the same conditions but without acetic acid addition. When the effect of storage time had to be evaluated and the initial t0 value had to be included in the evaluation, a one-way ANOVA was performed. Three replicates were foreseen for every storage condition and all replicates were subjected to the chemical analyses described above. The microbiological analyses were performed on two replicates. All statistical analyses were carried out using Statistica version 12 (Dell Inc., Tulsa, OK, USA, 2015).

3. Results

3.1. Storage Experiment 1—Microbiological and Metabolic Analysis

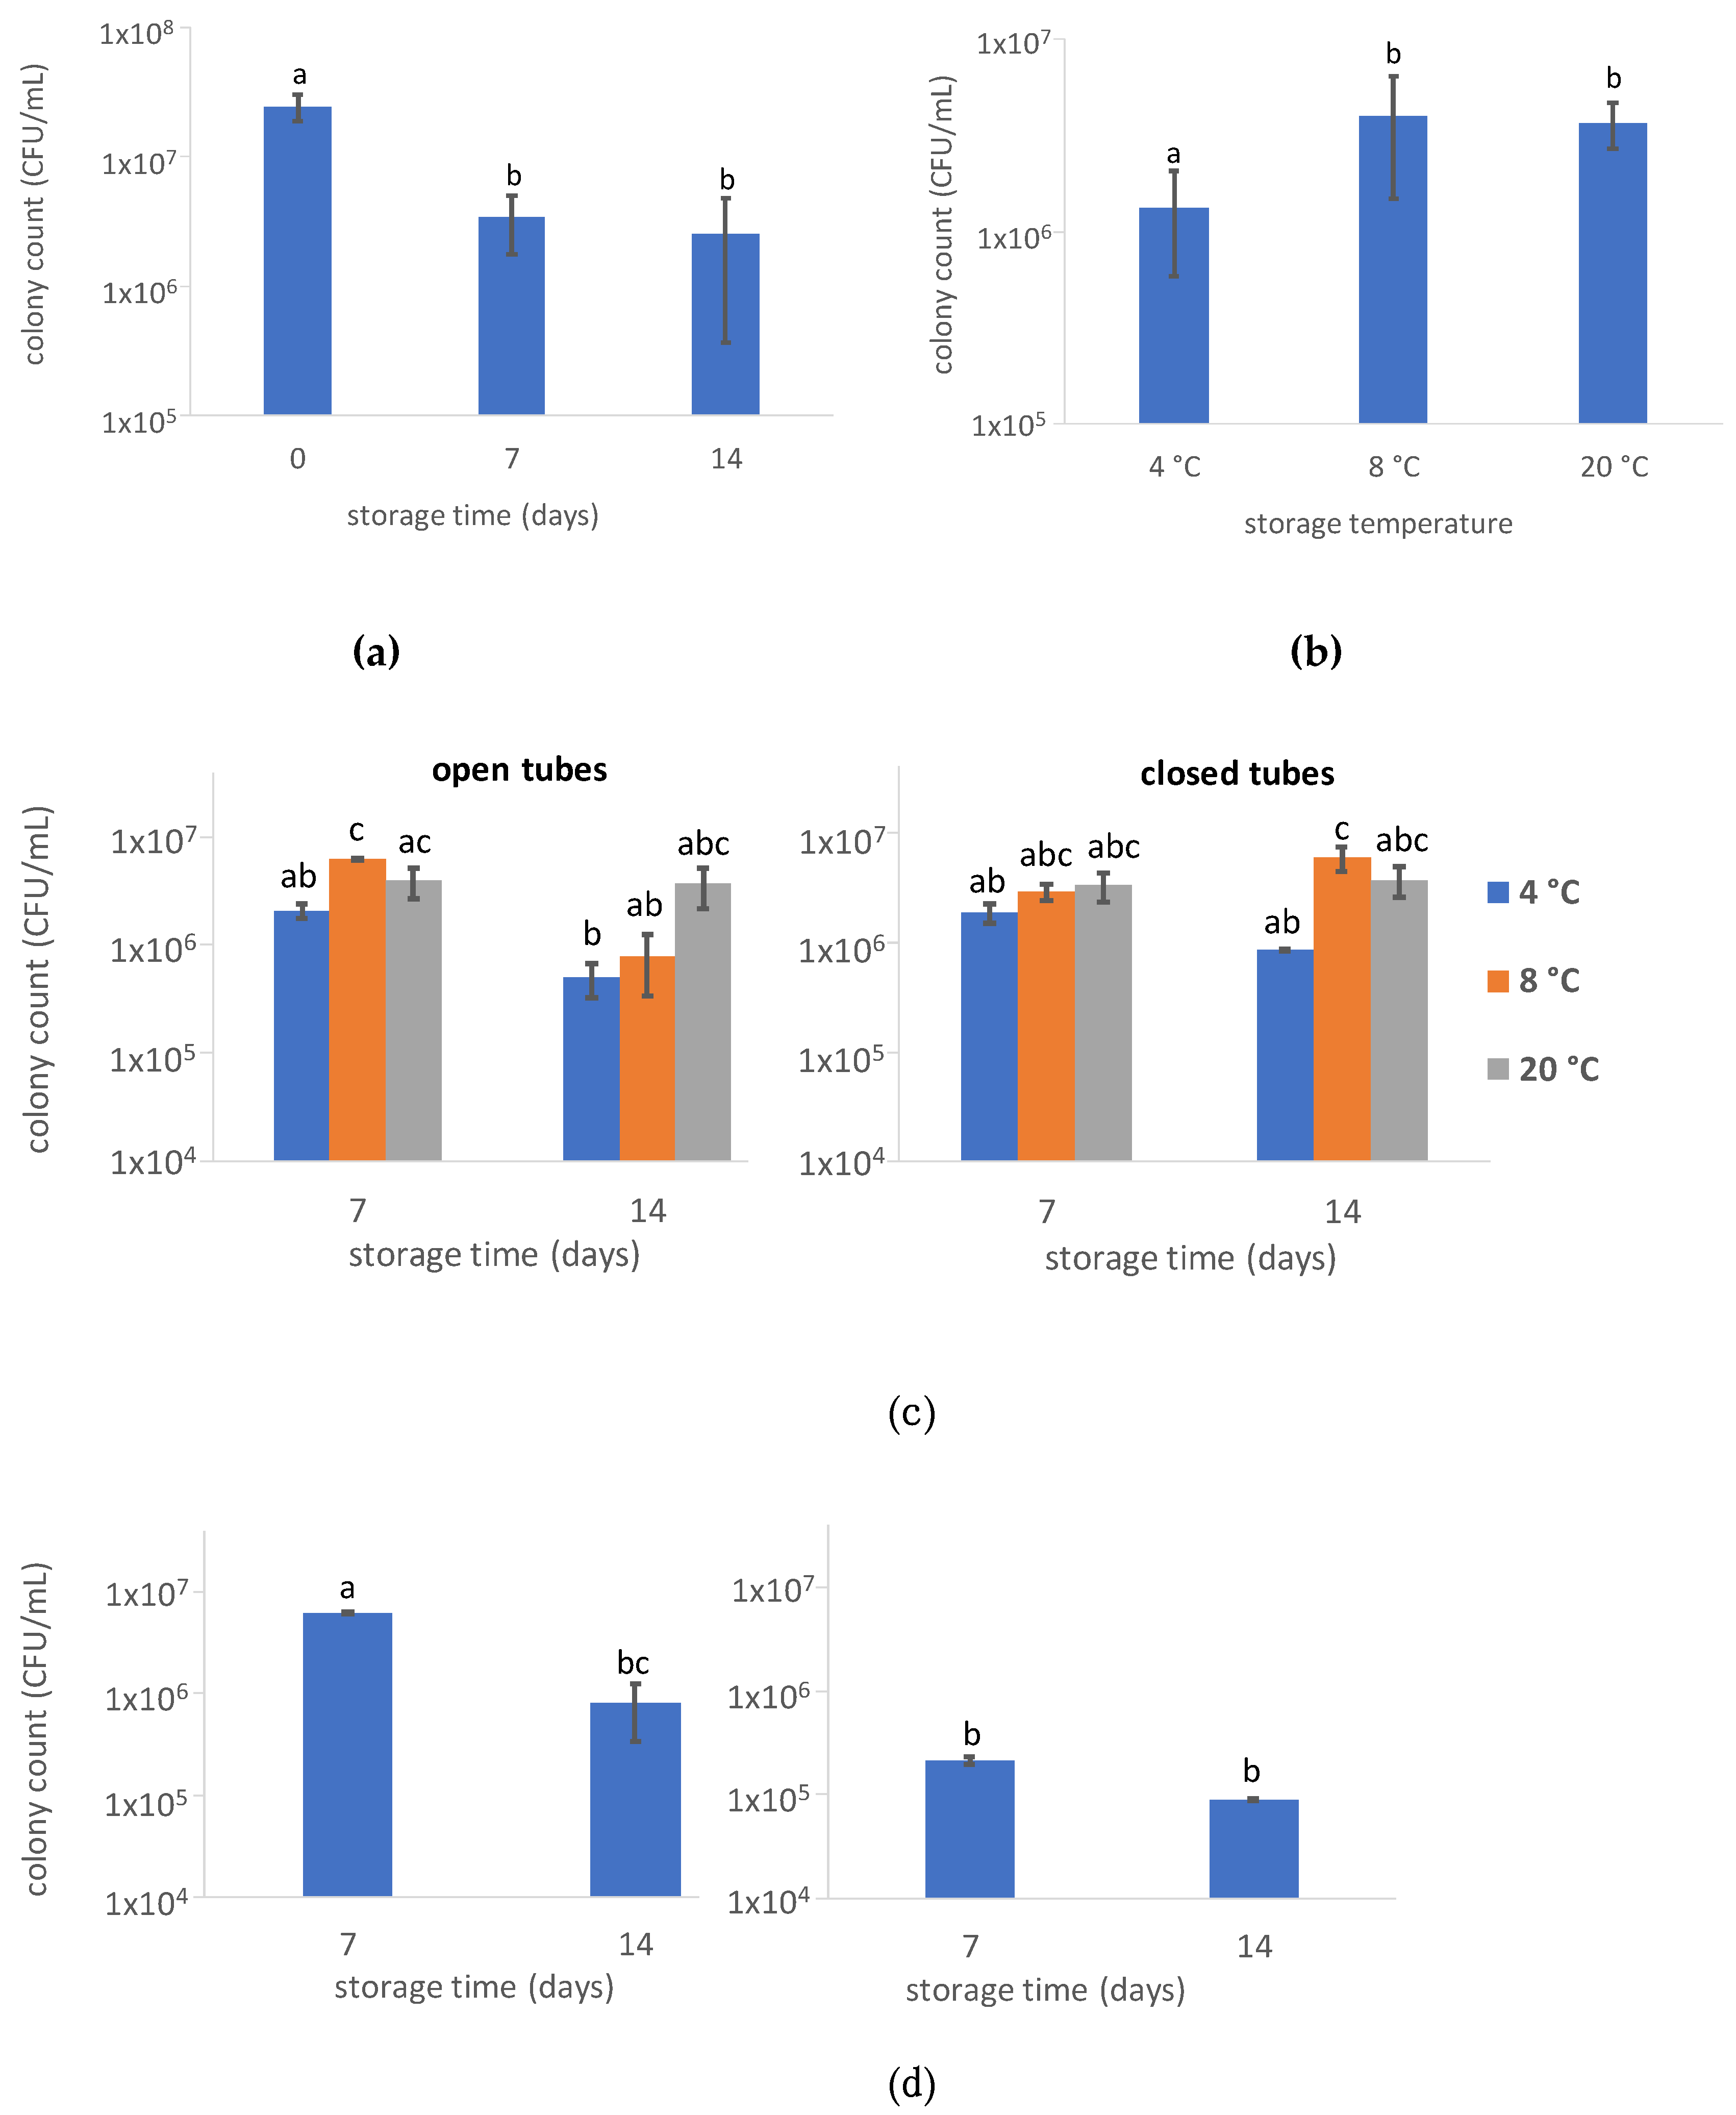
3.1.1. Total Microbial Count

The impact of preservation on the total microbial load was assessed using a plate count method developed for the analysis of food and feed products [29]. The growth medium used was a non-selective rich medium that primarily enables the growth of bacteria. The algae concentrate initially contained (2.4 ± 0.6) × 107 colony forming units (CFU)/mL. This value decreased during storage and was on average about one log unit lower after 14 days of storage for the samples to which no acetic acid was added (Figure 1a). Storage temperature had a significant impact on microbial numbers of these concentrates (p < 0.001) and higher numbers were observed after 8 °C and 20 °C storage than after 4 °C (Figure 1b). The way of sealing the storage recipient, either with cotton plugs or a plastic cover (i.e., open or closed storage), had no significant effect (p = 0.59) but there was an interaction between the sealing type and storage time (p = 0.001) and between sealing type, storage time and storage temperature (p = 0.001, Figure 1c). The microbial count decreased in function of storage time in open tubes stored at 8 °C, but not in closed tubes. Yet, such changes were observed during 4 °C or 20 °C storage.
For the algae stored at 8 °C in open tubes, the effect of acetic acid addition (50 mM) was tested. The addition of the organic acid had a strong impact (p < 0.001) and this factor interacted with storage time (p < 0.001). The colony count was lower for acetic acid supplemented samples, especially after seven days of storage (Figure 1d).

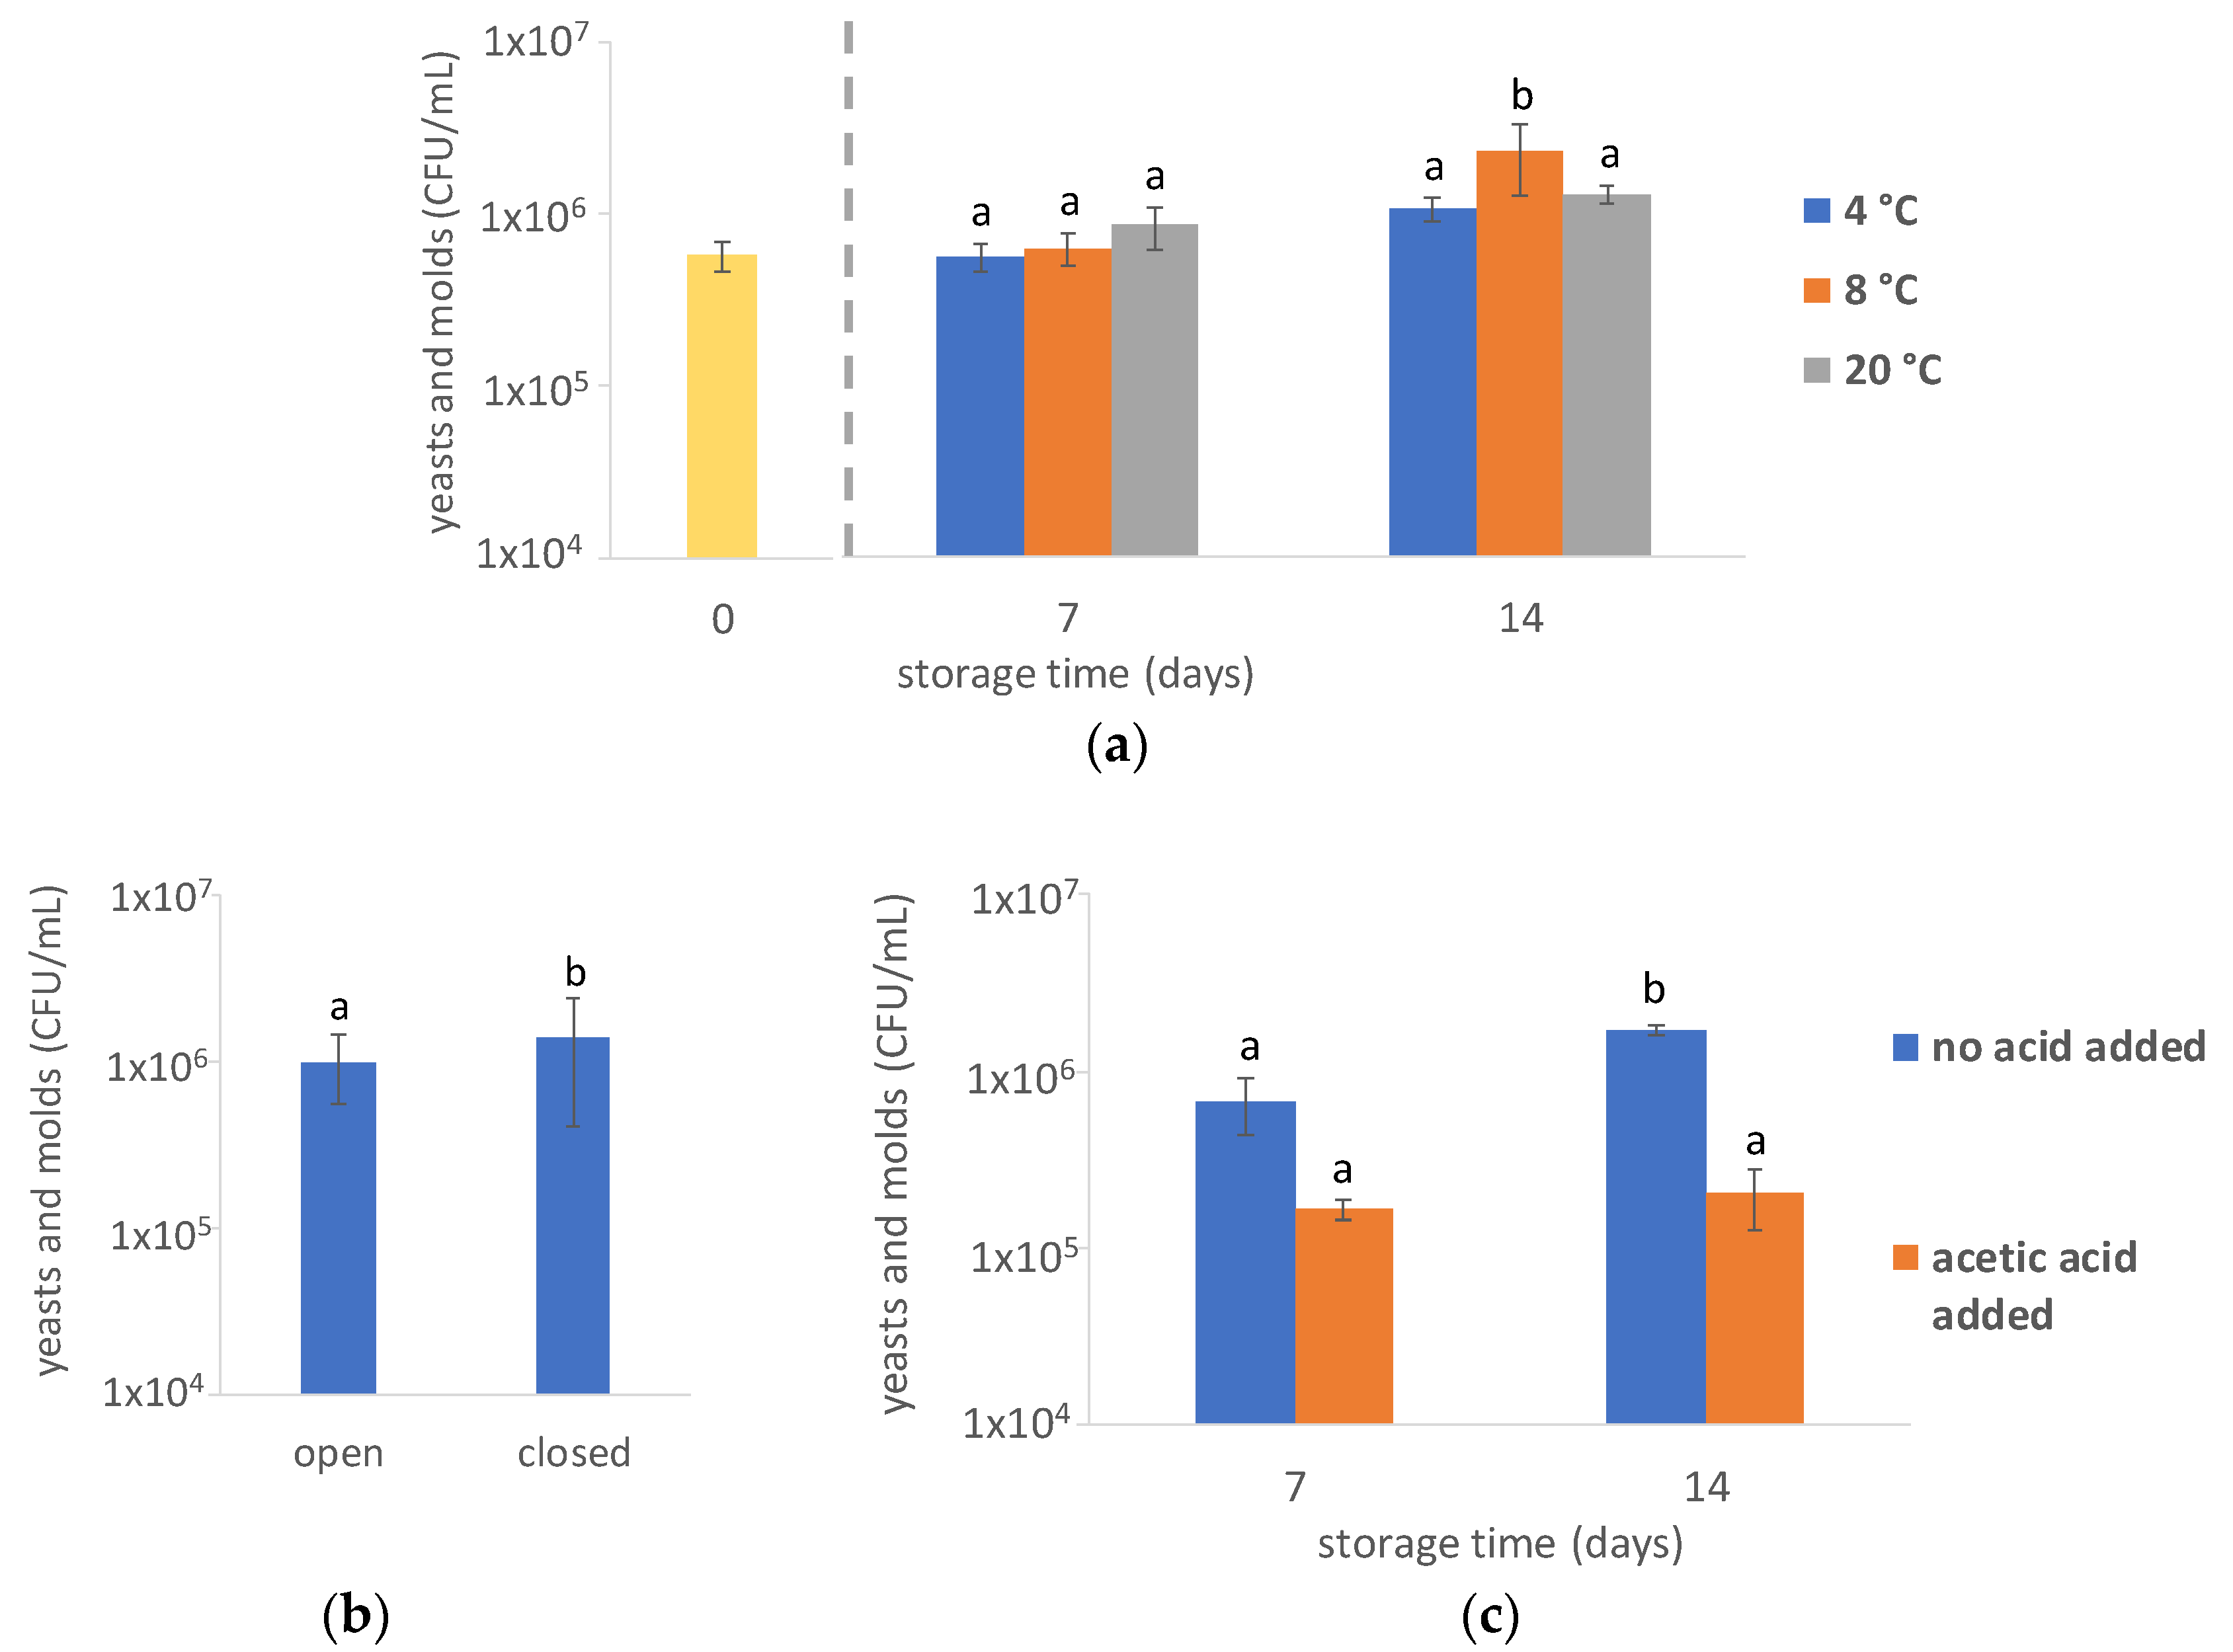
3.1.2. Yeasts and Molds

The number of yeasts and molds was affected by storage time (p < 0.001), storage temperature (p = 0.011) and the way of sealing the storage recipient (p = 0.022), where there was an interaction between the effect of storage time and temperature (p = 0.007). The initial concentrate had (5.8 ± 1.2) × 105 CFU/mL and this number increased to a limited degree during storage for algae to which no acetic acid was added (Figure 2a). Slightly more fungal CFU were observed when algae were stored in closed tubes instead of open tubes (p = 0.022, Figure 2b), whereas acetic addition clearly confined fungal growth (p < 0.001, Figure 2c).

3.1.3. Headspace Analysis in Closed Storage Tubes

The O2 level was followed up in the headspace of closed storage recipients. O2 was rapidly consumed, particularly during 20 °C storage (Figure 3). At day 2, the headspace of the 20 °C stored algae contained only 1.1 ± 0.1 mol% O2 while that of 4 °C and 8 °C stored algae contained 4.4 ± 0.2 and 4.1 ± 0.1 mol% O2, respectively. A gradual O2 decrease was observed over the following days for all test conditions. It should be taken into account that during GC injection, small levels of O2 coming from ambient air may interfere with these results as traces of O2 (~0.1–0.2 mol%) were also observed after injection of pure H2 standards (result not shown).
GC-MS analysis of the headspace of algae in closed recipients was performed after 14 days of storage (Supplementary Materials Figure S1). A strong H2S signal was observed for the 20 °C stored algae but no H2S was seen in the headspace of algae stored at 4 °C and 8 °C. Moreover, a small methanethiol signal was seen for 20 °C stored algae but not for 4 °C and 8 °C stored algae (Supplementary Materials Figure S1).

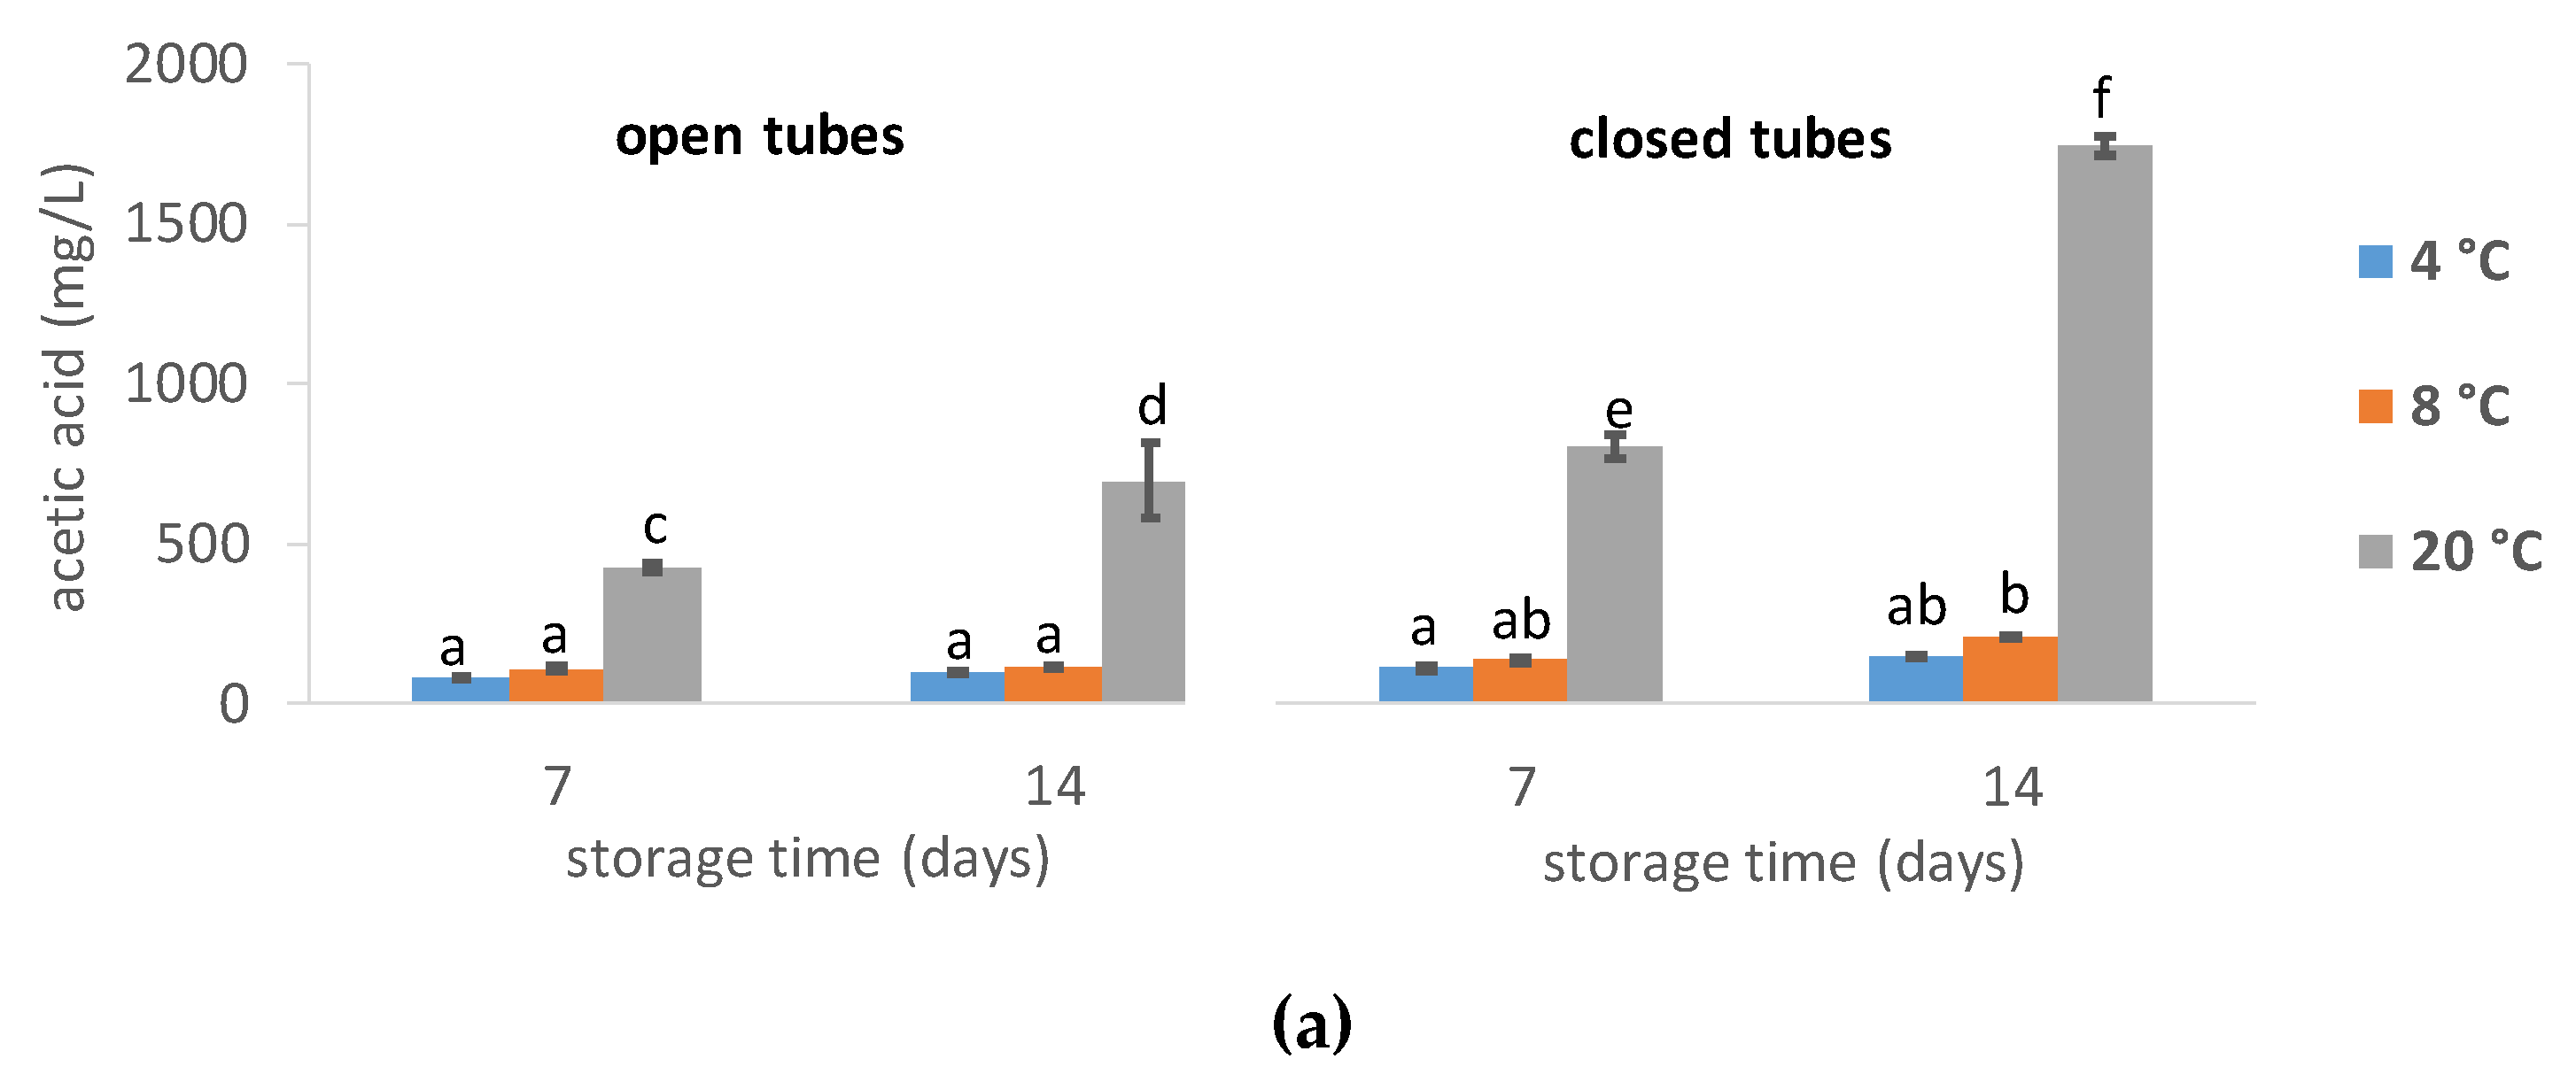
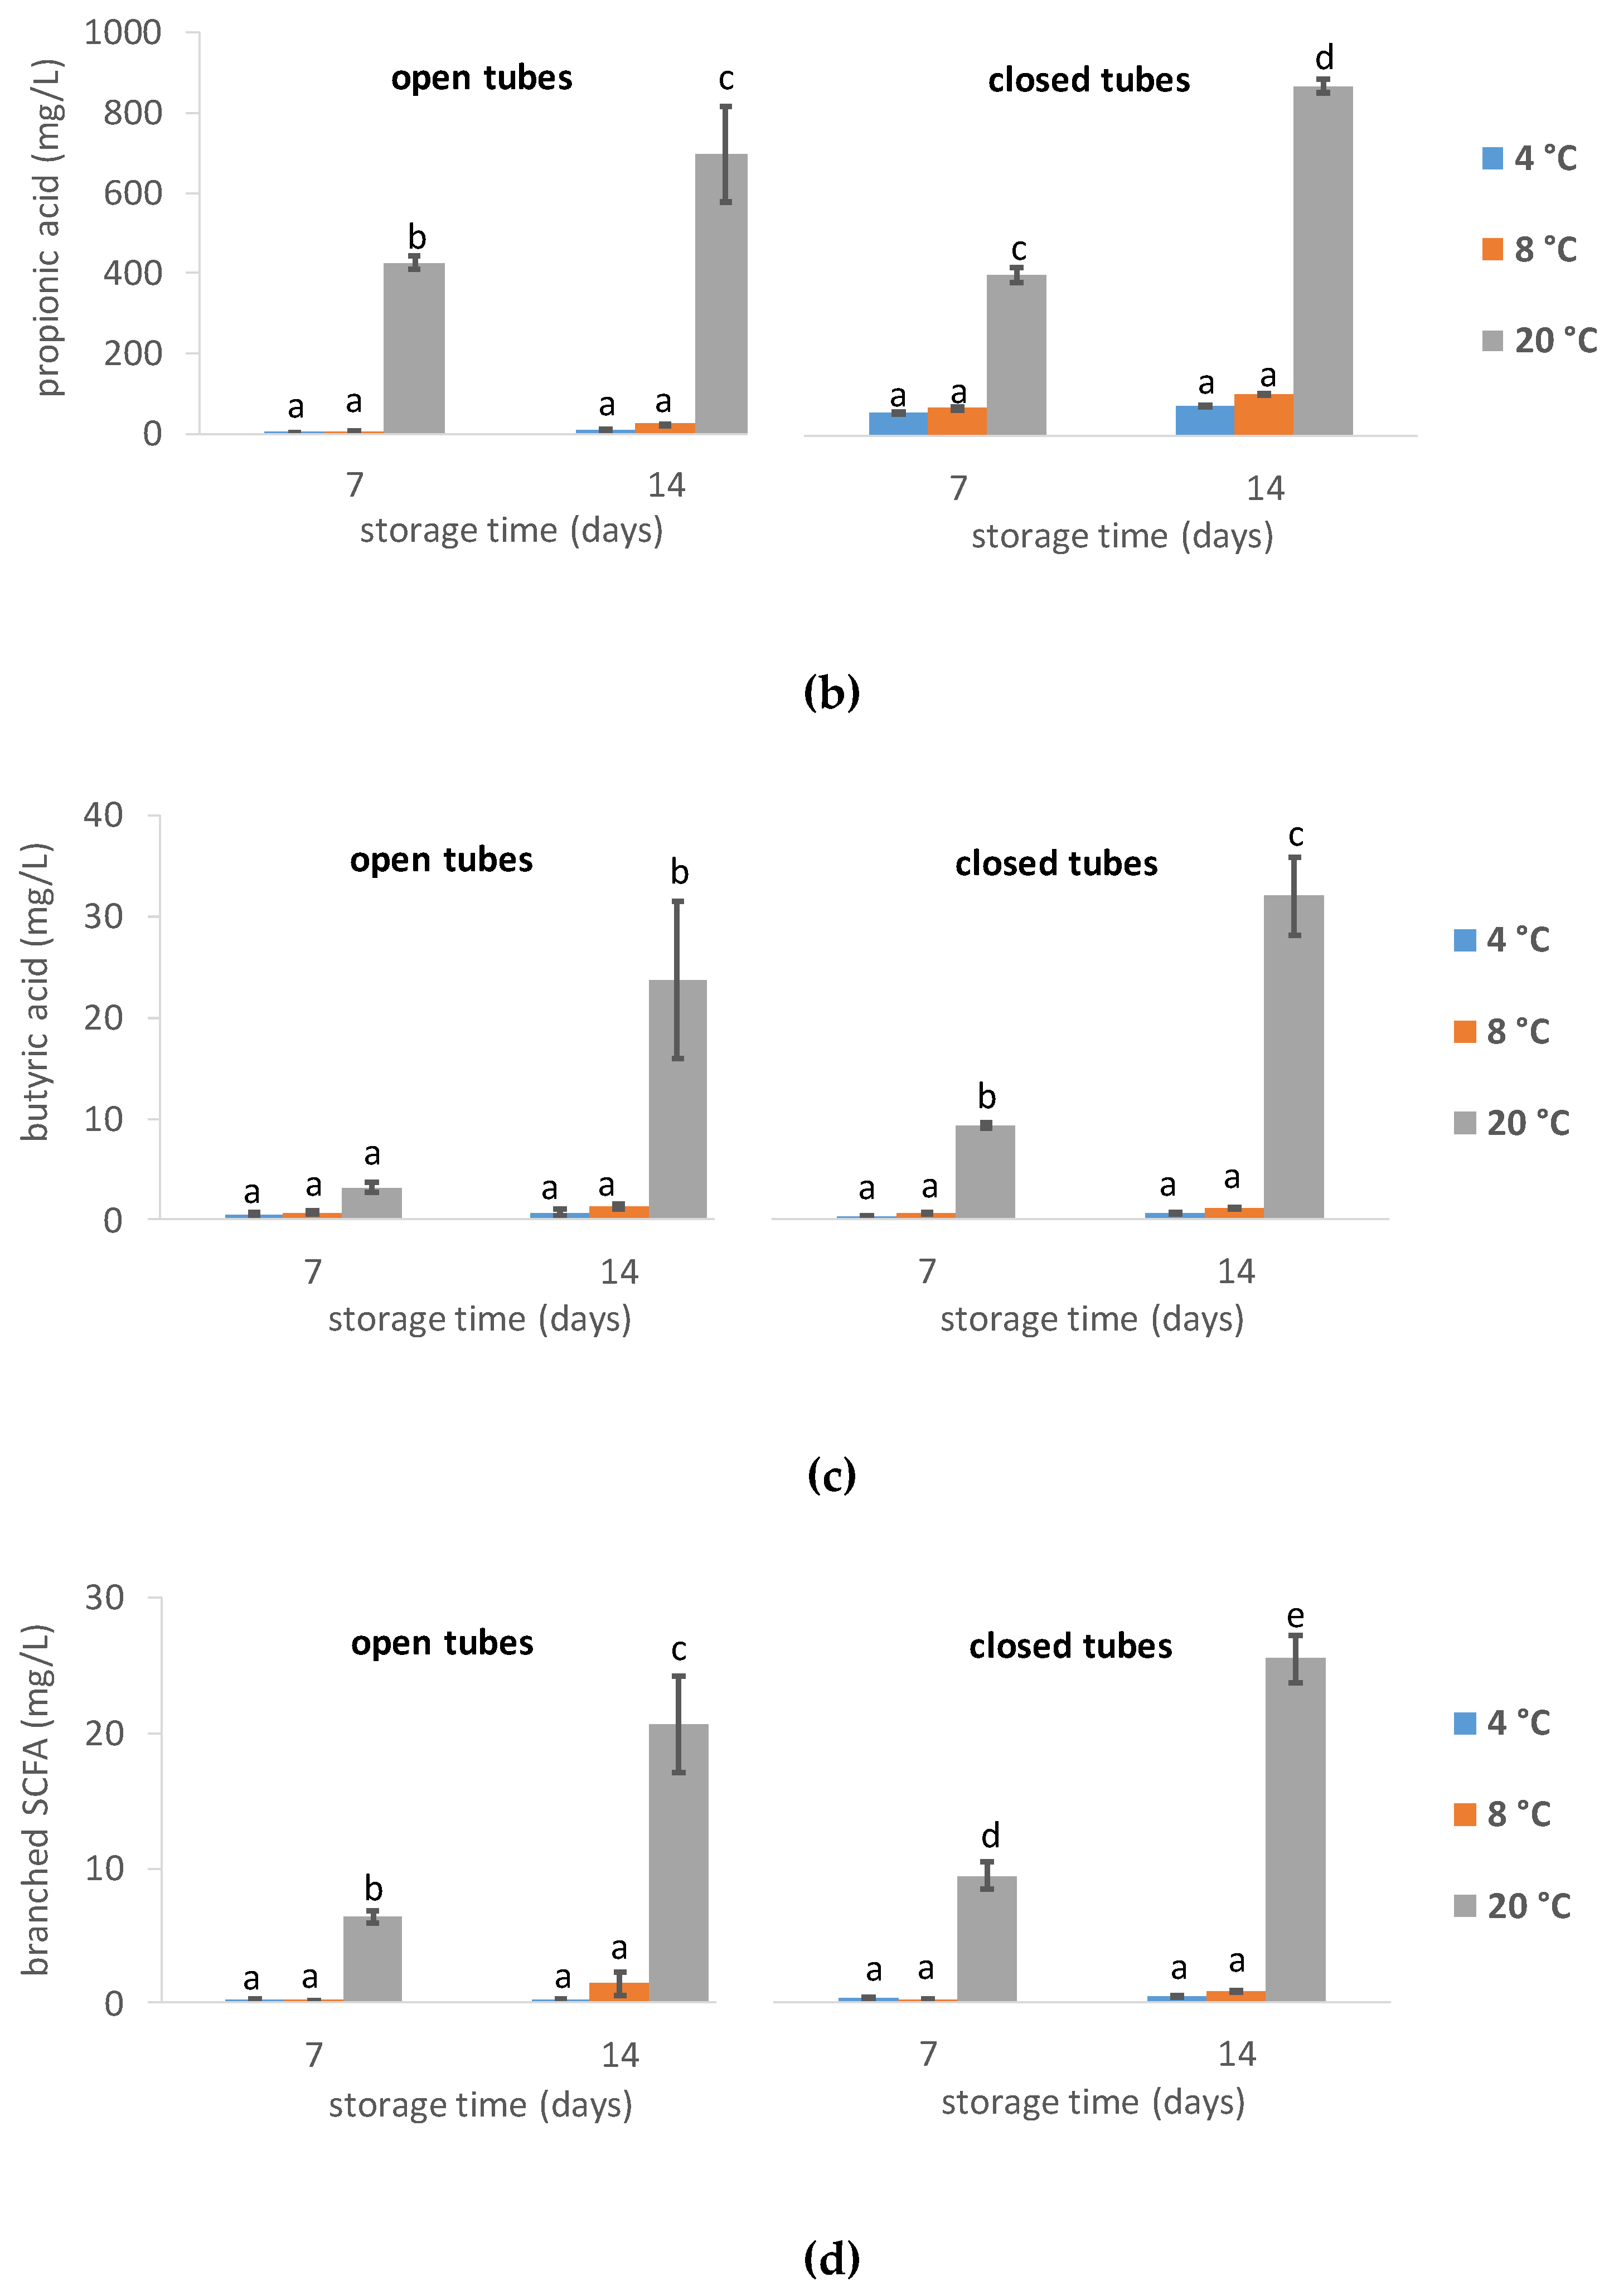
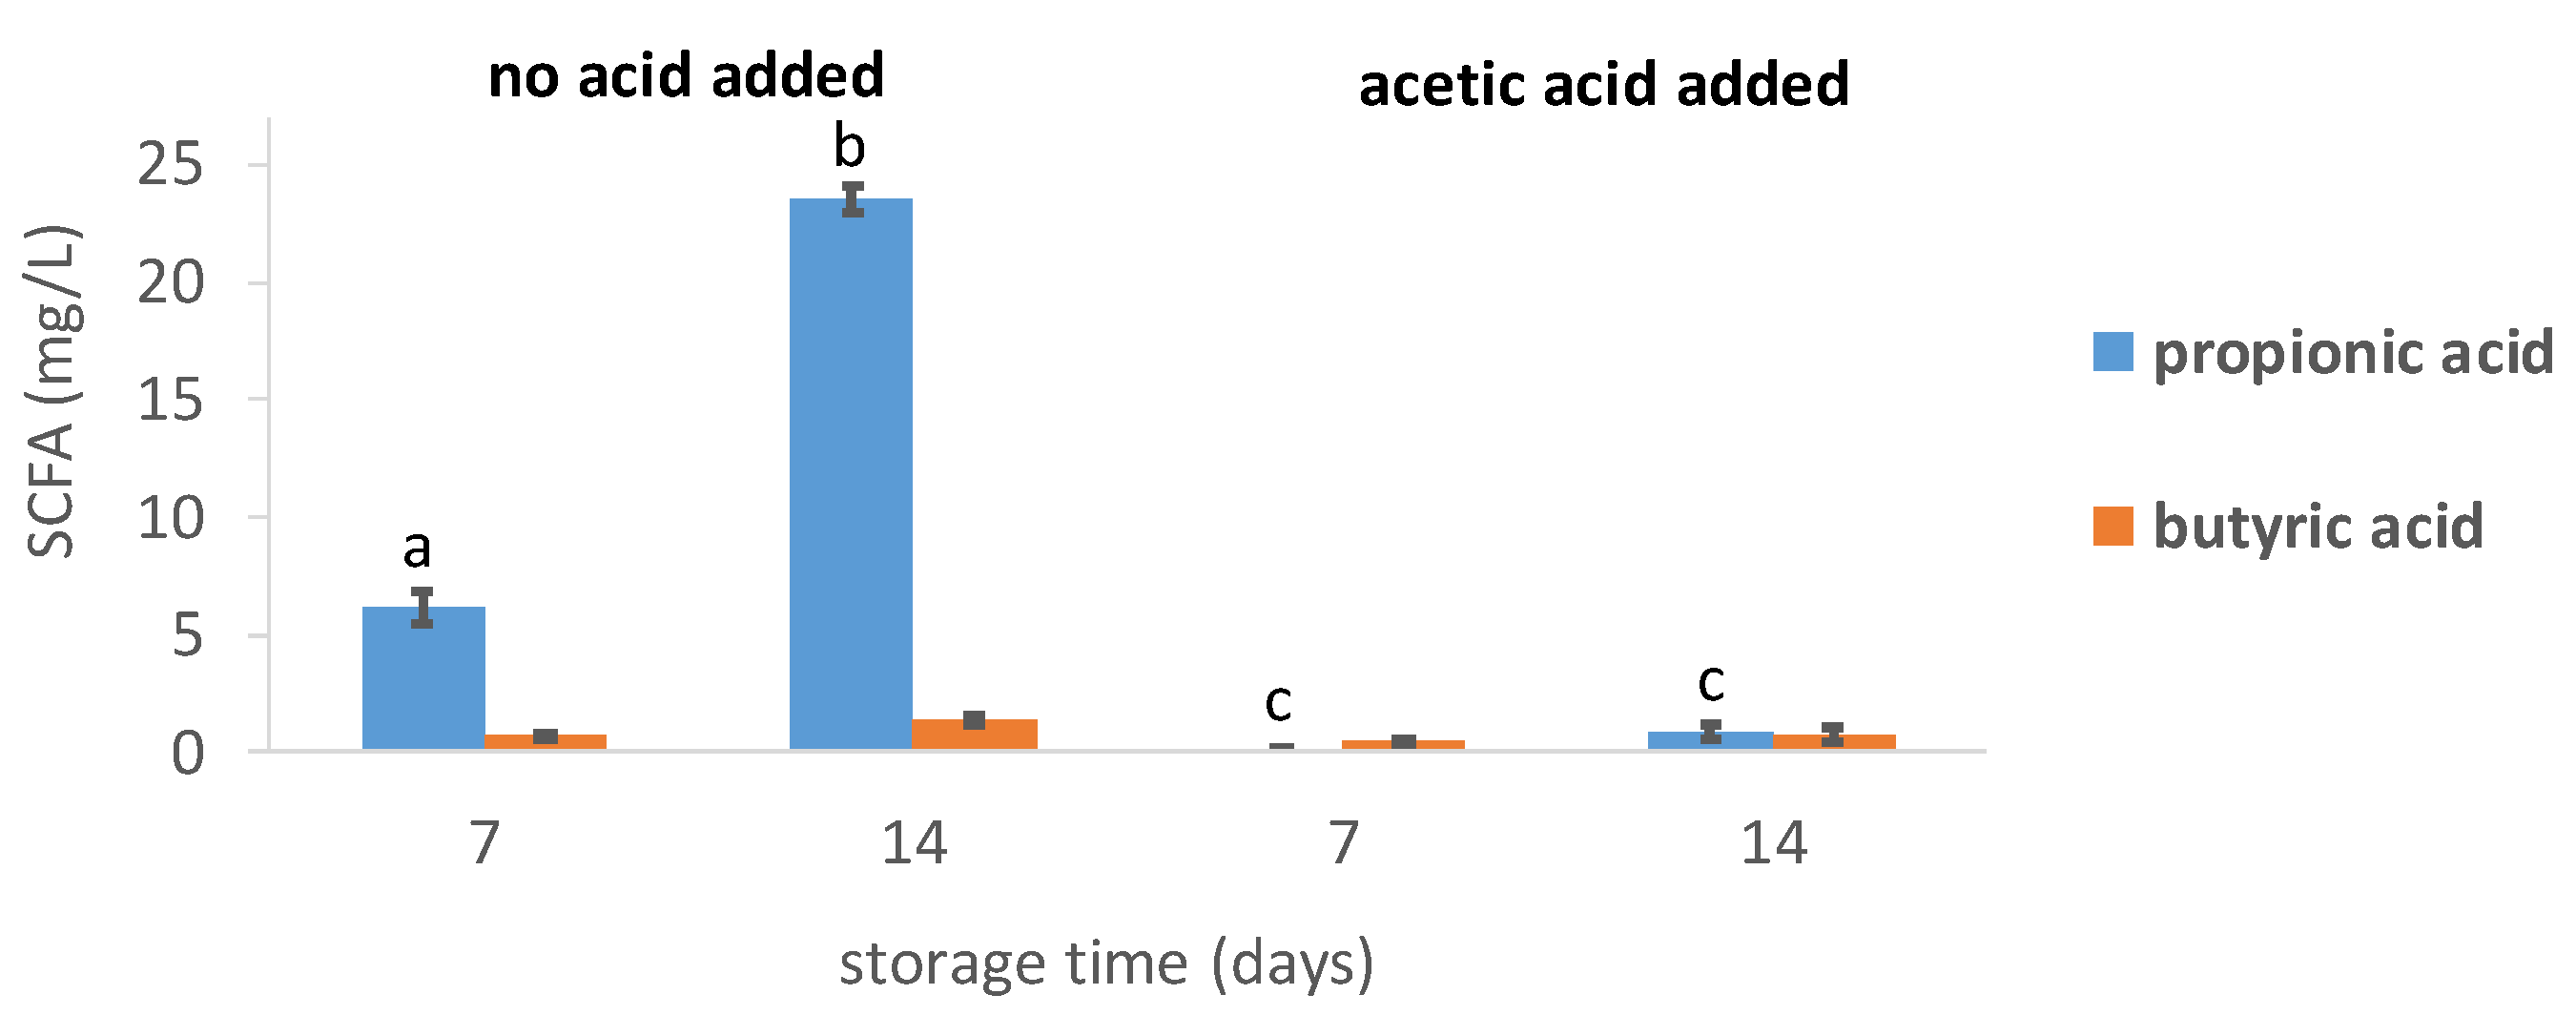
3.1.4. Short-Chain Fatty Acids Levels

The concentration of acetic acid, propionic acid, butyric acid and the branched SCFA (isobutyric and isovaleric acid) in algae samples without added acetic acid was significantly influenced by storage time, temperature, the way of closing the storage recipient (p < 0.001 for all main effects) and their interactions (p < 0.05). Storage temperature was by far the major factor affecting SCFA concentrations with much higher levels after 20 °C storage than after 4 °C and 8 °C storage (Figure 4). Algae stored at 20 °C had higher SCFA concentrations when stored in closed tubes than when stored in open tubes and higher concentrations were observed after 14 days than after 7 days of storage. n-Valeric acid (C5:0) was only detected after 14 days of storage in open tubes at 20 °C (6.9 ± 1.6 mg/L) and in closed tubes stored at 20 °C for 7 and 14 days (1.9 ± 0.2 mg/L and 22.5 ± 2.1 mg/L, respectively, results not in figure).
By adding acetic acid at the start of preservation, the propionic acid concentration was seriously reduced (about 30 to 60 times) in algae suspensions stored at 8 °C in open tubes (Figure 5), whereas butyric acid and branched SCFA concentrations were kept low (<1 mg/L, not shown for branched SCFA). In addition, acetic acid addition drastically reduced the pH of the algae suspension (Supplementary Materials Figure S2).

3.2. Storage Experiment 2—Lipid and Chlorophyll Analysis

Although the odor of the samples of storage experiment 1 was not assessed in a standardized way, it is noteworthy that a pungent off-odor was perceived for all 20 °C stored samples but not for 4 °C and 8 °C stored samples. Therefore, and because of the high levels of malodorous compounds in these samples, the 20 °C storage conditions were omitted in the set-up of the subsequent test.
The lipid level of the initial biomass was 17.3 ± 0.2% on a dry matter (dm) basis and remained fairly stable during storage (Table 1). Despite the limited differences, factorial ANOVA analysis indicated that the three storage factors had a statistically significant impact (i.e., temperature, temperature × closing type and closing type × storage time, Supplementary Materials Table S1), and the highest lipid levels were observed for algae stored at 8 °C in open tubes (Table 1).
FFA constituted 2.3 ± 0.4% of the lipids of the initial biomass. Although three storage factors affected FFA levels (storage time, closing type and temperature × storage time, Supplementary Materials Table S1), differences were small and FFA levels stayed within a limited range (1.5% to 2.3% of the lipid mass) for algae stored without added acetic acid (Table 1). However, the FFA level increased to 21.6 ± 3.7% of the lipids after 17 days of storage at 8 °C in open tubes when acetic acid was added. Such an increase was not observed when algae were stored under similar conditions but without acetic acid addition.
The chlorophyll concentration was initially 19.7 ± 0.8 mg/g dm and was affected by storage temperature (p = 0.011) and the way of closing the storage tubes (p < 0.001) when no acetic acid was added. Chlorophyll levels were generally higher after 8 °C storage than after 4 °C storage, and were also higher after storage in open tubes than after closed tube storage (Table 1). Again, a large change was seen when acetic acid was supplemented. In that case, chlorophyll levels decreased to 10.5 ± 0.6 mg/g dm after 17 days of storage at 8 °C in open tubes, while this decrease was not seen when no acetic acid was added. On the contrary, without acetic acid supplementation, chlorophyll levels increased to 29.1 ± 1.7 mg/g dm after 17 days of storage at 8 °C in open tubes.

4. Discussion

Wet preservation of algae has advantages over dry preservation, including (i) omitting drying costs, (ii) avoiding the risk of a reduced nutritional value due to the drying process and (iii) better preserving algae viability. Yet, wet preservation comes with its own challenges, certainly when the preserved algae are intended for food and feed applications. In that context, controlling the microbial flora is crucial while sensorial attributes, such as the product’s odor, need to be controlled. This study demonstrates how these quality parameters are affected by storage conditions.

4.1. Changing O2 Levels Set the Scene

The aerobic microbial count decreased by approximately one log unit after 14 days of storage without acetic acid addition. In the case of storage in closed tubes, a rapid decrease in headspace O2 levels was observed with an almost complete O2 depletion after two days of incubation at 20 °C. A fast consumption of O2 dissolved in the algae suspension can hence be expected. Indeed, Nannochloropsis concentrates were stored in the dark, preventing the algae from producing O2 through photosynthesis. Aerobic respiration will decrease O2 levels and eventually lead to hypoxic or even anoxic conditions. The creation of an anoxic environment by the dark incubation of Nannochloropsis concentrates was already reported in a previous study [34], though under different circumstances (24 h incubation at 38 °C). Obviously, such drastic changes will eliminate obligate aerobes and affect the aerobic microbial count as seen in this study. In contrast to the aerobic microbial count, the number of yeasts and molds steadily increased during storage. This might be due to the fact that most yeasts are facultative aerobes [35] and adapt well to changing O2 levels. Yeasts and molds were not separately quantified in an unequivocal way, but the appearance of the colonies suggested that yeasts dominated at the start of storage experiment and that their contribution to the fungal flora increased during storage (results not shown).
When O2 becomes deficient, anaerobes and facultative aerobes use either anaerobic respiration or fermentation to balance redox and energy balances [35]. The formation of small organic acids (Figure 4) reflects the occurrence of fermentation processes [36,37], while H2S formation points towards bacterial sulfate reduction which is a typical example of anaerobic respiration [35]. Nannochloropsis cells probably resist anoxic environments well as they may encounter anoxic challenges in their natural habitats [38]. Accordingly, FFA levels remained low and stable during 4 °C and 8 °C storage without acetic acid addition (Table 1). This suggests that cell integrity was not jeopardized, since cell disruption is believed to onset lipolysis in algae [17].

4.2. Effect of Storage Temperature

The SCFA fermentation products were mainly detected after 20 °C storage and were not or to a low extent detected after 4 °C and 8 °C storage. This has a negative impact on the quality of the algae suspensions as most of these metabolites have a strong odor. Acetic acid was the main organic acid detected, followed by propionic acid and butyric acid. The last two clearly have an unpleasant odor and their levels in 20 °C stored concentrates (Figure 4) were far above their odor threshold values in water (20 mg/L and 0.24 mg/L for propionic and butyric acid, respectively) [39]. In addition, the branched SCFA isobutyric and isovaleric acid were formed (Figure 4 and Supplementary Materials Figure S3) and their levels exceeded their odor threshold values (8.1 mg/L and 0.12–0.7 mg/L, respectively) [39]. Unbranched SCFA, and to a lesser extent branched SCFA, are also found in foot sweat [40] and in human stool [41] as bacterial fermentation products of carbohydrates (only unbranched SCFA) and proteins (both unbranched and branched SCFA) [41]. In particular, isovaleric acid, the main cause of feet odor [40], was higher than its odor threshold (25 times higher after 14 days storage in closed tubes at 20 °C).
For algae stored during 14 days in closed bottles, H2S was clearly present in the headspace (Supplementary Materials Figure S1) and a sulfur odor was perceived (authors personal observation) during 20 °C storage but not during 4 °C or 8 °C storage. This is possibly caused by sulfate-reducing bacteria as seen in the anoxic zones of lakes [35] and during the anaerobic digestion of marine microalgae for biofuel production [42]. Indeed, sulfate was present in the initial cultivation medium, mainly in the form of MgSO4 (~2.6 g/L). Yet, other compounds like (homo-)cysteine can also be H2S precursors [43]. Next to H2S, methanethiol was detected after 20 °C storage in closed recipients and not after 4 °C and 8 °C storage. Methanethiol is involved in the foul odor of cyanobacterial mats [44] and its presence in fresh water systems was mainly ascribed to anoxic, biogenic degradation processes [45].
In summary, it is clear that several metabolites with an unpleasant odor were released during 20 °C storage and not released or released much less during 4 °C and 8 °C storage. The tested 20 °C storage conditions are hence unsuitable for the storage of algae for food applications. Storage at 4 °C had an additional advantage over 8 °C and 20 °C storage in that it resulted in lower microbial counts.

4.3. Open Tube vs. Closed Tube Storage

All storage tubes were shaken during storage and either completely sealed (closed storage) or sealed with a cotton plug (open storage). When algae were stored in open tubes, O2 uptake from the environment was enabled. However, the observed SCFA levels indicate that fermentation took place anyway. Diffusion of O2 into the algae suspension was insufficient to compensate O2 use by aerobic respiration at least in a part of the algae suspension. Although storage in open tubes resulted in lower SCFA levels compared to storage in closed tubes, SCFA were still being formed in significant amounts. Stirring and/or forced air bubbling is probably needed to avoid these undesirable processes completely.
The way of closing the storage tube also impacted the chlorophyll content in storage test 2, with higher chlorophyll levels after 8 °C storage in open tubes than in closed tubes (Table 1). Increasing chlorophyll levels during dark storage of Nannochloropsis have been observed before [21] and might be a response of algal cells to counteract the insufficient light incidence as seen for shaded leaves in plants [46]. The lack of this response during storage in closed tubes was perhaps caused by a reduced metabolic activity of the algae due to lower O2 levels. Chlorophyll levels never decreased during storage as long as no acetic acid was added. Since chlorophyll is the main pigment in Nannochloropsis, this is a relevant finding and no loss of the typical green color can be expected from that side.

4.4. Acetic Acid Addition

Acetic acid is a commonly used food additive with well-known antimicrobial activity against bacteria and yeasts [27]. As expected, the microbial count (Figure 1) and the number of yeasts and molds (Figure 2) were significantly reduced by acetic acid addition. It also suppressed fermentation and almost completely prevented propionate and butyrate formation (Figure 5). The addition of organic or inorganic acids was previously shown to reduce butyrate levels during the anaerobic incubation of Scenedesmus obliquus [47]. This was explained by growth inhibition of butyrate producing species such as Clostridium species due to the low pH. In the current study, no off odors were perceived by the authors for the acetic acid supplemented algae. A standardized evaluation of the odor by a group of panelists is now required to ascertain this observation. In any case, there is no doubt that acetic acid addition had a positive impact on the microbial count and that it suppressed the formation of odorous fermentation products.
Unfortunately, acetic acid addition was found to induce lipid hydrolysis when concentrates were stored for more than one week. Acetic acid supplementation also had a negative effect on chlorophyll levels when algae concentrates were stored for longer than 7 days. In a study of Zuo et al., a 10 min exposure to acetic acid (34 mM, pH 5) resulted in photosynthetic pigment degradation in Chlamydomonas reinhardtii and even caused programmed cell death [48]. This was explained by acetic acid diffusion across the cell membrane resulting in a decreased intracellular pH and cell damage [48]. In the current study, chlorophyll levels were not decreased after acetic acid addition (50 mM) and one week storage, while FFA levels remained low the first week. This suggests that N. gaditana is less susceptible to acetic acid induced stress. The fact that algae were concentrated by membrane filtration in our study and were not centrifuged such as in the study of Zuo et al. may have protected algal cells from shear forces and possibly contributed to cell integrity. Moreover, the recalcitrant cell wall of Nannochloropsis [49] can also be expected to act as a protective barrier.
Given its positive effects on microbial numbers and fermentation, acetic acid addition remains an interesting additive for short term Nannochloropsis storage. Yet, one must bear in mind that cell integrity will be impaired when acid exposure is prolonged.

5. Conclusions

This study showed that temperature control avoids off odor formation during the wet storage of N. gaditana concentrates. Acetic acid addition is a promising approach to control microbial levels and odor decay, but attention should be payed to its detrimental effects on algae integrity. The findings of this study will prove useful in bridging the time period between Nannochloropsis harvest and processing while preserving the value of the assessed algae quality attributes and avoiding drying costs. This is an inevitable step for sustainable algae cultivation and so also for the creation of an algae-based bio-economy. A large scale preservation test in a real production environment is now needed to evaluate the performance of the suggested storage conditions and a techno-economic assessment is required to forecast the economic feasability of the different storage approaches.

Supplementary Materials

The following are available online at https://www.mdpi.com/2076-3417/10/10/3419/s1, Figure S1: GC-MS analysis of the headspace of algae stored in closed recipients for 14 days, Figure S2: pH values of algae concentrates of the first storage experiment, Figure S3: Isobutyric and isovaleric acid concentrations in algae concentrates without added acetic acid, Table S1: Factorial ANOVA analysis results for samples without added acetic acid in storage experiment 2, Table S2: Factorial ANOVA analysis results for samples with added acetic acid in storage experiment 2.

Author Contributions

Conceptualization, J.V. and L.B.; methodology, J.V., S.K. and L.B.; validation, J.V. and S.K.; formal analysis, J.V.; investigation, J.V.; resources, L.B.; data curation, J.V.; writing—original draft preparation, J.V.; writing—review and editing, J.V., S.K. and L.B.; visualization, J.V.; supervision, L.B.; project administration, L.B.; funding acquisition, L.B. All authors have read and agreed to the published version of the manuscript.

Funding

This research was funded by NORTH-WEST EUROPE INTERREG, grant number NWE 639 as part of the IDEA project (Implementation and development of economic viable algae-based value chains in North-West Europe).

Acknowledgments

The authors thank Jornt Spit (Thomas More Kempen, Belgium) for the algae cultivation, Sandra Van Roy (VITO) for performing the algae filtration, Miranda Maesen (VITO) for GC assistance, Sam Vloemans and Nady Hufkens (VITO) for technical assistance and Maarten Spruyt (VITO) for execution of GC-MS analyses.

Conflicts of Interest

The authors declare no conflict of interest. The funders had no role in the design of the study; in the collection, analyses, or interpretation of data; in the writing of the manuscript, or in the decision to publish the results.

References

  1. Ma, X.N.; Chen, T.P.; Yang, B.; Liu, J.; Chen, F. Lipid production from Nannochloropsis. Mar. Drugs 2016, 14, 61. [Google Scholar] [CrossRef] [Green Version]
  2. Ma, Y.; Wang, Z.; Yu, C.; Yin, Y.; Zhou, G. Evaluation of the potential of 9 Nannochloropsis strains for biodiesel production. Bioresour. Technol. 2014, 167, 503–509. [Google Scholar] [CrossRef]
  3. Maffei, G.; Bracciale, M.P.; Broggi, A.; Zuorro, A.; Santarelli, M.L.; Lavecchia, R. Effect of an enzymatic treatment with cellulase and mannanase on the structural properties of Nannochloropsis microalgae. Bioresour. Technol. 2018, 249, 592–598. [Google Scholar] [CrossRef] [PubMed]
  4. Hulatt, C.J.; Wijffels, R.H.; Bolla, S.; Kiron, V. Production of fatty acids and protein by nannochloropsis in flat-plate photobioreactors. PLoS ONE 2017, 12, e0170440. [Google Scholar] [CrossRef] [PubMed]
  5. Harris, W.S.; Kris-Etherton, P.M.; Harris, K.A. Intakes of long-chain omega-3 fatty acid associated with reduced risk for death from coronary heart disease in healthy adults. Curr. Atheroscler. Rep. 2008, 10, 503–509. [Google Scholar] [CrossRef] [PubMed]
  6. Markou, G.; Wang, L.; Ye, J.; Unc, A. Using agro-industrial wastes for the cultivation of microalgae and duckweeds: Contamination risks and biomass safety concerns. Biotechnol. Adv. 2018, 36, 1238–1254. [Google Scholar] [CrossRef]
  7. IPCC. Special Report on Climate Change, Desertification, Land Degradation, Sustainable Land Management, Food Security, and Greenhouse Gas Fluxes in Terrestrial Ecosystems; IPCC: Geneva, Switzerland, 2019. [Google Scholar]
  8. Chua, E.T.; Schenk, P.M. A biorefinery for Nannochloropsis: Induction, harvesting, and extraction of EPA-rich oil and high-value protein. Bioresour. Technol. 2017, 244, 1416–1424. [Google Scholar] [CrossRef] [Green Version]
  9. Mathimani, T.; Pugazhendhi, A. Utilization of algae for biofuel, bio-products and bio-remediation. Biocatal. Agric. Biotechnol. 2019, 17, 326–330. [Google Scholar] [CrossRef]
  10. Zhang, R.; Parniakov, O.; Grimi, N.; Lebovka, N.; Marchal, L.; Vorobiev, E. Emerging techniques for cell disruption and extraction of valuable bio-molecules of microalgae Nannochloropsis sp. Bioprocess Biosyst. Eng. 2019, 42, 173–186. [Google Scholar] [CrossRef]
  11. Soomro, R.R.; Ndikubwimana, T.; Zeng, X.; Lu, Y.; Lin, L.; Danquah, M.K. Development of a two-stage microalgae dewatering processA life cycle assessment approach. Front. Plant Sci. 2016, 7, 1–12. [Google Scholar] [CrossRef] [Green Version]
  12. Milledge, J.J.; Heaven, S. A review of the harvesting of micro-algae for biofuel production. Rev. Environ. Sci. Biotechnol. 2013, 12, 165–178. [Google Scholar] [CrossRef] [Green Version]
  13. Ryckebosch, E.; Muylaert, K.; Eeckhout, M.; Ruyssen, T.; Foubert, I. Influence of drying and storage on lipid and carotenoid stability of the microalga Phaeodactylum tricornutum. J. Agric. Food Chem. 2011, 59, 11063–11069. [Google Scholar] [CrossRef] [PubMed]
  14. Ahmed, F.; Li, Y.; Fanning, K.; Netzel, M.; Schenk, P.M. Effect of drying, storage temperature and air exposure on astaxanthin stability from Haematococcus pluvialis. Food Res. Int. 2015, 74, 231–236. [Google Scholar] [CrossRef] [PubMed] [Green Version]
  15. Ge, H.; Li, J.; Chang, Z.; Chen, P.; Shen, M.; Zhao, F. Effect of microalgae with semicontinuous harvesting on water quality and zootechnical performance of white shrimp reared in the zero water exchange system. Aquac. Eng. 2016, 72–73, 70–76. [Google Scholar] [CrossRef]
  16. Spolaore, P.; Joannis-Cassan, C.; Duran, E.; Isambert, A. Commercial applications of microalgae. J. Biosci. Bioeng. 2006, 101, 87–96. [Google Scholar] [CrossRef] [Green Version]
  17. Balduyck, L.; Stock, T.; Bijttebier, S.; Bruneel, C.; Jacobs, G.; Voorspoels, S.; Muylaert, K.; Foubert, I. Integrity of the microalgal cell plays a major role in the lipolytic stability during wet storage. Algal Res. 2017, 25, 516–524. [Google Scholar] [CrossRef]
  18. Sales, R.; Mélo, R.C.S.; de Moraes, R.M.; da Silva, R.C.S.; Cavalli, R.O.; do Amaral Ferraz Navarro, D.M.; de Souza Santos, L.P. Production and use of a flocculated paste of Nannochloropsis oculata for rearing newborn seahorse Hippocampus reidi. Algal Res. 2016, 17, 142–149. [Google Scholar] [CrossRef]
  19. Welladsen, H.; Kent, M.; Mangott, A.; Li, Y. Shelf-life assessment of microalgae concentrates: Effect of cold preservation on microalgal nutrition profiles. Aquaculture 2014, 430, 241–247. [Google Scholar] [CrossRef]
  20. Napan, K.; Christianson, T.; Voie, K.; Quinn, J.C. Quantitative assessment of microalgae biomass and lipid stability post-cultivation. Front. Energy Res. 2015, 3, 1–6. [Google Scholar] [CrossRef] [Green Version]
  21. Camacho-Rodríguez, J.; Cerón-García, M.C.; Macías-Sánchez, M.D.; Fernández-Sevilla, J.M.; López-Rosales, L.; Molina-Grima, E. Long-term preservation of concentrated Nannochloropsis gaditana cultures for use in aquaculture. J. Appl. Phycol. 2016, 28, 299–312. [Google Scholar] [CrossRef]
  22. Refsgaard, H.H.F.; Brockhoff, P.M.B.; Jensen, B. Free polyunsaturated fatty acids cause taste deterioration of salmon during frozen storage. J. Agric. Food Chem. 2000, 48, 3280–3285. [Google Scholar] [CrossRef] [PubMed]
  23. Ganesan, B.; Brothersen, C.; McMahon, D.J. Fortification of foods with omega-3 polyunsaturated fatty acids. Crit. Rev. Food Sci. Nutr. 2014, 54, 98–114. [Google Scholar] [CrossRef] [PubMed]
  24. Gheysen, L.; Bernaerts, T.; Bruneel, C.; Goiris, K.; Van Durme, J.; Van Loey, A.; De Cooman, L.; Foubert, I. Impact of processing on n-3 LC-PUFA in model systems enriched with microalgae. Food Chem. 2018, 268, 441–450. [Google Scholar] [CrossRef] [PubMed]
  25. Van Durme, J.; Goiris, K.; De Winne, A.; De Cooman, L.; Muylaert, K. Evaluation of the volatile composition and sensory properties of five species of microalgae. J. Agric. Food Chem. 2013, 61, 10881–10890. [Google Scholar] [CrossRef] [PubMed]
  26. Wendt, L.M.; Kinchin, C.; Wahlen, B.D.; Davis, R.; Dempster, T.A.; Gerken, H. Assessing the stability and techno-economic implications for wet storage of harvested microalgae to manage seasonal variability. Biotechnol. Biofuels 2019, 12, 80. [Google Scholar] [CrossRef]
  27. Belitz, H.-D.; Grosch, W.; Schiberle, P. Food Chemistry, 3rd ed.; Springer: Berlin/Heidelberg, Germany, 2009; ISBN 978-3-540-69933-0. [Google Scholar]
  28. Ponis, E.; Parisi, G.; Chini Zittelli, G.; Lavista, F.; Robert, R.; Tredici, M.R. Pavlova lutheri: Production, preservation and use as food for Crassostrea gigas larvae. Aquaculture 2008, 282, 97–103. [Google Scholar] [CrossRef] [Green Version]
  29. ISO/TC 34/SC 9 Microbiology ISO 4833-1:2013—Microbiology of the Food Chain—Horizontal Method for the Enumeration of Microorganisms—Part 1: Colony Count at 30 Degrees C by the Pour Plate Technique. Available online: https://www.iso.org/standard/53728.html (accessed on 1 September 2019).
  30. Ryckebosch, E.; Muylaert, K.; Foubert, I. Optimization of an analytical procedure for extraction of lipids from microalgae. J. Am. Oil. Chem. Soc. 2012, 89, 189–198. [Google Scholar] [CrossRef]
  31. Kangani, C.O.; Kelley, D.E.; De Lany, J.P. New method for GC/FID and GC–C-IRMS analysis of plasma free fatty acid concentration and isotopic enrichment. J. Chromatogr. B 2008, 873, 95–101. [Google Scholar] [CrossRef] [Green Version]
  32. Lichtenthaler, H.K.; Buschmann, C. Chlorophylls. In Handbook of Food Analytical Chemistry; John Wiley & Sons, Inc.: Hoboken, NJ, USA, 2005; pp. 153–199. [Google Scholar]
  33. Ritchie, R.J. Consistent sets of spectrophotometric chlorophyll equations for acetone, methanol and ethanol solvents. Photosynth. Res. 2006, 89, 27–41. [Google Scholar] [CrossRef]
  34. Halim, R.; Hill, D.R.A.; Hanssen, E.; Webley, P.A.; Blackburn, S.; Grossman, A.R.; Posten, C.; Martin, G.J.O. Towards sustainable microalgal biomass processing: Anaerobic induction of autolytic cell-wall self-ingestion in lipid-rich Nannochloropsis slurries. Green Chem. 2019, 21, 2967–2982. [Google Scholar] [CrossRef]
  35. Madigan, M.T.; Martinko, J.M. Brock Biology of Microorganisms, 11th ed.; Pearson Prentice Hall: Upper Saddle River, NJ, USA, 2006; ISBN 0-13-144329-1. [Google Scholar]
  36. Catalanotti, C.; Yang, W.; Posewitz, M.C.; Grossman, A.R. Fermentation metabolism and its evolution in algae. Front. Plant Sci. 2013, 4, 1–17. [Google Scholar] [CrossRef] [PubMed] [Green Version]
  37. Klassen, V.; Blifernez-Klassen, O.; Wibberg, D.; Winkler, A.; Kalinowski, J.; Posten, C.; Kruse, O. Highly efficient methane generation from untreated microalgae biomass. Biotechnol. Biofuels 2017, 10, 186. [Google Scholar] [CrossRef] [PubMed]
  38. Jinkerson, R.E.; Radakovits, R.; Posewitz, M.C. Genomic insights from the oleaginous model alga Nannochloropsis gaditana. Bioengineered 2013, 4, 37–43. [Google Scholar] [CrossRef] [PubMed] [Green Version]
  39. Leffingwell, J.C.; Leffingwell, D. GRAS flavor chemicals detection thresholds. Perfum. Flavorist 1991, 16, 1–13. [Google Scholar]
  40. Ara, K.; Hama, M.; Akiba, S.; Koike, K.; Okisaka, K.; Hagura, T.; Kamiya, T.; Tomita, F. Foot odor due to microbial metabolism and its control. Can. J. Microbiol. 2006, 52, 357–364. [Google Scholar] [CrossRef] [PubMed] [Green Version]
  41. Smith, E.; Macfarlane, G. Dissimilatory amino acid metabolism in human colonic bacteria. Anaerobe 1997, 3, 327–337. [Google Scholar] [CrossRef]
  42. Roberts, K.P.; Heaven, S.; Banks, C.J. Comparative testing of energy yields from micro-algal biomass cultures processed via anaerobic digestion. Renew. Energy 2016, 87, 744–753. [Google Scholar] [CrossRef] [Green Version]
  43. Kadota, H.; Ishida, Y. Production of volatile sulfur compounds by microorganisms. Annu. Rev. Microbiol. 1972, 26, 127–138. [Google Scholar] [CrossRef]
  44. Achyuthan, K.; Harper, J.; Manginell, R.; Moorman, M. Volatile metabolites emission by In Vivo microalgae—An overlooked opportunity? Metabolites 2017, 7, 39. [Google Scholar] [CrossRef]
  45. Watson, S.B.; Jüttner, F. Malodorous volatile organic sulfur compounds: Sources, sinks and significance in inland waters. Crit. Rev. Microbiol. 2017, 43, 210–237. [Google Scholar] [CrossRef]
  46. Ilić, Z.S.; Milenković, L.; Šunić, L.; Fallik, E. Effect of coloured shade-nets on plant leaf parameters and tomato fruit quality. J. Sci. Food Agric. 2015, 95, 2660–2667. [Google Scholar] [CrossRef] [PubMed]
  47. Wendt, L.M.; Wahlen, B.D.; Li, C.; Kachurin, G.; Ogden, K.L.; Murphy, J.A. Evaluation of a high-moisture stabilization strategy for harvested microalgae blended with herbaceous biomass: Part I—Storage performance. Algal Res. 2017, 25, 567–575. [Google Scholar] [CrossRef]
  48. Zuo, Z.; Zhu, Y.; Bai, Y.; Wang, Y. Acetic acid-induced programmed cell death and release of volatile organic compounds in Chlamydomonas reinhardtii. Plant Physiol. Biochem. 2012, 51, 175–184. [Google Scholar] [CrossRef]
  49. Scholz, M.J.; Weiss, T.L.; Jinkerson, R.E.; Jing, J.; Roth, R.; Goodenough, U.; Posewitz, M.C.; Gerken, H.G. Ultrastructure and composition of the Nannochloropsis gaditana cell wall. Eukaryot. Cell 2014, 13, 1450–1464. [Google Scholar] [CrossRef] [Green Version]
Figure 1. Total microbial load—storage experiment 1. (a) Average colony count after 0, 7 and 14 days of storage in algae samples without added acetic acid. (b) Effect of storage temperature for algae without acetic acid addition and stored for 7 or 14 days. (c) Average colony count of algae without acetic acid addition. (d) Effect of acetic acid addition for algae stored at 8 °C in open tubes. Lowercase letters (a,b,c) denote significant differences; values within one figure that are not labelled by the same letter are significantly different. Error bars represent standard deviations. CFU: colony forming units.
Applsci 10 03419 g001
Figure 2. Yeast and mold counts—storage experiment 1. (a) Yeast and mold count after 0, 7 and 14 days of storage in algae samples without added acetic acid. (b) Effect of storing algae in open or closed recipients without acetic acid addition. (c) Effect of acetic acid addition for algae stored at 8 °C in open tubes. Lowercase letters (a,b) denote significant differences. Values within one figure that are not labelled by the same letter are significantly different. The t0 value was not included in the statistical analysis of the data shown in Figure 1a. Error bars represent standard deviations.
Applsci 10 03419 g002
Figure 3. O2 levels in the headspace of closed storage recipients - storage experiment 1.
Applsci 10 03419 g003
Figure 4. Short-chain fatty acid (SCFA) levels in algae concentrates to which no acetic acid was added—storage experiment 1. (a) Acetic acid concentrations, (b) propionic acid concentrations, (c) butyric acid concentrations and (d) concentrations of branched SCFA (sum of isobutyric and isovaleric acid) in algae concentrates to which no acetic acid was added. Separate graphs for isobutyric acid and isovaleric acid are included in Supplementary Materials Figure S3. Error bars represent standard deviations. Lowercase letters (a,b,c,d) denote significant differences. Values within one figure that are not labelled by the same letter are significantly different.
Applsci 10 03419 g004aApplsci 10 03419 g004b
Figure 5. Impact of acetic acid addition for 8 °C storage in open tubes—storage experiment 1. Lowercase letters (a, b, c) denote significant differences. Propionic acid values that are not labelled by the same letter are significantly different. Because there was no significant interaction between the effect of preservation time and acetic acid addition on butyric acid levels (p = 0.17), no post-hoc analysis was performed, and no letter labels were added for butyric acid in the figure.
Applsci 10 03419 g005
Table 1. Results of storage experiment 2. Concentrations are given as averages ± standard deviations. The results of an ANOVA analysis can be found in Supplementary Materials Tables S1 and S2.
Storage ConditionStorage Time (Days)Lipid (% dm)FFA (% Lipid)Chlorophyll (mg/g dm)
t0017.3 ± 0.22.3 ± 0.419.7 ± 0.8
4 °C, open717.2 ± 0.12.0 ± 0.223.2 ± 2.7
1718.0 ± 0.31.8 ± 0.124.5 ± 3.6
4 °C, closed717.2 ± 0.11.9 ± 0.117.2 ± 2.5
1716.7 ± 1.01.9 ± 0.219.1 ± 2.3
8 °C, open718.2 ± 0.21.5 ± 0.127.0 ± 2.0
1719.0 ± 0.32.1 ± 0.129.1 ± 1.7
8 °C, closed716.6 ± 0.31.8 ± 0.120.6 ± 0.3
1717.0 ± 0.22.3 ± 0.119.4 ± 0.6
8 °C open + acetic acid718.0 ± 0.42.9 ± 0.225.8 ± 1.4
1717.2 ± 0.121.6 ± 3.710.5 ± 0.6

