Influence of Approaching Excavation on Adjacent Segments for Twin Tunnels

1
The Key Laboratory of Urban Security and Disaster Engineering, Ministry of Education, Beijing University of Technology, Beijing 100124, China
2
School of Architecture and Civil Engineering, Jiangsu University of Science and Technology, Zhenjiang 212003, China
*
Author to whom correspondence should be addressed.
Appl. Sci. 2020, 10(1), 98; https://doi.org/10.3390/app10010098
Submission received: 5 November 2019
/
Revised: 9 December 2019
/
Accepted: 19 December 2019
/
Published: 20 December 2019
(This article belongs to the Special Issue Short-Term Forecasting in Civil Engineering with Multidisciplinary Approaches: Combined Numerical, Experimental and Statistical Methods)
Abstract
:This paper aims at influence analysis of approaching excavation on adjacent segments for twin tunnels with variable clear spacing located in Beijing, China. A series of numerical simulations have been conducted to investigate the influence of approaching excavation on ground displacements and mechanical responses of segments. What’s more, on-site monitoring was conducted at the position of the minimum spacing between the twin tunnels. It is found that the deformation of the measured segment presents a pronounced asymmetric ovalization when the second tunnel approaches the measured cross-section. During the approaching excavation of the second tunnel, the normal force increases gradually, whereas the bending moment first decreases and then increases. The maximum increments of internal forces in the measured segment are both located at the regions near the second tunnel, in which the springline and shoulder of the segment are mainly subject to the effect of the circumferential compression and axial tension. The approaching excavation reduces the horizontal displacements of the ground between twin tunnels and increases the ground settlements as well as the horizontal displacements of the ground on both sides. The actual tunneling case of first along the curved trajectory and then along the straight-line trajectory can reduce internal forces of the segment.
1. Introduction
The shield tunneling method has the advantages of high safety, fast construction speed and good construction quality, so it has become the main method for tunnel construction in crowded urban areas [1,2,3]. For subway tunnels, twin-tunnels are more common because of two-way traffic. As compared to one single big tunnel, twin-tunnels have advantages in technical feasibility, less ground movement and smaller lining force [4]. However, it is challenging to ensure the stability of the surrounding soil and the safety of the first tunnel structure during the construction of the second tunnel [5,6,7]. Tunnel-ground-tunnel interactions are inherent complex especially when the clear distance is small enough [8]. The interaction mechanisms depend on the tunnel geometries, geological conditions, and the construction loadings, etc. If the clear spacing is less than the external diameter of the second tunnel, it is necessary to demonstrate the safety of construction sufficiently, which was stipulated in the standard specification for shield tunnels proposed by the Japan Society of Civil Engineers [9].
In order to investigate the interaction mechanisms between twin tunnels, several approaches have been carried out, which include theoretical analyses, numerical simulations, and field tests. Liang et al. [10] obtained the unloading vertical stress field beneath the new tunnel based on Mindlin solutions [11]. Kong et al. [12] obtained the analytical solution of the displacement field of twin tunnels by using the Schwartz alternating theory. The ground settlements during the construction of twin tunnels were predicted by the experimental and numerical methods [1,13,14,15]. The influence of the interaction between twin tunnels on the horizontal and vertical ground displacements will induce the variations of structural forces during the approaching excavation [16].
The field measurement on the strain (or stress) increments in the segment induced by the approaching excavation were carried out by Gao et al. [9]. Unfortunately, comparative and parametric analyses have not been implemented via numerical or analytical methods [17,18,19,20,21]. The finite element modeling was performed to predict the influence of approaching excavation on the ground displacements and the structural forces in the segment of twin tunnels [22,23,24]. However, the construction loadings (e.g., friction force, jacking force, grouting pressure, etc.) were not simulated in detail. Note that the lateral spacing between twin tunnels in the above investigations is constant along the tunneling direction, while this condition of equal spacing is often subject to other factors and cannot meet in actual engineering.
In this paper, twin tunnels with variable clear spacing is taken as a case study. The meticulously and completely real-time monitoring on the adjacent segment has been carried out. Furthermore, the influence of the tunnel approaching excavation on the internal forces of the segment and the ground displacements is researched thoroughly. Finally, the optimization of successive excavation of the curved tunnel and straight-line tunnel with this project as the background is discussed. The research results provide references for the shield construction of closely spaced twin tunnels.
2. Case Studied Tunnels
Twin tunnels have been built for the tunnel running from Caoqiao station to Fanjiacun station of metro line 10 in Beijing, China. A curved shield tunneling with a curvature radius of 840 m is prior to the second straight-line tunneling due to the restriction of site conditions. The plan view of twin tunnels of D = 6 m in close proximity to each other is shown in Figure 1a. During the approaching excavation, the distance between the two excavation faces along the route is larger than 200 m. The lateral spacing between the first tunnel and the second tunnel is gradually reduced to 2.7 m (less than D/2, D is the external diameter of the tunnel) and then increases gradually as the second TBM shield advances away. Based on the geotechnical investigation report and the similar soil parameters adjacent to the existing project [25], the specific characteristics of the soil strata (Figure 1b) are summarized in Table 1. Friction angle and cohesion were obtained by direct shear tests. Young’s modulus and Poisson ratio were obtained based on the standard triaxial tests and the similar soil parameters adjacent to the existing project [25]. Density was obtained by the cutting ring method.
Table 2 presents the specific specifications of the TBM shield as well as the circular segment consists of 5 regularly shaped blocks and a small-sized key block. The TBM shield utilized in this project is Herrenknecht shield machine (S-399), which belongs to earth pressure balance tunnel boring machines (EPB-TBM). The average advance rate and thrust force are 35 mm/min and 11.2 MN, respectively. The average rotation rate and torque of cutting wheel are 1.8 r/min and 3300 kN·m, respectively. Especially, for the curved tunnel, the (double-sided) wedge-shaped segments were applied, the wedge magnitude and wedge angle of which are 48 mm and 0.46°, respectively.
In view of the particularity and complexity of the approaching excavation, the staged construction of the second straight-line tunnel will inevitably have an impact on the first curved tunnel, especially for the position of the minimum spacing between twin tunnels. To ensure the safety of the structure of the first tunnel, the vibrational chord strain gauges were arranged on the internal surface of the segment of the first tunnel at Cross-section B (Figure 1a), which hereafter is called the measured segment or measured cross-section. As shown in Figure 2, the monitoring strain gauges were set in the three positions (α = 0°, +45°, and −45°), with each position existing two strain gauges that are oriented towards the circumference and axis, respectively. The initial frequency f0 was obtained when the distance from the measured cross-section to the second tunnel face is close to 100 m. Subsequently, the monitoring frequency fn was recorded in real-time as the second tunnel advances. Then the strain increments ε can be estimated by:
where k denotes the coefficient of the strain gauges calibrated before they are delivered.
ε = k(fn − f0),
3. Description of Numerical Simulations
3.1. Numerical Models
In order to ensure that the numerical modelling is as close as possible to an actual excavation process, the modeling tunnel length should be sufficiently large in case that condition permitted [26,27]. In the proposed model, an approximate length of 153 m in the tunneling direction is adopted, as shown in Figure 3a. After the excavation of the first tunnel is finished, the second tunnel sequentially passes through the cross-sections A, B, and C (Figure 3b). Taking Cross-section B as the measured cross-section, the positions at the middle, left and right sides of the twin tunnels are respectively marked as the monitoring axes MP, LP and RP in its lateral view (Figure 3c).
3.2. Characteristics of Three-Dimensional Entity
As shown in Figure 4, the component instances in this model are simulated by solid elements (C3D8R in ABAQUS), with a total of 264,672. The classical Mohr-coulomb constitutive model was utilized to model the soil. Descriptions of model parameters are listed in Table 1. In addition, the dilatancy angle ψ is assumed to depend on the friction angle φ, namely ψ = φ − 30° if φ > 30°, ψ = 0 if φ < 30° [28].
The TBM shield is assumed as a cylindrical shape with conicity ignored [29]. Due to the presence of the cutter-head as well as chamber, the elastic modulus and thickness of the shield in the models are 10 and 2 times greater than those in Table 2, respectively [30]. Nevertheless, the elastic modulus of the segments needs to be reduced due to the simulations of longitudinal or circumferential joints are ignored. Consequently, the modulus of the concrete segments is assumed as 25.9 GPa in the case of the reduction factor of 0.75 [30].
According to the time-dependent elastic modulus of the grout material [31], the filling grout (Figure 4) between the excavation interface and the segmental outer wall is defined by the annular concrete elements with two-phase elastic behaviors. Combined with actual grouting timing and boring rate, the elastic moduli of fresh grout and hardened grout are assumed as 3 MPa and 500 MPa, respectively.
Unlike the straight-line tunnel, overcutting at the inner side of the curved tunnel needs to be considered, which is simulated via equivalent, semicircular zone elements with low modulus and thin thickness (Figure 4). The mechanism of over-excavation for articulated TBM shield is illustrated in Figure 5, where LM1 and LM2 are the lengths of front shield body and rear shield body, respectively [32].
Considering promptly support after excavation, it is assumed that the overcutting ω is equal to one-third of the theoretical value (Ga) [33,34]:
where Q is the curvature radius of the curved tunnel, R is the external diameter of the TBM shield, LM2 = 2b, and b is equal to one ring width.
The value of overcutting ω considered in the numerical analyses is 1.14 cm, which is ten times the calculated value obtained by substituting the following parameters into Equation (2): Q = 840 m, R = 3.14 m, b = 1.2 m. Meanwhile, the modulus of the elements of overcutting is 13 MPa, which is one-tenth of the original value [35].
3.3. Modelling of Construction Loadings
As shown in Figure 4, the construction loadings considered in this model from the excavation face until the shield tail are in sequence of the face pressure [36], the friction force between the shield skin and the ground, the jacking force and the grouting pressure [37,38,39].
- It is assumed that the pressure exerted by the TBM on the excavation face varies linearly with elevation according to ground density. The reference pressure at the tunnel axis is usually set as half of the sum of stresses at the tunnel crown and invert [40]. During the actual construction, an additional pressure of about 15 kPa is enforced on the excavation face [41]. As a result, the face pressures at the axes of the first and second tunnels are assumed as 141 kPa and 148 kPa, respectively.
- It is assumed that the grouting pressure acting on both the ground and segment is uniform distribution, and is related to the ground overburden pressure at tunnel crown [42]. As a result, the grouting pressures acting on the first and second tunnels are assumed as 3.3 bar and 3.1 bar, respectively.
- In order to simplify the simulation, the total force of hydraulic jacks is loaded equally on the circumferential surface of the installed segment [27]. For both the first curved tunnel and the second straight-line tunnel, the jacking force per unit area is about 2.1 MPa. However, it is worth noting that the direction of the jacking force vector is not perpendicular to the acting surface for the first curved tunnel. In other words, an angle between it and the central axis of the newly installed segment exists to achieve a curved trajectory.
- In ABAQUS, the friction force indirectly exerted on the soil is simulated via a contact pair consisting of the excavation interface and the shield skin. Furthermore, the Coulomb friction law is assumed, and the friction coefficient is set as 0.25 [30].
3.4. Shield Tunneling Process
Due to the large quantities of elements in this model, the appropriate reduction of the step numbers is performed to improve the calculation efficiency. Specifically, the process consists of a sequence of excavation steps, with each step following a set of procedures that result in the advancement of the width of two rings. The excavation of the first tunnel is conducted from step 1 to step 66; the excavation of the second tunnel is conducted from step 67 to step 128.
Taking the step of digging ground slice “n” as an example (Figure 4), the consecutive procedures of simulating the second shield tunneling may be referred to [35]. Particularly, with the advancement of the TBM shield from slices “n–3” to “n–1”, the segment is installed by activating slice “n–3”. The prescribed grouting pressure on both the ground and segment is loaded at slice “n–3”. Simultaneously, the elements of fresh grout and hardened grout are activated at slices “n–3” and “n–8”, respectively.
4. Numerical Analysis Results and Comparisons
4.1. Influence of Approaching Excavation on Ground Displacements
4.1.1. Ground Surface Settlement
In order to avoid the influence of the model boundary, the calculation results from step 67 to step 76 and from step 119 to step 128 are not included in the following analysis. In other words, the range from step 77 to step 118 (corresponding to the excavation of the second tunnel from Cross-section A to Cross-section C in Figure 3b) is taken as the effective influence range of the approaching excavation.
Figure 6 shows the evolutions of ground surface settlement at the measured Cross-section B during the approaching excavation. When the second tunnel is far from the measured cross-section (at Cross-section A), the transversal settlement trough is approximately symmetric with respect to the curved tunnel axis. It indicates that the small overcutting of this project has little effect on the surface settlement. When the second tunnel approaches the measured Cross-section B, the settlement trough shifts toward the second tunnel due to the construction loadings caused by the approaching excavation. When the second tunnel approaches Cross-section C, the peak value and width of the settlement trough is increased, and the settlement 80% larger than that when approaches Cross-section A is not located over the middle position between twin tunnels. This asymmetric characteristic of the settlement trough was also predicted by experimental, analytical and numerical methods [16,32,43,44].
4.1.2. Horizontal Ground Displacement
Figure 7 shows the evolutions of the horizontal displacement of the ground located at the middle position between twin tunnels (i.e., the MP axis located at Cross-section B in Figure 3) during the approaching excavation. Positive values on the abscissa indicate the ground inclines to the second tunnel, and negative values indicate the ground moves towards the first tunnel.
When the second tunnel is far from the measured cross-section (at Cross-section A), the ground within a span of D/2 nearby the tunnel axis inclines to the second tunnel; while the ground nearby the surface moves towards the first tunnel. When the second tunnel approaches the measured Cross-section B, the ground moves towards the first tunnel, which is mainly affected by the construction loadings during the approaching excavation.
As a result, the peak value of horizontal displacement that inclines to the second tunnel (at about 17 m below the surface) reduces by 82% as compared to that when approaches Cross-section A; while the peak value that moves towards the first tunnel (at about 12 m below the surface) raises by 159%. When the second tunnel approaches Cross-section C, the ground again moves towards the second tunnel, which is mainly affected by the ground loss [45] during the approaching excavation. As a result, the peak values that inclines to the second tunnel and the first tunnel are 0.5 mm smaller than those at Cross-section B.
Figure 8 shows the evolutions of the horizontal displacement of the ground located at the left side and the right side of twin tunnels (i.e., LP and RP axes located at Cross-section B in Figure 3c) during the approaching excavation. Positive values on the abscissa indicate the ground inclines to twin tunnels, and negative values indicate the ground moves outward. When the second tunnel is far from the measured cross-section (at Cross-section A), the ground at both sides presents similar variations as compared to that at the MP axis. The peak value of the displacement that moves outward at the LP axis is larger than that at the RP axis.
When the second tunnel approaches the measured Cross-section B, the ground nearby the tunnel axis moves outwards. The increment of displacement that moves outward at the RP axis is fairly pronounced, the peak value of which is close to that at the LP axis. This is a consequence of the existing (first) tunnel, which obstructs the transfer of lateral pressing effect. When the second tunnel approaches Cross-section C, the ground nearby the tunnel axis again moves outward; while the ground nearby the surface moves towards the tunnels. The increment of the former movement is smaller than that of the latter one. Under the dual action of ground loss and ovalization of the tunnel structure, the peak value of the displacement that moves outward at the LP axis (nearby the tunnel axis) is 0.3 mm larger than that at the RP axis. However, the peak value that inclines to the tunnels at the LP axis (nearby the surface) is 0.8 mm smaller than that at the RP axis.
4.2. Influence of Approaching Excavation on Adjacent Tunnel
Figure 9 shows the evolutions of internal forces in the measured segment during the approaching excavation. The negative values indicate that the forces are in compression and moment anticlockwise. When the second tunnel is far from the measured cross-section (at Cross-section A), the profiles of normal force and bending moment are asymmetric with respect to the curved tunnel axis, which is mainly affected by the overcutting in the curved tunnel. After that, the asymmetric characteristics become more striking due to the approaching excavation. As the second tunnel approaches and keeps away from the measured cross-section (i.e., successively approaches cross-sections B and C), Figure 9a shows the gradual increase in the normal force. The increments at the tunnel springline near the second tunnel (α = 0°) and the tunnel crown (α = 90°) are larger than those at the tunnel springline far from the second tunnel (α = 180°) and the tunnel invert (α = 270°), respectively. When the second tunnel approaches the measured Cross-section B, Figure 9b shows the decrease in the absolute magnitude of the bending moment. Nevertheless, when approaching Cross-section C, the absolute magnitude of the bending moment increases as compared to that when approaches Cross-section A. The changes of bending moment between the cases of far from and passed over the measured cross-section occur at the regions near the second tunnel (from α = −90° to α = 90°) are more obvious than those at the regions far from the second tunnel (from α = 90° to α = 270°). This result is consistent with the results obtained by Kim et al. and Do et al. [5,16], who reported that the maximum increment of bending moment in an existing tunnel is located at the regions near a new tunnel.
4.3. Comparison of Numerical and Monitored Results
Figure 10 shows the contours of the circumferential strain and the deformations of the measured segment at three stages. When the second tunnel is far from the measured cross-section (Figure 10a), the deformed configuration of the segment, scaled with factor 200, presents a slight difference with that calculated by Ninić [46] with respect to a straight-line shield tunnel. The difference is that the deformations at the inner side of the curved tunnel are larger than those at the outer side. The reason for the asymmetry of deformations on both sides of the curved tunnel is that the resistance of strata at the inner side of the curved tunnel is weakened due to the overcutting. When the second tunnel approaches the measured cross-section (Figure 10b), a more asymmetric and increased ovalization is presented as compared to Figure 10a. This is a consequence of the approaching excavation, which generates a pronounced lateral pressing effect on the measured segment. As the second tunnel keeps away from the measured cross-section, the deformations of the segment at Cross-section C no longer changes significantly.
In order to investigate the spatial effect of the approaching excavation of the second tunnel on the first tunnel, Figure 11 shows the variations of the longitudinal deformations in the measured segment during the approaching excavation. Positive values on the ordinate indicate the deformations in the direction of the TBM advance. During the approaching of the second tunnel to the monitored Cross-section B, the monitored segment moves toward the direction of the TBM advance. However, it moves toward the reverse direction during the TBM shield gradually keeps away from the monitored cross-section. Among them, the variation of the point at the inner side of the curved tunnel (α = 180°) is more obvious than that at the outer side (α = 0°), which is due to the influence of the overcutting. The variation of the point at the tunnel crown (α = 90°) is more obvious than that at the tunnel invert (α = 270°). These significant variations mainly occurred within about 30 m from the front of the monitored cross-section. In other words, the longitudinal range of the impact of the approaching excavation on the structure of the first tunnel is 30 m (5D).
Taking the strain values when the second tunnel approaches Cross-section A (step 77) as the initial values, after each excavation step, the strain increments due to the approaching excavation are calculated as shown in Figure 12. The strain increments at each monitoring point remain small until the excavation of the second tunnel with a lagged distance of about 24 m (10 steps) behind the measured cross-section. After that, the strain increments develop gradually and reach the peak values when the second tunnel face arrives near the measured cross-section. Eventually, the strain increments are going to stabilize after the TBM shield passes over the measured cross-section. In particular, the fluctuation amplitudes of circumferential strain increments are larger than those of axial strain increments. Concretely, the variations of the strain increments nearby the measured cross-section are summarized as follows:
- The circumferential strain increment at C1 firstly develops as tensile strain; then fluctuates towards the reverse direction; finally stabilizes in the compressive strain state. The circumferential strain increment at C2 mainly fluctuates within the range of compressive strain. These variations indicate that the impact of the approaching excavation is significant on the measured segment at the tunnel springline and shoulder regions, which are mainly subject to the circumferential compression.
- The circumferential strain increment at C3 firstly develops as tensile strain and subsequently stabilizes. It shows that the impact of the approaching excavation is slight on the measured segment at the tunnel base region.
- The variation of axial strain increment at A2 is similar to that at A1. The fluctuation amplitude of the former is smaller than that of the latter one. These variations indicate that the impact of the approaching excavation is significant on the measured segment at the tunnel springline and shoulder regions, which are mainly subject to the tensile compression.
- The axial strain increment with small value at A3 firstly develops as tensile strain; then fluctuates towards the reverse direction; finally stabilizes in the compressive strain state.
According to the monitoring data, Figure 13 presents the variations of the circumferential and axial strain increments in the measured segment during the approaching excavation. The results obtained by numerical simulation agree well with the monitored results, but the peak values achieved from on-site monitoring are larger than those from the numerical model. The most probable reason for this difference is due to the interference of excavation equipment, construction procedures, and ambient temperature. Furthermore, numerical simulation is conducted in an ideal condition. Ignoring the influence of longitudinal or circumferential joints will inevitably exaggerate the stiffness of the segmental linings.
5. Optimization of Construction Schemes
The above tunneling case of first along the curved trajectory and then along the straight-line trajectory is taken as the case I, and the construction case of first along the straight-line trajectory and then along the curved trajectory is taken as the case II. In this section, the numerical simulation of case II is performed to compare the differences between these two cases on ground displacements and internal forces. When the second tunnel approaches Cross-section C, the results (at step 118) are observed for the contrastive analysis.
5.1. Ground Displacement
Figure 14 shows the variations of ground surface settlement at the measured Cross-section B (Figure 3a) and horizontal ground displacement at LP, MP and RP axes (Figure 3c) in two construction cases. As seen in Figure 14a, the peak value of the settlement in case II is about 0.2 mm larger than that in case I and is closer to the middle position between twin tunnels. As seen in Figure 14b, for the ground at both sides (LP and RP axes), little difference can be observed between these two cases on horizontal ground displacements. For the ground at the middle position between twin tunnels (MP axis), the peak value of the displacement that moves towards the curved tunnel in case II is about 1.3 mm smaller than that in case I.
5.2. Internal Forces in the Segment
Figure 15 shows the variations of internal forces in the measured segment of the first tunnel in two construction cases. The profiles of normal force and bending moment in these two cases are asymmetric with respect to the tunnel axis. The peak values of internal forces occur at the regions near the second tunnel. As seen in Figure 15a, the peak value of normal force in case II (α = 180°) is about 189 kN/m larger than that in case I (α = 0°). As seen in Figure 15b, the peak value of the negative bending moment in case II (α = 165°) is about 9 kN·m/m larger than that in case I (α = 345°); The peak value of the positive bending moment in case II (α = 90°) is about 17 kN·m/m larger than that in case I (α = 75°).
Furthermore, the safety factors of the concrete member are introduced to make a comparison of the construction schemes [47]. If the eccentricity e0 of a rectangular concrete member is less than one-fifth of its thickness h (i.e., e0 ≤ 0.2h), the bearing capacity of the concrete member is controlled by its compressive strength. If e0 > 0.2h, the bearing capacity is controlled by its tensile strength. Then the safety factors (Kc or Kt) can be estimated by:
where β1 and β2 denote the buckling and acentric coefficients, respectively, Rc and Rt denote the ultimate compressive and tensile strengths of concrete, respectively, and b1 denotes the width of the member. Specifically, e0 is the ratio of bending moment (M) to normal force (N) calculated above, h = 0.4 m, β1 = 1, Rc = 36.5 MPa, Rt = 3.1 MPa, b1 = 1 m, while β2 can be calculated by:
The safety factors for the two construction cases are obtained by Equations (2) and (3). As shown in Figure 16, the distribution of safety factors along the periphery in case I can effectively cover the results in case II. Moreover, the minimum safety factor in case I (13.6) is larger than that in case II (6.0), which indicates that the concrete member in case I is safer.
In general, the selection of a reasonable construction scheme requires the integrated consideration of the influence of approaching excavation on the displacements of the surrounding environment and the internal forces of the tunnel structure. If the case I is selected, it will result in smaller internal forces of the segment. If the case II is selected, it will result in a smaller horizontal displacement of the ground between twin tunnels. In actual construction, the case I is selected as the implementation scheme.
From the perspective of effectively controlling the vertical displacement of the ground and the internal forces of the tunnel structure, this decision is relatively reasonable. Note that the construction loadings should be reasonably controlled to prevent excessive horizontal displacements.
6. Conclusions
A series of numerical simulations and on-site monitoring have been conducted in this paper to analyze the influence of approaching excavation on adjacent segments for twin tunnels in Beijing, China. The effects of the approaching excavation on the ground displacement and segment internal forces were discussed. The contrastive analysis was performed with two construction schemes. The achievements of the present study are possible to be drawn as follows:
- (1)
- The deformation of the measured segment is asymmetric with respect to the tunnel axis due to the influence of the overcutting. Under the influence of lateral pressing effect induced by approaching excavation, a pronounced asymmetric and increased ovalization is presented on the measured segment when the second tunnel approaches the measured cross-section.
- (2)
- As the second tunnel approaches and keeps away from the measured cross-section, the peak value of the ground settlement at the monitoring cross-section always shifts toward the second tunnel, and the ground nearby the tunnel axis on both sides always moves outward. Under the influence of construction loadings, soil loss and ovalization of the segment, the approaching excavation reduces the horizontal displacements of the ground between twin tunnels and increases the ground settlements as well as the horizontal displacements of the ground on both sides.
- (3)
- When the second tunnel is far from the measured cross-section, the profiles of internal forces in the measured segment are asymmetric with respect to the curved tunnel axis, which is mainly affected by the overcutting. After that, the asymmetric characteristics become more striking due to the approaching excavation. As the second tunnel approaches and keeps away from the measured cross-section, the normal force increases gradually, whereas the bending moment first decreases and then increases. The maximum increments of normal force and bending moment are both located at the regions near the second tunnel.
- (4)
- For the curved tunnel and straight-line tunnel required for excavation in this project, the tunneling case of first along the curved trajectory and then along the straight-line trajectory will result in smaller internal forces of the segment. However, the construction case of first along the straight-line trajectory and then along the curved trajectory will result in a smaller horizontal displacement of the ground between twin tunnels.
- (5)
- The variations of strain increments obtained by numerical simulation agree well with the monitored results. The impact of the approaching excavation is significant on the measured segment at the tunnel springline and shoulder regions, which are mainly subject to the circumferential compression and axial tension.
Author Contributions
S.L. and P.L. prepared the concepts and designs; M.Z. provided the original data; Y.L. conducted the on-site monitoring; S.L. analyzed the data and performed the numerical simulation. All authors participated in edited, reviewed, and improved the manuscript. All authors have read and agreed to the published version of the manuscript.
Funding
The financial support for this work was provided by the National Natural Science of Foundation of China (Grants No. 51978018 and 51978019), which are gratefully acknowledged.
Acknowledgments
The authors appreciate Dechun Lu and Fanchao Kong and Qingtao Lin at the Beijing University of Technology for providing the facility and assistance.
Conflicts of Interest
The authors declare no conflict of interest.
References
- Zhang, Z.X.; Liu, C.; Huang, X.; Kwok, C.Y.; Teng, L. Three-dimensional finite-element analysis on ground responses during twin-tunnel construction using the URUP method. Tunn. Undergr. Space Technol. 2016, 58, 133–146. [Google Scholar] [CrossRef] [Green Version]
- Li, P.F.; Chen, K.Y.; Wang, F.; Li, Z. An upper-bound analytical model of blow-out for a shallow tunnel in sand considering the partial failure within the face. Tunn. Undergr. Space Technol. 2019, 91, 102989. [Google Scholar] [CrossRef]
- Wan, T.; Li, P.F.; Zheng, H.; Zhang, M.J. An analytical model of loosening earth pressure in front of tunnel face for deep-buried shield tunnels in sand. Comput. Geotech. 2019, 115, 103170. [Google Scholar] [CrossRef]
- Li, P.F.; Wang, F.; Fan, L.F.; Wang, H.D.; Ma, G.W. Analytical scrutiny of loosening pressure on deep twin-tunnels in rock formations. Tunn. Undergr. Space Technol. 2019, 83, 373–380. [Google Scholar] [CrossRef]
- Kim, S.H.; Burd, H.J.; Milligan, G.W.E. Model testing of closely spaced tunnels in clay. Géotechnique 1998, 48, 375–388. [Google Scholar] [CrossRef]
- Guo, W.; Wang, G.; Bao, Y.; Li, P.; Zhang, M.; Gong, Q.; Li, R.; Gao, Y.; Zhao, R.; Shen, S. Detection and monitoring of tunneling-induced riverbed deformation using GPS and BeiDou: A Case Study. Appl. Sci. 2019, 9, 2759. [Google Scholar] [CrossRef] [Green Version]
- Zhao, W.; Jia, P.J.; Zhu, L.; Cheng, C.; Han, J.Y.; Chen, Y.; Wang, Z.G. Analysis of the Additional Stress and Ground Settlement Induced by the Construction of Double-O-Tube Shield Tunnels in Sandy Soils. Appl. Sci. 2019, 9, 1399. [Google Scholar] [CrossRef] [Green Version]
- Yamaguchi, I.; Yamazaki, I.; Kiritani, Y. Study of ground-tunnel interactions of four shield tunnels driven in close proximity, in relation to design and construction of parallel shield tunnels. Tunn. Undergr. Space Technol. 1998, 13, 289–304. [Google Scholar] [CrossRef]
- Gao, S.M.; Chen, J.P.; Zuo, C.Q.; Wang, W. Monitoring of Three-dimensional Additional Stress and Strain in Shield Segments of Former Tunnels in the Construction of Closely-Spaced Twin Tunnels. Geotech. Geol. Eng. 2017, 35, 69–81. [Google Scholar] [CrossRef]
- Liang, R.; Xia, T.; Hong, Y.; Yu, F. Effects of above-crossing tunnelling on the existing shield tunnels. Tunn. Undergr. Space Technol. 2016, 58, 159–176. [Google Scholar] [CrossRef]
- Mindlin, R.D. Force at a point in the interior of a semi-infinite solid. J. Appl. Phys. 1936, 7, 195–202. [Google Scholar] [CrossRef]
- Kong, F.C.; Lu, D.C.; Du, X.L.; Shen, C.P. Elastic analytical solution of shallow tunnel owing to twin tunnelling based on a unified displacement function. Appl. Math. Model. 2019, 68, 422–442. [Google Scholar] [CrossRef]
- Chen, R.P.; Zhu, J.; Liu, W.; Tang, X.W. Ground movement induced by parallel EPB tunnels in silty soils. Tunn. Undergr. Space Technol. 2011, 26, 163–171. [Google Scholar] [CrossRef]
- Ocak, I. Interaction of longitudinal surface settlements for twin tunnels in shallow and soft soils: The case of Istanbul Metro. Environ. Earth Sci. 2013, 69, 1673–1683. [Google Scholar] [CrossRef]
- Hasanpour, R.; Chakeri, H.; Ozcelik, Y.; Denek, H. Evaluation of surface settlements in the Istanbul metro in terms of analytical, numerical and direct measurements. Bull. Eng. Geol. Environ. 2012, 71, 499–510. [Google Scholar] [CrossRef]
- Do, N.A.; Dias, D.; Oreste, P.; Djeran-Maigre, I. Three-dimensional numerical simulation of a mechanized twin tunnels in soft ground. Tunn. Undergr. Space Technol. 2014, 42, 40–51. [Google Scholar] [CrossRef]
- Wu, B.; Luo, Y.C.; Zang, J.B. Thermal Behavior of Tunnel Segment Joints Exposed to Fire and Strengthening of Fire-damaged Joints with Concrete-filled Steel Tubes. Appl. Sci. 2019, 9, 1781. [Google Scholar] [CrossRef] [Green Version]
- Zhao, C.; Lavasan, A.A.; Barciaga, T.; Kämper, C.; Mark, P.; Schanz, T. Prediction of tunnel lining forces and deformations using analytical and numerical solutions. Tunn. Undergr. Space Technol. 2017, 64, 164–176. [Google Scholar] [CrossRef]
- Wang, L.Z.; Sun, L.W.; Wang, Z.; Zhang, J. Field monitoring of a subsea shield tunnel during standpipe lifting. Tunn. Undergr. Space Technol. 2015, 45, 52–62. [Google Scholar] [CrossRef]
- Yang, F.; Cao, S.R.; Qin, G. Mechanical behavior of two kinds of prestressed composite linings: A case study of the Yellow River Crossing Tunnel in China. Tunn. Undergr. Space Technol. 2018, 79, 96–109. [Google Scholar] [CrossRef]
- Yu, H.T.; Cai, C.; Bobet, A.; Zhao, X.; Yuan, Y. Analytical solution for longitudinal bending stiffness of shield tunnels. Tunn. Undergr. Space Technol. 2019, 83, 27–34. [Google Scholar] [CrossRef]
- Afifipour, M.; Sharifzadeh, M.; Shahriar, K.; Jamshidi, H. Interaction of twin tunnels and shallow foundation at Zand underpass, Shiraz metro, Iran. Tunn. Undergr. Space Technol. 2011, 26, 356–363. [Google Scholar] [CrossRef]
- Nematollahi, M.; Dias, D. Three-dimensional numerical simulation of pile-twin tunnels interaction–Case of the Shiraz subway line. Tunn. Undergr. Space Technol. 2019, 86, 75–88. [Google Scholar] [CrossRef]
- Enieb, M.; Khalil, A.A.; Ahmed, A.S. Twin tunnel configuration for Greater Cairo metro line No. 4. Comput. Geotech. 2015, 68, 66–77. [Google Scholar]
- Tai, Q.M.; Zhang, D.L.; Fang, Q.; Sun, Y.; Yu, F.C.; Meng, M. Analysis of ground surface deformation induced by excavation of crossing metro tunnels in urban underground. Chin. J. Rock Mech. Eng. 2014, 33, 2472–2480. [Google Scholar]
- Mollon, G.; Dias, D.; Soubra, A.H. Probabilistic analyses of tunneling-induced ground movements. Acta Geotech. 2013, 8, 181–199. [Google Scholar] [CrossRef] [Green Version]
- Do, N.A.; Dias, D.; Oreste, P.; Djeran-Maigre, I. Three-dimensional numerical simulation for mechanized tunnelling in soft ground: The influence of the joint pattern. Acta Geotech. 2014, 9, 673–694. [Google Scholar] [CrossRef]
- Zhao, C.Y.; Lavasan, A.A.; Barciaga, T.; Zarev, V.; Datcheva, M.; Schanz, T. Model validation and calibration via back analysis for mechanized tunnel simulations–The Western Scheldt tunnel case. Comput. Geotech. 2015, 69, 601–614. [Google Scholar] [CrossRef]
- Lambrughi, A.; Rodríguez, L.M.; Castellanza, R. Development and validation of a 3D numerical model for TBM-EPB mechanised excavations. Comput. Geotech. 2012, 40, 97–113. [Google Scholar] [CrossRef]
- Zheng, G.; Lu, P.; Diao, Y. Advance speed-based parametric study of greenfield deformation induced by EPBM tunneling in soft ground. Comput. Geotech. 2015, 65, 220–232. [Google Scholar] [CrossRef]
- Kasper, T.; Meschke, G. A 3D finite element simulation model for TBM tunnelling in soft ground. Int. J. Numer. Anal. Methods Geomech. 2004, 28, 1441–1460. [Google Scholar] [CrossRef]
- Chen, J.; Sugimoto, M. Analysis on shield operational parameters to steer articulated shield. Jpn. Geotech. Soc. Spec. Publ. 2016, 2, 1497–1500. [Google Scholar]
- Lo, K.Y.; Rowe, R.K. Predicting settlement due to tunnelling in clays. In Tunnelling in Soil and Rock; ASCE: Reston, VA, USA, 1984; pp. 46–76. [Google Scholar]
- Sigl, O.; Atzl, G. Design of bored tunnel linings for Singapore MRT North East Line C706. Tunn. Undergr. Space Technol. 1999, 14, 481–490. [Google Scholar] [CrossRef]
- Zhang, M.J.; Li, S.H.; Li, P.F. Numerical analysis of ground displacement and segmental stress and influence of yaw excavation loadings for a curved shield tunnel. Comput. Geotech. 2020, 118, 103325. [Google Scholar] [CrossRef]
- Li, P.F.; Zou, H.H.; Wang, F.; Xiong, H.C. An analytical mechanism of limit support pressure on cutting face for deep tunnels in the sand. Comput. Geotech. 2020, 119, 103372. [Google Scholar] [CrossRef]
- Liu, C.; Zhang, Z.; Regueiro, R.A. Pile and pile group response to tunnelling using a large diameter slurry shield—Case study in Shanghai. Comput. Geotech. 2014, 59, 21–43. [Google Scholar] [CrossRef]
- Meschke, G. From advance exploration to real time steering of TBMs: A review on pertinent research in the Collaborative Research Center “Interaction Modeling in Mechanized Tunneling. Undergr. Space 2018, 3, 1–20. [Google Scholar] [CrossRef]
- Li, P.F.; Wang, F.; Zhang, C.P.; Li, Z. Face stability analysis of a shallow tunnel in the saturated and multilayered soils in short-term condition. Comput. Geotech. 2019, 107, 25–35. [Google Scholar] [CrossRef]
- Kavvadas, M.; Litsas, D.; Vazaios, I.; Fortsakis, P. Development of a 3D finite element model for shield EPB tunnelling. Tunn. Undergr. Space Technol. 2017, 65, 22–34. [Google Scholar] [CrossRef]
- Zhu, J.F.; Xu, R.Q.; Liu, G.B. Analytical prediction for tunnelling-induced ground movements in sands considering disturbance. Tunn. Undergr. Space Technol. 2014, 41, 165–175. [Google Scholar] [CrossRef]
- Ninić, J.; Meschke, G. Simulation based evaluation of time-variant loadings acting on tunnel linings during mechanized tunnel construction. Eng. Struct. 2017, 135, 21–40. [Google Scholar] [CrossRef]
- Suwansawat, S.; Einstein, H.H. Describing settlement troughs over twin tunnels using a superposition technique. J. Geotech. Geoenvironmental Eng. 2007, 133, 445–468. [Google Scholar] [CrossRef]
- Chapman, D.N.; Ahn, S.K.; Hunt, D.V.L. Investigating ground movements caused by the construction of multiple tunnels in soft ground using laboratory model tests. Can. Geotech. J. 2007, 44, 631–643. [Google Scholar] [CrossRef]
- Liu, X.; Fang, Q.; Zhang, D.L.; Liu, Y. Energy-based prediction of volume loss ratio and plastic zone dimension of shallow tunnelling. Comput. Geotech. 2019, 118, 103343. [Google Scholar] [CrossRef]
- Ninić, J.; Freitag, S.; Meschke, G. A hybrid finite element and surrogate modelling approach for simulation and monitoring supported TBM steering. Tunn. Undergr. Space Technol. 2017, 63, 12–28. [Google Scholar] [CrossRef] [Green Version]
- Li, P.F.; Zhou, X.J. Mechanical behavior and shape optimization of lining structure for subsea tunnel excavated in weathered slot. China Ocean. Eng. 2015, 29, 875–890. [Google Scholar] [CrossRef]
Figure 1.
(a) Plan view of the project site; (b) Geological profile of Cross-section B.

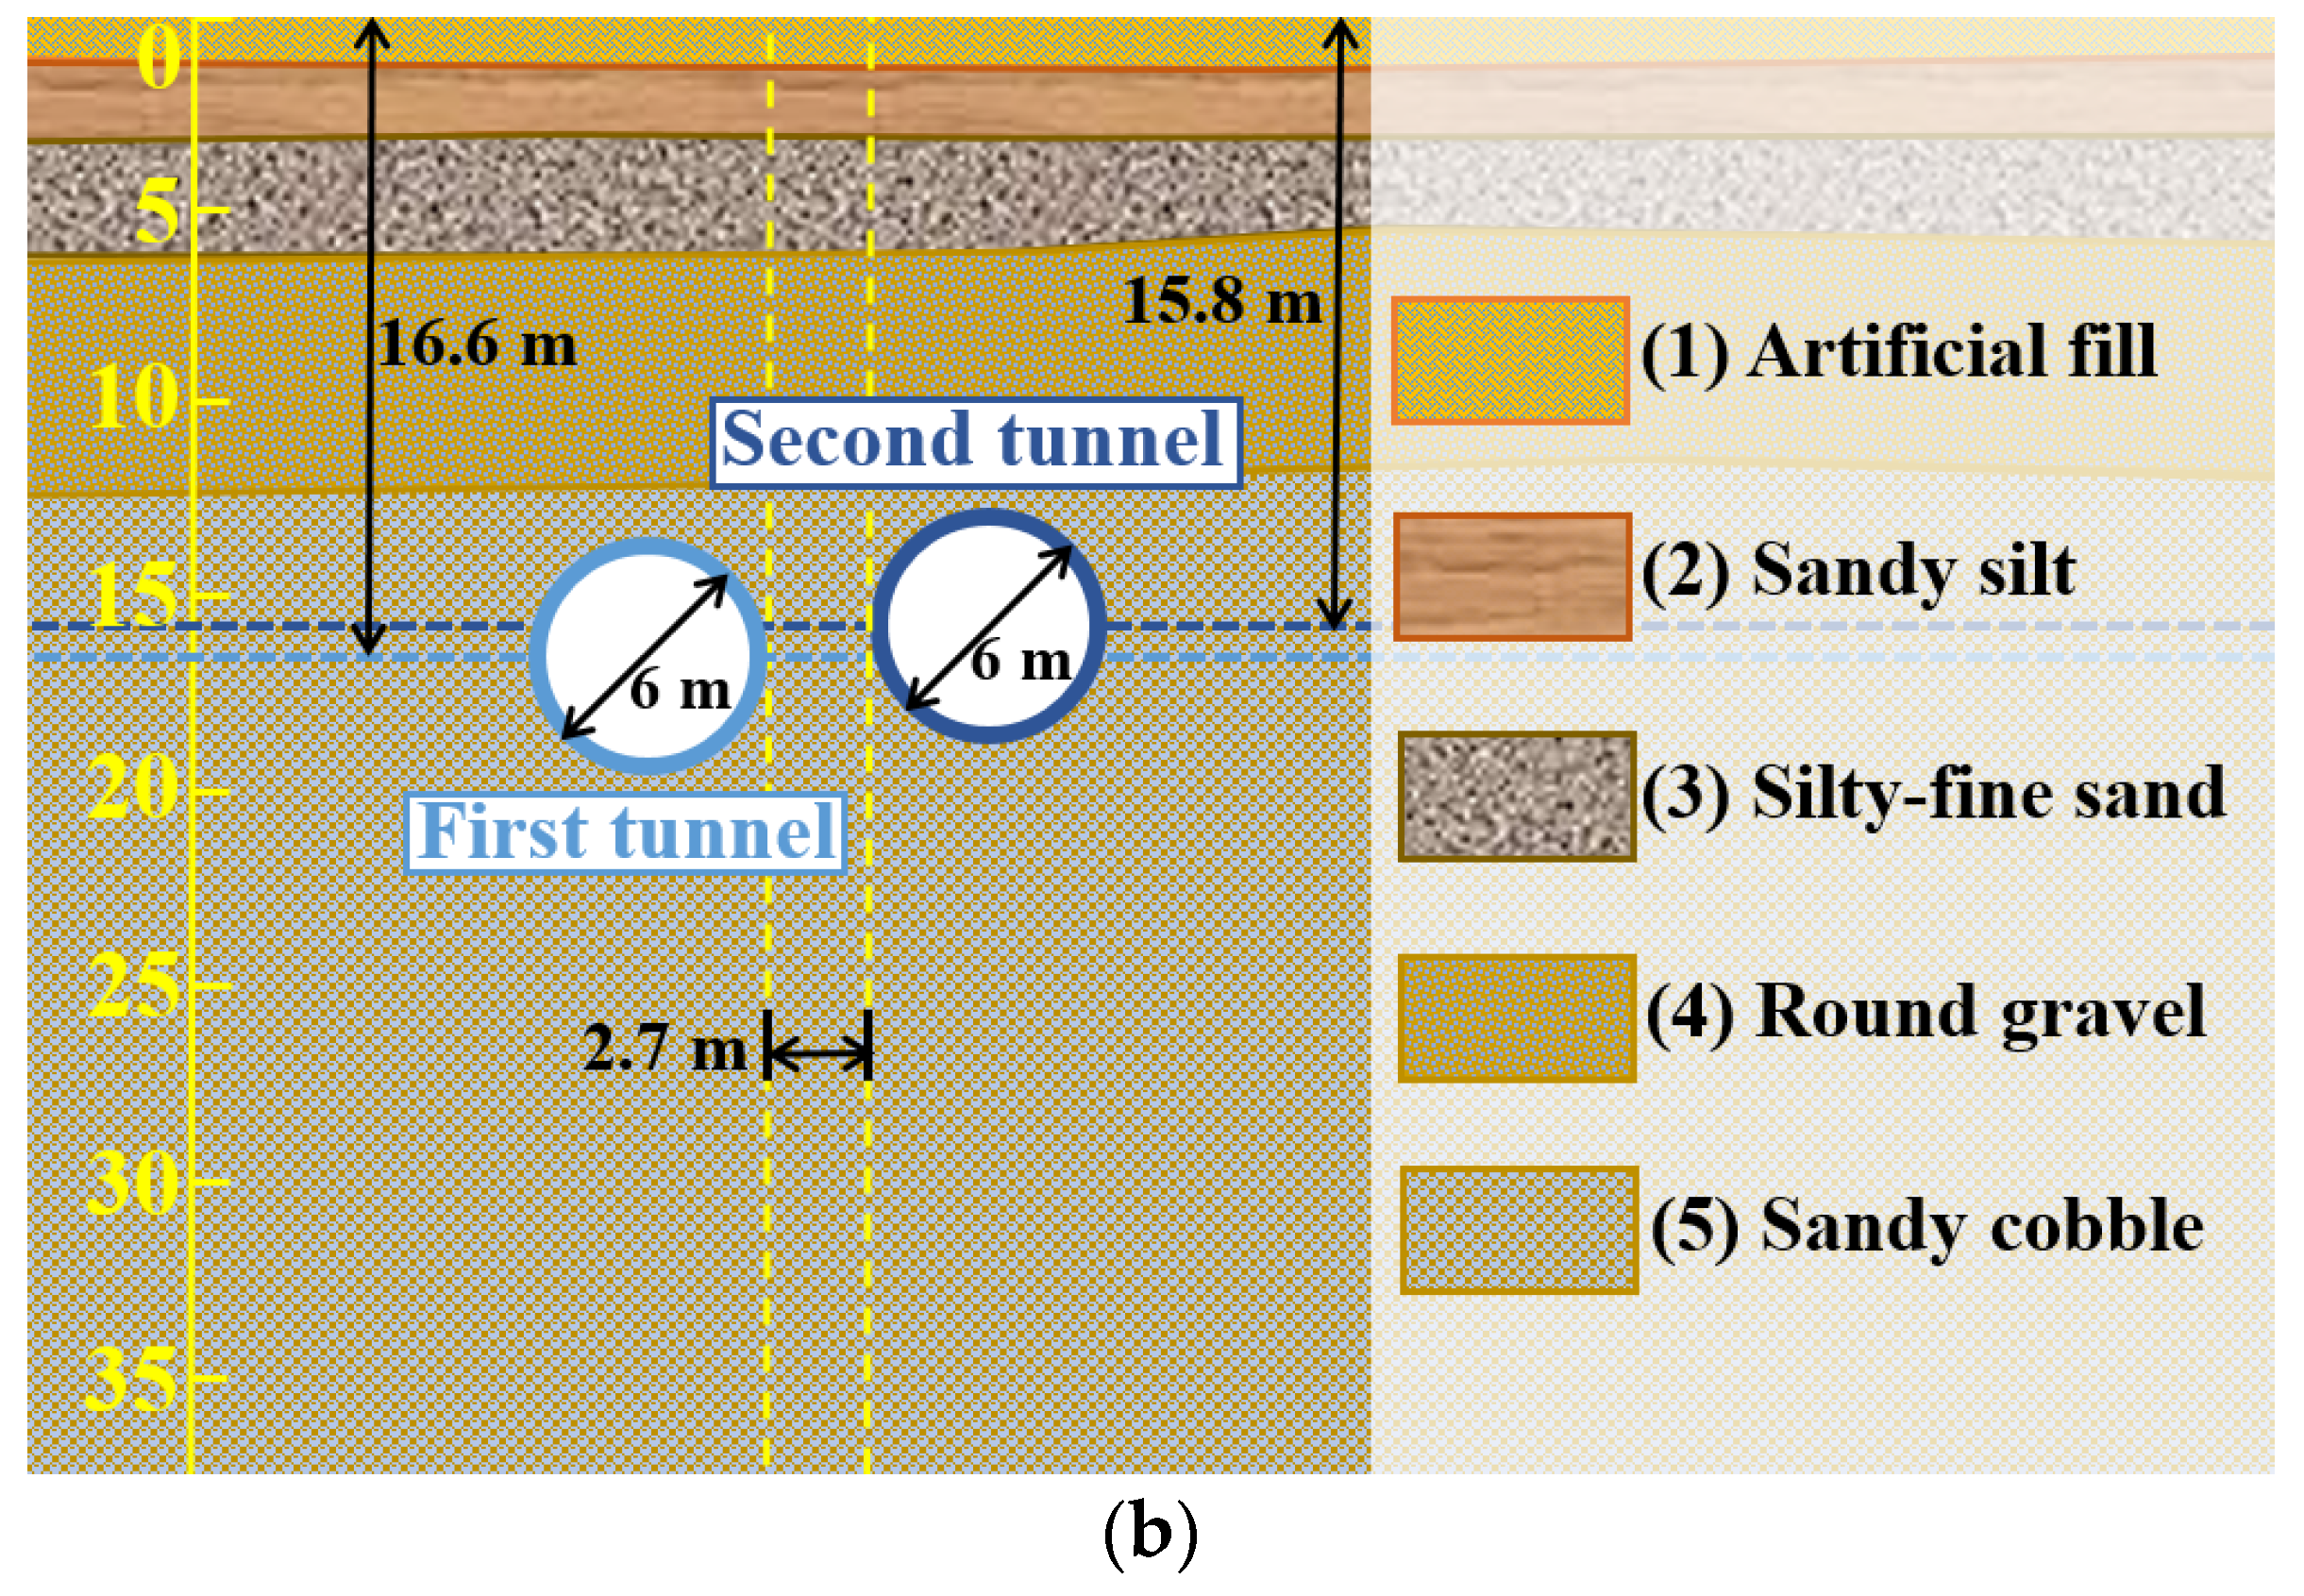
Figure 2.
Layout of the on-site monitoring strain gauges. (a) Abridged general view; (b) Zoom view.
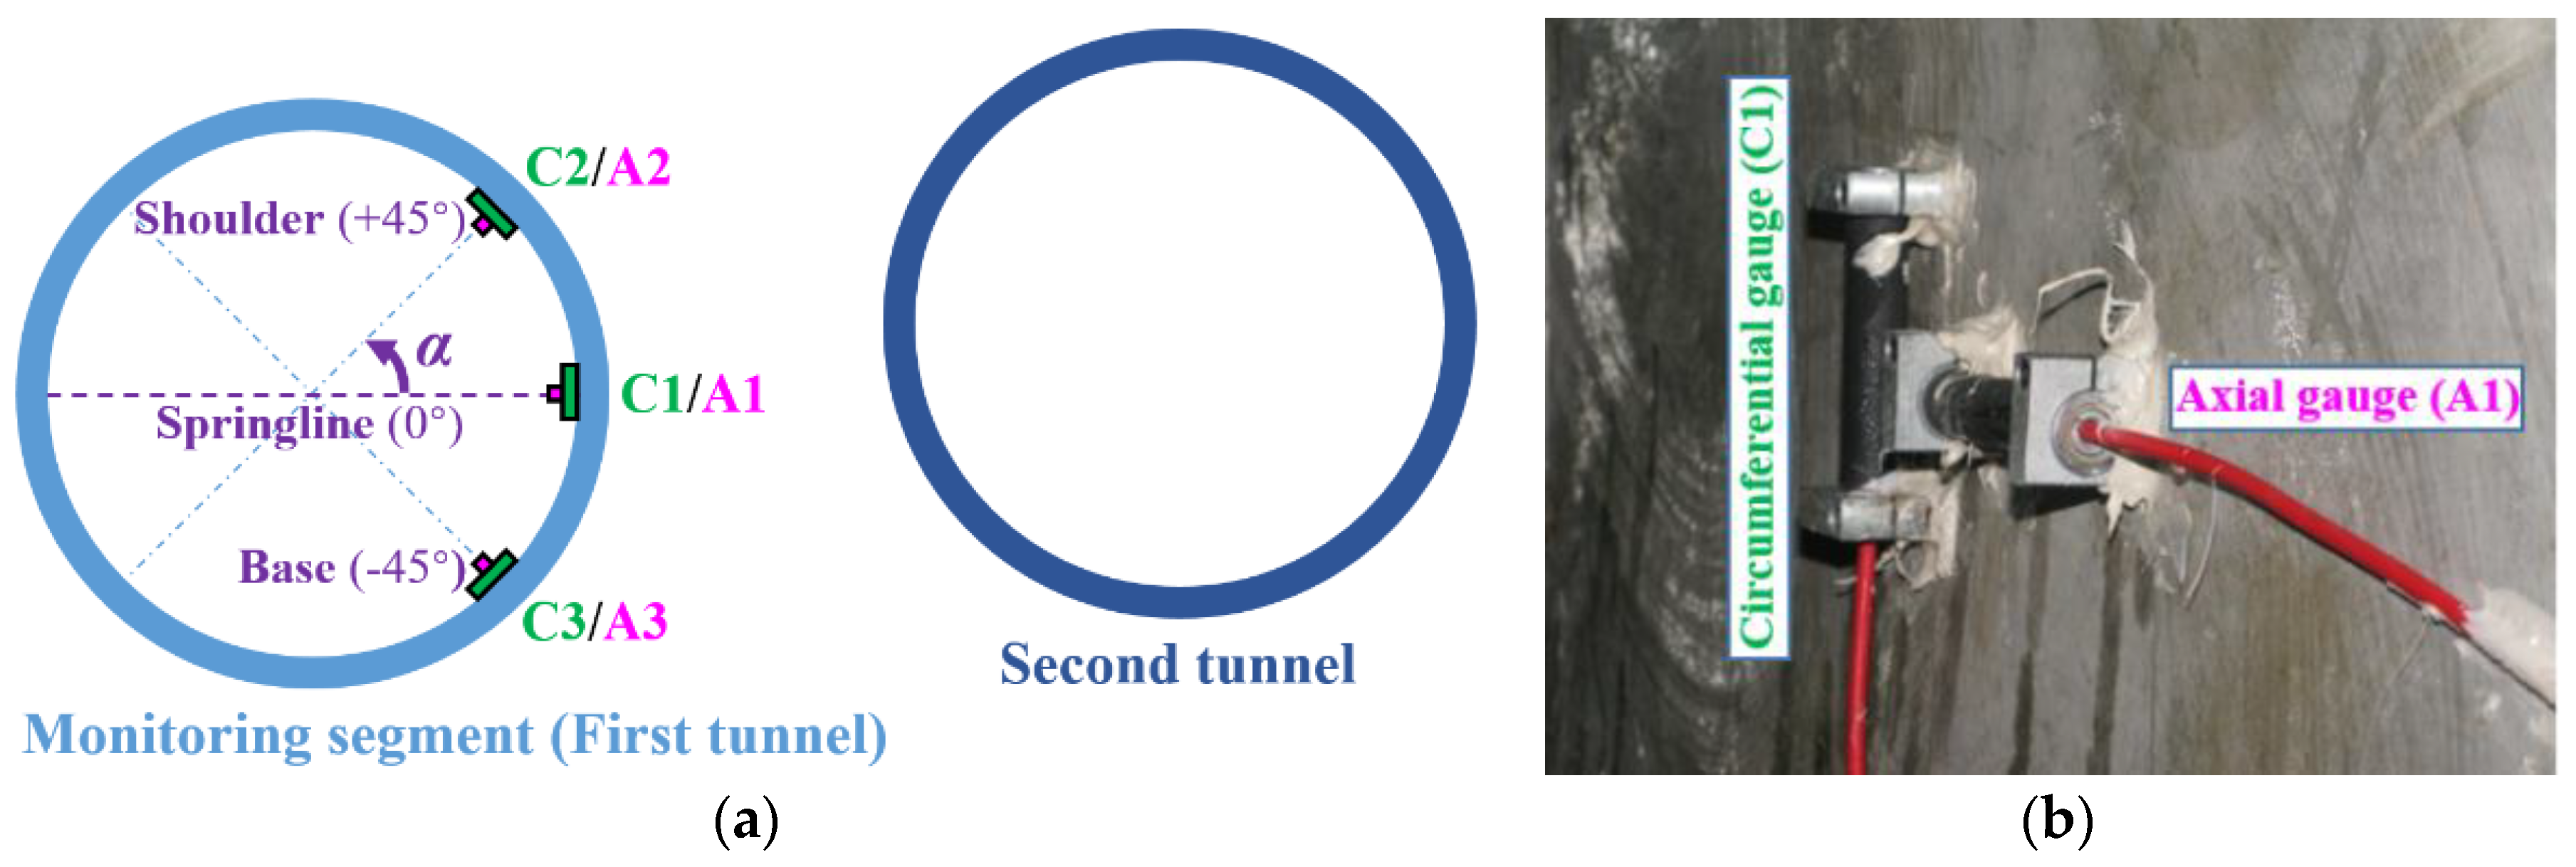
Figure 3.
Finite element model. (a) Perspective view; (b) Plan view; (c) Lateral view of Cross-section B.
Figure 3.
Finite element model. (a) Perspective view; (b) Plan view; (c) Lateral view of Cross-section B.
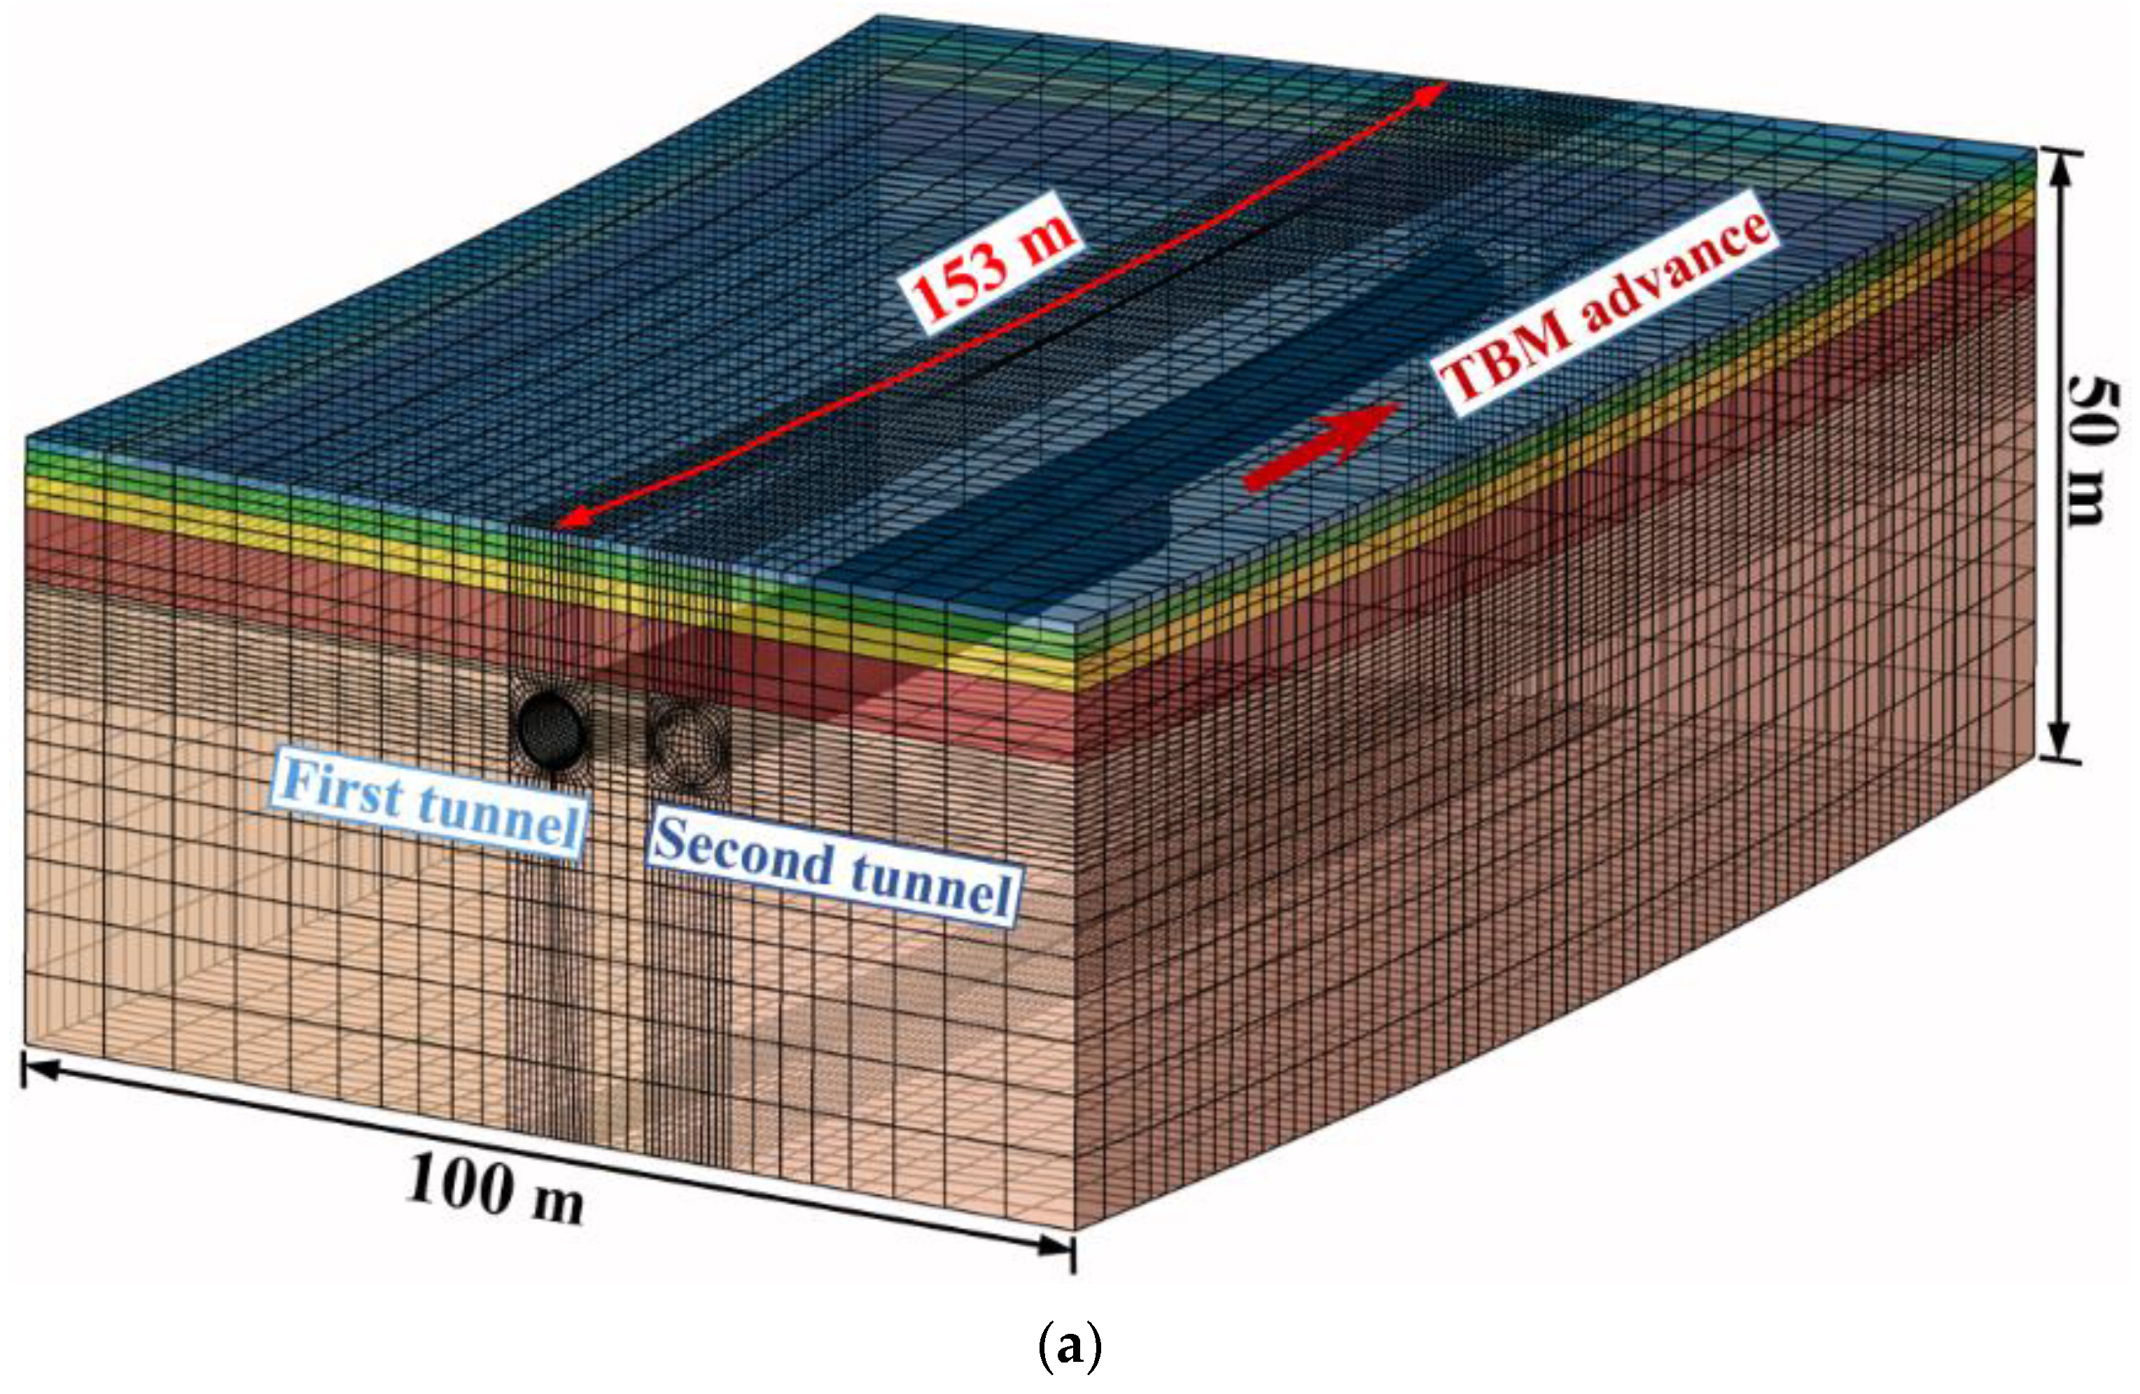
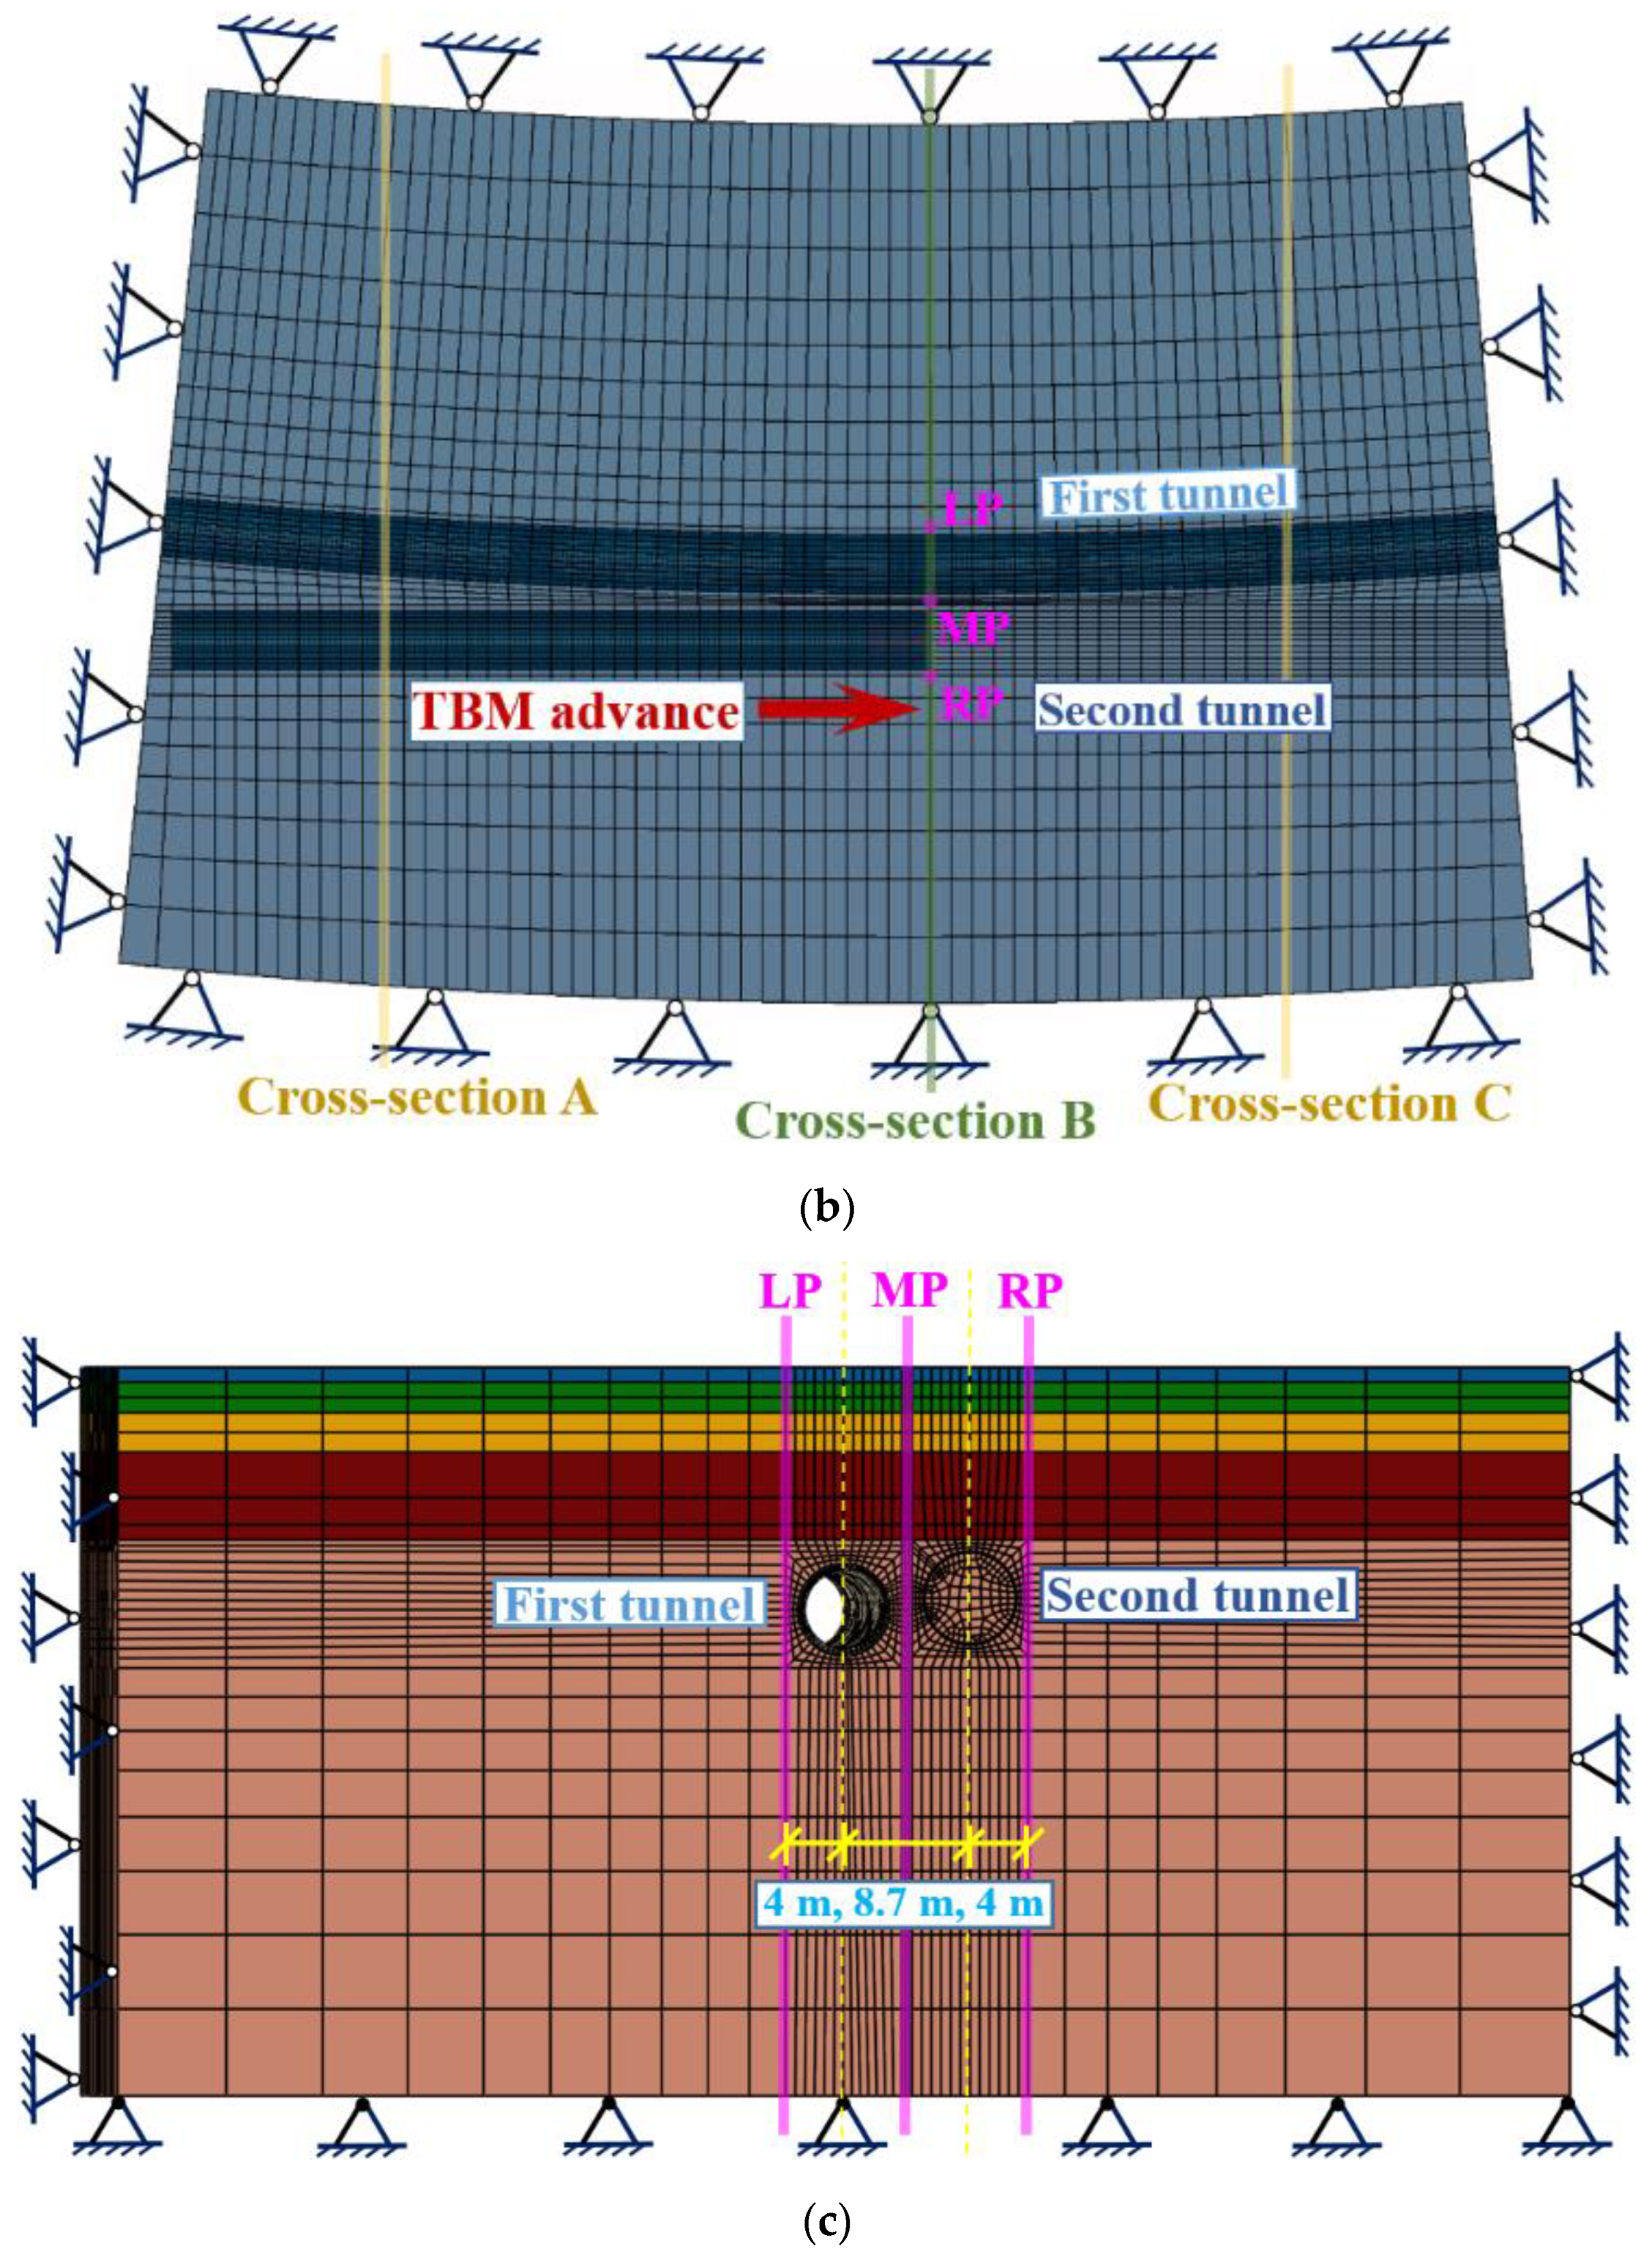
Figure 4.
Illustrated simulation of the TBM progressive advancement.

Figure 5.
Over-excavation of a curved tunnel.
Figure 6.
Ground surface settlements at measured Cross-section B during the approaching excavation.
Figure 7.
Horizontal ground displacements along the MP axis during the approaching excavation.
Figure 8.
Horizontal ground displacements along the LP and RP axes during the approaching excavation.
Figure 8.
Horizontal ground displacements along the LP and RP axes during the approaching excavation.
Figure 9.
Internal forces in the measured segment along the periphery during the approaching excavation: (a) normal force; and (b) bending moment.
Figure 9.
Internal forces in the measured segment along the periphery during the approaching excavation: (a) normal force; and (b) bending moment.
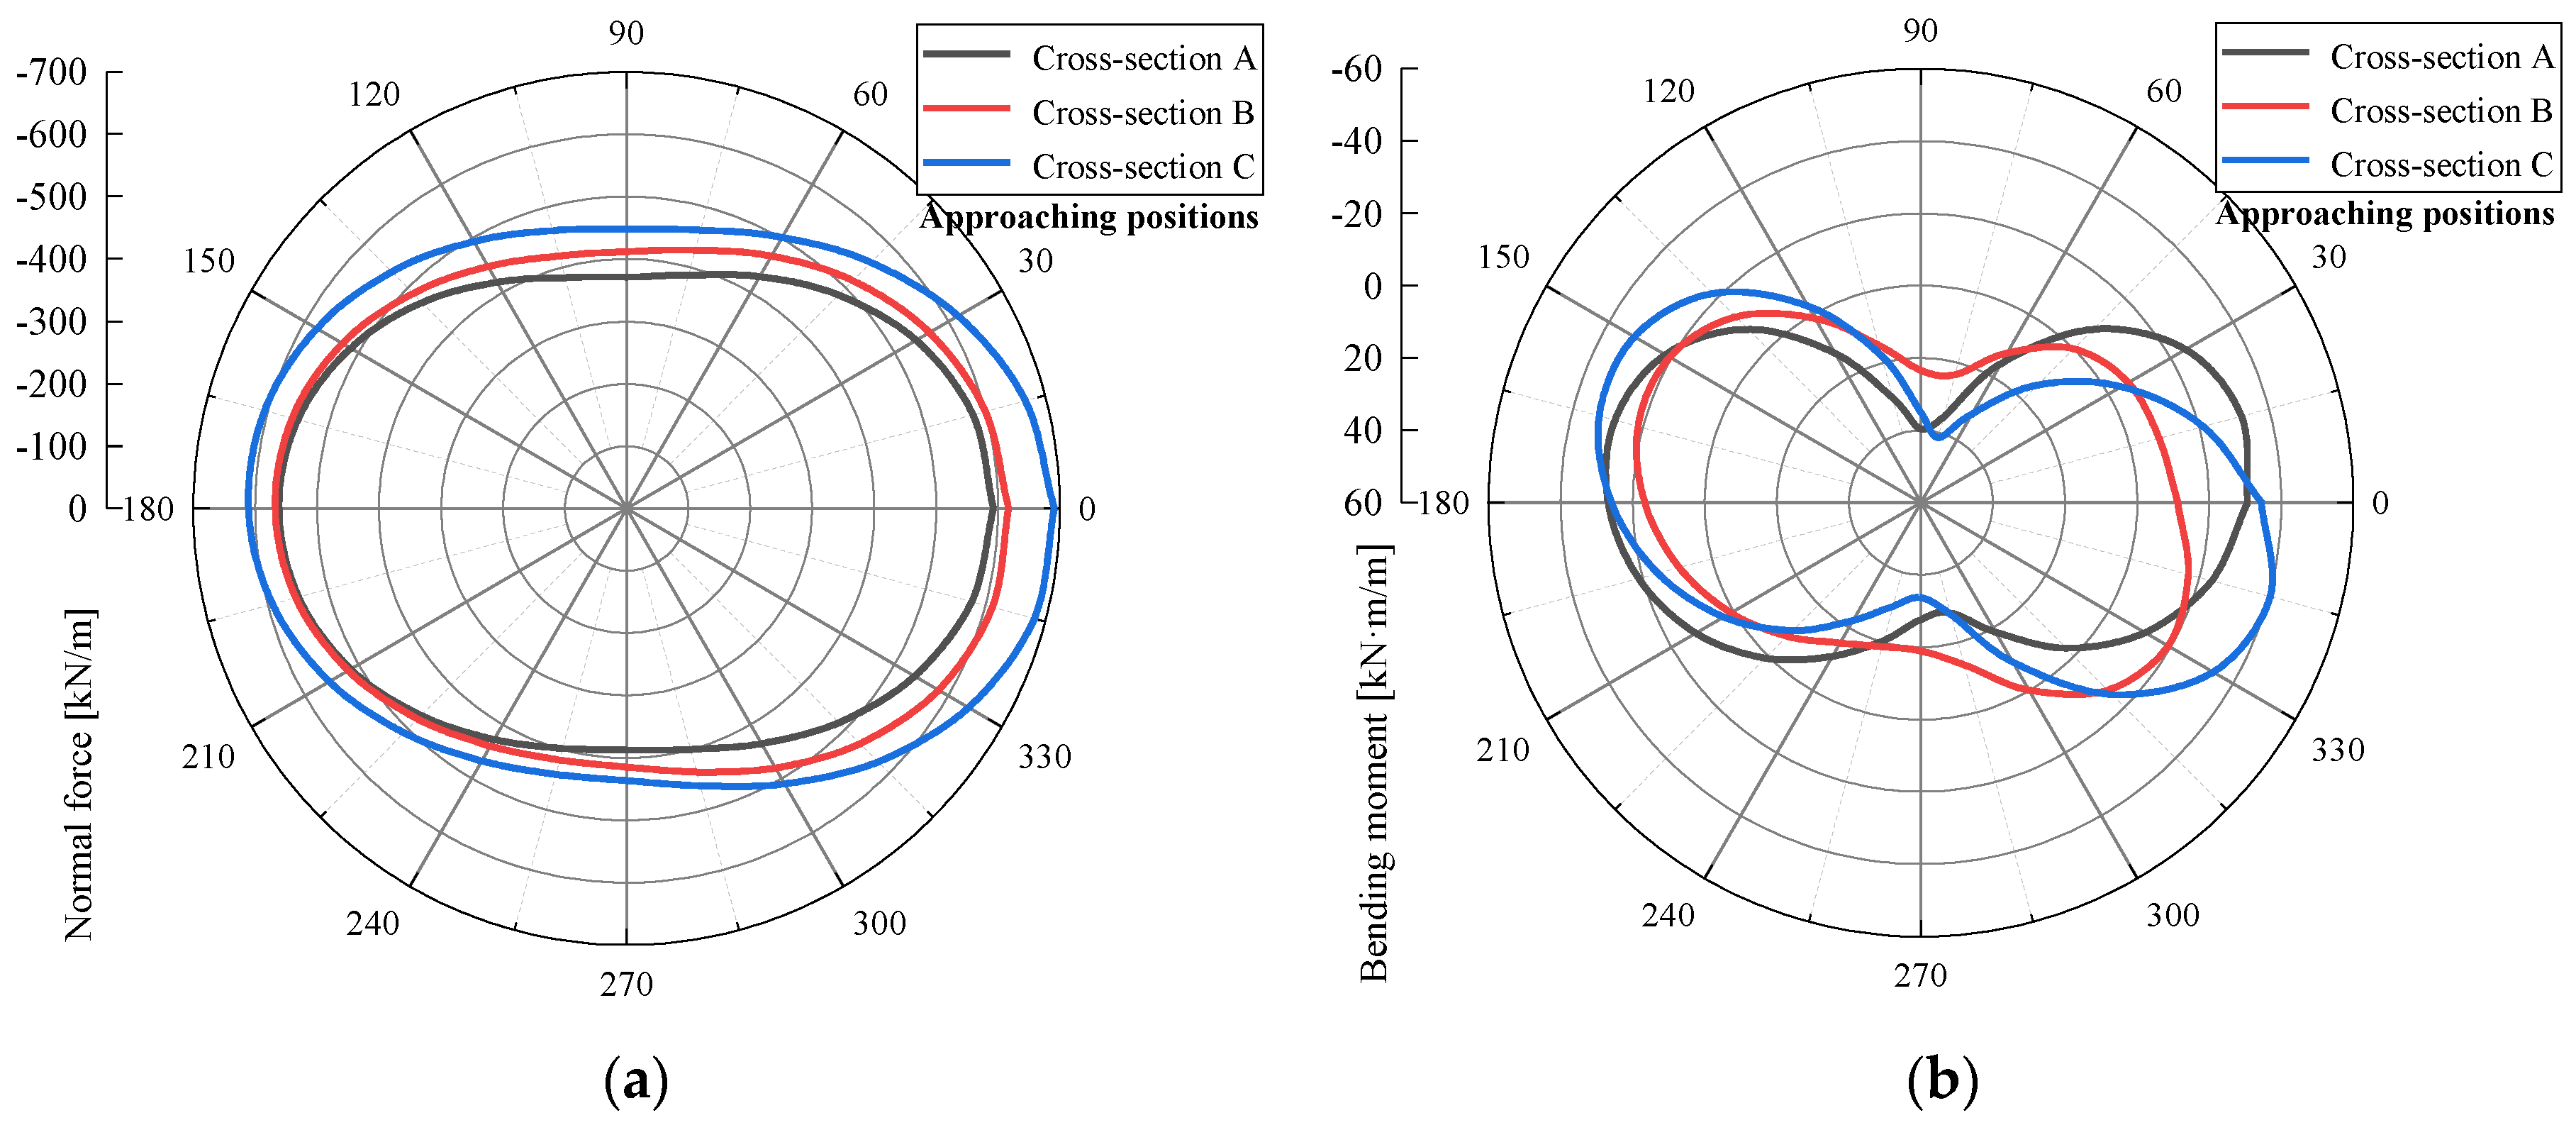
Figure 10.
Circumferential strain and deformation of the measured segment when the excavation face of second tunnel approaches: (a) Cross-section A; (b) Cross-section B; and (c) Cross-section C.
Figure 10.
Circumferential strain and deformation of the measured segment when the excavation face of second tunnel approaches: (a) Cross-section A; (b) Cross-section B; and (c) Cross-section C.
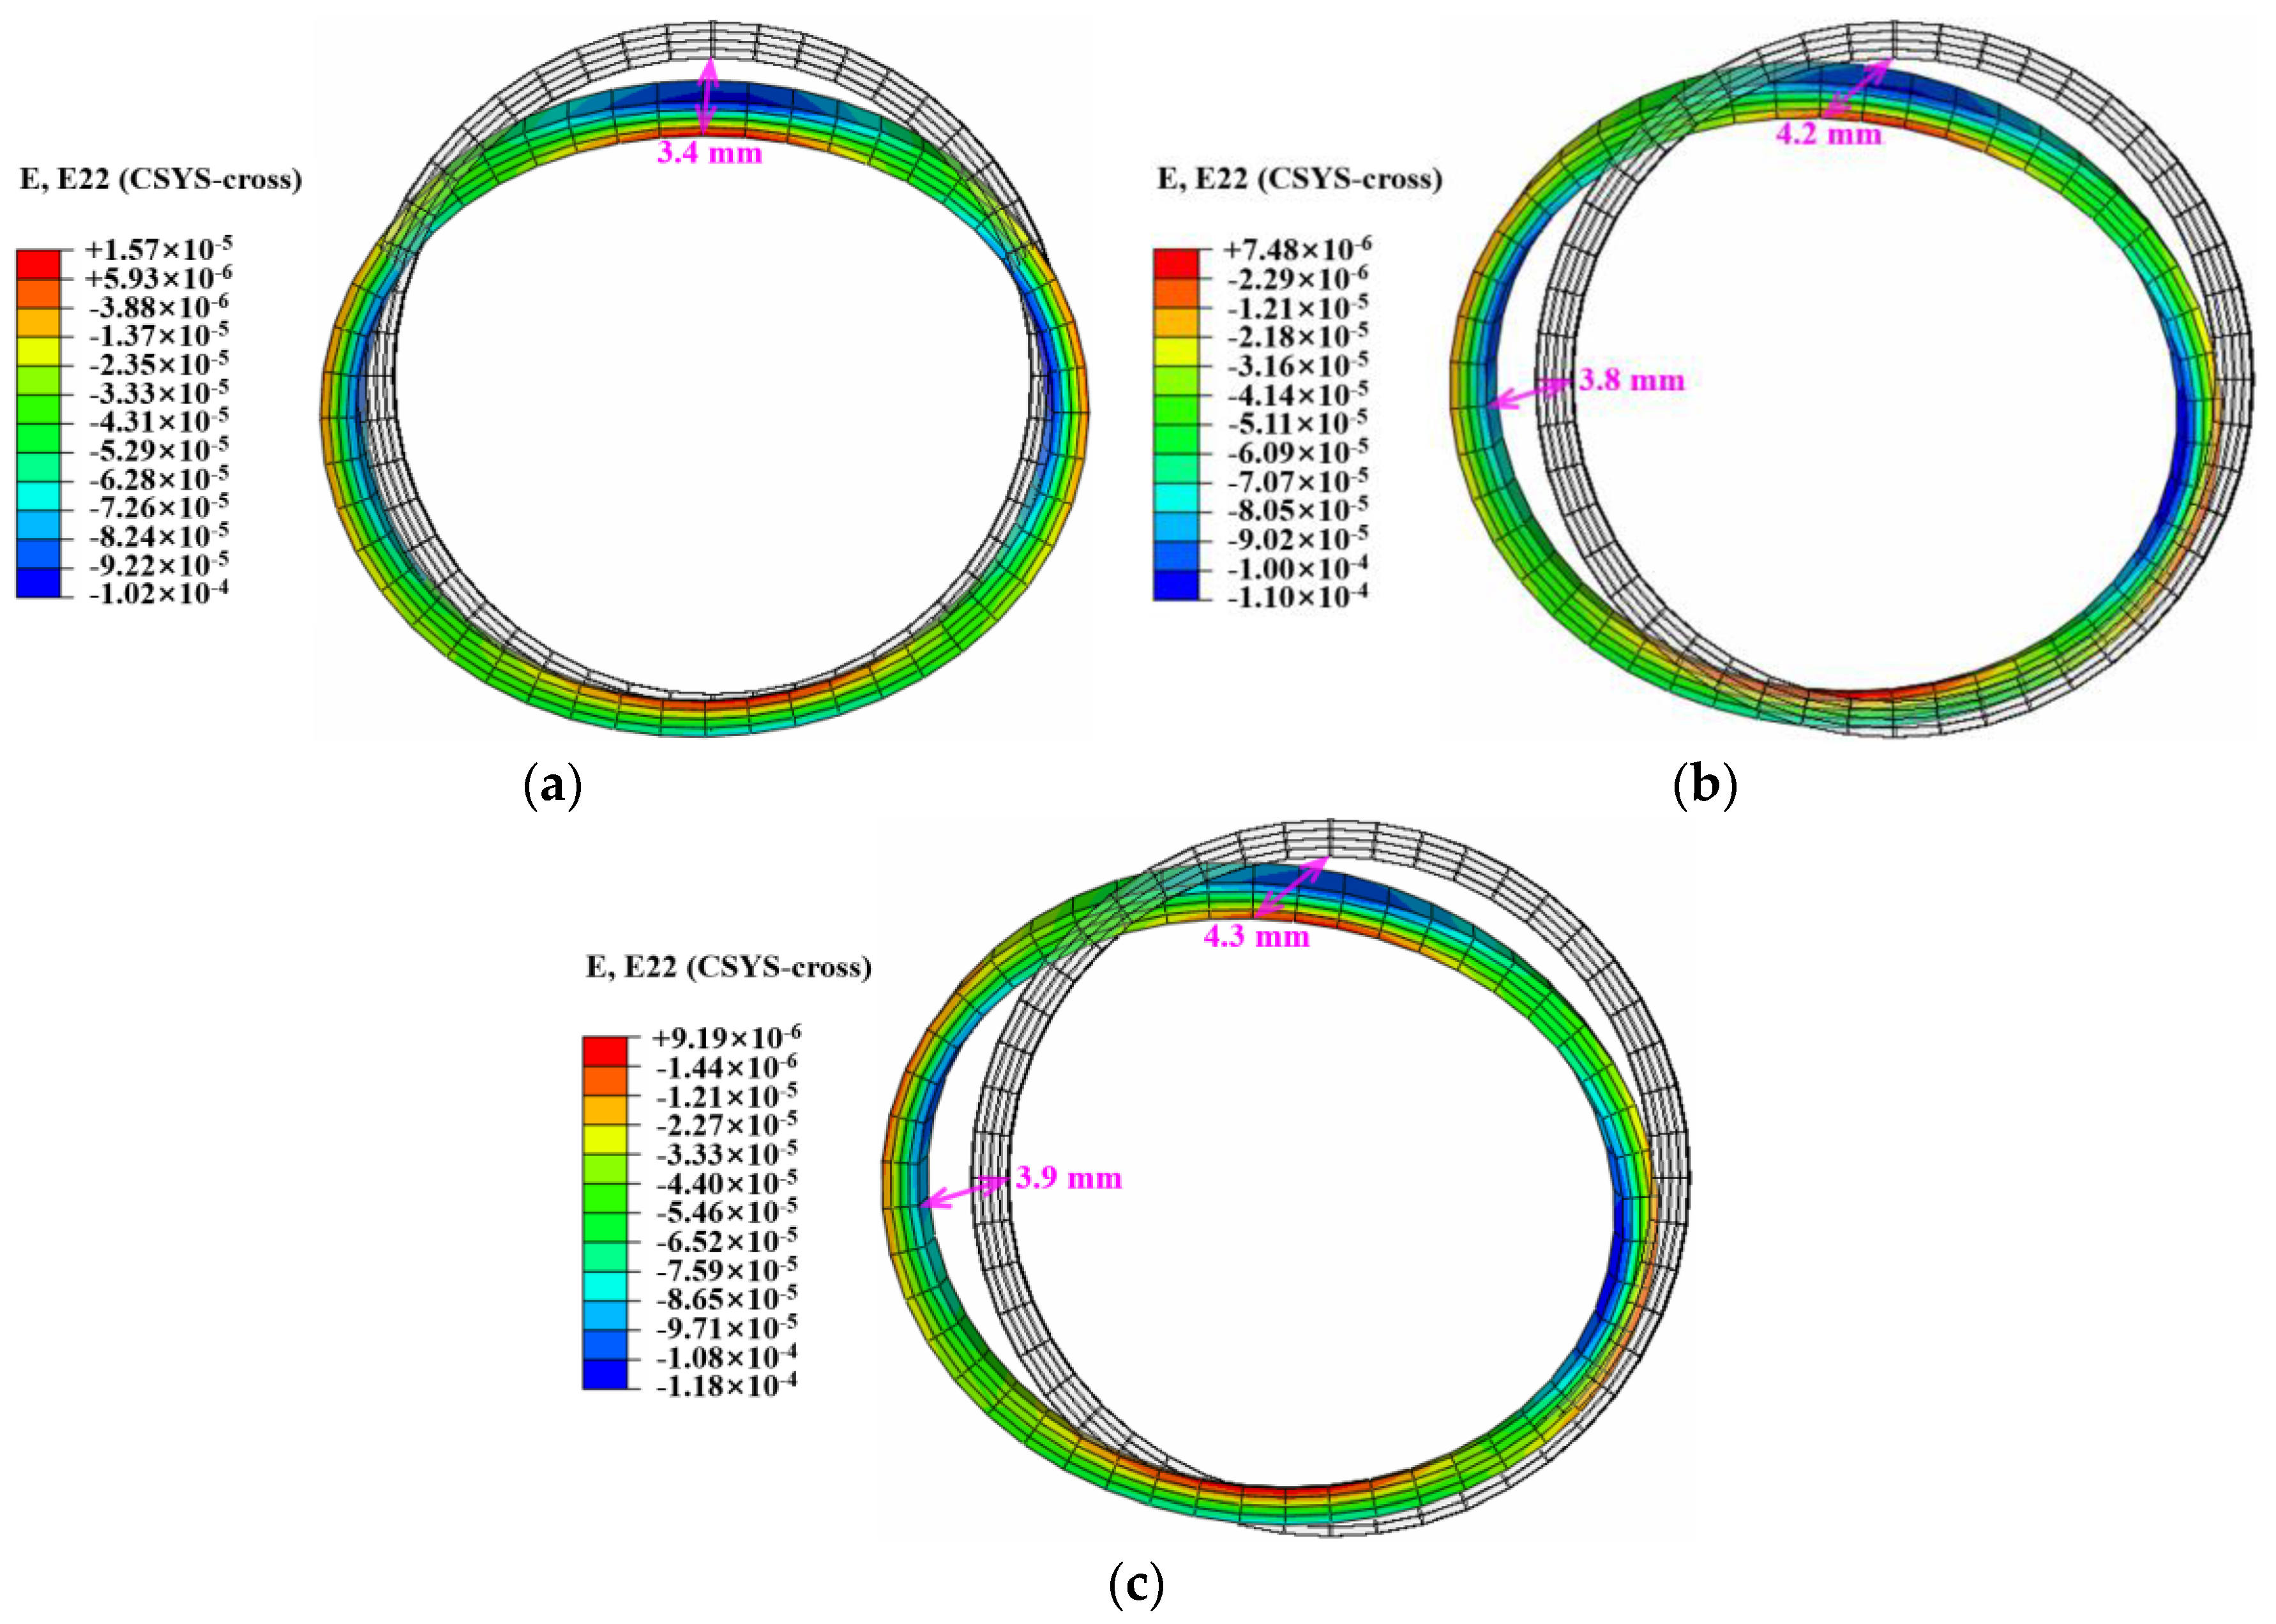
Figure 11.
Variations of the longitudinal deformations in the measured segment during the approaching excavation.
Figure 11.
Variations of the longitudinal deformations in the measured segment during the approaching excavation.
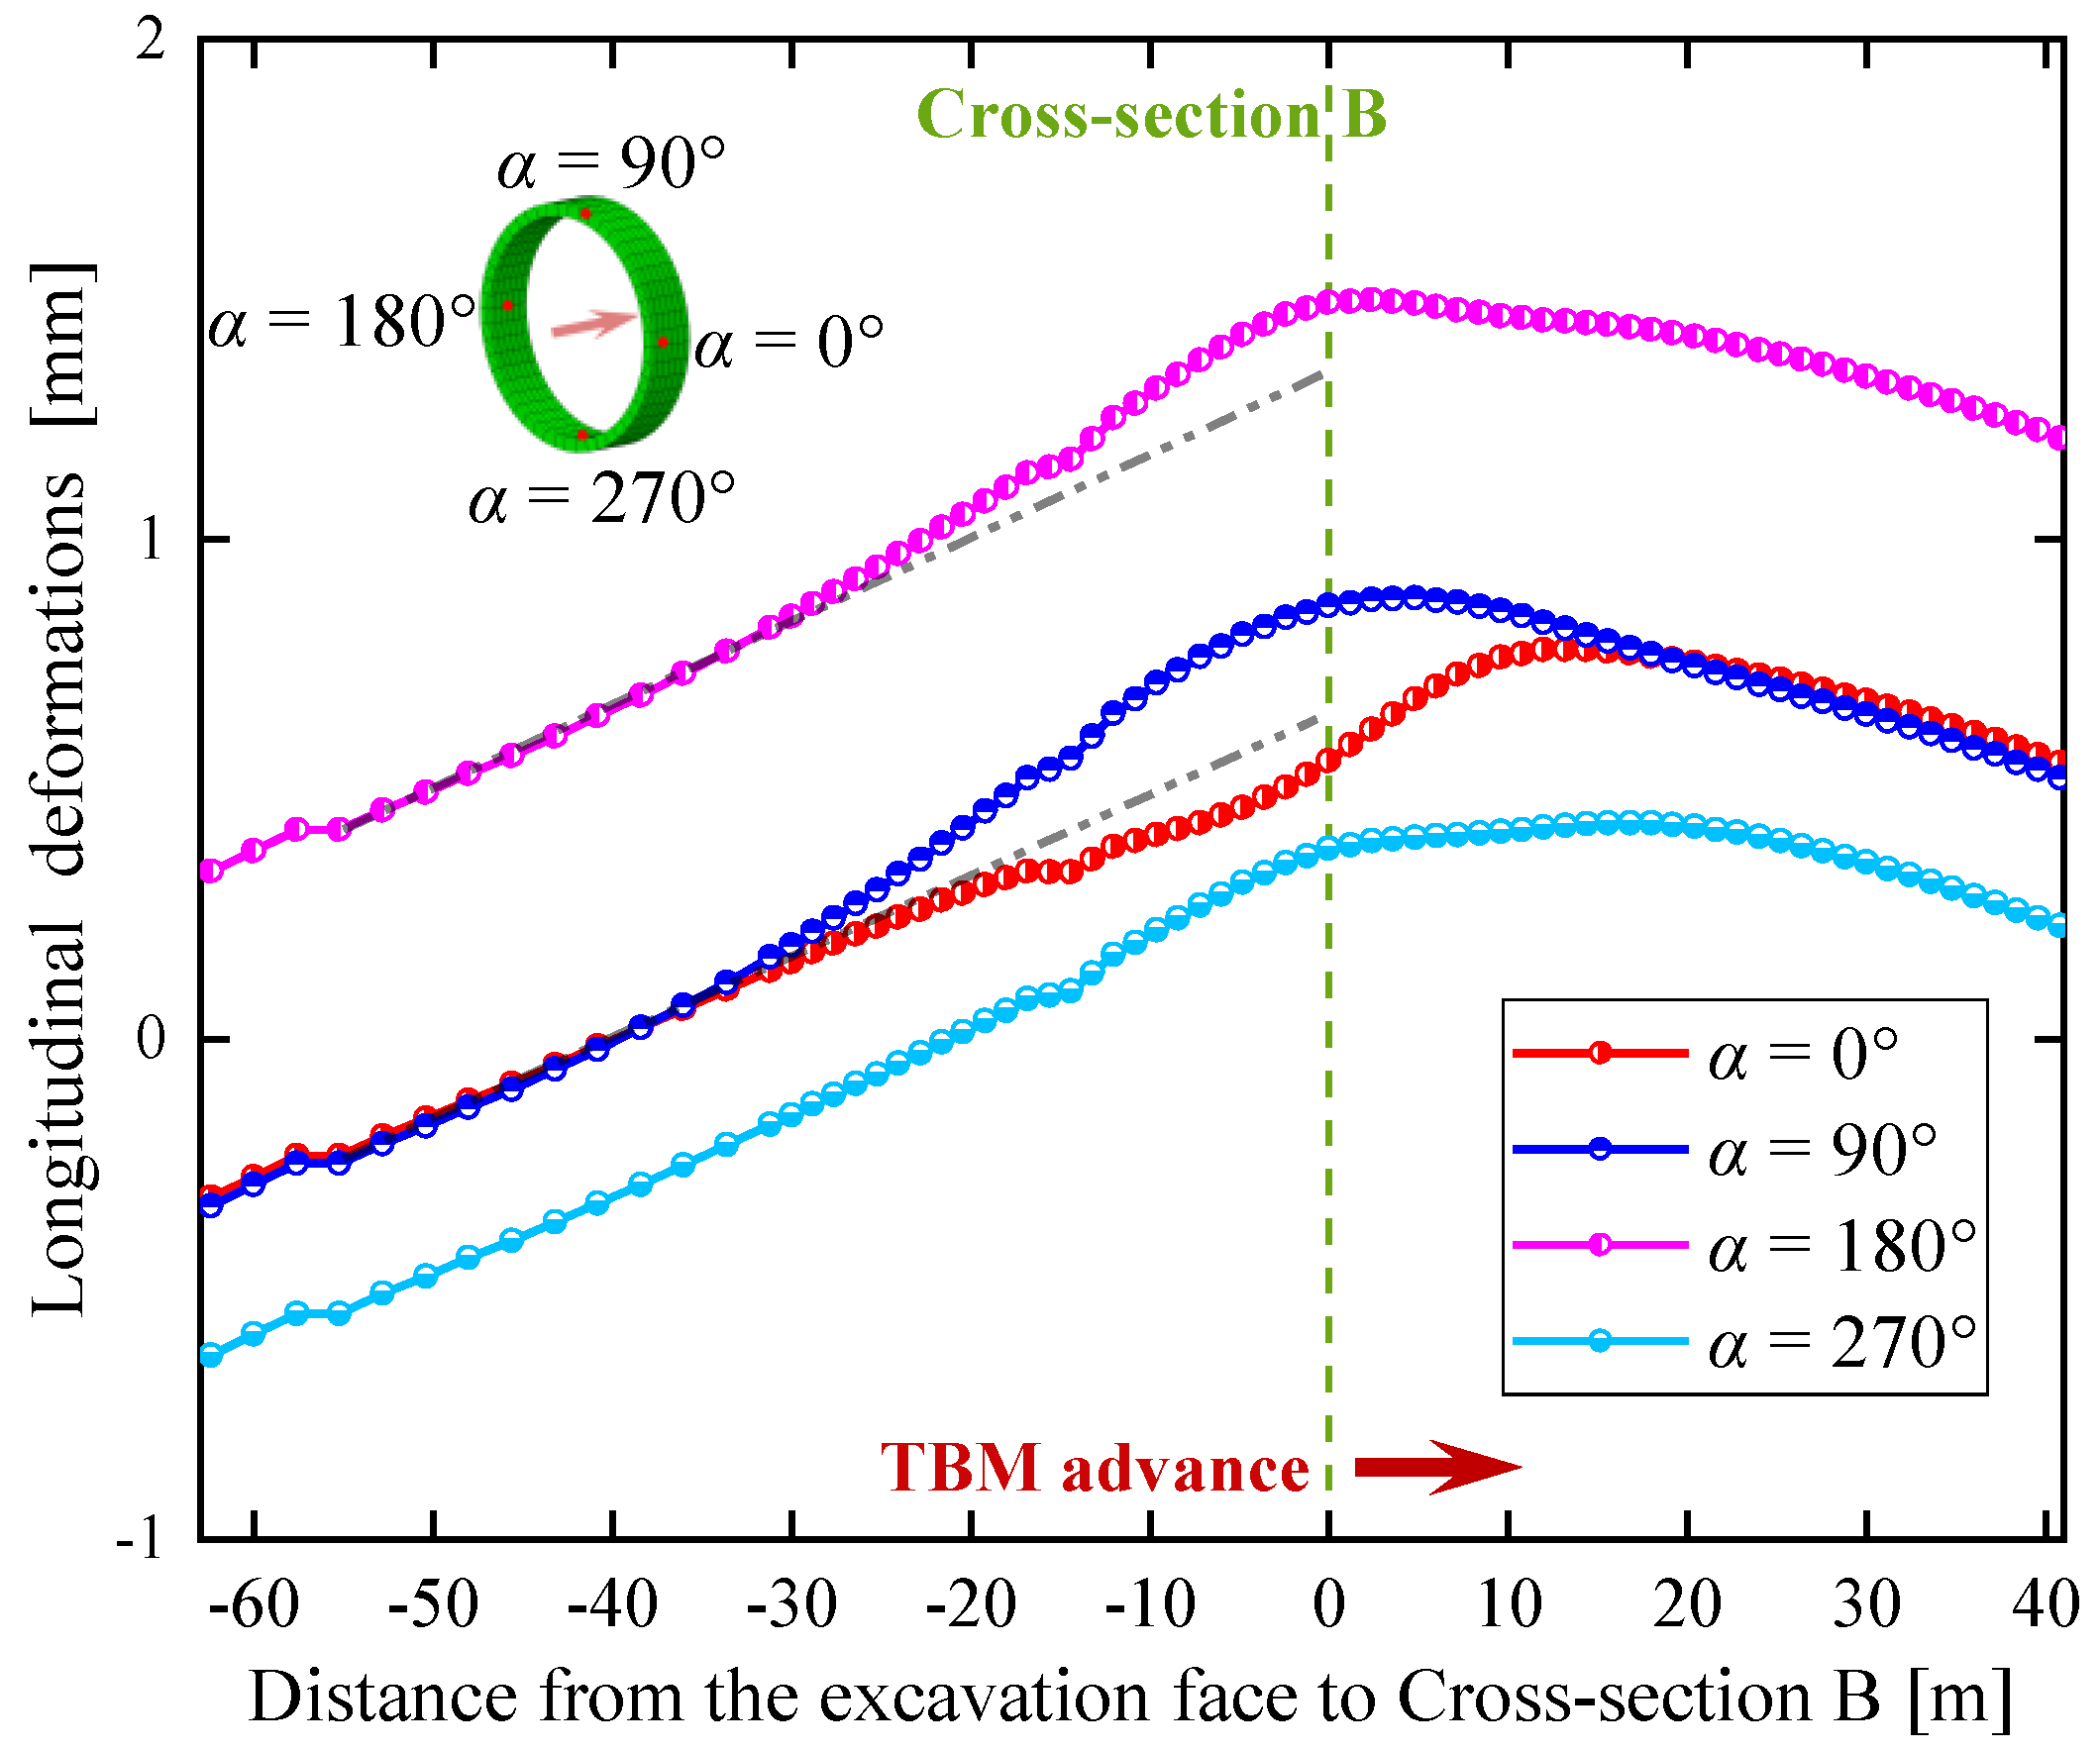
Figure 12.
Numerical results of (a) circumferential strain increments and (b) axial strain increments.
Figure 12.
Numerical results of (a) circumferential strain increments and (b) axial strain increments.

Figure 13.
Variations of strain increments in the measured segment during the approaching excavation: (a) circumferential strain increments; and (b) axial strain increments.
Figure 13.
Variations of strain increments in the measured segment during the approaching excavation: (a) circumferential strain increments; and (b) axial strain increments.

Figure 14.
Comparisons of ground displacements in two construction cases: (a) ground surface settlement; and (b) horizontal ground displacement.
Figure 14.
Comparisons of ground displacements in two construction cases: (a) ground surface settlement; and (b) horizontal ground displacement.

Figure 15.
Comparisons of internal forces in the measured segment of the first tunnel: (a) normal force; and (b) bending moment.
Figure 15.
Comparisons of internal forces in the measured segment of the first tunnel: (a) normal force; and (b) bending moment.

Figure 16.
Comparisons of safety factors.


Table 1.
Soil properties.
| Type of Soil | Thickness (m) | Young’s Modulus (MPa) | Poisson Ratio | Cohesion (kPa) | Density (kN/m3) | Friction Angle (°) |
|---|---|---|---|---|---|---|
| Artificial fill | 1 | 18.5 | 0.25 | 16 | 16.5 | 12.2 |
| Sandy silt | 2.1 | 26 | 0.22 | 28 | 19.5 | 24.1 |
| Silty-fine sand | 2.7 | 35 | 0.26 | 0.2 | 20 | 26.8 |
| Round gravel | 6 | 45 | 0.3 | 0.3 | 20.5 | 35 |
| Sandy cobble | 38.2 | 130 | 0.18 | 0 | 21.5 | 40 |
Table 2.
Parameters for the TBM shield and segment.
| External Diameter (m) | Thickness (cm) | Length/Width (m) | Density (kN/m3) | Elastic Modulus (GPa) | Poisson Ratio | |
|---|---|---|---|---|---|---|
| Shield | 6.28 | 5.5 | 8 | 78 | 235 | 0.2 |
| Segment | 6 | 30 | 1.2 | 25 | 34.5 | 0.2 |
© 2019 by the authors. Licensee MDPI, Basel, Switzerland. This article is an open access article distributed under the terms and conditions of the Creative Commons Attribution (CC BY) license (http://creativecommons.org/licenses/by/4.0/).
Share and Cite
MDPI and ACS Style
Li, S.; Li, P.; Zhang, M.; Liu, Y. Influence of Approaching Excavation on Adjacent Segments for Twin Tunnels. Appl. Sci. 2020, 10, 98. https://doi.org/10.3390/app10010098
AMA Style
Li S, Li P, Zhang M, Liu Y. Influence of Approaching Excavation on Adjacent Segments for Twin Tunnels. Applied Sciences. 2020; 10(1):98. https://doi.org/10.3390/app10010098
Chicago/Turabian StyleLi, Shaohua, Pengfei Li, Mingju Zhang, and Yi Liu. 2020. "Influence of Approaching Excavation on Adjacent Segments for Twin Tunnels" Applied Sciences 10, no. 1: 98. https://doi.org/10.3390/app10010098
Note that from the first issue of 2016, this journal uses article numbers instead of page numbers. See further details here.