Oligopolistic Competition among Providers in the Telecommunication Industry: The Case of Slovakia


1
Department of Economics, Faculty of Operation and Economics of Transport and Communications, University of Zilina, 010 26 Zilina, Slovakia
2
Department of Social-Human Sciences, Faculty of Social and Human Sciences, Spiru Haret University, 041916 Bucharest, Romania
*
Author to whom correspondence should be addressed.
Adm. Sci. 2019, 9(3), 49; https://doi.org/10.3390/admsci9030049
Submission received: 18 April 2019
/
Revised: 23 June 2019
/
Accepted: 24 June 2019
/
Published: 27 June 2019
Abstract
:The issue of the paper is devoted to the oligopolistic market structure, which is a popular form of imperfect competition occurring in the current market economies. The main aim of the paper is to quantify the selected oligopolistic structure of the telecom industry in the Slovak market in the period 2013–2017. We subjected the oligopoly to concentration analysis of the market to quantify and assess the competitive environment in which mobile providers are operating. Market concentration was measured while using specific indicators of market concentration CR2, CR3, the Herfindahl-Hirschman Index, Lorenz curve, Gini coefficient, and coefficient of variation, using the information on total revenues of operators, the share of mobile operators on total revenues, number of active customers, and the penetration of SIM cards. The calculated values of the selected market concentration indices in the telecom sector proved that the mobile operators market is highly concentrated. The services that are offered by operators are not identical, and they are differentiated based on price, quality, availability, or the target group of customers. We also identified the entry barriers, which can be categorized to strategic, economic, technical, and time barriers. The Slovak telecom sector is an oligopoly where competitors offer slightly differentiated products; however, the competitive environment in which they operate is highly concentrated and competition needs to be regulated to achieve the sustainable development of the telecommunication sector.
JEL Classification:
D43; L13; L961. Introduction
Oligopoly is one of the forms of imperfect competition. It is such a specific market structure where only a few large businesses, interacting with each other, competing, and concentrating a proportion of the market in their hands (Gregova 2009). The principles and conditions of the oligopoly structure are based on the same preconditions; those are some differences that arise when considering the specific sector. The one, whose importance of which has increased incredibly in recent years is the telecommunication sector, was selected to be analysed in the paper.
The purpose of the paper is to deepen and improve the understanding of the importance of market concentration of selected oligopolistic structure on the Slovak market through a market share of operators based on the knowledge of their earnings and the number of active customers, but also on an important indicator of the quality of services that are provided—available networks, frequencies, and technologies. The paper also aims to extend the number of studies, which have been researched until now while applying the theory of oligopoly in a specific sector of the economy.
The determination of the market concentration may help to reveal the leadership and type of cooperation among the telecom entities operating on the market. Moreover, the quantification of the market concentration is important when considering the rules of the competitive market and protection of the economic competition, as one of the leading enterprises (Slovak Telecom) in the Slovak telecommunication sector was misusing its leading position from 2005 to 2010, which was confirmed by the General Court of the European Union. The company set the pricing policy in the wholesale and retail markets, so that the alternative operators were not able to replicate the retail products of the dominant enterprise (Slovak Telekom refused to provide unbundled access to local access and set inappropriate prices decreasing the margin between wholesale and retail prices for the Internet access). Thus, the aim of the paper is to quantify the market concentration of the telecom industry in the national conditions of the Slovak Republic and to assess whether the economic competition is protected if it is not threatened by any dominant enterprise. The market concentration is measured while using specific indicators—the concentration index, Herfindahl-Hirschman Index, Lorenz curve, and Gini coefficient indicators.
The Slovak telecommunication market has been changed in the last decades; new operators were able to enter among the established companies. A strong competitive environment causing price erosion, as well as continuing regulation, have been factors that are faced by the Slovak telecom market for several years. Despite these factors, which significantly affect the activities of all players and thus the market behaviour, a slight increase in the total revenues is observed when compared to the previous period. After a decrease in 2016, the telecommunication market experienced a slight increase in 2017, reaching the level of 2015. The dominant share in the value of the telecommunications market is still kept by the segment of mobile services, representing 51% of the total market value. The value of mobile voice and SMS has long been in decline, which an increase in revenues from mobile data only partially offsets. The stabilization of revenue from mobile voice services is mainly affected by the changing structure of voice plans, with an emphasis on the value of the Internet in the mobile phone, as well as the migration from prepaid services to the invoiced services.
The paper is divided into four main parts. The literature review depicts the basic characteristics, models, and studies of oligopolistic market structure, as well as the latest researches that are being conducted in the sector of telecommunication industry in Slovakia and abroad. The section Material and Methods portrays the methods and indicators (concentration rate, Herfindahl–Hirschman Index (HHI) index, Lorenz curve, Gini index, coefficient of variance) that are used to calculate the market concentration of the chosen oligopolistic sector, describing the results of the analysis and comparisons in the Results section. The Discussion highlights the crucial results of selected market structure and identifies the entry barriers.
Literature Review
The first attempts to define an oligopolistic market structure were related to the work of mathematicians. In 1838, the work Recherches sur les principes mathématiques de la Théorie des Richesses was created, authored by Augustin Cournot (1938), who not only laid the foundations for the theory of oligopolies, but also created a mathematical model of their equilibrium, analysing it from the perspective of both static and dynamic equilibrium. The dynamics of the models was searched also by Rand (1978) and May (1976), who suggested the logistic map, which is used until today, to analyse the dynamics of business behaviour. The French mathematician Bertrand (1989), in response to Cournot’s work, created Bertrand’s model, which was mathematically formulated by a representative of the Anglo-American school Edgeworth (1993). Stuart Rosenberg and Patrick O’Halloran (2014) pointed out, in the theoretical background of their study, that, just as Cournot´s and Bertrand’s model are suitable to explain the oligopoly characterized by a strong competitive environment; these models can also be used to explain the cartel forms of oligopolistic market structure.
Nevertheless, these basic models have been refined and improved several times over the coming years. Von Stackelberg ([1934] 2011) was another author who modified Cournot’s model. In particular, the model dealt with the existence of a dominant entity in an oligopolistic market. Stackelberg’s competition, which is made up of all other businesses in the industry, understands the production volume of market leadership as given, and that is why it determines its output based on the production volume of the leader. Sweezy (1939), in his work Demand under conditions of oligopoly, developed a model in which he assumed that businesses reacted differently to price increases and reductions. Specifically, Sweezy’s competition breaks the predominant demand curve. The upward movement of the demand curve was significantly different from previous microeconomic theories. This model became a critical linking between classical theories and later theories dealing with oligopolistic behaviour in the context of competitors’ reactions to price decisions and the emphasis on market price rigidity. Various studies have continued to extend the literature on the impact of price rigidity in oligopolistic markets. Such authors include Maskin and Tirole (1988), who paid attention to the consequences of price competition and market share of the changed demand curve. A few years later, Dozoretz and Matanovich (2002) warned of the dangers of price competition that could result in serious price wars. A number of theories have begun to address their strategic interaction given that business competition and dependence are the primary characteristics of an oligopoly. Several economists, including Shubik (1959), have extended the oligopolistic theory to game models that take place among businesses. Game theory became an independent discipline thanks to the pioneering work of von Neumann and Morgenstern (1944). Von Neumann analysed the strategic interactions of enterprises in terms of mathematical science and knowledge of tactical thinking. Programs simulating the strategic decisions of businesses were developed due to the applicability of the game theory to the real-world decision-making, as discussed in the study of Rosenberg and O’Halloran (2014) studies. They tried to determine, while using a business simulation game, which of the decision variables were the most important in increasing the internal rate of return of the business and assessing the degree of interdependence within the simulated oligopolistic market.
Models of oligopolistic market structures emerged and developed not only because of the emerging theoretical background of this issue, but also because of their practical applicability in the business practice. There have been several authors who applied historical or modified models to some of the real forms of an oligopolistic market. Ledvina and Sircar (2012) focused their attention on businesses with asymmetric costs. They have applied their models to the energy market, where several providers of costly but also inexhaustible, sources compete on the Cournot market with exhaustible providers. Caldentey and Haugh (2009) tried to transform the classic models and create a Cournot–Stackelberg model of supply contracts with financial security. They focused on supply chain performance studies, where n- sellers and the only manufacturer compete in the Cournot–Stackelberg game. Winfried J. Steiner (2010), while using the Stackelberg–Nash model, applied the theory of oligopolies for the optimum design of a newly marketed product. The problem of optimal product design is formulated from the point of view of a new seller who wants to penetrate a new brand into an already existing market. Häckner and Nyberg (2008) described a media market with a duopoly character where commercial television, radio, and print media simultaneously make their decisions on two markets. One market focuses on its readers, listeners and other mass media on consumers, while the second market specializes in advertising. Deal (1979) was focused his research on the advertising market, while considering optimizing corporate spending on advertising in a dynamic duopoly. The author analysed the adequate timing of advertising expenditures within the set time. In the United States, Borenstein et al. (1999) searched the market power of the oligopolistic electricity market. Chen and Hobbs (2005) further developed this topic, who argued that the market power in the electricity market is modelled by Cournot’s game. Recent discussions of regulatory interventions in telecommunications markets have considered an approach in which competitors are progressively encouraged to make investments in network assets that are less and less easily replicable—thus climbing the ladder of investment. The pioneering paper of Cave (2006) proposes and illustrates methods for assessing the replicability of different assets and sets out the steps that regulators can follow in implementing the approach.
There are also several authors in the Slovak Republic who focus their researches on the oligopolistic models. Goga (2013), as well as Szomolanyi and Surmanova (2008), were devoted to dynamic models in their work. Fendekova and Fendek (2010, 2015) are other important authors that searched not only the stability of the two basic models of Cournett and Bertrand in relation to the expectations of businesses regarding future competitors’ behaviour, but also addressed the issue of balancing in terms of product and price differentiation on regulated network industries or specific markets of the sector. A number of theoretical and empirical studies show that market concentration is an important indicator of its performance, which is mainly used as a basis for market analysis. In particular, the measurement of market concentration is considered to be an appropriate starting point for assessing the intensity of competition in the market. Madlenakova et al. (2018) also addressed the problem of determining the degree of concentration as a significant variable in regulating competition in the industry in relation to typical indicators in the electronic communications sector. Their analysis provides information regarding the market structure while using the Herfindahl–Hirschman Index as the most commonly used concentration index for evaluating electronic communications markets. In Slovakia, Brezina et al. (2009), Brezina and Pekar (2016), and Tokarova (2006) also analysed the sectoral concentration of business entities. Kostić et al. (2016), who measured the concentration on the mobile market using various indicators—HHI, Lorenz curve, or Gini coefficient indicators, surveyed the concentration on the Serbian mobile market. While using the statistical correlation methods and simple linear regression analysis in their article, they confirmed a strong correlation between market concentration and market performance. Krstić et al. (2016) also measured the concentration in the Serbian mobile market. While the previous team of authors calculated the concentration indicators from market shares based on the number of active customers, and these authors used information about the sales of all mobile operators on the market. Corejova et al. (2016) conducted the analysis of the electronic communications market in Slovakia. In their study, they discussed the issues of concentration on the market by using the appropriately chosen quantitative methods. Other authors focus on measuring the efficiency of specific national sectors (Balcerzak et al. 2017; Radisic and Dobromirov 2017), to assess the competitiveness on the market (Peleckis et al. 2018; Sadaf et al. 2018), to judge the responses of customers to market changes (Mirica 2018; Fielden et al. 2018; Mitea 2018), or to assess the brand loyalty of consumers (Kliestikova and Janoskova 2017; Krizanova et al. 2013).
2. Methodology
The analysis represents the decomposition of the selected oligopoly into individual parts, according to the basic characteristics that determine this market structure in order to identify the internal relations and dependencies, as well as the type of the selected oligopolistic market structure. For this reason, we had to obtain as much relevant data as possible on the enterprises operating in the telecom industry. We mainly obtained real data from the annual reports of operators, which were annually published by 2017. The analysis prepared by the Regulatory Authority for Electronic Communications and Postal Services (2016) was also useful. The time specification of the analysis is the range of five years, the horizon of the years 2013 to 2017, as determined by the relevant data from the annual reports of mobile operators and statistical databases of the Ministry of Transport and Construction of the Slovak Republic. The spatial specification is the territory of the Slovak Republic. When considering the subject specification of the analysis of the selected Slovak oligopoly, the companies that have a public mobile telephone network or rent it are surveyed. Consequently, the analysis is focused on mobile electronic communications service providers. These services include mobile voice, mobile non-voice, and mobile data services.
The total value of the telecommunications market in the Slovak Republic (including data services transfer, fixed internet, fixed voice, Pay-TV, mobile data services, and mobile voice services) was more than 1834 mil. EUR in 2017, while mobile voice services (representing 48% share) and mobile data services (more than 3% share) account for more than 51% of the total market value. Currently, there are four communications services providers in the Slovak Republic—three of them are entrenched and they have their public mobile telephone network Orange Slovakia, a.s. Slovak Telekom, a.s., and O2 Slovakia, s.r.o. The last provider, which entered the market in 2015, is SWAN Mobile, a.s.
A comparative analysis of mobile operators may be complicated due to a lack of data. Nevertheless, we compared businesses while considering not only the key performance indicators, such as a share of operators based on total revenues in the telecommunications market and the number of active customers, but also an important indicator of the quality of services that are provided by mobile operators, which is measured by available networks, frequencies, and technologies.
Total revenues of the telecommunications market include revenues from both mobile and fixed services. Therefore, the following Table 1 shows the revenues of selected mobile operators and alternative providers of fixed services. Alternative providers are the providers of mobile services, which are known as mobile virtual network operators. These operators do not own any mobile network, but they cooperate with mobile network operators and get access to network services for wholesale prices and then set retail prices for their customers. Alternative providers of mobile services have their consumer service, billing, and marketing. The Slovak telecommunications sector applies the model, where the business partner acts as a seller of services of the mobile network operator and offers some value added, which is sold in its own name.
After the decline in revenues in 2016, the telecommunications sector recorded a slight increase in 2017, thanks to which the market is getting close to the 2015 level. Based on the data in Table 1, we calculated the revenue shares of the individual entities operating in the telecommunications market between 2013 and 2017, as in Figure 1.
Based on the comparison of shares of individual operators on the revenues of the telecommunications market, we can state that the revenues of the three operators Slovak Telekom, Orange, and O2 accounted for up to 87% of the total revenues of the telecommunications market on average for the period 2013–2017.
The number of active customers was counted as the proportion of active SIM cards to the amount of Slovak population (the penetration of mobile SIM cards is presented in Figure 2). We can state that the number of SIM cards not only constantly exceeds the population of the Slovak Republic, but it also has a growing trend.
It can be stated that Slovak citizens are interested in using mobile services, which means new opportunities for mobile operators to increase their potential customer base. The data were gained from the annual reports of individual operators; the authors determined the market share of operators based on the data focused on the number of active customers (Figure 3).
The Telecommunications Office allocated frequencies to all four operators operating in the Slovak telecom market. Operators have networks to provide mobile services. They use systems of 2nd, 3rd, or 4th generation of mobile communication technologies to operate.
In terms of these technologies, the most important step is to deploy a 4G network (LTE), which is a mobile network technology that provides several times faster transmission speeds than 3G technology. The reason for extensive LTE networking in the Slovak Republic was the issuance of individual licenses for the use of frequencies from the 800 MHz, 1800 MHz, and 2600 MHz frequency bands. They were allocated by the Telecommunications Office in 2013. The purpose was to use these frequencies, to support innovation but also to develop new services. The biggest benefit; however, was the entry of a new operator into the market.
From the annual reports, it is clear, that in the period 2013–2017, Slovak Telecom covered more than 87% of the Slovak population while using the best technology of mobile networks, LTE. This technology was available on the three different frequencies of 800, 1800, and 2600 MHz. The second best, based on the parameter presented, is Orange, with 4G being used at 800 and 2600 MHz. Only 67% of the population covered the fastest network of O2 that operates at 800 MHz and 1800 MHz. SWAN Mobile covers only 64% at only 1800 MHz frequency.
Based on the information regarding the crucial performance indicators of the companies in the oligopolistic market structure of the telecom sector—the share of operators based on total revenues, the number of active customers, and the quality of services provided by mobile operators measured by available networks, frequencies and technologies—we are able to analyse and quantify the market concentration of the selected oligopoly.
We measure the market concentration while considering the absolute concentration indicators, namely the concentration level of the strongest enterprises in the industry and the Herfindahl–Hirschman Index (HHI). Absolute indicators are intended mainly for economic purposes and the description of the market structure in the sector. The non-uniform distribution of values of the monitored indicators is determined by the coefficient of variation (Corejova et al. 2016). This type of distribution may also be described by the Lorenz curve and the Gini coefficient. We find out whether the industry is concentrated or not based on the values of the selected indicators.
We first calculate the concentration rate for m-strongest enterprises in the industry (CRm) while using market shares:
where
- si market share of i-th enterprise, and
- m number of enterprises; .
Usually, CRm is quantified for m = 3, 6, 10, 25, 50, 100 strongest enterprises in the industry (Brezina et al. 2009).
The Herfindahl—Hirschman Index is one of the most widely used and accepted measures of the market concentration. This indicator reflects the market share of all companies in the sector. Theoretically, HHI can range from 0 to 10,000. If there were only one monopoly on the market, then the market concentration would increase (and competition in the market would decrease) and the HHI equal to 10,000. However, if thousands of competing businesses were on the market, each with almost 0% market share, the HHI would be zero (Kostić et al. 2016). The equation to calculate the HHI is as follows (Brezina et al. 2009):
HHI is a convex function of the market shares of all businesses that operate in the industry. We define this indicator as the sum of the squares of market shares of all businesses in the selected industry (Brezina et al. 2009).
The Gini coefficient measures the inequality among the values of a frequency distribution. The zero value of the coefficient indicates the completely equal distribution of the market share among the market participants, and thus the perfect situation, while the value 1 indicates the total inequality of market shares (Krstić et al. 2016). The Gini coefficient is given by the equation:
where
- x observed value,
- n number of values observed, and
- mean value.
An alternative approach is to define the Gini coefficient as half of the relative mean absolute difference, which is mathematically equivalent to the Lorenz curve definition. The Lorenz curve shows the deviation from the diagonal line showing a uniform distribution of the market share (45° line). The further the Lorenz curve from the diagonal line, the greater the inequality in the distribution of the market power.
We focus on market shares of operators calculated based on the number of active customers shown in Figure 3 to calculate the mentioned absolute and relative indicators, following the analysis of Serbian authors (Kostić et al. 2016) assessing the level of competition on the Serbian mobile telecommunications market by market shares calculated on the basis of active customers.
3. Results
The objective of the paper is to measure and analyse the market concentration of the telecom industry in national conditions of the Slovak Republic while using specific indicators—the Herfindahl-Hirschman Index, Lorenz curve and Gini coefficient indicators, coefficient of variance, and concentration rate for m-strongest enterprises in the industry (CRm).
The concentration ratio CRm is the first important indicator to follow, which is one of the main indicators that determine the state of the competitive environment. Given the fact that the number of businesses in the mobile services market changed during the period under review, and the concentration rate is calculated for two or three strongest companies on the market. Table 2 shows the results.
The CR2 indicator represents the cumulative value of the market shares of two strongest operators, Orange and Slovak Telekom, for each of the years under review. While almost 79% of customers belonged to one of these two operators in 2013, CR2 gradually declined. In 2017, CR2 fell to almost 70 points, which still represents a high market share of two leading businesses.
The CR3 indicator shows the cumulative share of three leading operators in the relevant mobile telecommunications market (Orange, Slovak Telekom, and O2). There were three operators on the market until 2015; the CR3 index was 100 points. This indicator dropped to 98.58 points in 2016 and 97.56 points in 2017 following the entry of the fourth operator (Swan) on the market, which means that the entry of a new operator has not had a significant negative impact on the three established businesses in the form of customer outflows.
In general, the concentration levels can range from 0 to 100 percentage points. The concentration limit value in the European Union is 25 percentage points and, in the United States, it is 50 percentage points. If the industry exceeds a given value, it is considered highly concentrated (Kostić et al. 2016). The acquired values of the surveyed indicator CR3 show that the concentration of the mobile telecommunications market in Slovakia was extremely high during the whole monitored period. In the time horizon, the CR3 indicator reached or nearly reached 100 points, which means that it exceeded the set point of 50 points by 47.56 to 50 points.
The Herfindahl–Hirschman index is a commonly accepted measure of market concentration. It is calculated by squaring the market share of each firm competing in a market and then summing the resulting numbers. It can range from close to zero to 10,000. According to the European Commission, which states in the following classification of the HHI index in the Guidelines on the assessment of horizontal mergers under the Council Regulation on the control of concentrations between undertakings:
| • HHI < 1000 | non-concentrated |
| • HHI = < 1000, 2000> and Δ HHI is lower than 250 | moderately concentrated |
| • HHI > 2000 and Δ HHI is lower than 150 | highly concentrated |
Table 3 shows the calculated values of the HHI index for the Slovak mobile market based on the shares of active customers of mobile operators.
The value of the HHI was declining as a result of increased competition in the market, either after the entry of the fourth operator or as a consequence of increasing position of O2 when considering the mobile active customers. Nevertheless, the analysed market is highly concentrated throughout the whole period under review, according to both established scales (FTC and EU Commission). No significant changes were achieved and, in any year-on-year comparison despite the declining trend of the indicator, and the value of HHI did not exceed 150 points.
The coefficient of variation is another indicator, which can assess the distribution of customers among the telecom operators on the market. If the indicators were zero, the number of active customers pertaining to individual operators would be balanced, which would allow for assessing the relatively good condition of the competitive environment in the industry. The coefficient of variation is determined as the ratio of the standard deviation and the mean value of the character examined (Terek 2017). The values of the coefficient of variation for each year can be found in Table 4.
The results in Table 4 declare that the ideal situation was in 2013, 2014, and 2015, (coefficient of variance is close to zero) and a great fluctuation occurred in 2016, a year after a new operator entered the market. The non-uniform distribution of the market share based on the number of customers and the level of concentration on the market can be graphically portrayed by the Lorenz curve (Krstić et al. 2016).
The vertical axes of the graphs in Figure 4a,b represent the cumulative totals of percentage shares expressing the value of concentration. The Lorenz curve is shown for the beginning period (2013—Figure 4a) and for the end of the period under review (2017—Figure 4b) given that the number of enterprises does not play a decisive role in determining the concentration level.
Following the shape of the curves, we can conclude that, in 2017, as compared to 2013, the Lorenz curve is further from the diagonal, thus there is greater inequality among market shares of the entities that are based on the number of customers. The reason is the entry of the fourth operator into the market and its significantly different proportion to others already established businesses. The Gini coefficient, which reaches the value of 0.156 in 2013, and, in 2017, its value increase to 0.292 also proves this statement.
It is obvious that some differences occurred at the end of the period when considering the time horizon under investigation. Despite the fact that the oligopolistic structure of the telecom industry in Slovakia, based on the results of calculated indices, may be defined as a highly concentrated differentiated oligopoly; the results declare that the entrance of the fourth operator changes the market concentration slightly and highlight the fact that its operation on the market did not have a negative impact on the other enterprises on the market in the form of customer outflows, but influence the total economic competition in a positive way. The result is that mobile operators compete and interact with each other mainly through the prices for which they offer their service portfolio and by electronic communication services that are aimed at the increasing interest in services that are provided via the Internet (following the principle of the ladder of investment). They differentiate their services and adjust the tariffs for different customer segments, such as young people, individuals, business customers, and so on. The price sensitivity of the services is caused by the mutual interaction of operators, occurring in the oligopolistic market, which affects the competition and forces it to adjust to other competitors’ prices.
4. Discussion
The level of concentration is particularly relevant, since the restrictive effects are more likely to occur on highly concentrated oligopolistic markets and they are more likely to be more sustainable than in less concentrated markets. The results show that the telecom industry of Slovakia is a highly concentrated industry in which competition-related problems do exist. The telecommunication market place is still heavily influenced by the inheritance of state monopoly, which was typical of European countries. However, Cave (2006) highlights that competition is the best regulator to set the appropriate incentives, and regulators must signal that the assessment conditions are changing. Accepting the national and European regulation, the system of a ladder of investment, there are some obstacles for another mobile operator in the Slovak Republic, which have to be solved when entering the sector. Strategic barriers are linked to an important fact that affects the nature of the oligopoly itself—the fact that oligopoly is regulated by the state authority, the Regulatory Authority for Electronic Communications and Postal Services. It determines that the use of the frequency spectrum is the most striking strategic barrier to enter the market. Permission to use it can only be obtained after the selection procedure, according to which the Regulatory Authority redistributes free frequencies. Another strategic barrier is the strong position of established mobile operators Slovak Telekom, Orange, and O2. We can also include the recent market penetration of the fourth operator into this category of barriers, as it seeks to attract as many customers as possible through its marketing and service portfolio. Economic barriers of the market entry include fees for the use of frequencies, high capital intensity that is related to the construction of a public mobile telephone network, as well as the high costs of attracting customers through advertising, innovative services, or more attractive services as compared to competitors. Technical barriers are the dynamics of scientific and technological progress and rapid changes in the mobile electronic communications sector. It is also challenging to establish public mobile networks and the evolution of 5G network offering faster speeds and more reliable connections. Time constraints of entry and stabilization of a new business on the market, time-consuming acquisition of a significant number of customers, as well as the return on investment, are included in time barriers.
Kintler (2013) discussed the fact that the telecommunications market is in the form of an oligopolistic market structure in real market conditions. The authors’ study deals with the issue of the development and regulation of the market on the national market, as well as at the European level. At the same time, it draws attention to the problems of organizing and regulating the oligopolistic market in order to increase the competition among individual telecommunications providers. Several studies have been conducted worldwide and various approaches have been tested to quantify the oligopoly power in the telecommunication sector. Ndiaye and Thiaw (2011) searched the strategies in the oligopolistic competition of the telecommunication industry in Senegal. In their study, the authors highlight the motivations of the incumbent firm to implement cumulative innovation in order to maintain its position in spite of the investments of entering firms. Geras’kin (2018) considers the problem of finding equilibria in the oligopoly of the Russian telecommunication market. The study conducted by Leveque (2007) explained the importance of the information exchange in the oligopoly and its impact on the competition. Sznajd-Weron et al. (2008) probe the dynamics in the oligopoly market using data from the Polish telecommunication market and apply them to a situation where a new entrant challenges two incumbents of the same size while using the mean-field approach and Monte Carlo simulation. Oligopoly and state interventions of the mobile telecommunications of Argentina are described in the paper by Fontanals (2014); the survey by Hurkens and López (2012) presents the effects of the telecommunication oligopoly of Spain. The authors extend the existing models of the asymmetric duopoly and symmetric oligopoly where customer expectations regarding market shares are passive. The study of Valletti (2003) presents a model of competitive interaction among mobile telecommunications operators. The author claims that the market coverage of an operator can then be interpreted as a parameter of vertical product differentiation. The main implication is that the industry has strong features of a natural oligopoly, where only a limited number of operators with possibly different coverage can survive in equilibrium.
5. Conclusions
The paper aims to extend the number of studies that apply the theory of oligopoly in a specific sector of the economy; thus, we focus on the quantification of the concentration of the oligopolistic market structure of the Slovak telecom industry. There has not been any relevant study quantifying the market concentration of the Slovak telecommunication sector as of yet. The oligopolistic structure was searched by the decomposition of the selected oligopoly according to the basic characteristics that determine this market structure. We subjected the oligopoly to concentration analysis of the market to discover the level of the competitive environment in which mobile operators are operating. Market concentration was measured while using absolute indicators—CR2, CR3, and HHI, but also relative indicators—Gini index and coefficient of variation. We proved that the mobile operators market is highly concentrated according to the recommended values for the absolute indicators used, although after the entry of the fourth operator, the concentration slightly decreased and the competition improved. Using the coefficient of variation, we evaluated the non-uniform distribution of customers between operators. This distribution was also illustrated by the Lorenz curve and the Gini coefficient. Another important characteristic of oligopoly is the nature of production. The services that are offered are not identical, they are differentiated based on prices, quality, availability, or the target group of customers.
The analysis showed that, in the case of the oligopoly of mobile electronic communication service providers, that this is a type of oligopolistic structure where a dominant undertaking, which would indicate the industry and others would imitate it, cannot be clearly identified. We can say that Slovak Telekom, which is the leader in the achieved revenues as well as in coverage and available technologies, has an important position based on the comparison of companies, but it does not disturb the economic competition as it did in the past period. It is followed by Orange Slovakia, which demonstrates its strong position in the market with its leadership in the number of customers. O2 Slovakia has built up its position between two big competitors and the consumer base is being annually increased. The youngest operator, SWAN Mobile, is an important partner, which has slightly improved the competitive environment among operators and increased the competition. To determine the state of the oligopolistic structure of the Slovak telecom sector, it is an oligopoly where the competitors offer slightly differentiated products; however, the competitive environment in which they operate is highly concentrated and competition needs to be regulated to achieve the sustainable development of the telecommunication sector. The regulation of the telecom sector helps to improve the market; however, different conditions imply that different approaches are needed in different countries (depending on the infrastructure of the competition). The ladder of investment remains a relevant concept in which to consider the regulatory approaches.
The results of the analysis declare that the telecommunication sector is an important tool of socio-economic development of the country. From the sectoral point of view, telecommunication providers contribute to productivity and growth, improve consumers´ benefits by providing a wide range of services at affordable prices, and introduce new technologies. They can also provide tax incentives, form necessary infrastructure, and extend services to different places and areas. However, their most important contribution is seen in the share of revenues (taxes paid), while considering the formal sector status and growing annual turnover. Moreover, the telecommunication sector generates positive economic externalities. The development of the Slovak telecommunications sector (from dominant oligopoly to gently competitive market) has contributed to greater market competition. Its impact is observed on both macroeconomic and microeconomic levels. That is why it is recommended to focus on the regulation of the market competition and liberalisation of the sector requiring regulatory reform and policies to ensure access and the use of information, productive efficiency, technological, and organizational innovations, but mainly the economic growth, as the growing number of active customers increase the GDP per capita. The statistically significant and large impact of the telecommunication sector on the economic growth of the country is verified in the studies of, e.g., Waverman et al. (2005), Sridhar and Sridhar (2007), Lee et al. (2012), or Duncombe (2016).
The study is limited to the Slovak Republic, but the highly concentrated market in the telecommunication sector is also the problem of other European countries. The further research should include the use of other important measures of the market concentration, such as the normalized HHI index, index of dominance, Hall–Tideman index, or the entropy index measured not only in the Slovak telecom sector to evaluate the changes in the market and in the competition after the entry of other enterprises in the mobile telecommunication sector. It may help to analyse the impact of this process on the market structure and quality of services provided. The sensitivity analysis may also provide relevant information, especially when considering the barriers of entry of a new enterprise into the market; it can be done based on other relevant characteristics, such as profit, the average number of employees, or market share.
Author Contributions
K.V. conceived and designed the experiment; M.D. and M.K. performed the calculations; E.G. suggested the methodology; K.V. and E.G. analyzed the data; G.L. and M.K. contributed material and analytical tools; G.L. visualization and project administration; K.V. and M.D. wrote the paper; K.V. responsible for review and editing.
Funding
This research received no external funding.
Acknowledgments
The contribution is an output of the scientific project VEGA 1/0210/19: Research of innovative attributes of quantitative and qualitative fundaments of the opportunistic earnings modeling.
Conflicts of Interest
The authors declare no conflict of interest.
References
- Balcerzak, Adam, Tomas Kliestik, Dalia Streimikiene, and Lubos Smrcka. 2017. Non-parametric Approach to Measuring the Efficiency of Banking Sectors in European Union Countries. Acta Polytechnica Hungarica 14: 51–70. [Google Scholar]
- Bertrand, Joseph. 1989. Review of Walras’s Théorie Mathématique De La Richesse Sociale and Cournot’s Recherches Sur Les Principes Mathématiques De La Théorie Des Richesses. In Cournot Oligopoly: Characterization and Applications. Edited by Andrew F. Daughety. Cambridge: Cambridge University Press, pp. 73–81. [Google Scholar] [CrossRef]
- Borenstein, Severin, James Bushnell, and Christopher R. Knittel. 1999. Market Power in Electricity Markets: Beyond Concentration Measures. The Energy Journal 20. [Google Scholar] [CrossRef] [Green Version]
- Brezina Brezina, Ivan, and Juraj Pekar. 2016. Measurement of Concentration Ratio in the Slovak Insurance Sector. In Proceedings of 8th annual international scientific conference COMPETITION. Edited by Stanislav Rojik and Jan Zavodny Pospisil. Jihlava: College of Polytechnics Jihlava, pp. 67–69. [Google Scholar]
- Brezina, Ivan, Anna Orsulova, and Juraj Pekar. 2009. Analyses of Absolute Concentration of the Selected Branch by Herfindahl-Hirschman Index. Ekonomicky Casopis 57: 77–94. [Google Scholar]
- Caldentey, René, and Martin B. Haugh. 2009. Supply Contracts with Financial Hedging. Operations Research 57: 47–65. [Google Scholar] [CrossRef] [Green Version]
- Cave, Martin. 2006. Encouraging infrastructure competition via the ladder of investment. Telecommunications Policy 30: 223–37. [Google Scholar] [CrossRef]
- Chen, Yihsu, and Benjamin F. Hobbs. 2005. An Oligopolistic Power Market Model with Tradable NO/sub x/ Permits. IEEE Transactions on Power Systems 20: 119–29. [Google Scholar] [CrossRef]
- Corejova, Tatiana, Iveta Sedlakova, and Eva Sedlakova. 2016. Analysis of Electronic Communication Market in Slovak Republic by Revenues in 2004–2012 years. Autobusy: technika, eksploatacja, systemy transportowe 6: 1653–56. [Google Scholar]
- Cournot, Augustin. 1938. Researches into the Mathematical Principles of the Theory of Wealth. London: Macmillan Company. [Google Scholar]
- Deal, Kenneth R. 1979. Optimizing Advertising Expenditures in a Dynamic Duopoly. Operations Research 27: 682–92. [Google Scholar] [CrossRef]
- Dozoretz, Jerry, and Tim Matanovich. 2002. The Deadly Dynamics of Price Competition. Marketing Research 14: 28–30. [Google Scholar]
- Duncombe, Richard. 2016. Mobile Phones for Agricultural and Rural Development: A Literature Review and Suggestions for Future Research. European Journal of Development Research 28: 213–35. [Google Scholar] [CrossRef]
- Edgeworth, Francis Ysidro. 1993. The Pure Theory of Monopoly. In Papers relating to Political Economy. London: Macmillan, vol. 1, pp. 111–12. [Google Scholar]
- Fendekova, Eleonora, and Michal Fendek. 2010. Models of Price Regulation of Network Industries. Ekonomicky Casopis 58: 1039–54. [Google Scholar]
- Fendekova, Eleonora, and Michal Fendek. 2015. Mikroekonomická analýza efektov cenovej diferenciácie produkcie monopolu. In Modely rovnováhy v podmienkach produktovej a cenovej diferenciácie na regulovaných trhoch sieťových odvetví. Bratislava: Vydavateľstvo EKONÓM, pp. 83–99. [Google Scholar]
- Fielden, Anna, Marian Grupac, and Peter Adamko. 2018. How Users Validate the Information They Encounter on Digital Content Platforms: The Production and Proliferation of Fake Social Media News, the Likelihood of Consumers Exposure, and Online Deceptions. Geopolitics, History, and International Relations 10: 51–57. [Google Scholar]
- Fontanals, Gustavo. 2014. Business and Politics in Mobile Telecommunications in Argentina: Oligopoly and State Intervention. Eptic 16: 22–49. [Google Scholar]
- Geras’kin, M. I. 2018. Modeling Reflexion in the Non-Linear Model of the Stackelberg Three-Agent Oligopoly for the Russian Telecommunication Market. Automation and Remote Control 79: 841–59. [Google Scholar] [CrossRef]
- Goga, Marián. 2013. Game Theory. Bratislava: Iura Edition. [Google Scholar]
- Gregova, Elena. 2009. Mikroeconomics. Zilina: EDIS. [Google Scholar]
- Häckner, Jonas, and Sten Nyberg. 2008. Advertising and Media Market Concentration. Journal of Media Economics 21: 79–96. [Google Scholar] [CrossRef]
- Hurkens, Sjaak, and Ángel L. López. 2012. The Welfare Effects of Mobile Termination Rate Regulation in Asymmetric Oligopolies: The Case of Spain. Telecommunications Policy 36: 369–81. [Google Scholar] [CrossRef]
- Kintler, Jakub. 2013. Mobile Operators Telecommunication Market Regulation in Slovakia and European Union. In Aktualne problemy podnikovej sfery 2013. Edited by Stefan Majtan. Bratislava: EKONÓM, pp. 241–45. [Google Scholar]
- Kliestikova, Jana, and Katarina Janoskova. 2017. Branding with Understanding: How National Profile of Consumer Influences Brand Value Perception. Marketing and Management Innovations 3: 149–57. [Google Scholar] [CrossRef]
- Kostić, Zorana, Boban Stojanović, and Snežana Radukić. 2016. Measuring the Level of Competition on the Serbian Mobile Telecommunications Market. Economic Themes 54: 323–43. [Google Scholar] [CrossRef]
- Krizanova, Anna, Jana Majerova, Tomas Kliestik, and Peter Majercak. 2013. Theoretical Aspects of Brand Building in Seafood Industry. Naše More 60: 105–12. [Google Scholar]
- Krstić, Bojan, Vladimir Radivojević, and Tanja Stanišić. 2016. Measuring Market Concentration in Mobile Telecommunications Market in Serbia. Facta Universitatis, Series: Economics and Organization 13: 247–60. [Google Scholar]
- Ledvina, Andrew, and Ronnie Sircar. 2012. Oligopoly Games Under Asymmetric Costs and an Application to Energy Production. Mathematics and Financial Economics 6: 261–93. [Google Scholar] [CrossRef]
- Lee, Sang, John Levendis, and Luis Gutierrez. 2012. Telecommunications and Economic Growth: An Empirical Analysis of Sub-Saharan Africa. Applied Economics 44: 461–69. [Google Scholar] [CrossRef]
- Leveque, Francois. 2007. UK Tractors, Paris Luxury Hotels and French Mobile Telephony Operators: Are All Oligopoly Information Exchanges Bad for Competition. World Competition 30: 231–41. [Google Scholar]
- Madlenakova, Lucia, Maria Matuskova, Radovan Madlenak, and Paweł Droździel. 2018. Quantitative Analysis of the Competitive Environment in the Electronic Communications Sector. In Reliability and Statistics in Transportation and Communication. Edited by Igor Kabashkin and Olegas Irina Yatskiv. Riga: Springer International Publishing, pp. 413–21. [Google Scholar] [CrossRef]
- Maskin, Eric, and Jean Tirole. 1988. A Theory of Dynamic Oligopoly, II: Price Competition, Kinked Demand Curves, and Edgeworth Cycles. Econometrica 56: 571. [Google Scholar] [CrossRef] [Green Version]
- May, Robert M. 1976. Simple Mathematical Models with Very Complicated Dynamics. Nature 261: 459–67. [Google Scholar] [CrossRef]
- Mirica (Dumitrescu), Catalina-Oana. 2018. Judgements, and Decision Making in Consumer Behavior: The use of psychological Measures to Investigate Emotions and Cognitive Responses. Economics, Management, and Financial Markets 13: 39–44. [Google Scholar]
- Mitea, Dana Raluca Elena. 2018. The Expansion of Digitally Mediated Labor: Platform-Based Economy, Technology-Driven Shifts in Employment, and the Novel Models of Service Work. Journal of Self-Governance and Management Economics 6: 7–13. [Google Scholar]
- Ndiaye, Babacar, and Cheikh A. L. Thiaw. 2011. Positioning strategies in case of oligopolistic competition: The case of telecommunications industry in Senegal. African Journal of Business Management 5: 6651–56. [Google Scholar]
- Peleckis, Kestusis, Valentina Peleckiene, and Kestusis Peleckis. 2018. The search for balance and equilibrium of negotiating power under distorted market competition. Ekonomicko-manazerske spectrum 12: 67–82. [Google Scholar] [CrossRef]
- Radisic, Mladen, and Dusan Dobromirov. 2017. Statistical Analysis of Price Returns of Regional Stock Market Indices. Transformations in Business & Economics 16: 175–84. [Google Scholar]
- Rand, David. 1978. Exotic Phenomena in Games and Duopoly Models. Journal of Mathematical Economics 5: 173–84. [Google Scholar] [CrossRef]
- Regulatory Authority for Electronic Communications and Postal Services. 2016. Analysis of Relevant Retail Market n. 2. Available online: https://www.teleoff.gov.sk/data/files/47935_trh-2-2016-analyza-circa.pdf (accessed on 10 April 2019).
- Rosenberg, Stuart, and Patrick O’Halloran. 2014. Firm Behavior in Oligopolistic Markets: Evidence from A Business Simulation Game. Journal of Business Case Studies (JBCS) 10: 239. [Google Scholar] [CrossRef]
- Sadaf, Rabeea, Judit Olah, Jozsef Popp, and Domician Mate. 2018. An Investigation of the Influence of the Worldwide Governance and Competitiveness on Accounting Fraud Cases: A Cross-Country Perspective. Sustainability 10: 588. [Google Scholar] [CrossRef]
- Shlegeris, Buck. n.d. Gini Coefficient Calculator. Available online: http://shlegeris.com/gini (accessed on 10 April 2019).
- Shubik, Martin. 1959. Strategy and Market Structure: Competition, Oligopoly, and the Theory of Games. New York: John Wiley & Sons. [Google Scholar]
- Sridhar, Kala, and Varadharajan Sridhar. 2007. Telecommunications Infrastructure and Economic Growth: Evidence from Developing Countries. Applied Econometrics and International Development 7: 37–56. [Google Scholar]
- Steiner, Winfried J. 2010. A Stackelberg-Nash Model for New Product Design. OR Spectrum 32: 21–48. [Google Scholar] [CrossRef]
- Sweezy, Paul M. 1939. Demand Under Conditions of Oligopoly. Journal of Political Economy 47: 568–73. [Google Scholar] [CrossRef]
- Sznajd-Weron, Katarzyna, Rafał Weron, and Maja Włoszczowska. 2008. Outflow Dynamics in Modeling Oligopoly Markets: The Case of the Mobile Telecommunications Market in Poland. Journal of Statistical Mechanics: Theory and Experiment, P11018. [Google Scholar] [CrossRef]
- Szomolanyi, Karol, and Kvetoslava Surmanova. 2008. Linear Dynamic Cournot Oligopoly Model with Adaptive Expectation. Strategic Management 1: 33–36. [Google Scholar]
- Terek, Milan. 2017. Statistical Interpretation and Data. Kosice: Equilibria. [Google Scholar]
- Tokarova, Maria. 2006. Competition Policy in the Slovak Republic and its Basic Principles. In Knowledge Economy—New Challenges for National Economy Science. Edited by Ivan Sos and Martin Novak. Bratislava: EKONÓM. [Google Scholar]
- Valletti, Tommaso M. 2003. Is Mobile Telephony a Natural Oligopoly? Review of Industrial Organization 22: 47–65. [Google Scholar] [CrossRef]
- Von Neumann, John, and Oskar Morgenstern. 1944. Theory of Games and Economic Behavior. Princeton: Princeton University Press. [Google Scholar]
- Von Stackelberg, Heinrich. 2011. Market Structure and Equilibrium. Heidelberg: Springer Science & Business Media. First published 1934. [Google Scholar] [CrossRef]
- Waverman, Leonard, Meloria Meschi, and Melvyn Fuss. 2005. The Impact of Telecoms on Economic Growth in Developing Countries. The Vodafone Policy Paper Series 2: 10–24. [Google Scholar]
Figure 1.
Shares of mobile operators based on total revenues.
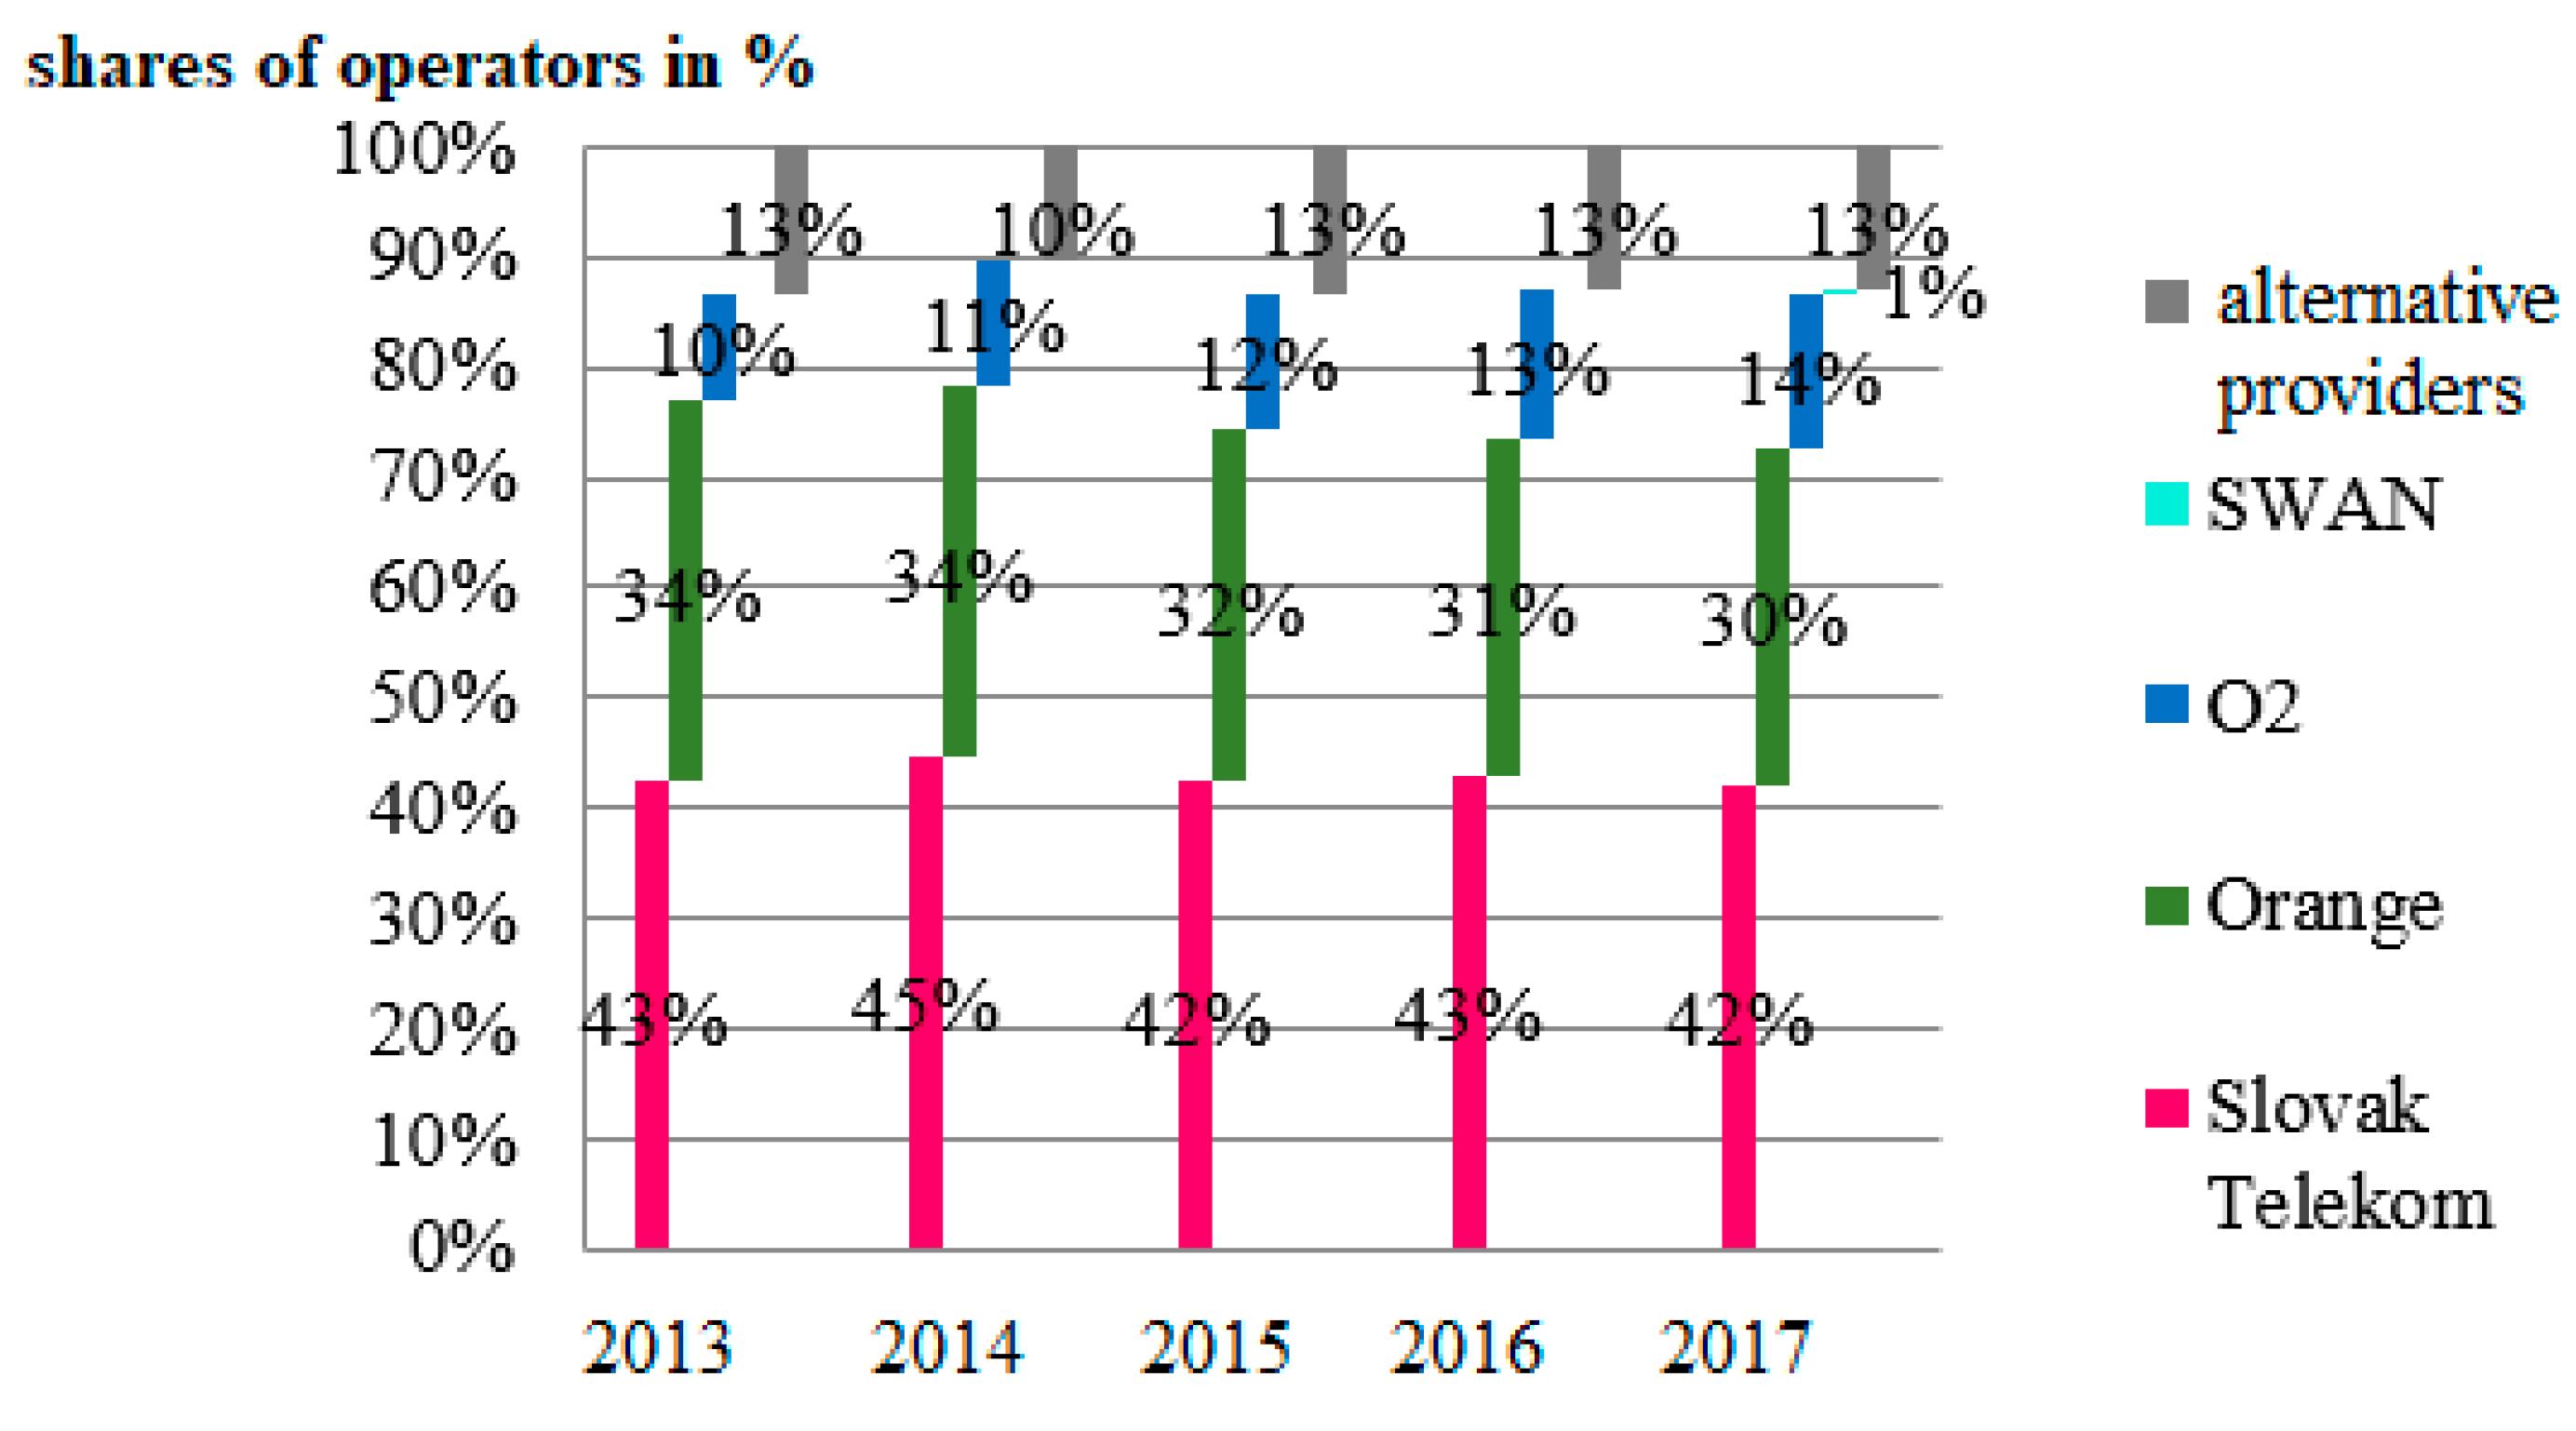
Figure 2.
Development of active SIM cards penetration.
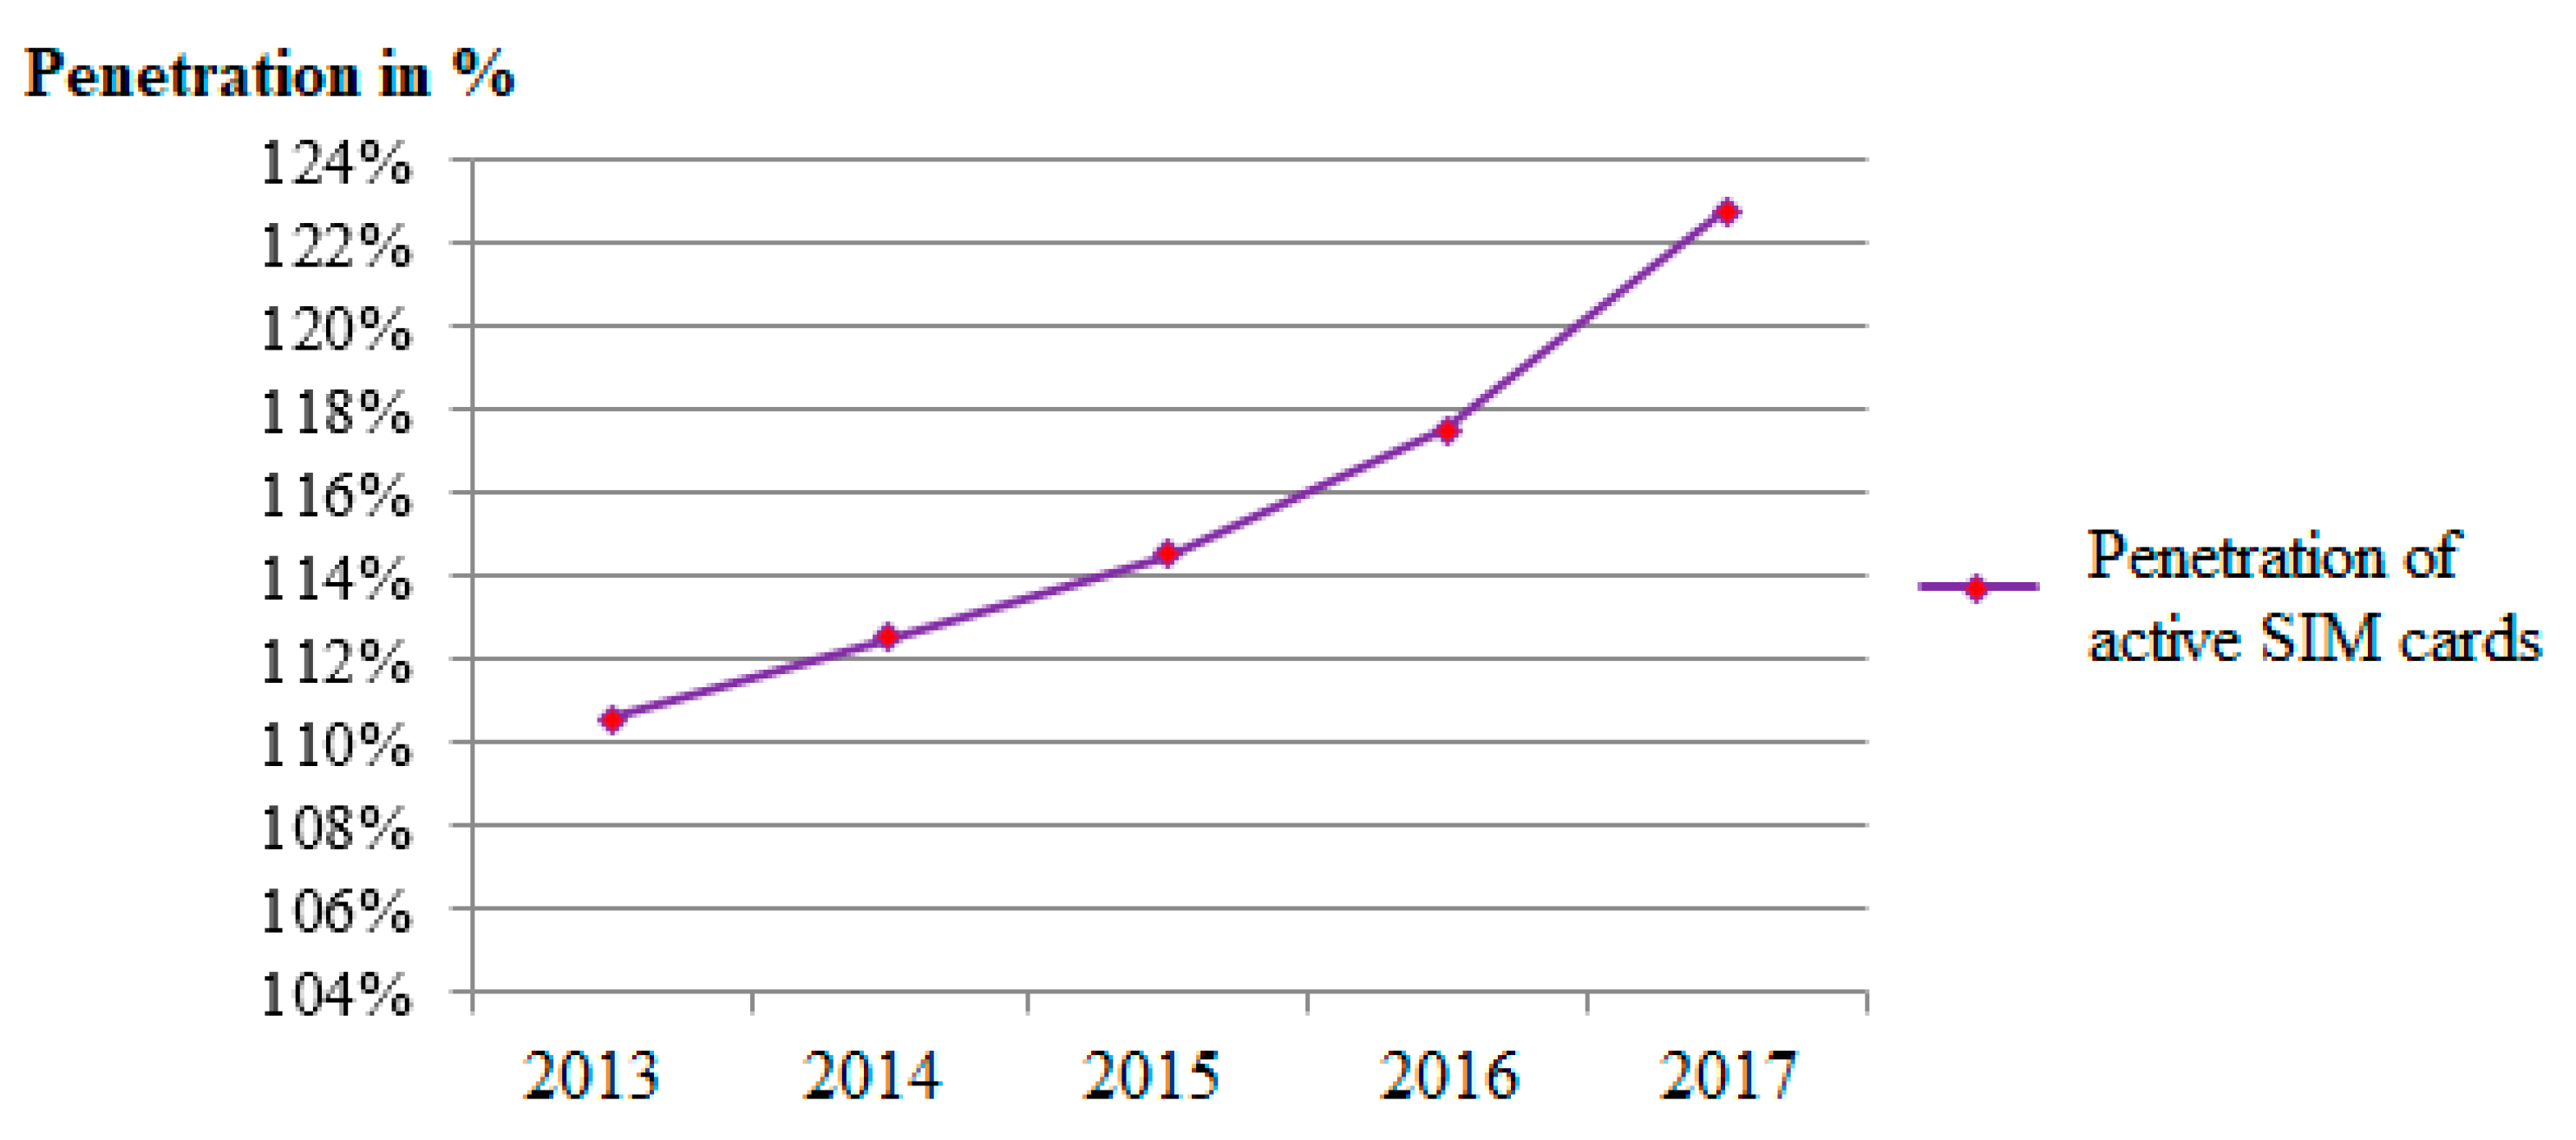
Figure 3.
Shares of mobile operators based on number of active customers.
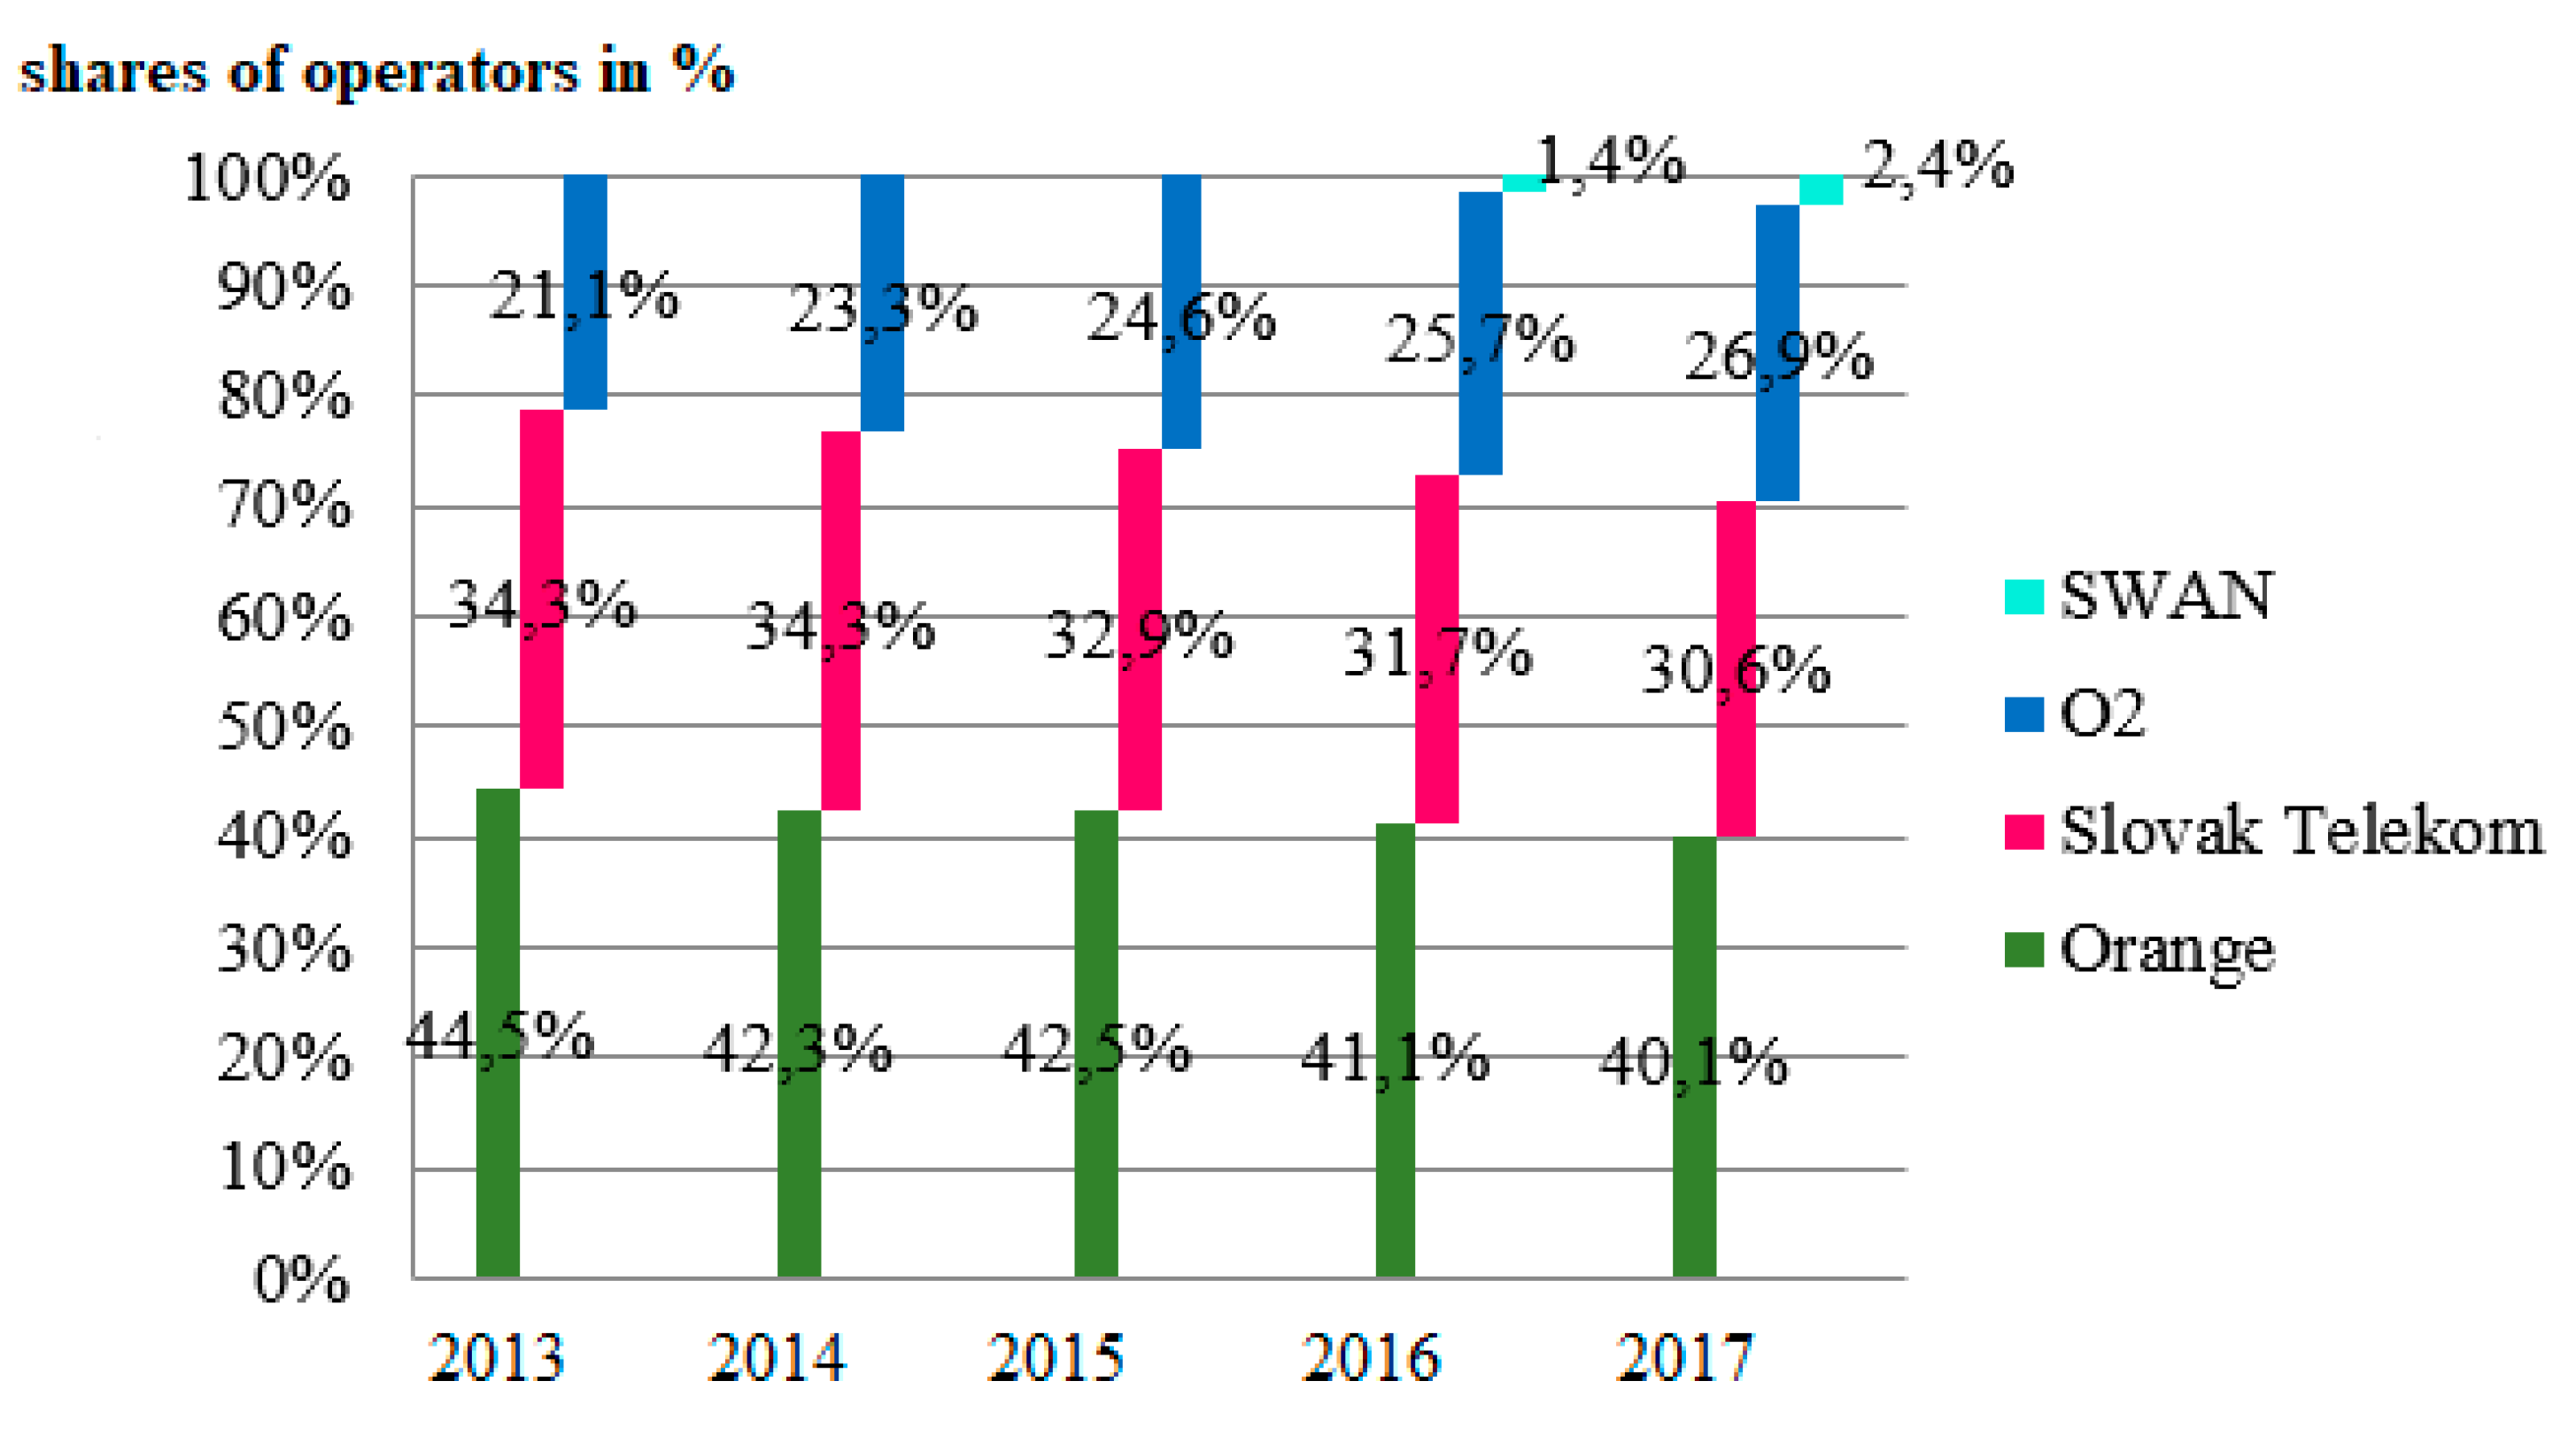
Figure 4.
Shape of the Lorenze curve (Source: Shlegeris n.d.).
Figure 4.
Shape of the Lorenze curve (Source: Shlegeris n.d.).


Table 1.
Revenues of operators in the telecom sector (in €).
| Operator/Year | 2013 | 2014 | 2015 | 2016 | 2017 |
|---|---|---|---|---|---|
| Slovak Telekom | 827,610 | 767,551 | 782,890 | 765,984 | 748,032 |
| Orange | 622,039 | 580,156 | 560,623 | 551,898 | 554,271 |
| O2 | 208,008 | 224,200 | 245,314 | 251,279 | 269,375 |
| SWAN Mobile | 12,693 | 47,216 | |||
| Alternative providers | 193,343 | 239,093 | 235,173 | 233,146 | 215,106 |
| Total revenues | 1,851,000 | 1,811,000 | 1,824,000 | 1,815,000 | 1,834,000 |
Source: Annual reports of telecom operators.
Table 2.
Values of CR2 a CR3 in the period 2013–2017.
| Indicator/Year | 2013 | 2014 | 2015 | 2016 | 2017 |
|---|---|---|---|---|---|
| CR2 | 78.85 | 76.65 | 75.38 | 72.88 | 70.69 |
| CR3 | 100 | 100 | 100 | 98.58 | 97.56 |
Table 3.
Values of the Herfindahl–Hirschman Index (HHI) index in period 2013–2016.
| Year | 2013 | 2014 | 2015 | 2016 | 2017 |
|---|---|---|---|---|---|
| HHI | 3608 | 3515 | 3494 | 3362 | 3272 |
Table 4.
Values of coefficient of variance in period 2013–2017.
| Year | 2013 | 2014 | 2015 | 2016 | 2017 |
|---|---|---|---|---|---|
| Coef. of variance | 0.29 | 0.23 | 0.22 | 0.59 | 0.56 |
© 2019 by the authors. Licensee MDPI, Basel, Switzerland. This article is an open access article distributed under the terms and conditions of the Creative Commons Attribution (CC BY) license (http://creativecommons.org/licenses/by/4.0/).
Share and Cite
MDPI and ACS Style
Valaskova, K.; Durica, M.; Kovacova, M.; Gregova, E.; Lazaroiu, G. Oligopolistic Competition among Providers in the Telecommunication Industry: The Case of Slovakia. Adm. Sci. 2019, 9, 49. https://doi.org/10.3390/admsci9030049
AMA Style
Valaskova K, Durica M, Kovacova M, Gregova E, Lazaroiu G. Oligopolistic Competition among Providers in the Telecommunication Industry: The Case of Slovakia. Administrative Sciences. 2019; 9(3):49. https://doi.org/10.3390/admsci9030049
Chicago/Turabian StyleValaskova, Katarina, Marek Durica, Maria Kovacova, Elena Gregova, and George Lazaroiu. 2019. "Oligopolistic Competition among Providers in the Telecommunication Industry: The Case of Slovakia" Administrative Sciences 9, no. 3: 49. https://doi.org/10.3390/admsci9030049
Note that from the first issue of 2016, this journal uses article numbers instead of page numbers. See further details here.