Article

Study of the Importance of National Identity in the Development of Corporate Social Responsibility Practices: A Multivariate Vision

by
Víctor Amor-Esteban
1,*,
Mª-Purificación Galindo-Villardón
1 and
Fátima David
2
1
Department of Statistics, University of Salamanca, 37007 Salamanca, Spain
2
Escola Superior de Tecnologia e Gestão, Instituto Politécnico da Guarda, 6300-559 Guarda, Portugal
*
Author to whom correspondence should be addressed.
Adm. Sci. 2018, 8(3), 50; https://doi.org/10.3390/admsci8030050
Submission received: 14 July 2018 / Revised: 6 August 2018 / Accepted: 24 August 2018 / Published: 28 August 2018

Abstract

:
Corporate Social Responsibility (CSR) has the characteristic of being a truly global idea, and its global features could give rise to the assumption that national dynamics are secondary or even irrelevant. However, while CSR policies may be of a global nature, recent research suggests that lasting national institutions and distinctive ideological traditions determine corporate decisions. In this study, we analysed the 2004–2014 decade from a panel data sample of 6600 observations from 600 large, internationally listed companies, and based on multivariate statistical methods, we contrasted the relevance of national identity in the sustainable behaviour of companies with the discovery of important national discrepancies, which corroborates that the country of origin of companies offers a series of facilities and barriers for the development of CSR practices. Companies, depending on different pressures and expectations, care about what is important in their own country. Thus, the corporations coming from Nordic countries—recognised as welfare states—are presented as the leaders in sustainable behaviour, highlighting in the social aspect the proper treatment of their employees and interest groups. They are followed a step below by companies whose country of origin is located in Southern Europe, which prioritise environmental reports. Organisations whose headquarters are centralized in North American countries are in a very delayed position, especially in environmental performance, giving greater preference to ethical issues.

1. Introduction

Corporate Social Responsibility (hereafter CSR) dates back to the 1950s, which marks the modern era of CSR when formal writing on the subject began (Carroll 1999). Since then, there have been many definitions and a large amount of research, both theoretical and empirical; even so, CSR means something, but it is not always the same to everyone, as there is no widely accepted definition. Since the term was first used, debates have existed as to its meaning and key elements (Whetten et al. 2002; Davis 1973). Defining what CSR is an arduous and complex task, because it is not a physical reality but rather a social construction, in which each individual looks from the perspective of his or her own knowledge, skills, and interests. However, there are several common components, such as the reference to three areas of responsibility: economic, social, and environmental, without forgetting the interlocutors or stakeholders to whom the company is responsible, as well as the voluntary nature of these responsibilities. The integrated nature of CSR is also present in the strategy, policies, and operations of companies in order to adjust to social pressures and achieve a legitimacy that guarantees success and survival (Scott 1995; Oliver 1991; DiMaggio and Powell 1983). CSR can be seen as that set of responsibilities that the company assumes before society, which will change, because the circumstances and the sensitivity of the actors change.
Consequently, a universal definition of CSR is inherently problematic in view of the national differences in business systems, and the resulting differences in the contexts and functions of the various stakeholders in the same (Matten and Moon 2008). CSR has the characteristic of being a truly global idea, and its global features could give rise to the assumption that national dynamics are secondary or even irrelevant; however, while CSR may be of a global nature, recent research suggests that it is applied differently according to political, economic, social, legal, and cultural contexts (Gjølberg 2009).
Commonly, the term ‘sustainability’ is associated with caring for the environment, although the company and the environment are obliged to understand each other; that is, it is not conceived that a company that is considered as sustainable neglects its environmental processes; there are two other areas in which an organisation must be sustainable: the social one—with the aim of achieving an adequate relationship and fluid communication with the company’s stakeholders, as well as the defence of the labour rights of its employees, and the economic one—with the aim of achieving a transparent management and correct distribution of the wealth that is generated. In this paper, based on panel data of 6600 observations from 600 listed firms arising from 18 countries, we show the national discrepancies in sustainability practices based on protection of the environment and social cohesion during the 2004–2014 decade. Through multivariate statistical methods, which enable us to identify the main underlying characteristics of a large volume of data and prioritise the visual results in search of a more accessible language for researchers in the field of global sustainability, we trace the results only in a factorial plane, representing the consensus structure of all of the years and facilitating the visualisation of countries’ behaviour patterns in reference to the development of their CSR practices. More specifically, sustainable commitment at the national level is studied, focussing on the virtues and deficiencies according to the country of origin of the companies. (i) As a first step, through an X-STATICO analysis, the relevance of worldwide CSR practices is characterised, with the aim of establishing which practices are commonly the most demanded and developed by all companies, and finding those social practices with an importance similar or close to environmental ones. (ii) Secondly, based on an analysis of Tucker3, which examines the relationships between deeper interactions, the development and evolution of these practices is determined according to the country of origin of the companies, showing the importance of national identity in the development of them.
So, the main contribution of this document to the literature is the identification of the virtues and deficiencies in national sustainability systems, which will allow recognising where it is most necessary to adopt or improve CSR practices. Thus, the primary objective of the study is the usefulness of these data as an essential tool for politicians and public managers in the decision-making processes, facilitating the design of more effective policies through knowledge of the main concerns and expectations of the countries that lead to a greater CSR commitment.
The paper is organised into five additional sections following the introduction. The following section describes the theoretical background, focussing on the influence that the country of origin effect has on the sustainability of the company through international comparative studies. The next section details the data sample and describes the methodology used, providing a novel new way to map national CSR patterns with panel data sets. We continue to show the empirical results obtained with important national discrepancies on practices of corporate social responsibility, their discussion, and present the main conclusions of the study.

2. Theoretical Background

The ideological traditions and distinctive national institutions still shape and channel crucial corporate decisions; thereby, institutional theory is based on the assumption that, with respect to the same issue, two organisations may embrace different responsibilities, including when they operate outside their country of origin (Pauly and Reich 1997). Corporations are embedded within a broader social structure that has been long established within institutional theory; it encompasses different types of institutions, and exercises a significant influence on the decision making of companies (Gjølberg 2012; Ioannou and Serafeim 2012; Campbell 2007). Whitley (1992). We refer to this as the ‘country of origin effect’, where the national origin of that corporation plays an important role in the commitment level to CSR.
There is also extensive and important research focussed on the study of the influence of the characteristics of the institutional environment on the sustainable behaviour of companies, which, through comparative studies at an international level that address CSR issues, has found substantial differences in the practices of CSR between countries, as systematically explained by coercive and normative institutional pressures (Martínez-Ferrero and García-Sánchez 2016). Normative pressures emanate from the cultural values of the business environment, since, as a result of different cultural conditions—which imply different norms or forms of behaviour—local stakeholders show different expectations regarding business behaviour (Bustamante 2011). These investigations conclude that companies are more likely to behave in a socially responsible manner and show that they are more sensitive to the publication of CSR reports in feminist and collectivist societies, and, to a lesser extent, in societies with low power distance (in societies with low power distance, people strive to equalise the distribution of power and demand the justification of inequalities of power; on the contrary, a high power distance implies that it is distributed vertically, in an unequal way), orientation in the long term, tolerance to uncertainty, and high values of indulgence (Esteban et al. 2017; García-Sánchez et al. 2013; Ringov and Zollo 2007). Coercive pressures derive from rules, standards, or laws that determine the legal system of a country for the development of sustainability practices. There are numerous studies that evaluate the influence of these pressures on sustainable business behaviour, and conclude that companies located in countries regulated by civil law and with strong application of the law show greater interest in CSR practices and the dissemination of information than those governed by common law. The studies also show that those who operate in institutional environments with a large and developed legal system oriented to the protection of interest groups are more likely to act in a socially responsible manner (Amor-Esteban et al. 2017; García-Sánchez et al. 2016; Kolk and Perego 2010). In addition, other national institutional conditions, such as regulatory effectiveness, competitive conditions, and civic engagement, are very important factors and influence the CSR penetration (Halkos and Skouloudis 2016).
However, institutions are often associated with the characteristics of the country, which are collectively known as the national identity or country of origin. Ideological and institutional legacies, as well as historical experience, direct the practices and strategies of organisations (Pauly and Reich 1997). On the other hand, Filatotchev and Stahl (2015) argue that multinational organisations endeavour to meet the demands of local stakeholders and at the same time achieve global consistency in their CSR profile. Therefore, the corporations’ approach to CSR is influenced by both the local and global institutional context, resulting in a ‘transnational’ approach, where the expectations of local and global stakeholders are balanced. Several researchers (Campbell 2007; Pauly and Reich 1997; Whitley 1992) have emphasised that distinctive ideological traditions and lasting national institutions determine corporate decisions. Consequently, the underlying nationality of the company is considered a key factor to explain the nature of the organisations’ commitment to CSR. In addition, most global multinationals are strongly rooted in their country of origin (Noorderhaven and Harzing 2003).
This document does not affirm that the effect of the country of origin is the only factor that explains the CSR variation, but proposes that differences at the national level are a key factor that must be taken into account in understanding why organisations differ in their approach to CSR. This assumption is based on multiple examples of comparative studies between different countries, which illustrate clear differences between the interpretation and practice of CSR (Dypdahl 2015). Thus, behind this approach, Matten and Moon (2004), Habisch et al. (2005), Campbell (2006), and Lenssen et al. (2006) were the first authors to theorise about the relationship between CSR and national contexts. Matten and Moon (2004) suggested that CSR is applied differently according to the legal, economic, cultural, and political context in which the company operates; Habisch et al. (2005) corroborated this fact in their book Corporate social responsibility across Europe. Campbell (2006) demonstrated that the characteristics of the national context impose different expectations and pressures on business behaviour, so that companies develop their CSR practices according to these specific demands. Lenssen et al. (2006) mapped CSR patterns to national economic, social, and political institutions, since the different pressures faced by companies causes them to vary their behaviour in order to comply with the laws and professional guidelines of their environment.
In this sense, Welford (2004) showed that companies care about what is most important in their countries; thus, Hong Kong companies emphasise the internal aspects of CSR; Singaporean firms focus on external CSR; and Norwegian organisations give preference to social policies. More specifically, several investigations reveal these differences between two regions, a limited number of countries, or only one dimension. Maignan and Ralston (2002) pointed out that United States (US) companies have a lower commitment than European companies to environmental matters; however, they focus on codes of ethics and philanthropic CSR more broadly than the European firms. Aaronson (2003) showed that United Kingdom (UK) companies offer more extensive disclosures than US companies, since they have made national and global CSR a priority. Baskin (2006), in his study on CSR in emerging markets, and Jamali et al. (2009), in their assessment of managerial perspectives for CSR in three neighbouring Middle East countries (Lebanon, Syria and Jordan), support the institutional interaction between state policies, the discretionary activities of the private sector, and civil society activism to shape the penetration of CSR in national contexts. Tang and Li (2009) argued that there are significant differences between rule-based and relationship-based societies; in the former, companies tend to demonstrate a greater commitment to CSR. So, for example, among the BRIC countries (Brazil (B), Russia (R), India (I), and China (C)), companies from India, which is a rule-based society, take first place in good corporate practices, whereas the Chinese organisations, as China is one of the most authoritarian, occupy last place. Witt and Redding (2011) studied the social variations in CSR values of the top executives of five economies (Germany, Hong Kong, Japan, South Korea, and the US) and stated that the conceptualisation of CSR and the approach of stakeholders differ among the main executives of different institutional environments. Florini and Saleem (2011) and Grauel and Gotthardt (2016) showed the differences between countries in relation to the activities related to climate change, and according to their origin, legal regulation, and political systems, and pointed out that Japan, Spain, and France present very contrasting institutional characteristics with diverse judicial and legal traditions. Ariztía et al. (2014) presented how Chile and Brazil, as old developing countries, show an increasingly important role of CSR discourses and practices with ethical consumption activities.
The empirical examples suggest that CSR is influenced by the country of origin, and that the individual characteristics of the company are decisive for CSR also when the company has supervised operations (Bustamante 2011). These specific characteristics of the company, which are also known as ‘company identity’ or ‘company personality’, are considered a crucial component that influences the company’s CSR agenda. Thereby, the first hypothesis of our research defends that there are significant differences in CSR business practices between companies based in different countries. Thus, Hypothesis H1 is proposed as follows:
H1: 
The country of origin of the companies determines the level of development and commitment to CSR practices.
In addition, the historical experience of the ideological and institutional legacies leads to thinking about the existence of similar patterns of business behaviour in companies whose headquarters are located in geographically close countries, and the existence of greater discrepancies in their profile or approach to CSR at greater distances among them. Therefore, Hypothesis H2 is proposed as follows:
H2: 
There is a high level of homogeneity in CSR practices implemented by companies whose country of origin is located within the same continent, and there is great geographical proximity between them.
CSR as a corporate practice has been widely recognised in the last decade, and organisations around the world are increasingly committed to CSR, striving to achieve legitimacy for their corporate operations. This document, based on comparative multivariate methods, presents a new and novel way of mapping national CSR patterns and delves into the study of sustainable business behaviour by determining the development and evolution of CSR practices from different perspectives—environment, human rights, employees, stakeholders, ethics—according to the country of origin of the companies. This way characterises the advantages and barriers offered by each country during the 2004–2014 decade, showing the importance of national identity in the development of these practices. In addition, it analyses which social practices are most in demand, comparing their development with the environmental ones that naturally constitute the central part of sustainability.

3. Materials and Methods

3.1. Population and Sample

The target population considered corresponds to the largest listed companies internationally because they are the most active in terms of sustainability. The information was obtained from the database of Ethical Investment Research Services (EIRIS). We selected those companies with complete information and with a criterion of inclusion of a minimum of 10 companies per country during the 2004–2014 decade, which resulted in a final sample of 6600 observations of 600 listed companies from the main developed economies (Europe, 50.50%; North America, 25.83%; Japan, 16.67%; and Australia, 7%). Given that the objective of this work is to study the national root of sustainability, companies are grouped by their country of origin, giving rise to 18 different countries (see Table 1). Noteworthy is a bias in favour of companies from Japan, the United Kingdom, and the United States in line with the distribution of large listed companies available in EIRIS. The large firms are the most active in CSR and are models for small firms that operate in their country of origin; therefore, this information should not generate representativeness problems (Martínez-Ferrero and García-Sánchez 2016).
It is important to consider the time factor, inasmuch as the period 2004–2014 marks the decade in which companies have assumed greater commitments in terms of sustainability. This period is considered as the most prolific period of corporate and academic CSR, due to the effect of technological development and the consequent access to information on corporate behaviour and the different pressures that actors can exercise (Martínez-Ferrero and García-Sánchez 2016).

3.2. Variables

The real sustainability practices that will be studied in depth and with which we will characterise the strengths and weaknesses of each of the countries studied in terms of sustainability are divided into two dimensions: environmental and social. The measures selected to quantify the sustainable business behaviour come from a government agency of external evaluation of known reputation under the name of EIRIS (Ethical Investment Research Services). EIRIS evaluates organisations’ integration of social, environmental, and governance factors into their strategies, operations, and management—with a focus on promoting economic performance, responsible investment, and sustainable value creation. The evaluation takes into account the efficiency of managerial systems in implementing environmental, social, and governance objectives, in other words, the company’s ‘sustainability objectives’. This database provides multiple indicators in the different areas of sustainability, many of which are oriented to specific countries or certain activity sectors; however, a set of these measures is available for all countries and sectors, which are used on a recurrent basis to evaluate the environmental and social sustainable performance by numerous researchers (e.g., García-Sánchez and García-Meca 2017; Martínez-Ferrero and García-Sánchez 2016; León 2015; Boudt et al. 2013).
This set of measures consists of 28 CSR practices (see Table 2) that quantify the sustainable commitment of companies in a reliable way through the EIRIS data base, as well as in a precise way through each practice evaluating the level of commitment of the company on a scale of 0 to 4 (where 1—weak, 2—moderate, 3—good, and 4—exceptional). This quantification is also complete and balanced, since its evaluation includes the different approaches of the companies. These include the following. (i) The care and protection of the environment: the EIRIS agency makes reference to the preservation of the environment in relation to the waste disposal, decontamination, energy expenditure, or climate change through the valuation of the policies, systems, and reports, as well as the quantification of the impact of its commercial processes. (ii) Safeguarding human rights: the practices are aimed at evaluating the policies, systems, and reports of companies in the adoption of codes of conduct related to the elimination of forced or child labour, discrimination, or working conditions. (iii) The defence of employees’ labour rights: these measures correspond to internal CSR, encompassing initiatives aimed at promoting equal opportunities and improving the quality of work, both contractual and physical, such as practices aimed at to maintain good health and safety conditions, employee participation, and work for the disabled or training. (iv) The deal with stakeholders: these variables refer to relationships with the external part of the company, such as practices aimed at maintaining good relations with customers, suppliers, consumers, or the community, among others, as well as encompassing initiatives that inform the impacts on the present and future of the company; in addition, they also refer to practices for fluid communication with all stakeholders, establishing a mutually beneficial relationship. (v) Business ethics: these refer to the policies and systems in place to combat political corruption and the establishment of ethical values that must be fulfiled in all areas of the company.

3.3. Statistical Multivariate Methods

3.3.1. X-STATICO Analysis

Simier et al. (1999) and Thioulouse et al. (2004) presented what they call the STATICO method, which, in reality, is a combined study of a co-inertia analysis and a STATIS. In this research, we perform an X-STATICO analysis (co-inertia and X-STATIS, which are described below). The X-STATICO method is an efficient tool for the simultaneous analysis of a succession of pairs of tables. The flexibility of this technique comes partly from the co-inertia analysis, which maximises the squared covariance between the values of the individuals according to two different sets of variables. Figure 1 shows the procedure scheme on which the X-STATICO analysis is based.
The data are arranged in two successions of T tables where t refers to the years 2004–2014; the first succession of X t tables correspond to the social commitment, and each X t matrix carries the information of n individuals (countries) measured on p variables (social practices); another succession of Y t tables with information on the same n individuals measured on q variables (environmental practices). In this way, we perform a co-inertia analysis (Dolédec and Chessel 1994) for each pair of tables Y t and X t ; this is a multivariate method that explores the covariance between two sets of data, and allows the finding of the common structure between two groups of variables on the same individuals. This is achieved by finding the successive axes of the two sets of data with maximum covariance, obtaining a succession of Z t crossed tables of q   x   p dimensions; that is, each table contains the covariance between the environmental and social performance of countries, Z t = Y t X t .
The next step is to perform an X-STATIS analysis (Jaffrenou 1978) on these Z t tables, where the rows refer to the practices that evaluate the environmental commitment of the companies and the columns correspond to those that measure their concern for social welfare (Figure 2). The STATIS family methods (Structuration de Tableaux A Trois Indices de la Statistique) are data analysis techniques that have been developed to extract the relevant information stored in three-way data tables; that is, several two-way matrices indexed by time (Escoufier 1976; L’Hermier des Plantes 1976). The essential idea of the STATIS methods is to look for a common structure to all matrices, which is called structure consensus or compromise; for it, scalar products are made between matrices capturing the statistically significant information. The X-STATIS is a technique belonging to the STATIS family, with a peculiarity, since, although it is only applicable to the set of matrices constituted by the same individuals and the same variables in T times or occasions, it has the advantage of not losing the original information, since it does not use operators. Instead, it works directly with the matrices, which also makes its procedure easier and allows more representations. This method follows a three-stage scheme: (i) the interstructure study, (ii) the compromise analysis, and (iii) the intrastructure study.
  • The interstructure study: in the first stage, it is about studying the relationship between the different data tables, that is, a general comparison of the T data tables’ structure. For this, a matrix of vector covariances between tables is constructed, so that the element in row t and column l is C o v v (   Z t ,   Z l ) = T r a z a   ( Z t D q Z l D p ) , where Z t is the t-table of the sequence, and D q , D p are the metrics for the rows and columns, respectively. Applying a decomposition in singular values to this matrix, we can reduce the dimensionality and represent this information in an Euclidean subspace of low dimension, in which each data table (years) is represented as a point. The distance between points is associated with similarity; that is, two close points correspond to two years of similar characteristics, and, if we join these points to coordinates origin, we can visualise an estimate of said similarity in terms of the angles between vectors, associating acute angles with strong similarities.
  • The compromise analysis: the second stage consists in the compromise analysis, where, through the vectorisation of the Z t matrices, that is, a linear transformation that converts each matrix into a column vector, concatenating the constituent columns of each matrix one on top of the other; so, if we have T matrices, we have a new matrix of T columns and q x p rows, with q being the number of individuals (our environmental practices) and p being the number of variables (social practices) that, as we said, should be the same for each matrix. We call this matrix Z . From a decomposition in singular values of the matrix Z , we get a new matrix known as the Z V matrix, from which we extract the first column that contains the factorial loads of the first eigenvector—which carries most of the information—and provides us with the information that all the matrices have in common, and, unfolding this vector, we obtain the compromise matrix (C). This matrix synthesises the information of each one of the q individuals in the p variables for the T times or occasions, ‘filtering the noise’ and representing the statistically significant information: the stable structure of the data. If we apply a principal component analysis to this matrix, we can trace and interpret its structure, where environmental practices (rows of the compromise matrix) and social practices (columns of the compromise matrix) are represented, which refer to the information during the T times. With this information, we can interpret the relationships between the variables of two types (environmental and social) based on how all of the countries behave in them through the compromise analysis.
  • The intrastructure study: in the third stage, we study the intrastructure (also known as trajectories). The compromise matrix obtained in the previous stage allows representing the commitment positions of each of the elements (environmental and social practices) that make up the different tables. These positions correspond to the average positions of the same. This gives us a compromise space for the projection of the elements of each of the starting matrices, that is, the projection of the environmental practices (rows) and social practices (columns) of each year (each table) in the compromise subspace. Let V r be the first r eigenvectors of the compromise matrix. The coordinates of the rows of the Z t table are the rows of Z t D p Z r , and the columns are the rows of Z t D q U r , where U r are the first eigenvectors of C D p C D q . The trajectories provide information on the evolution of each of the elements (environmental and social practices), and show how each table differs from the stable structure. With all this information, we can determine the relevance of worldwide CSR practices, showing which practices are commonly the most demanded and developed by all companies, and find those social practices that are generally implemented within the company with a development that is similar or close to environmental practices.
The main advantage of this method is that it provides a compromise of co-structures; that is, it first verifies how the pairs of variables co-exist (co-inertia analysis) and then obtains a commitment structure that represents these relations and the trajectories during the 𝑇 times that show the evolution that is drawn on it. That is, the stable component of the variations in the relationships between the variables of two cubes is represented, which can be traced, and the graphical results can be very detailed.

3.3.2. Tucker3 Analysis

The Tucker3 model proposed by Tucker (1966) is the decomposition of data from a three-way array X = x i j t , which means that the t tablas (or matrices, which represent t conditions) have I rows and J columns, where the first mode consists of I subjects, the second is composed by J variables, and the third one makes reference to the T different times or conditions. The decomposition of this cube formed by the X t matrices has the following form (Kroonenberg 2008; Kiers and Kinderen 2003; Barbieri et al. 1999) (see Figure 3):
where:
  • A, B, and C correspond to each of the modes with I , J , and T dimensions, respectively, to describe the subject to analyse.
  • P, Q, and R refer to the number of components retained for each of the modes A, B, and C, respectively, with P I , Q J , and R T .
  • E corresponds to the residual matrix associated with the description of X .
  • G represents the central matrix known as the core matrix of P × Q × R . dimensions, G P × Q × R . This matrix represents the value by which the product of a single component is weighted, so that the value and sign of each element of this matrix provides information about the entity of the interaction between the components of the different modes. In addition, it contains the amount of variability explained by the combination of said components (P, Q, and R).
Decomposition can be formulated as a factorisation of the X I × J × T three-way data matrix, such that, every element of our starting data cube ( X ) can be decomposed with the following equation:
x i j t = p = 1 P q = 1 Q r = 1 R a i p b j q c t r g p q r + e i j t , i = 1 ,   ,   I ;   j = 1 ,   ,   J ;   t = 1 ,   ,   T
where:
  • a i p   b j q ,   and   c t r are the elements of the A I × P ,   B J × Q   and   C T × R charge matrices respectively, and p ,   q ,   r denote the number of components in the modes A ,   B ,   and   C .
  • e i j t is an element of the residual three-way matrix E , which denotes an error term associated with the description of x i j t .
  • g p q r elements weigh the products among the p components of the subjects (first mode, A), the q components of the variables (second mode, B), and the r components of the different conditions (third mode, C) and explain the interaction between the factors p ,   q ,   r of each of the modes. Those elements are stored in the core matrix G , of dimensions ( P × Q × R ). This matrix can be considered as a generalisation of the diagonal matrix of the eigenvalues obtained from the decomposition into the singular values of a two-way matrix (note that said singular value decomposition forms the basis of the generalisation of the methods for multiple-way arrays). In addition, the core matrix G is derived from the matrices of the three modes A I × P ,   B J × Q   and   C T × R as follows:
    g p q r = i = 1 I j = 1 J t = 1 T a i p b j q c t r x i j t
The first step in the construction of this matrix is to select how many components we retain in each mode. The first fundamental point is that the components that we are going to retain in each of the modes do not have to have the same dimension. Normally, in principal components, we conserve the first two; in this model, it does not have to, and this is the fundamental point, since we can not only analyse the information that comes in the first components, but also the information that comes after them; the information that these components contribute is where the new information is really located that explains the dynamics of the data and the reason for certain phenomena.
When selecting the P × Q × R model with which we are going to work, it is necessary to consider all of the combinations P × Q × R with P I , Q J y R T . There is no direct rule for choosing the number of components; we have to know the data and know that, since the more components we retain in each of the modes, the more complex we will have in the model, we must look at a great complexity of advantages and disadvantages. However, there are some restrictions incorporated in the model; in particular, the minimum product rule says that the product of the number of components in two modes must always be equal to or greater than that of the third modality, so that P × Q R ,   P × R Q   y   Q × R P .
Once all the possible combinations have been made, the combination that presents a sufficiently high percentage of explained variance and the simplest of the most stable ones is chosen. The sum of the number of its components is calculated for each of the models, S = P + Q + R , and, for each value of S , the one with the highest variance value explained is selected, or equivalently, a lower value of the residual sum of squares. In this way, we obtain a list in which each of the models has a value of S . In increasing order of S , the incremental quotient between the residual sum of squares and S is calculated for each of the models, and we only remain with those models for which their value of the incremental quotient is similar to the next, that is, the more stable models. Finally, we would select for our analysis that model of the stable ones with a lower value of S , that is, the simplest among the most stable. We show in Figure 4, by way of example, where the models positioned in the polygonal line (blue) are those with the smallest values in relation to the residual sum of squares (vertical axis) for each value of S (sum of components, horizontal axis); and the vertical line (purple) separates the most stable models (right) from the least stable models (left). So, for this particular case, the selected model would be the 3 × 2 × 3 for being the simplest among the most stable.
Once the number of components to be retained in each mode has been selected, that is, the values of P ,   Q   and   R , we perform the analysis for the simplified model. The first step is to interpret the elements of the core matrix G P × Q × R that indicate the strength or weight of the relationships between the components of the different dimensions or modes and provide a value in reference to the amount of variance explained. Therefore, we stayed with those elements that explain more information.
Once we have selected the elements of the core matrix that we are going to study, we interpret each of them (e.g., g 312 would be an element composed of the third component of the first mode, the first component of the second mode, and the second component of the third mode). So, when interpreting the relationships between individuals, variables, and times, it does not only have a place if the element of G presents a high value, but also the combination of the signs of the four factors of the term a i p b j q c t r g p q r . For example, if g p q r has a positive sign (+ g p q r ) and the product of the components p t h ,   q t h   and   r t h of the first, second, and third modes, respectively, is also positive; then, the general effect of the term g p q r ( a i p b j q c t r ) is positive. Symbolically, it is:
[ ( ± ) c o r e ] × [ ( ± ) P × ( ± ) Q × ( ± ) R ] = ± i n t e r a c t i o n
Next, we show a diagram for the interpretation of the elements of the core matrix (see Figure 5).
In this investigation, the data present a three-way structure, where the A mode of subjects corresponds to the countries of origin of large international companies; the B mode of variables refers to international practices that assess the level of sustainability of companies; and, the C mode of times is in relation to the years of study, which in this case is the 2004–2014 decade. The fundamental objective of the use of this methodology is to examine the relationships between deeper interactions, seeking to characterise each of the countries of origin of the companies in relation to the development of their CSR practices.
A simple way to understand the interactions is in a visual way, so that three sub-graphics are displayed, one for each mode. Each sub-graphic represents two components in one way, one horizontally and one vertically; the countries are represented by circular flags, and CSR practices and the years are represented by vectors, all of them linked to the origin of coordinates. So, when studying each element, we must take into account each of the signs, since this method not only allows us to study the interaction, it also enables us to assess whether it is positive or negative and which rows (mode A) are the ones that interact with which columns (mode B) and at what times or conditions (mode C):
Sign of the elements that appear in the core matrix→ (+/−) core
Sign of the elements in the studied component of the first mode A→ (+/−) P
Sign of the elements in the studied component of the second mode B→ (+/−) Q
Sign of the elements in the studied component of the third mode C→(+/−) R
Any of the three-way study methods provides a more complete view of the problem than the individual multivariate analyses, but if we also use these techniques in a complementary way, we can benefit from the advantages of each of them. In this way, if in the previous section, we described the use of one of the STATIS methods to capture the multivariate character of the data highlighting its stable part, now, with the Tucker3 method, we emphasise the dynamic part, i.e., what has changed. More specifically, the Tucker3 method allows us, through the study of deeper interactions than those studied with other techniques, to characterise in an individual way each of the countries of origin that are part of the sample, according to their strengths (positive interactions) and weaknesses (negative interactions) in each of the CSR practices under study. In addition, it’s possible to know if these interactions change during the study period, and if so, we can know specifically the years in which they occur.

4. Results

4.1. Characterisation of the Relevance of CSR Practices Worldwide

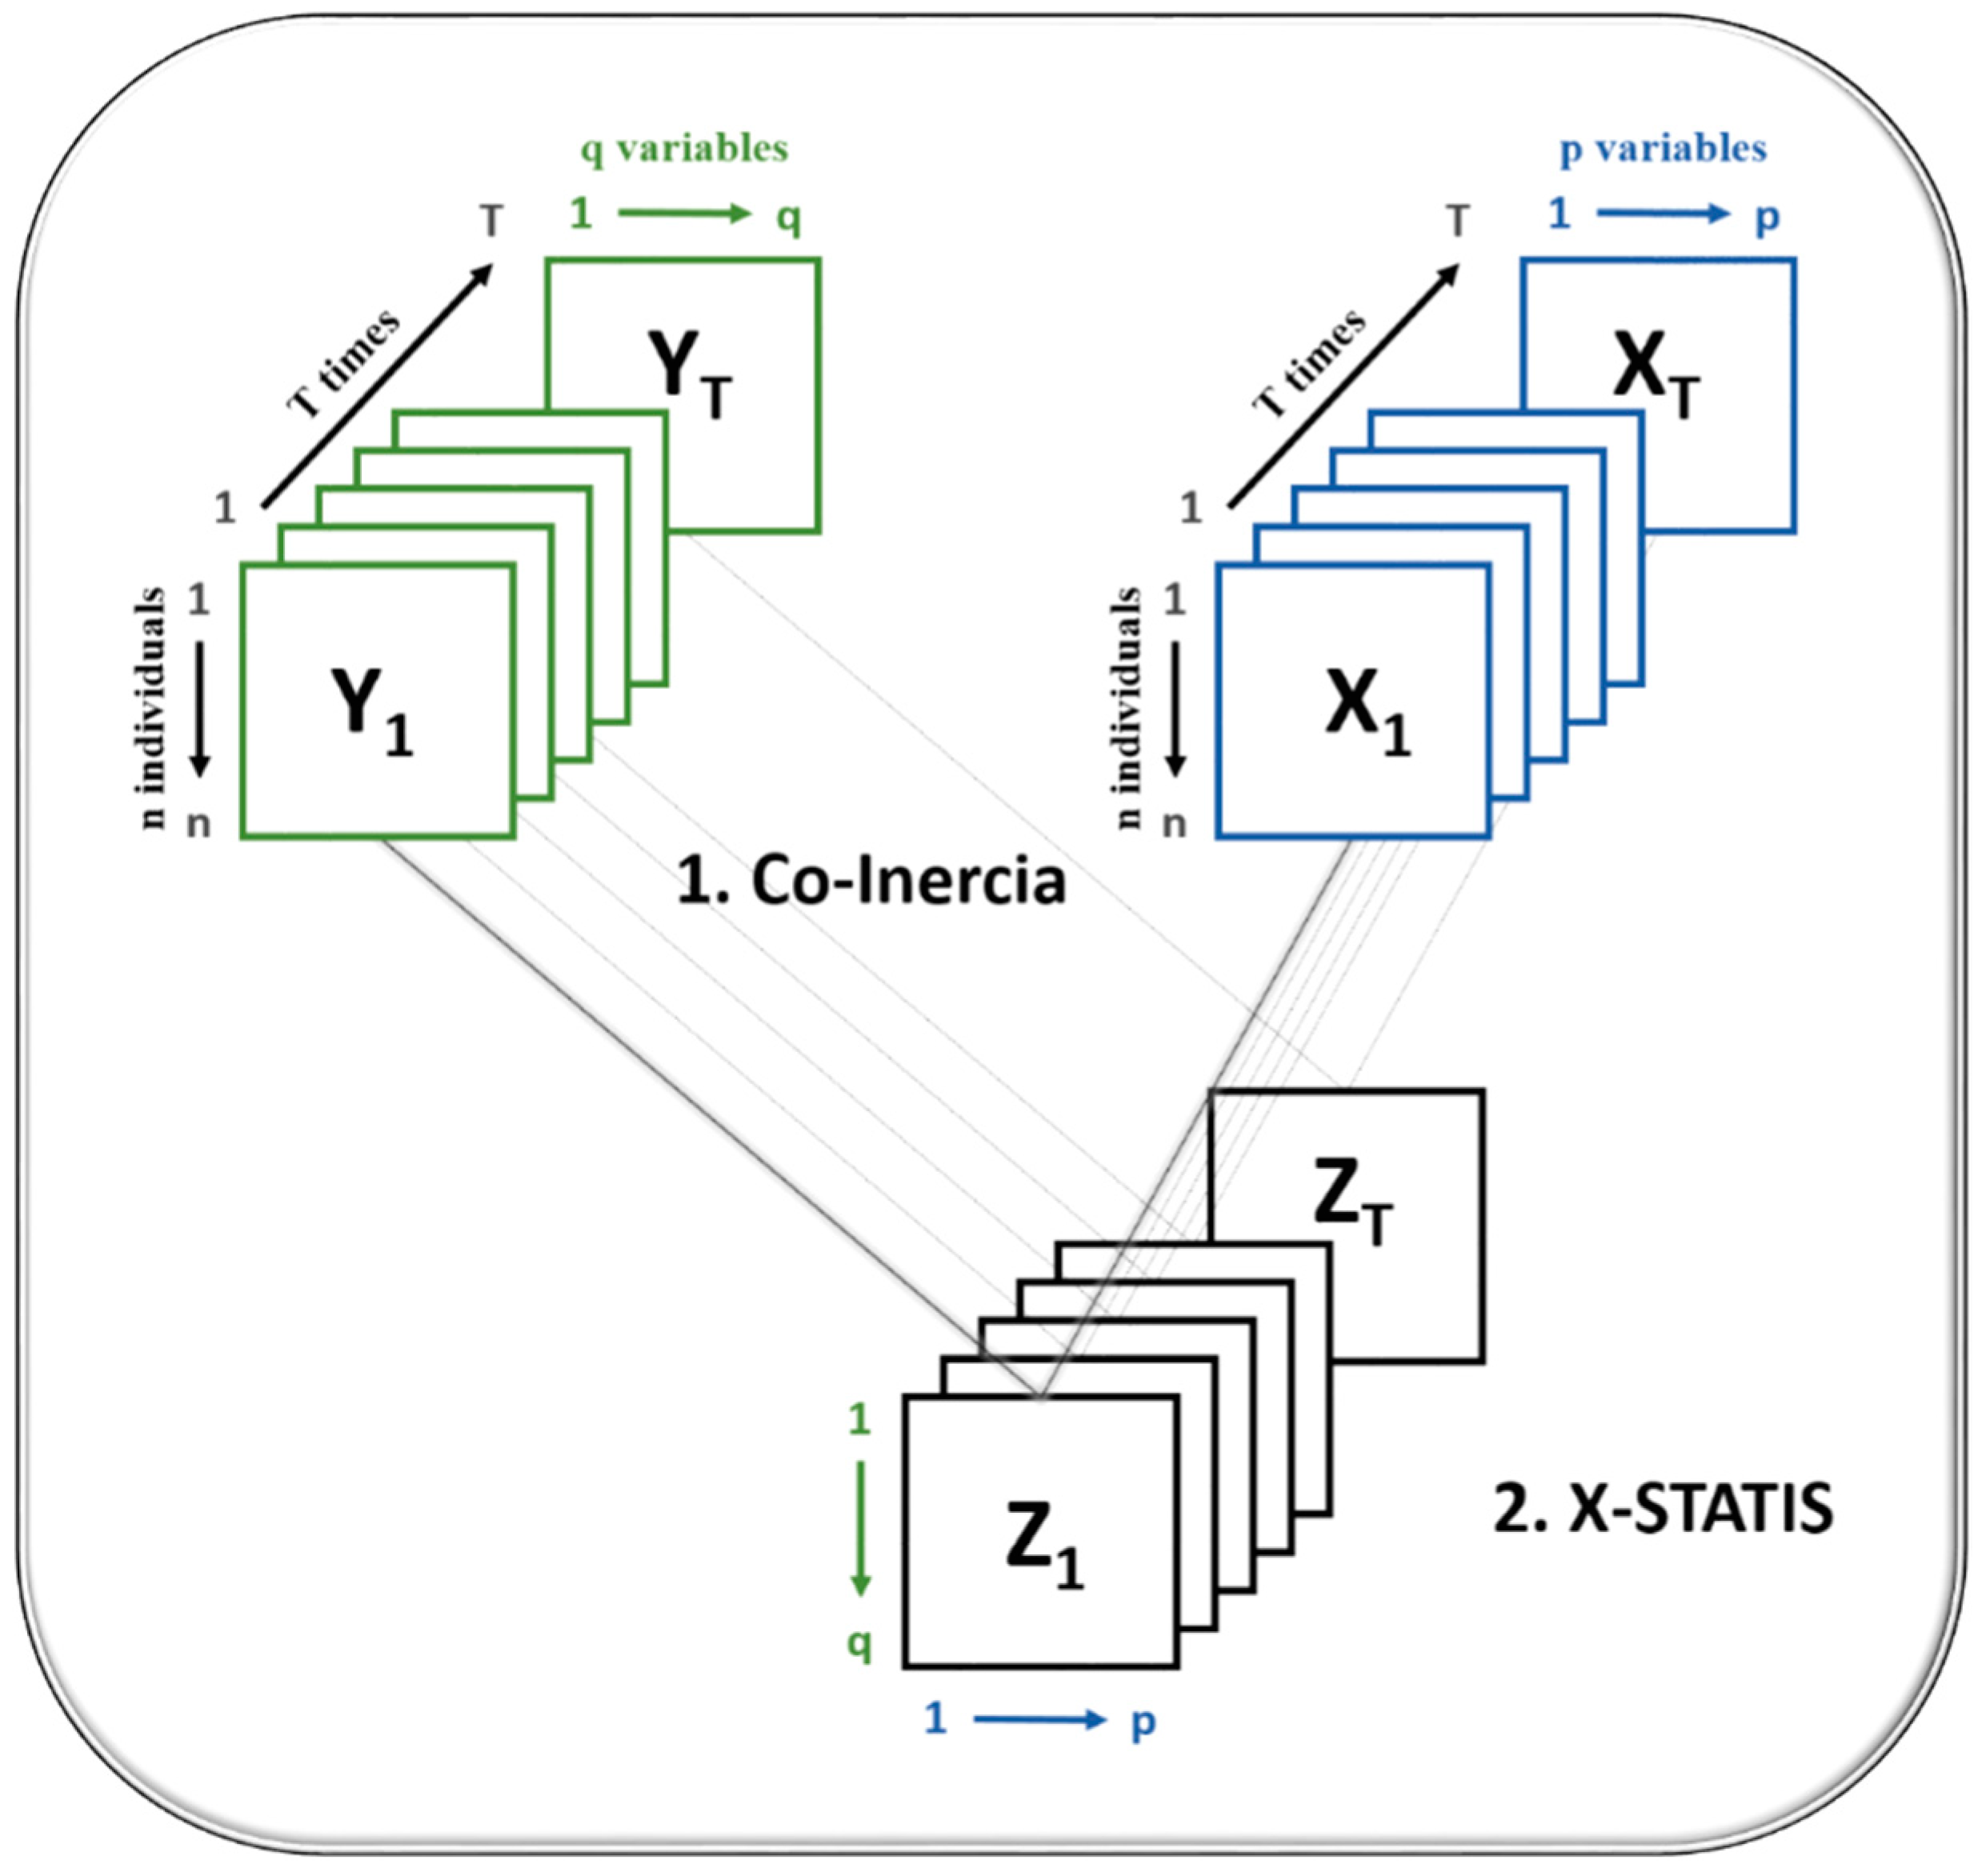
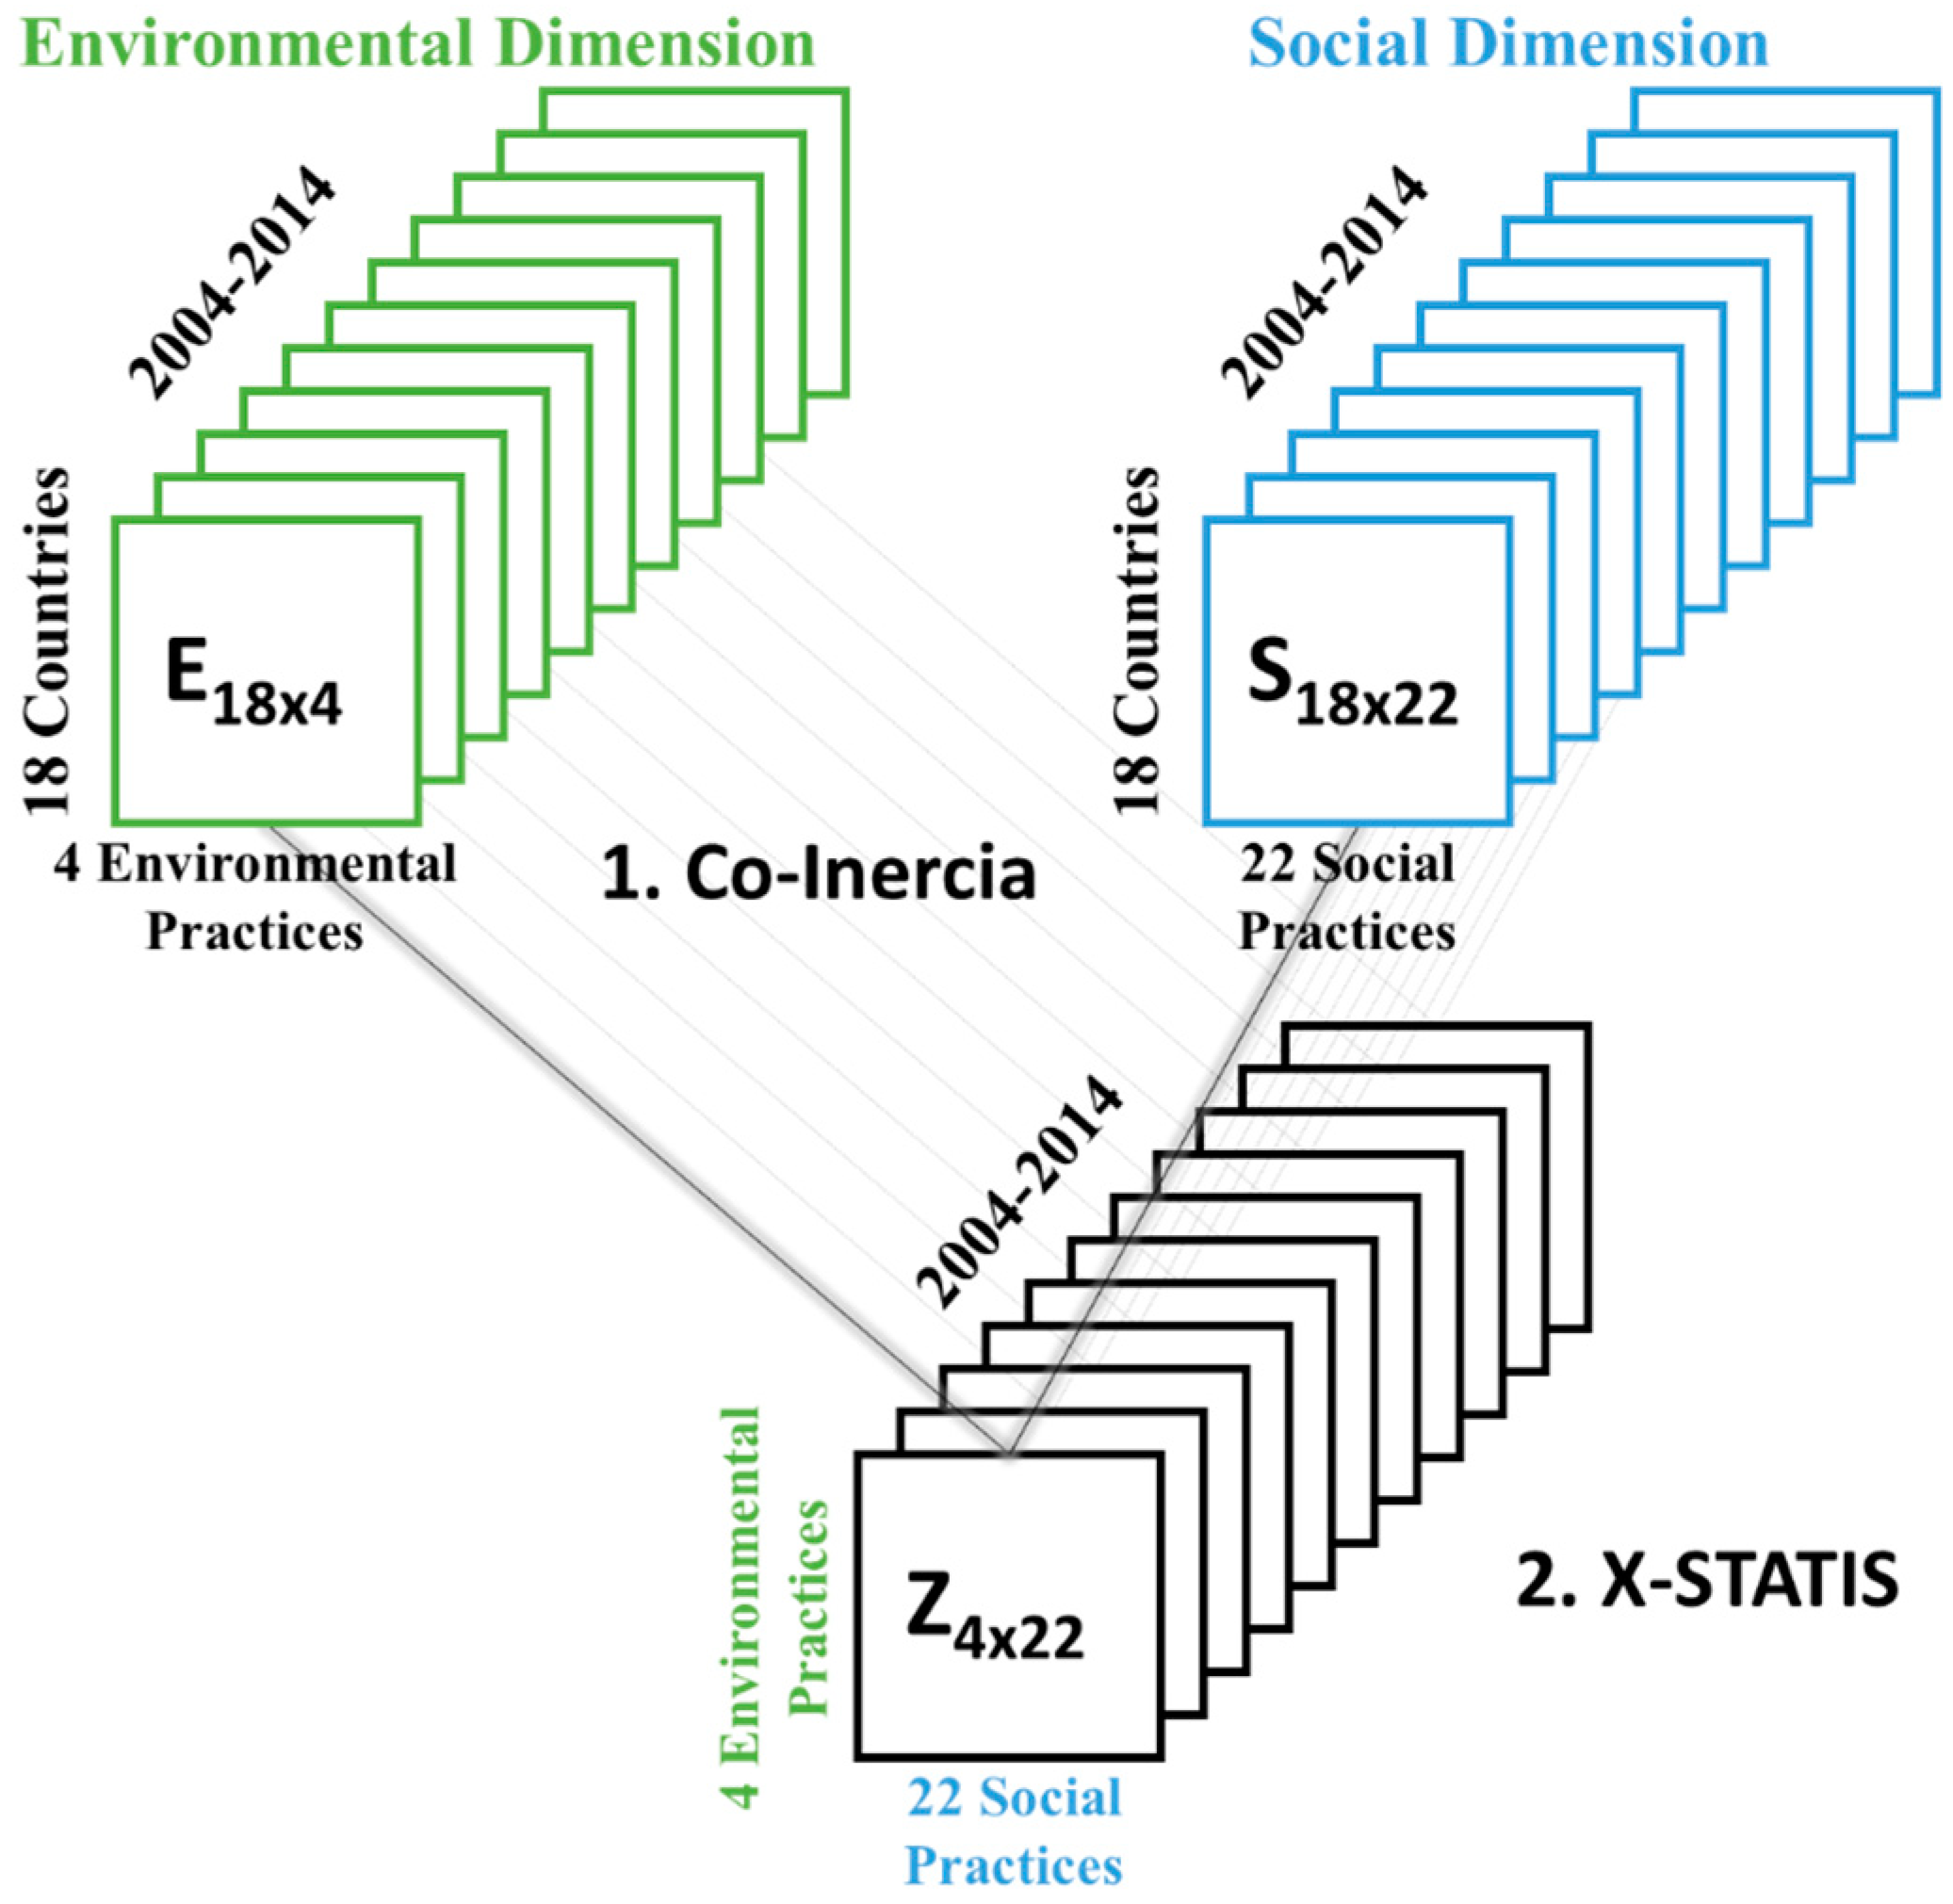
As a first step, through an X-STATICO analysis, we proceed to analyse the importance of the dimensions and sub-dimensions of the CSR considered, studying the similarities and differences that exist between each of the practices, taking into account their grouping in the established environmental and social dimensions. The data for this analysis are arranged in two cubes of 18 rows (the countries), with 11 repetitions (the years 2004–2014): a cube with four columns, corresponding to the environmental variables; and the other with 22 columns, indicating practices related to social welfare.
The first step of the X-STATICO analysis (
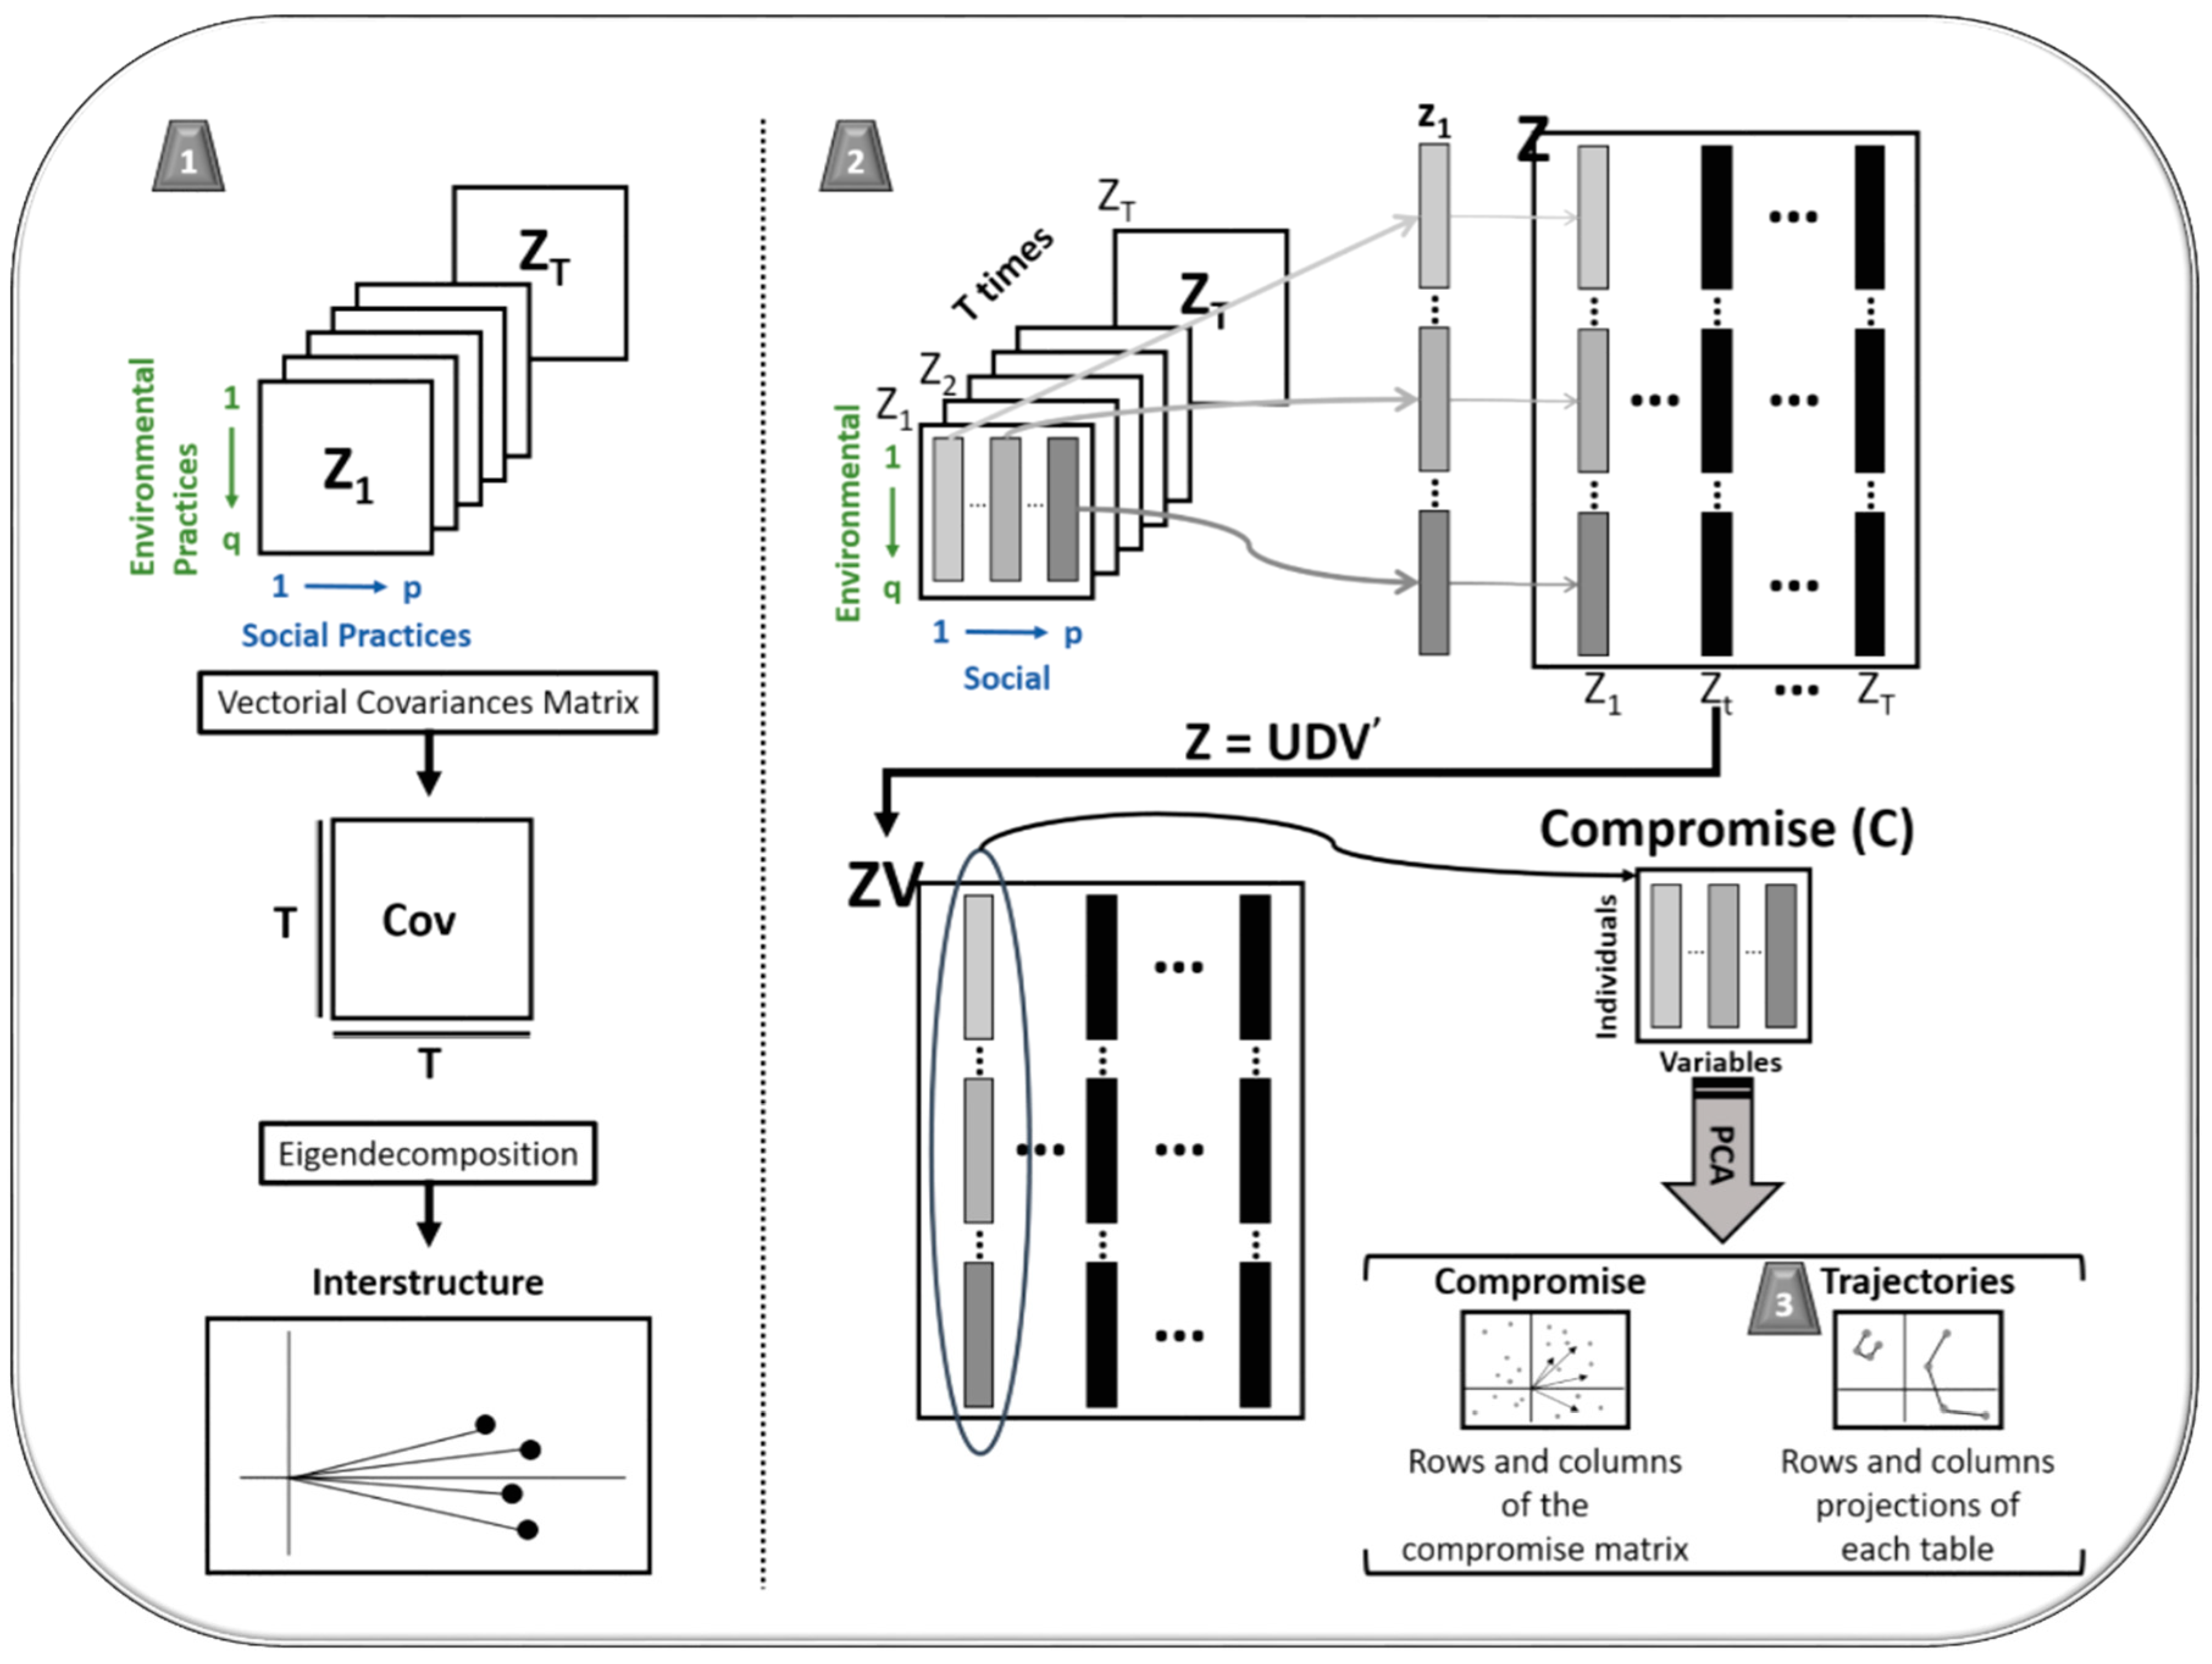
Figure 6) is the realisation of a co-inertia analysis between each pair of tables of both cubes. With this analysis, we seek to find the agreement established between the countries from the point of view of their environmental practices and from the point of view of their social practices, so that it provides us with a matrix for each year in which their rows will be the environmental variables and the social ones their columns, thus facilitating the vision of the most important relationships between each pair of tables. The second step consists of carrying out an X-STATIS analysis whose objective is to highlight the stable structure throughout this decade, that is, to find a ‘middle year’ to represent each of the practices and their relationships in this structure stable, and show how each of these moves away from said structure.
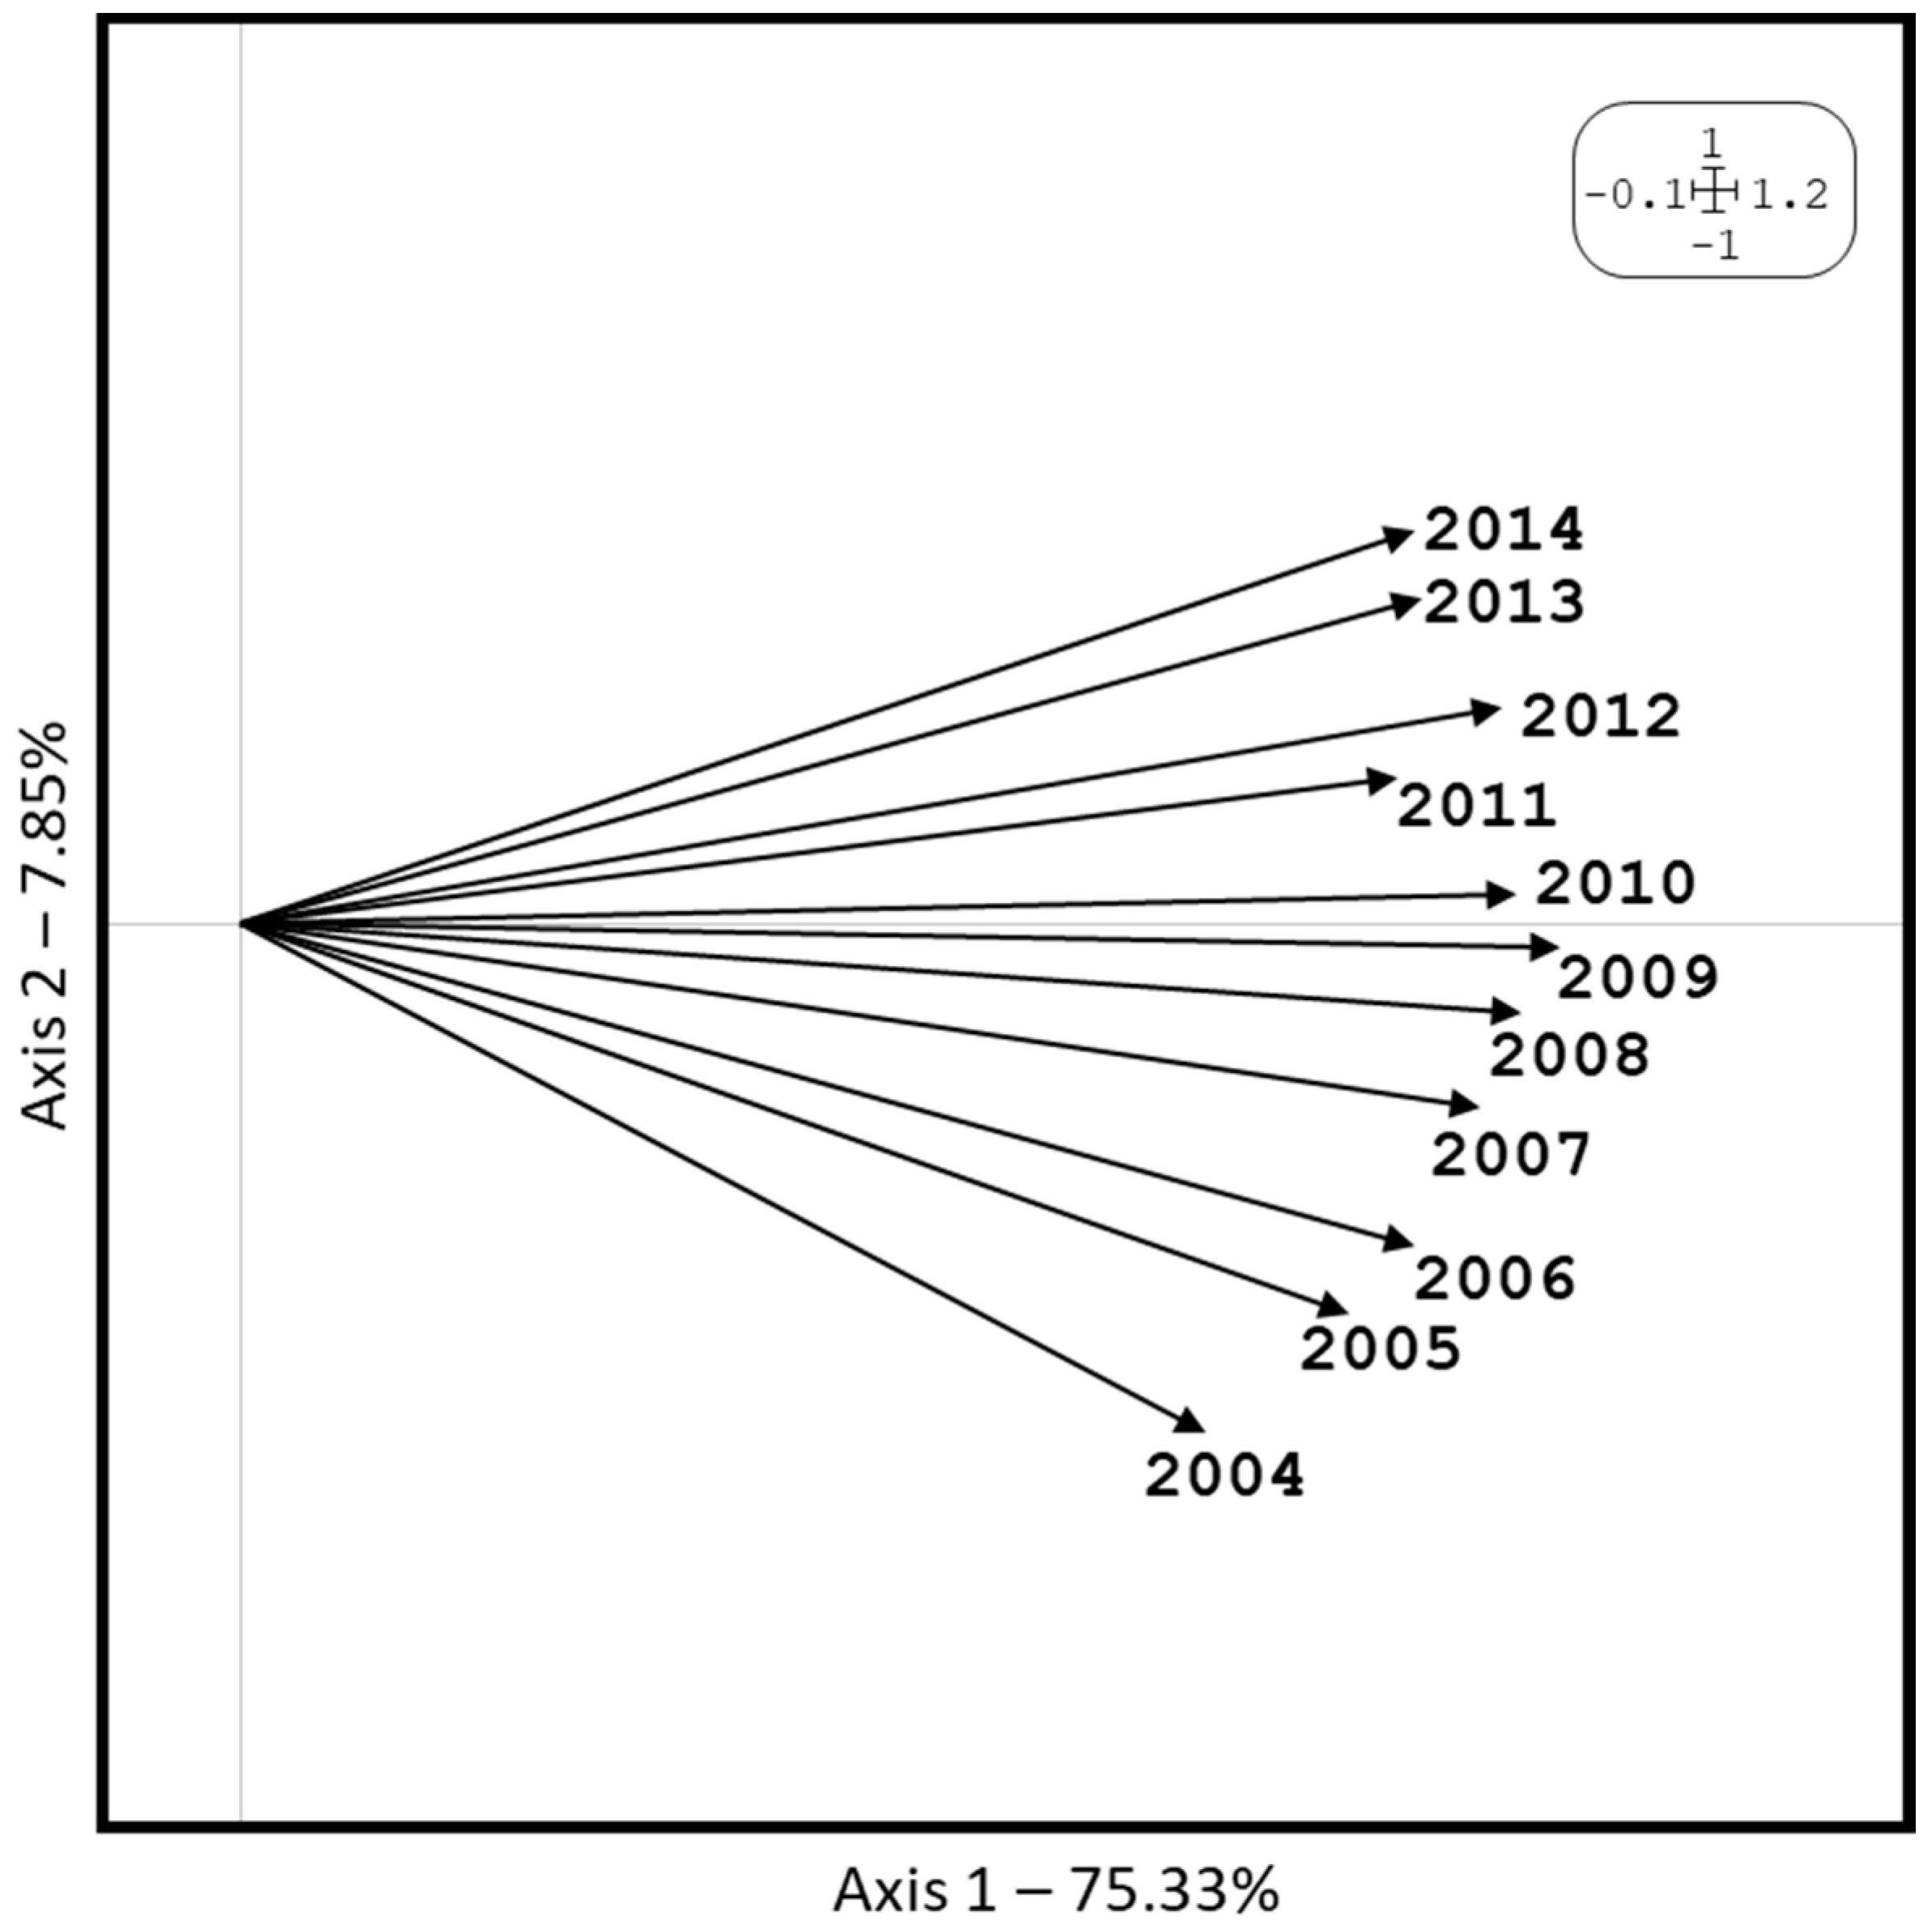
The first result that this method provides us is an interstructure study of the X-STATIS analysis after performing the co-inertia analysis, which allows us to reduce the dimensionality and represent the information in an Euclidean subspace of low dimension, in which each year (data table) is represented as a point, and joining these points to coordinates’ origin, we can visualise an estimate of said similarity in terms of the angles between vectors, associating acute angles with strong similarities (see Figure 7). This representation includes 83.18% of the total variability, and allows the interpretation of the similarities and differences between the years of study. This representation also indicates which of these acquire greater importance in the construction of the so-called compromise matrix, that is, those years that look more like an ‘average year’, which will highlight the stable part of the evolution of the data over time.
Acute angles between vectors can be observed, that is, strong similarities between years, produced in a gradual way, since the first year of the study, 2004, is located in the lower part of the figure, and as the years increase, they increase their position until they reach 2014, which occupies the highest position. Therefore, we intuit a constant growth in the commitment of company sustainability in this decade of study. Also, the ‘average year’, which was most similar to the stable configuration, is seen for the years 2009 and 2010, which were those closest to the abscissa axis. They were also the intermediate years of the study, since as we said, the relations are produced in a gradual way.
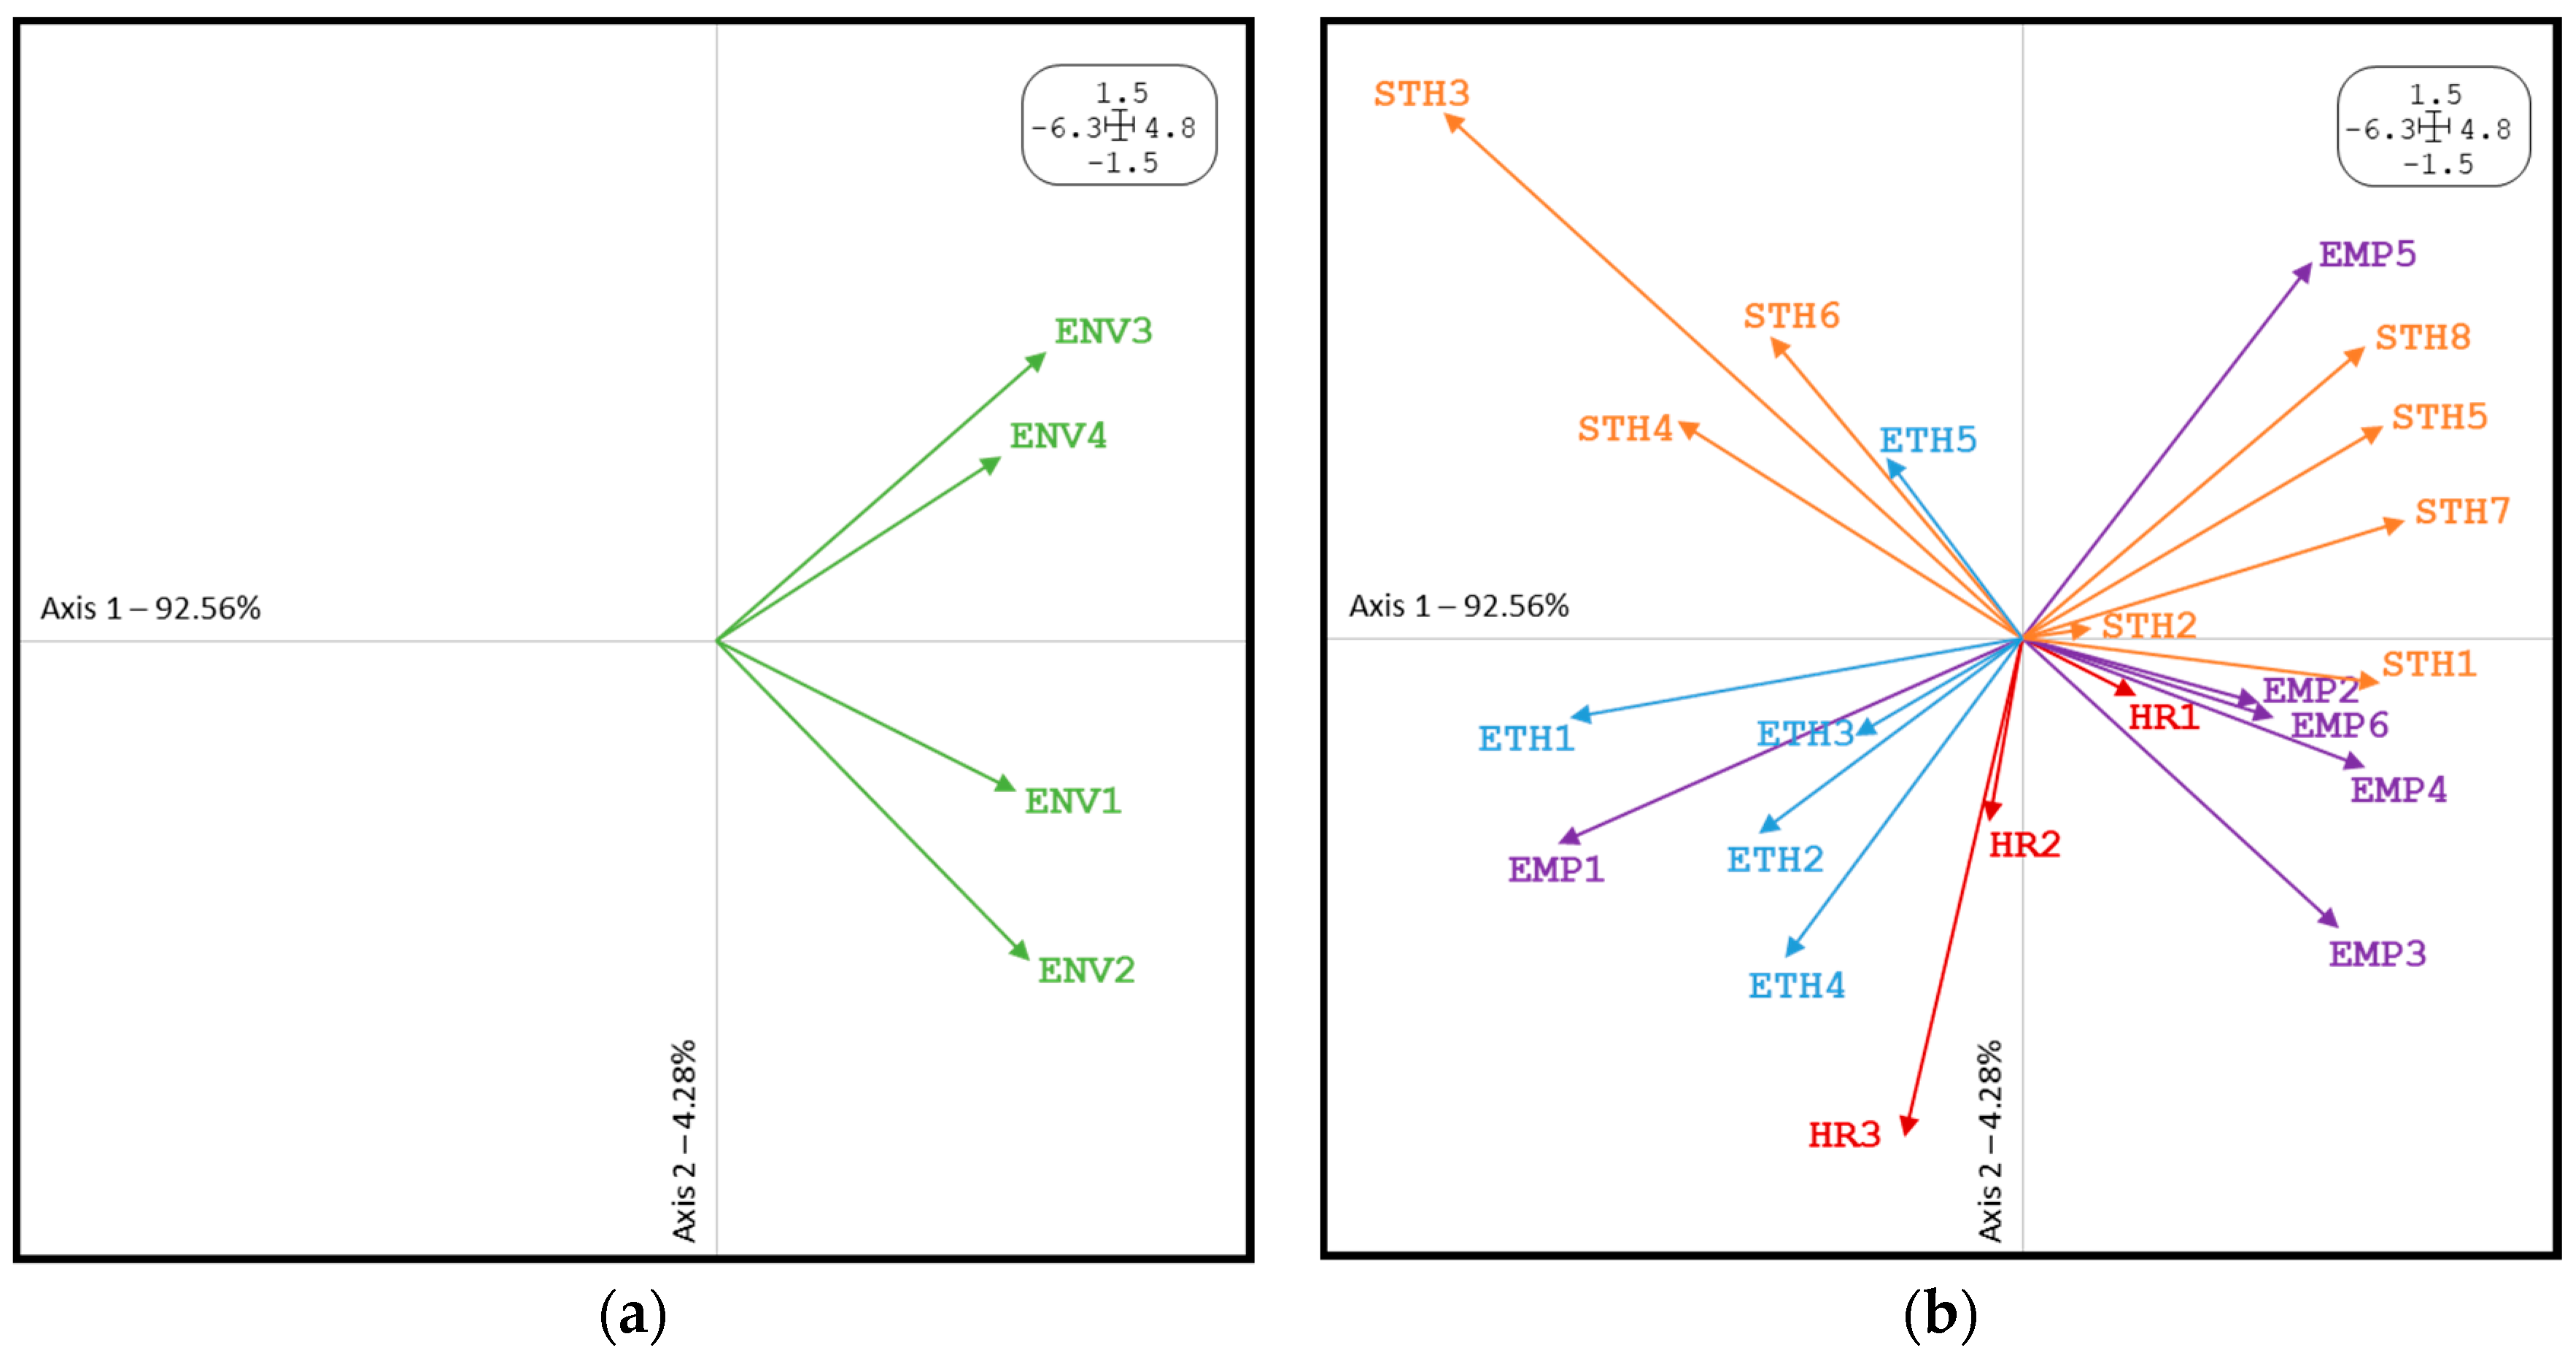
The next step is the attainment of the compromise matrix, which summarises all of the information provided by each of the configurations, since this matrix is a global summary of all of the tables. Therefore, in the subspace created by this matrix, the relationships between environmental and social variables can be interpreted according to how all of the countries behave in them. This representation (Figure 8) collects 97% of the information, and in it, two figures can be visualised. The first, which is located on the left, corresponds to the environmental variables, which are identified as green, and the second is located on the right, and refers to the variables of social type, distinguished by colours according to their sub-dimensions. Thus, the red vectors refer to human rights, purple correspond to employees, orange are in relation to stakeholders, and blue are those referring to business ethics.
In relation to environmental practices, all of them are located in the right semi-plane (quadrants I and IV); with this information, we understand that the countries with the most sustainable companies would be positioned on the right side next to these variables, since it would be difficult to conceive that a country denominated as sustainable presented low values in environmental practices. In reference to social practices relevance, it is argued that those countries with strong demands for environmental practices give similar importance to practices aimed at the participation of both employees (EMP4) and stakeholders (STH5) in the decision making of the company; to the health and safety of these (EMP3), equal opportunities systems (EMP2), as well as training (EMP5) and job creation (EMP6); systems for the good management of stakeholders (STH7) to maintain good relations with the community (STH1), and information disclosure (STH8); all of them located in the right semi-plane (quadrants I and IV) and maintain a direct relationship with environmental variables. The rest of the variables have an inverse relationship with the environmental ones, such as equal opportunities policies (EMP1) or policies on stakeholders (STH6), and those related to human rights and ethics receive less importance.
In general terms, companies from all over the world give greater importance to their environmental levels, their relationships with their stakeholders, and the labour rights of their employees. This is because companies strive to achieve global consistency in their CSR profile, combined with the need to meet the demands of local stakeholders and trust with their employees, in order to achieve a proactive image of good prestige and social reputation and therefore, the economic advantages associated with this commitment.
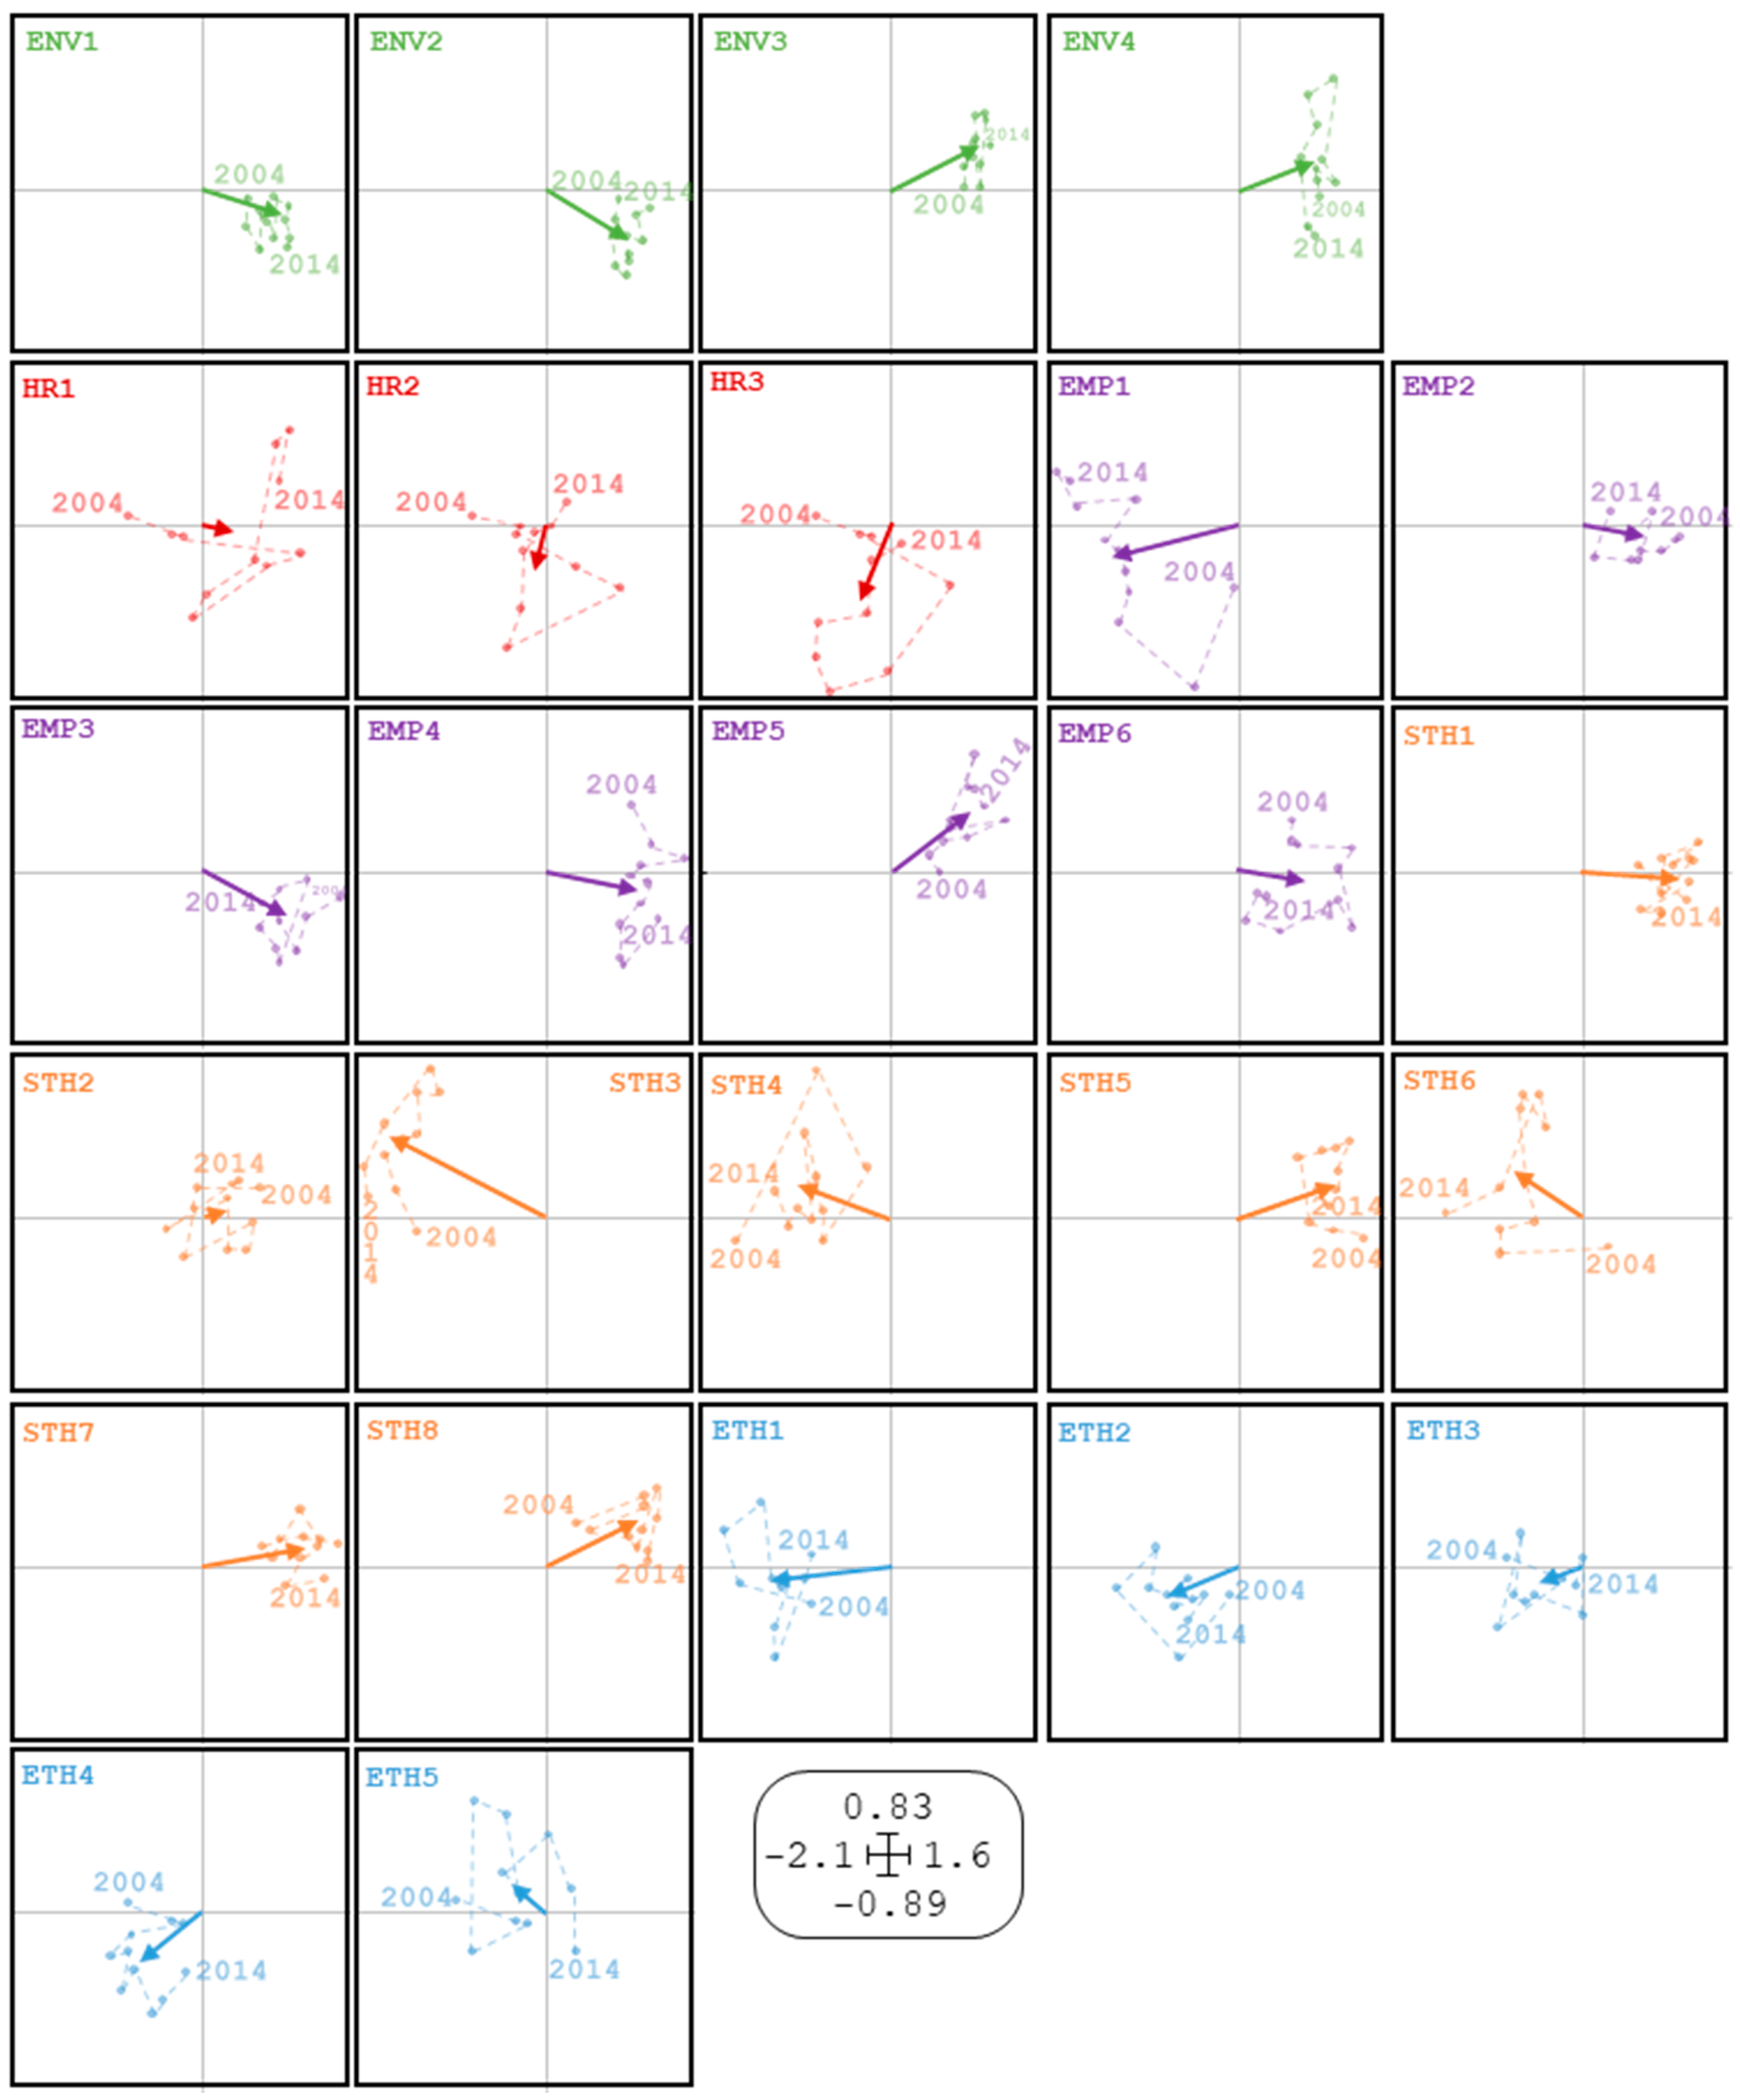
The third and last step of this analysis includes the intrastructure study, also known as trajectories, which allows us to interpret, by the projection of each one of the rows (environmental variables) and columns (social variables) of each of the starting tables (years) about the compromise subspace created, how these relationships vary over time. This representation (Figure 9) has been separated for each of the variables in order to obtain an individualised view; the vector represents the commitment position of each variable and the union of the points the trajectory from the first year of study (2004) to the last (2014). It can be observed that social practices that have a direct relationship with the environment, that is, those positioned in the right semi-plane (quadrants I and IV), show greater stability, with homogeneous locations occupying a similar position in the plane during this decade; this may be because these practices respond to the expectations of the stakeholders that are a very important part of the company and provide great reliability on the rights of their employees, creating an image of a responsible and concerned company on their part, internally as well as externally, workers, stakeholders, consumers, etc. Apparently, these practices have forged a place next to the environmental ones, acquiring an importance close to these, so that both consumers and any other interest group of the company no longer simply demand the protection of the environment, but also the development of systems oriented to labour rights and dealing with different stakeholders that arise from the employee relationships, transparent dialogue, and participation with stakeholders.
We find the opposite situation in the rest of variables, those located in the left semi-plane (quadrants II and III), which extend over a large part of the plane, presenting great instability during these years, which explains why these practices are not the main requirement of both internal and external groups of companies. Given the possibility that they are not entrenched in some countries, in general, these variables refer to business ethics and acquire less importance than the rest. However, they will certainly have a place in certain companies, a priori; it is to be assumed in less polluting companies, given the inverse relationship with environmental practices.

4.2. Characterisation of the Relevance of CSR Practices According to the Country of Origin

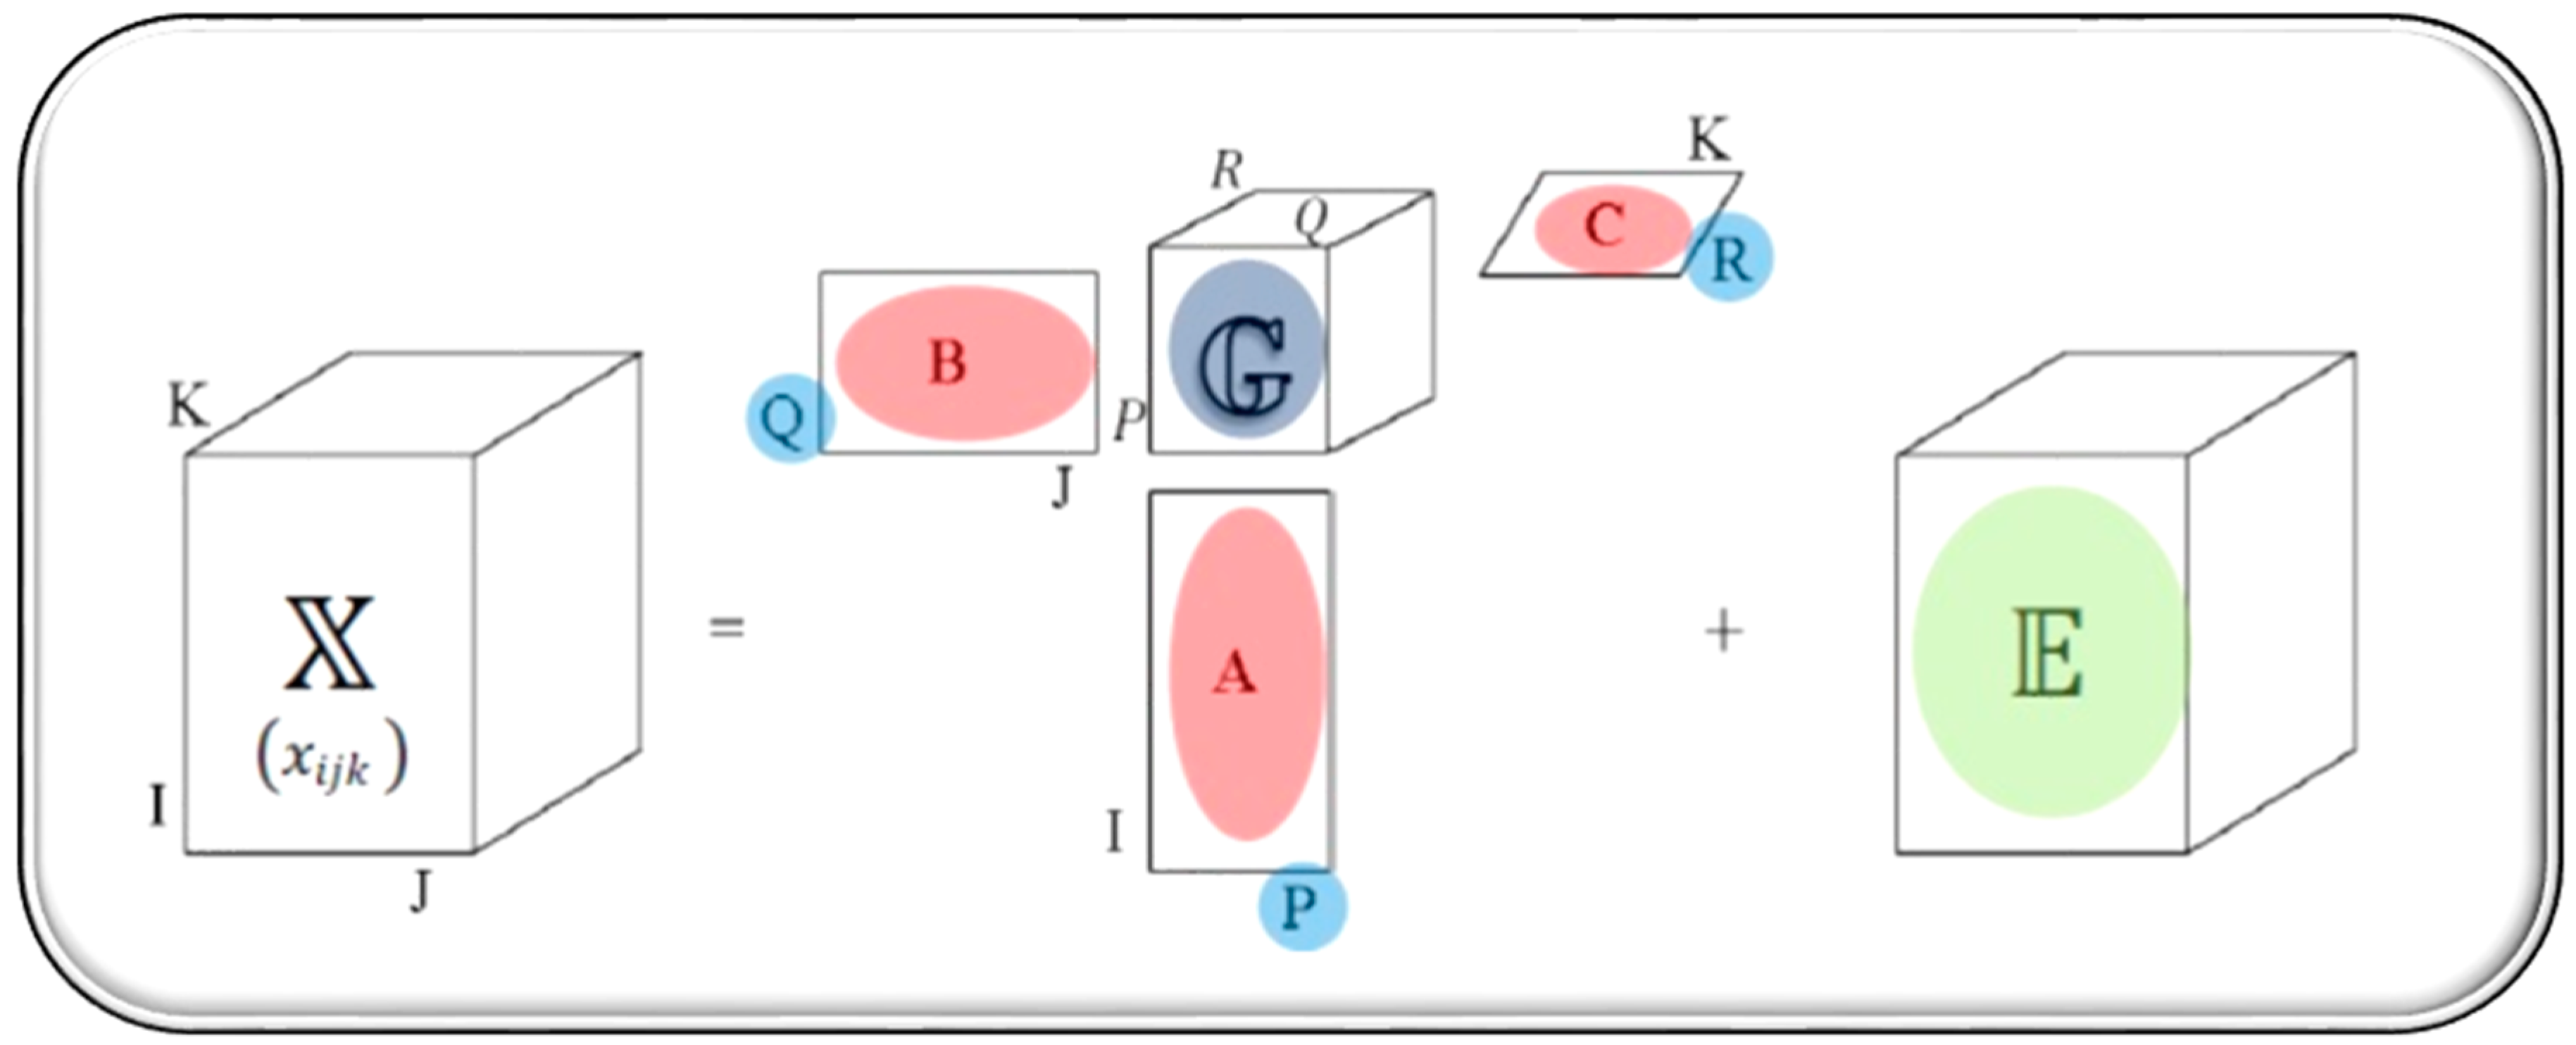
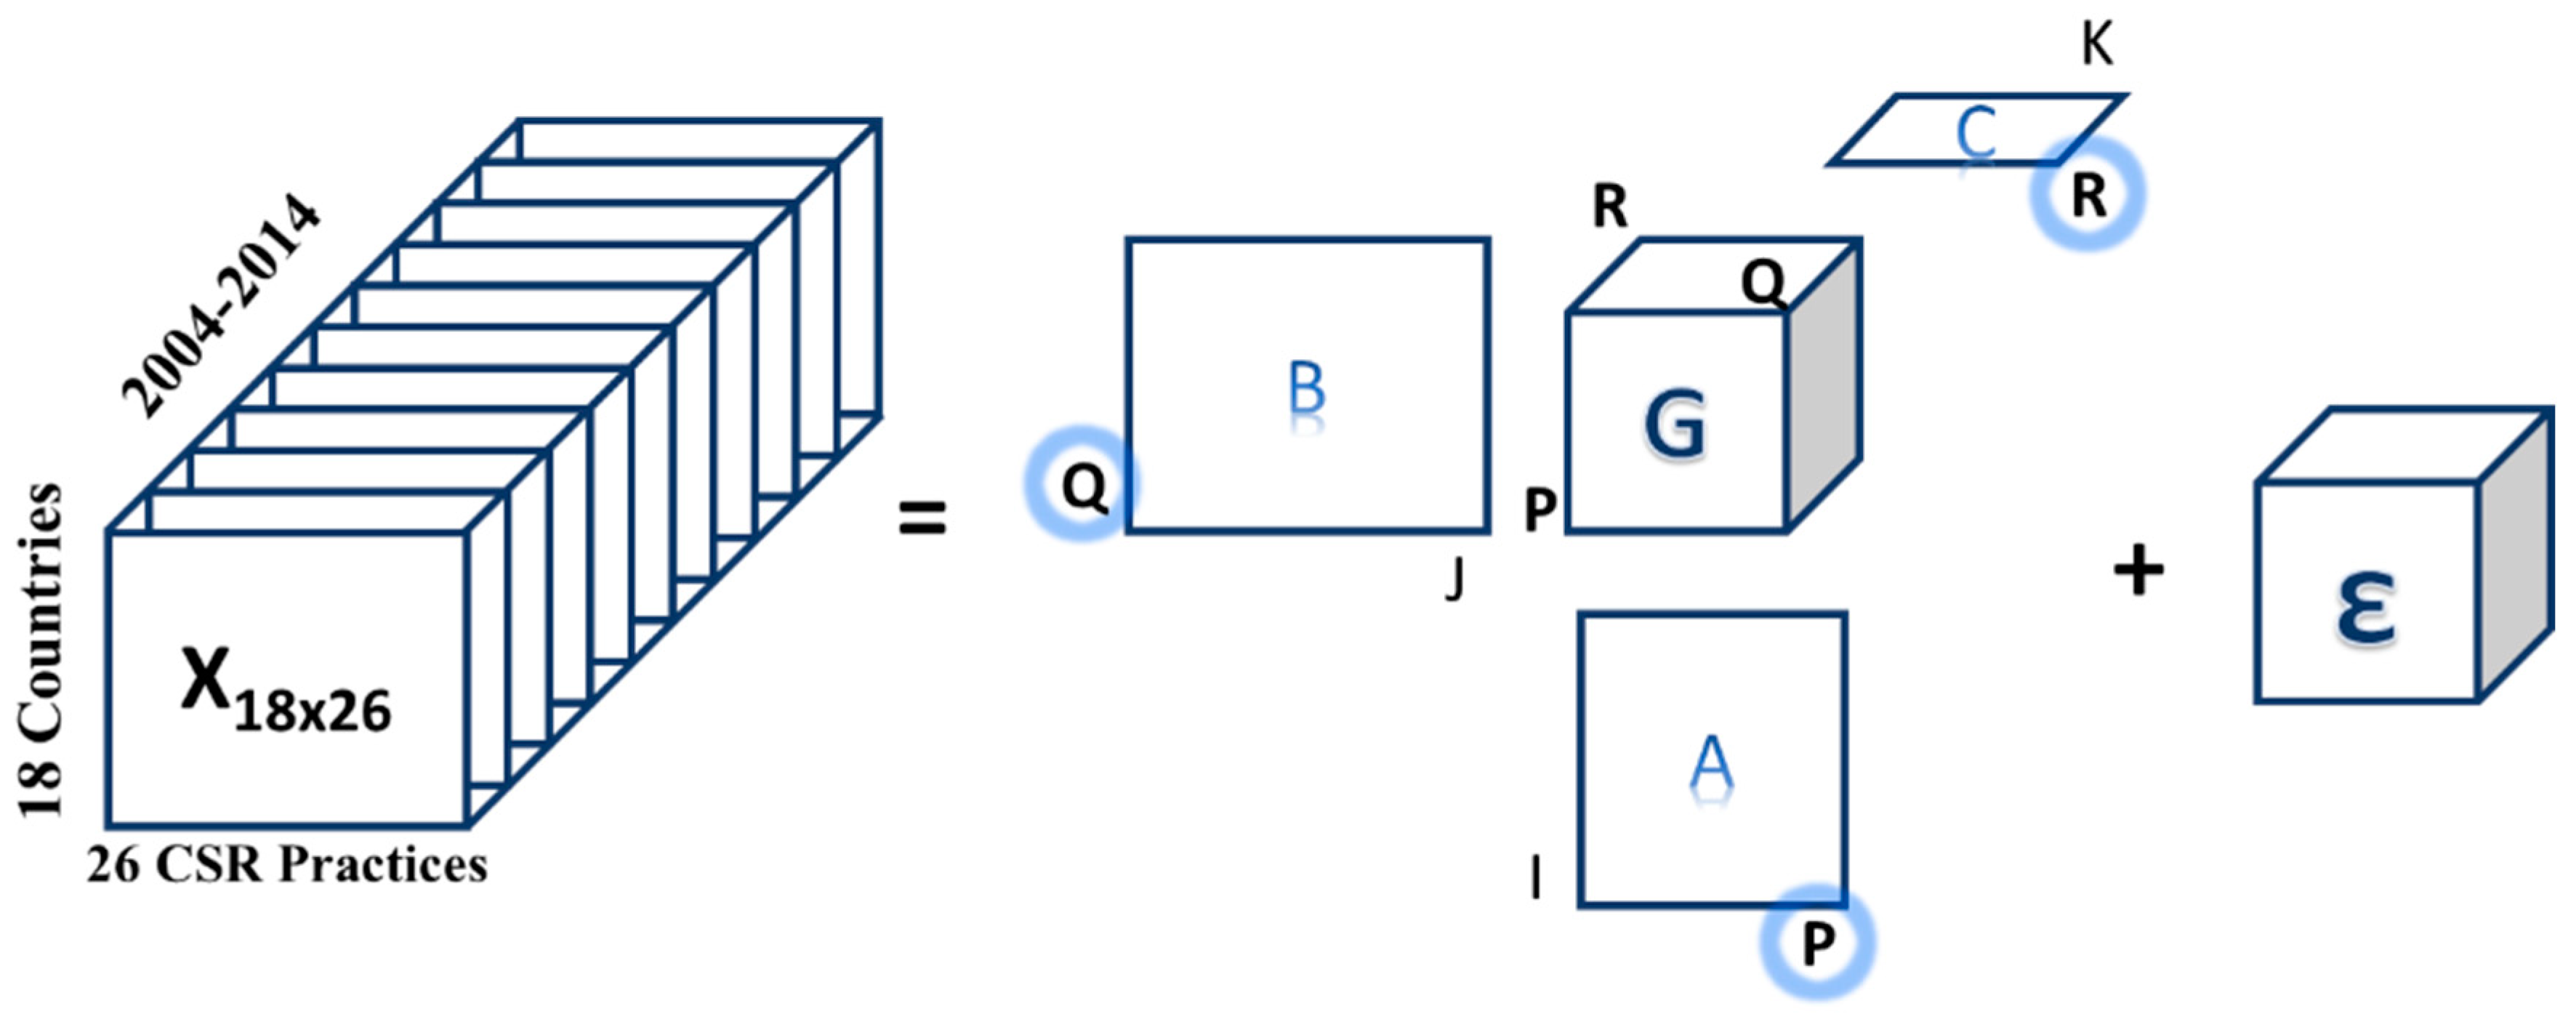
Once the analysis of the CSR has been established at the global level, in this section, we determine the development and evolution of these practices, according to the country of origin of the companies. With a Tucker3 analysis, we examine the relationships between deeper interactions, seeking to characterise each of the countries of origin of the companies in relation to the relevance of their CSR practices. The data are arranged in a cube, composed of 11 matrices (the years, 2004–2014), and each contains 18 rows (countries) and 26 columns (CSR practices). The first step is to select the number of components to be retained for each of the modes (Figure 10), where mode A refers to the countries of dimension I = 18 and P components to retained; mode B refers to the countries of dimension J = 26 CSR practices and Q components to retained; and mode C refers to the years of study, dimension K = 11, and R components to retained. With the retained components, the core matrix (G) is created to weight all of the possible combinations of these; plus, it contains the amount of variability explained for each of these combinations.
For the selection of the components, we observe the first results that the method gives us; Table 3 shows us the results of all of the combinations of possible models according to the selection of the components of each mode, with the significant models marked with ‘*’; Table 4 shows us a summary of the previous table only with the significant models, that is, those models that have a better explained variance for a sum of the fixed components.
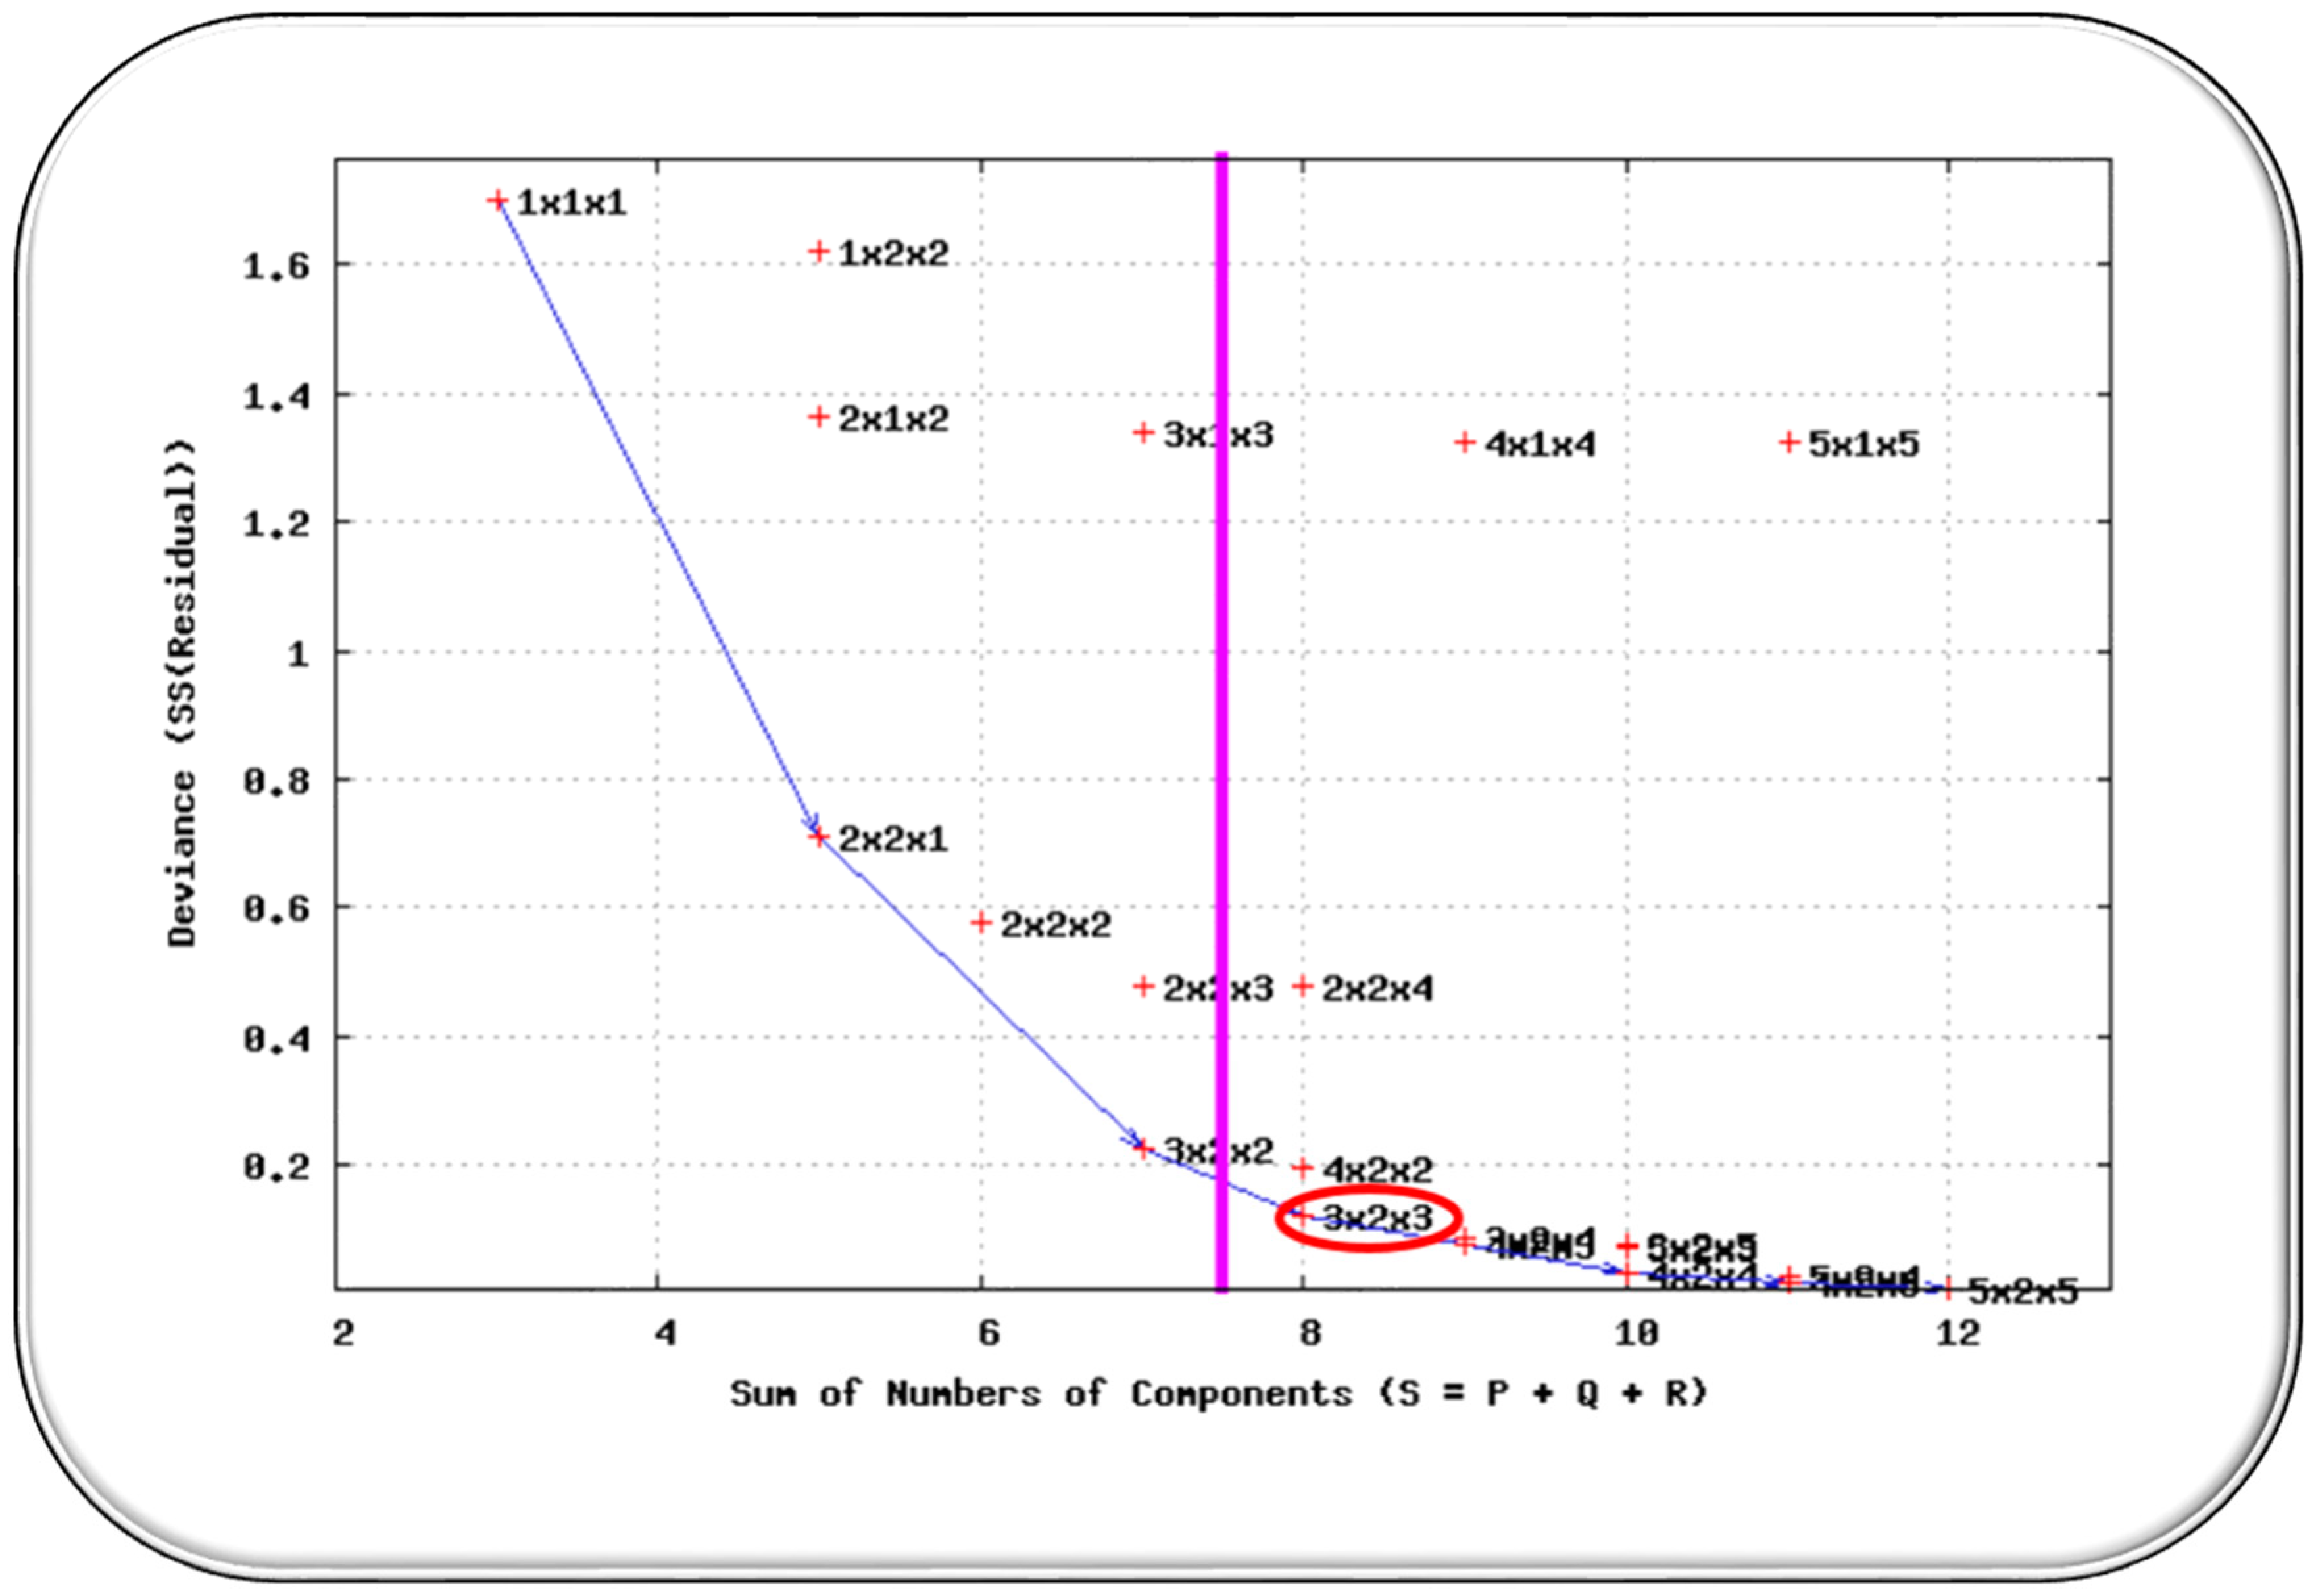
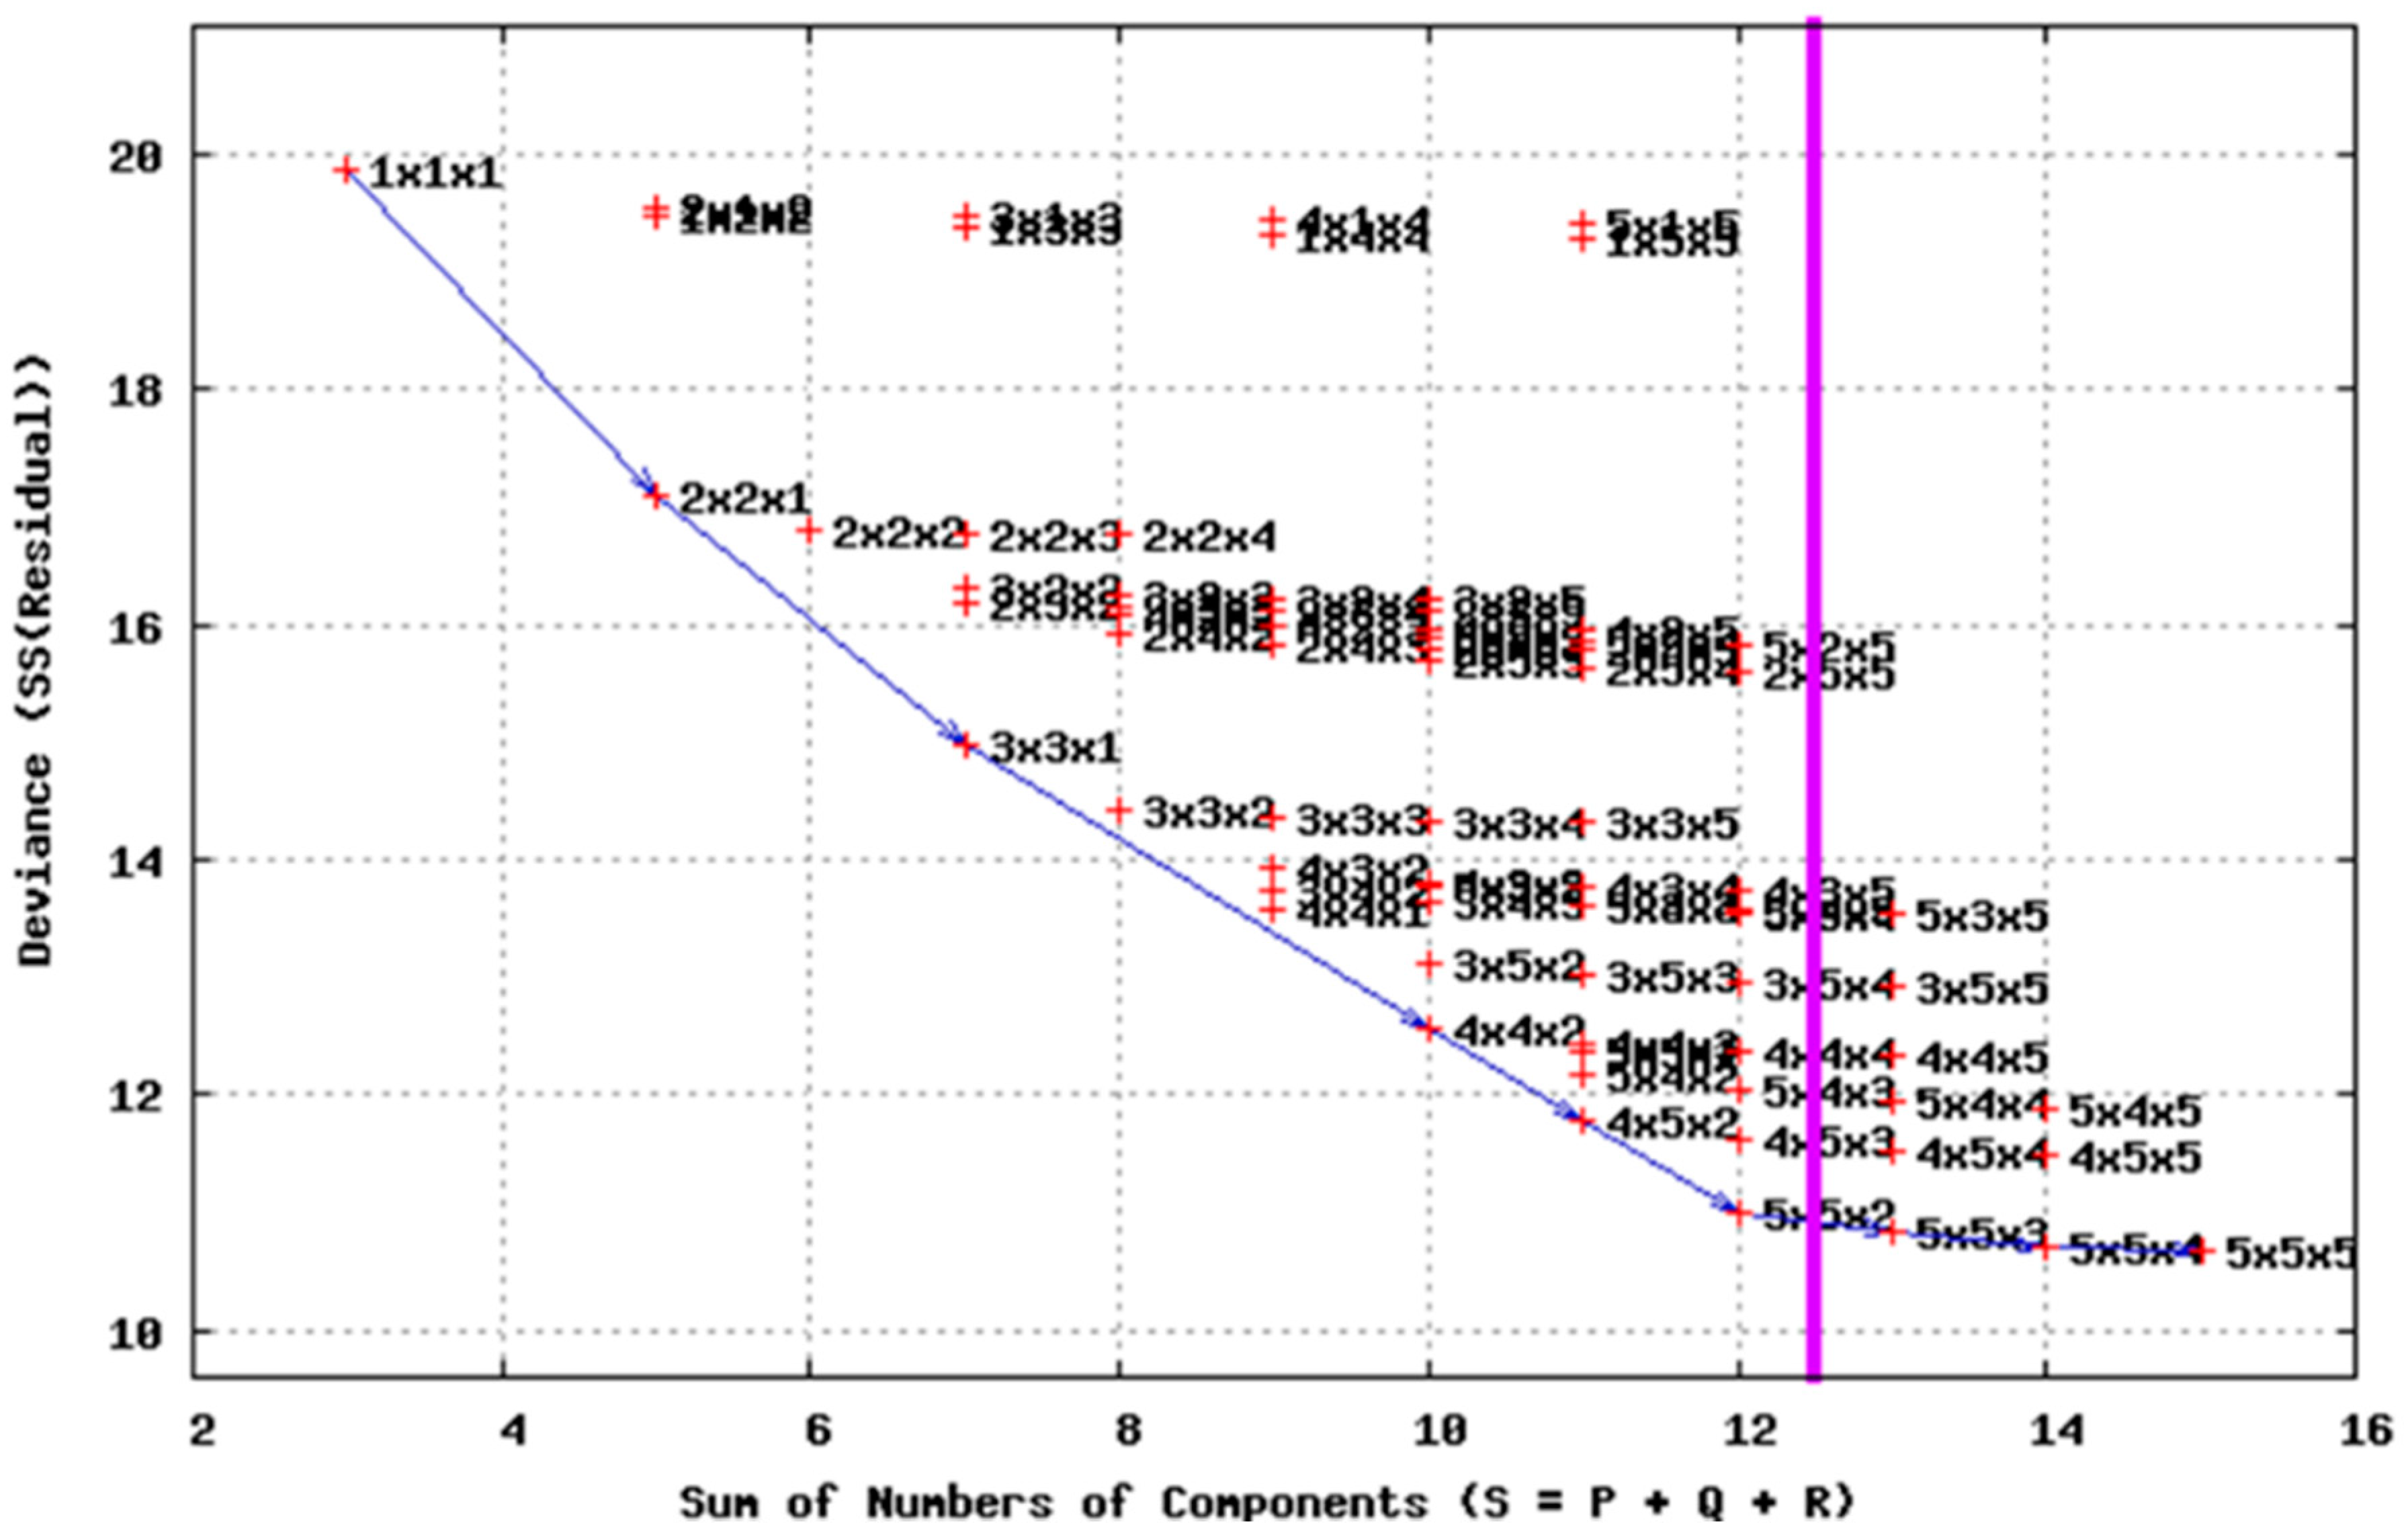
Table 4 shows the models with the best fit, a priori, the selected model results from the 5 × 5 × 2 combination, since the greatest amount of variability is sought, and the difference in the adjustment of the following models is insignificant (around 1%). Another interesting option would be to choose the previous model resulting from the combination 4 × 5 × 2, since its proportion would only decrease by 3%, and we would have a component that is less in the first mode. In addition, to facilitate the selection of the model, you can use the so-called ‘scree plot’ in which all of the possible models are represented based on the sum of the number of its components against the residual sum of squares (Figure 11). It can be seen that the chosen model 5 × 5 × 2 has the lowest sum of residual squares for those models that have the same sum of the number of components; in addition, it is the first of the most stable, since, in the later ones, the reduction in the sum of residual square is negligible.
Once the model is selected, we perform the same analysis, but setting the number of components to be retained in each mode as 5 × 5 × 2. One of the first results obtained are those of Table 5, which represents the amount of variance explained by each of the components retained in each of the modes.
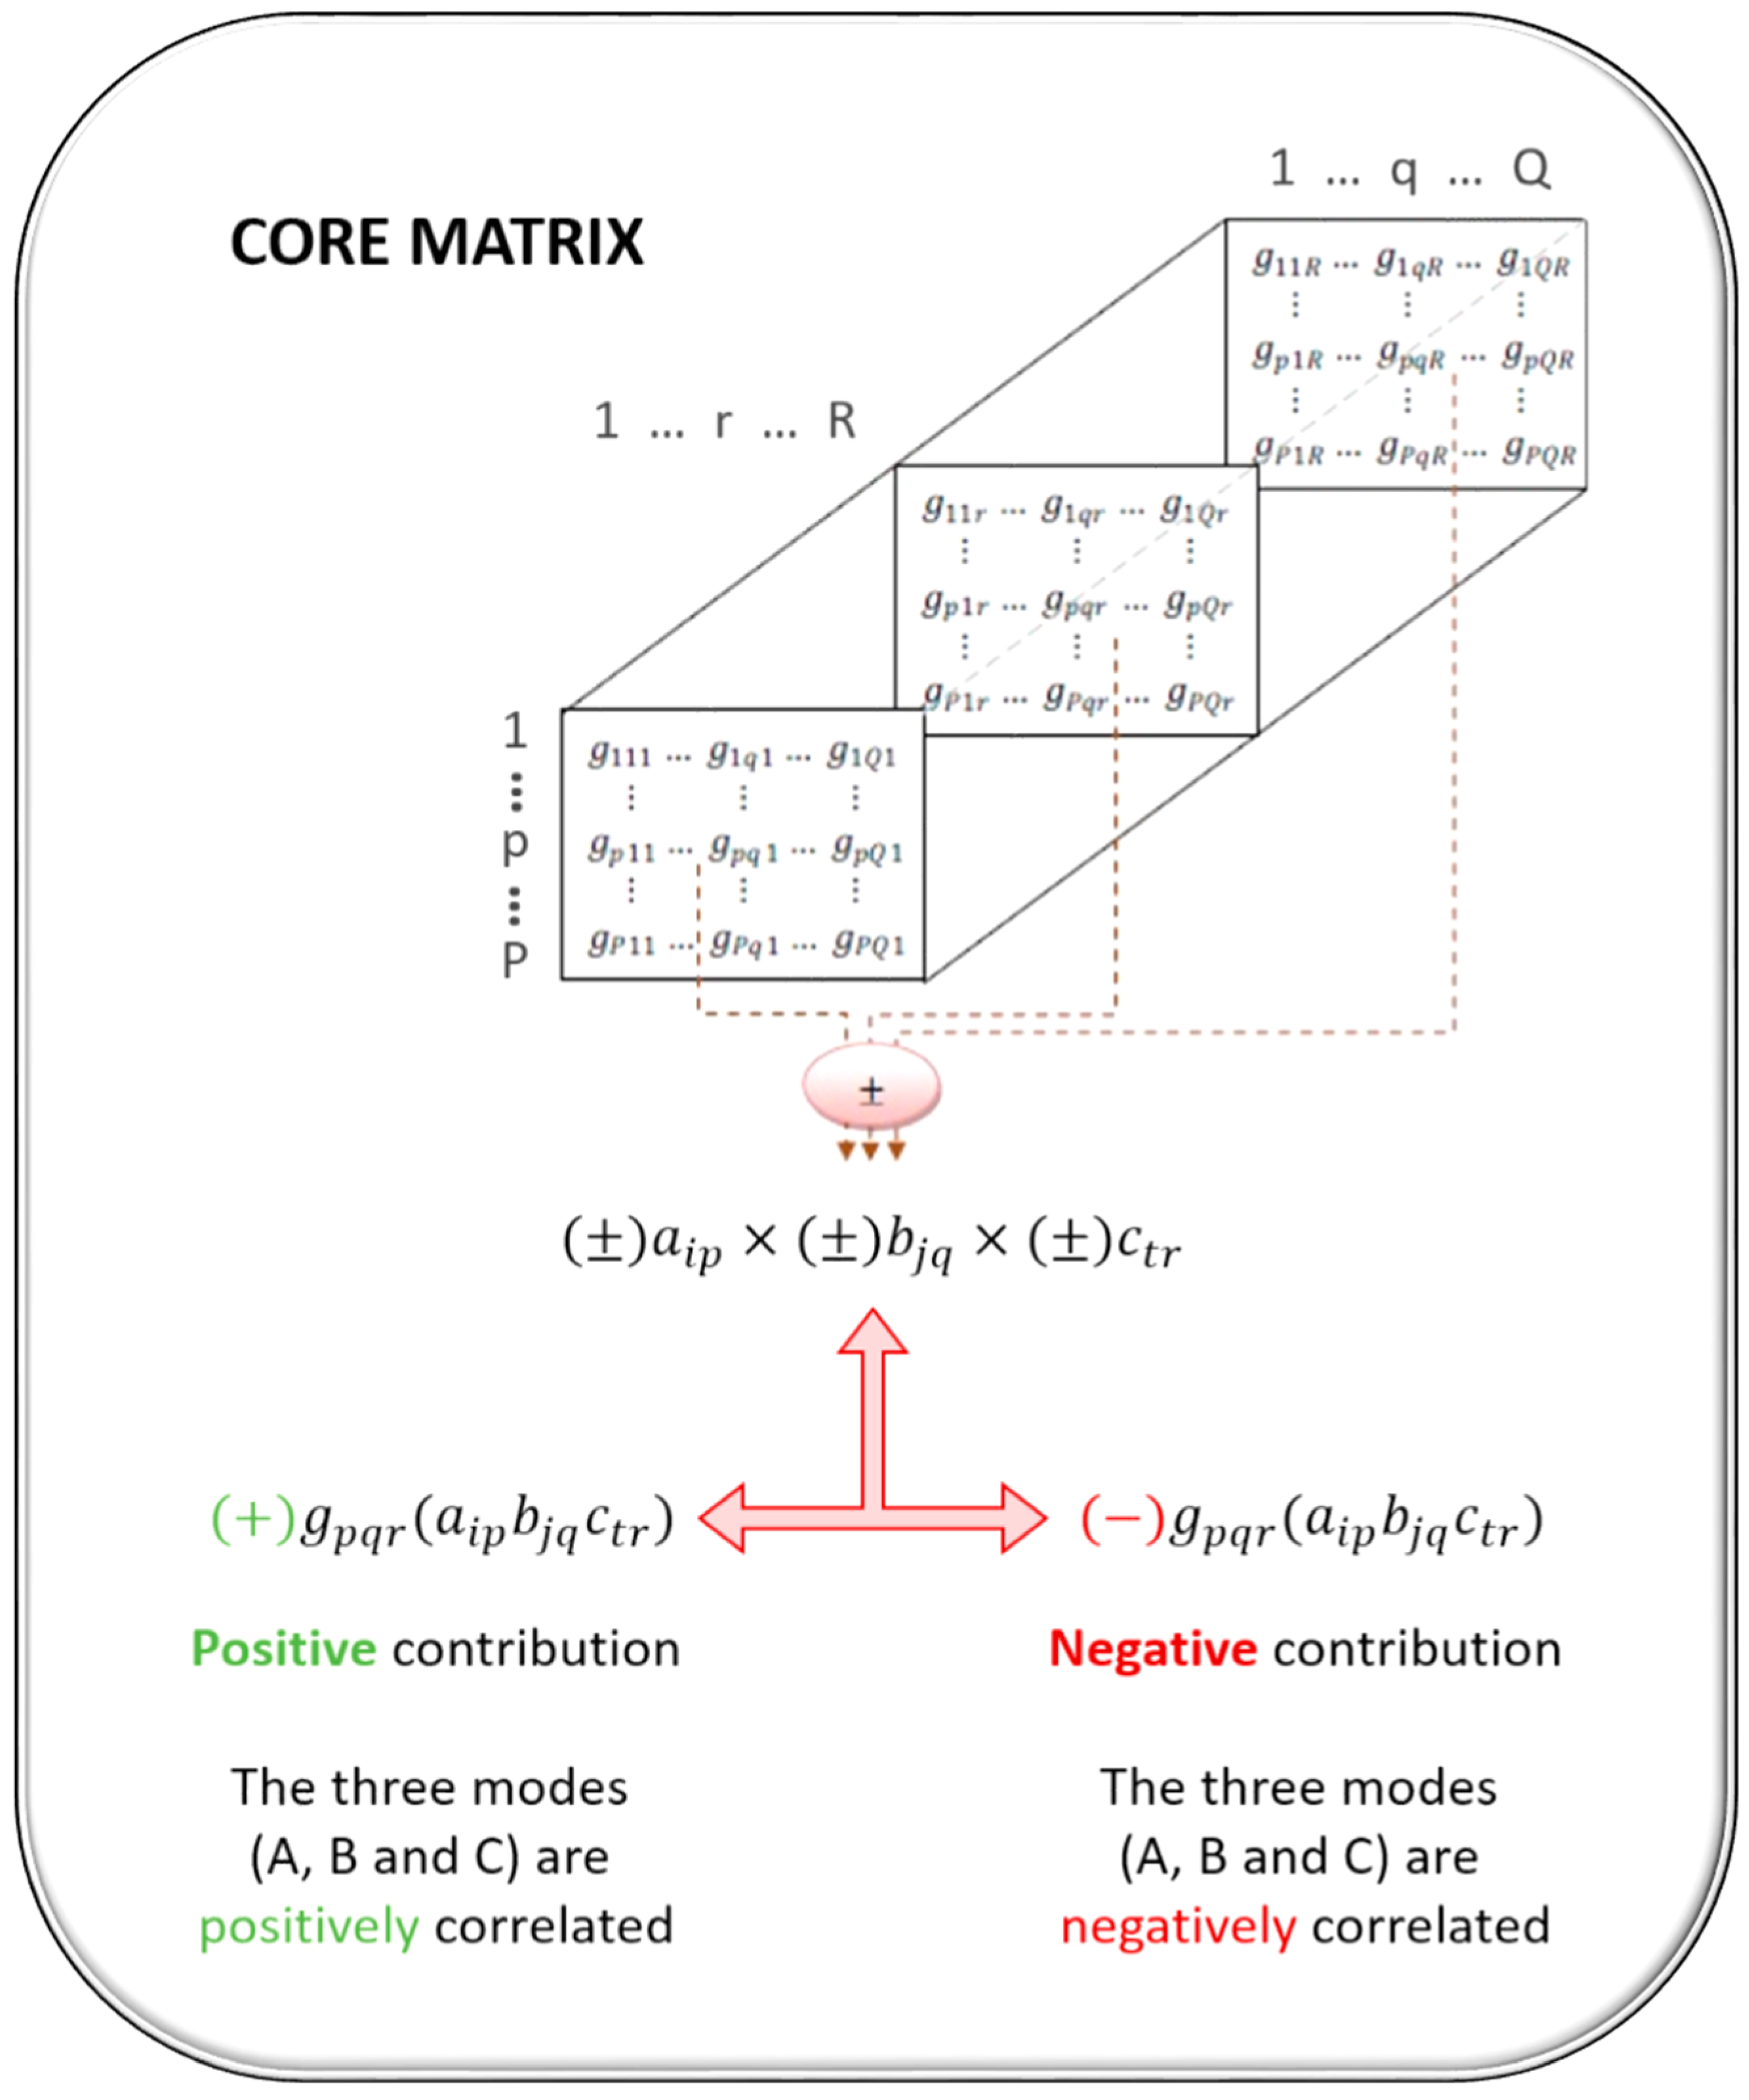
It can be seen that we obtained an amount of 57.60% of the information, which is a percentage high enough, considering that a cube of 18 × 26 × 11 has been reduced to one of 5 × 5 × 2. The next step is the analysis of the core matrix (Table 6), where we obtain the values of the residual sum of squares and the percentages of variance explained for each of the combinations of the components retained by mode. When identifying those elements of the core matrix that we are interested in interpreting, we select those with a higher percentage of variability, which will be the ones that provide us with the greatest amount of information. In addition, in the sum of squares, the signs are shown to interpret the interactions between the components.
Those elements selected for interpretation have been highlighted, obtaining an explained variance of 41.60%. Next, we analyse each of the elements, showing the graphical results for the three modes, so each graph will represent two components in one way, one horizontally and one vertically; and, together with the results obtained from the core matrix, the interactions between countries, CSR practices, and years will be interpreted.
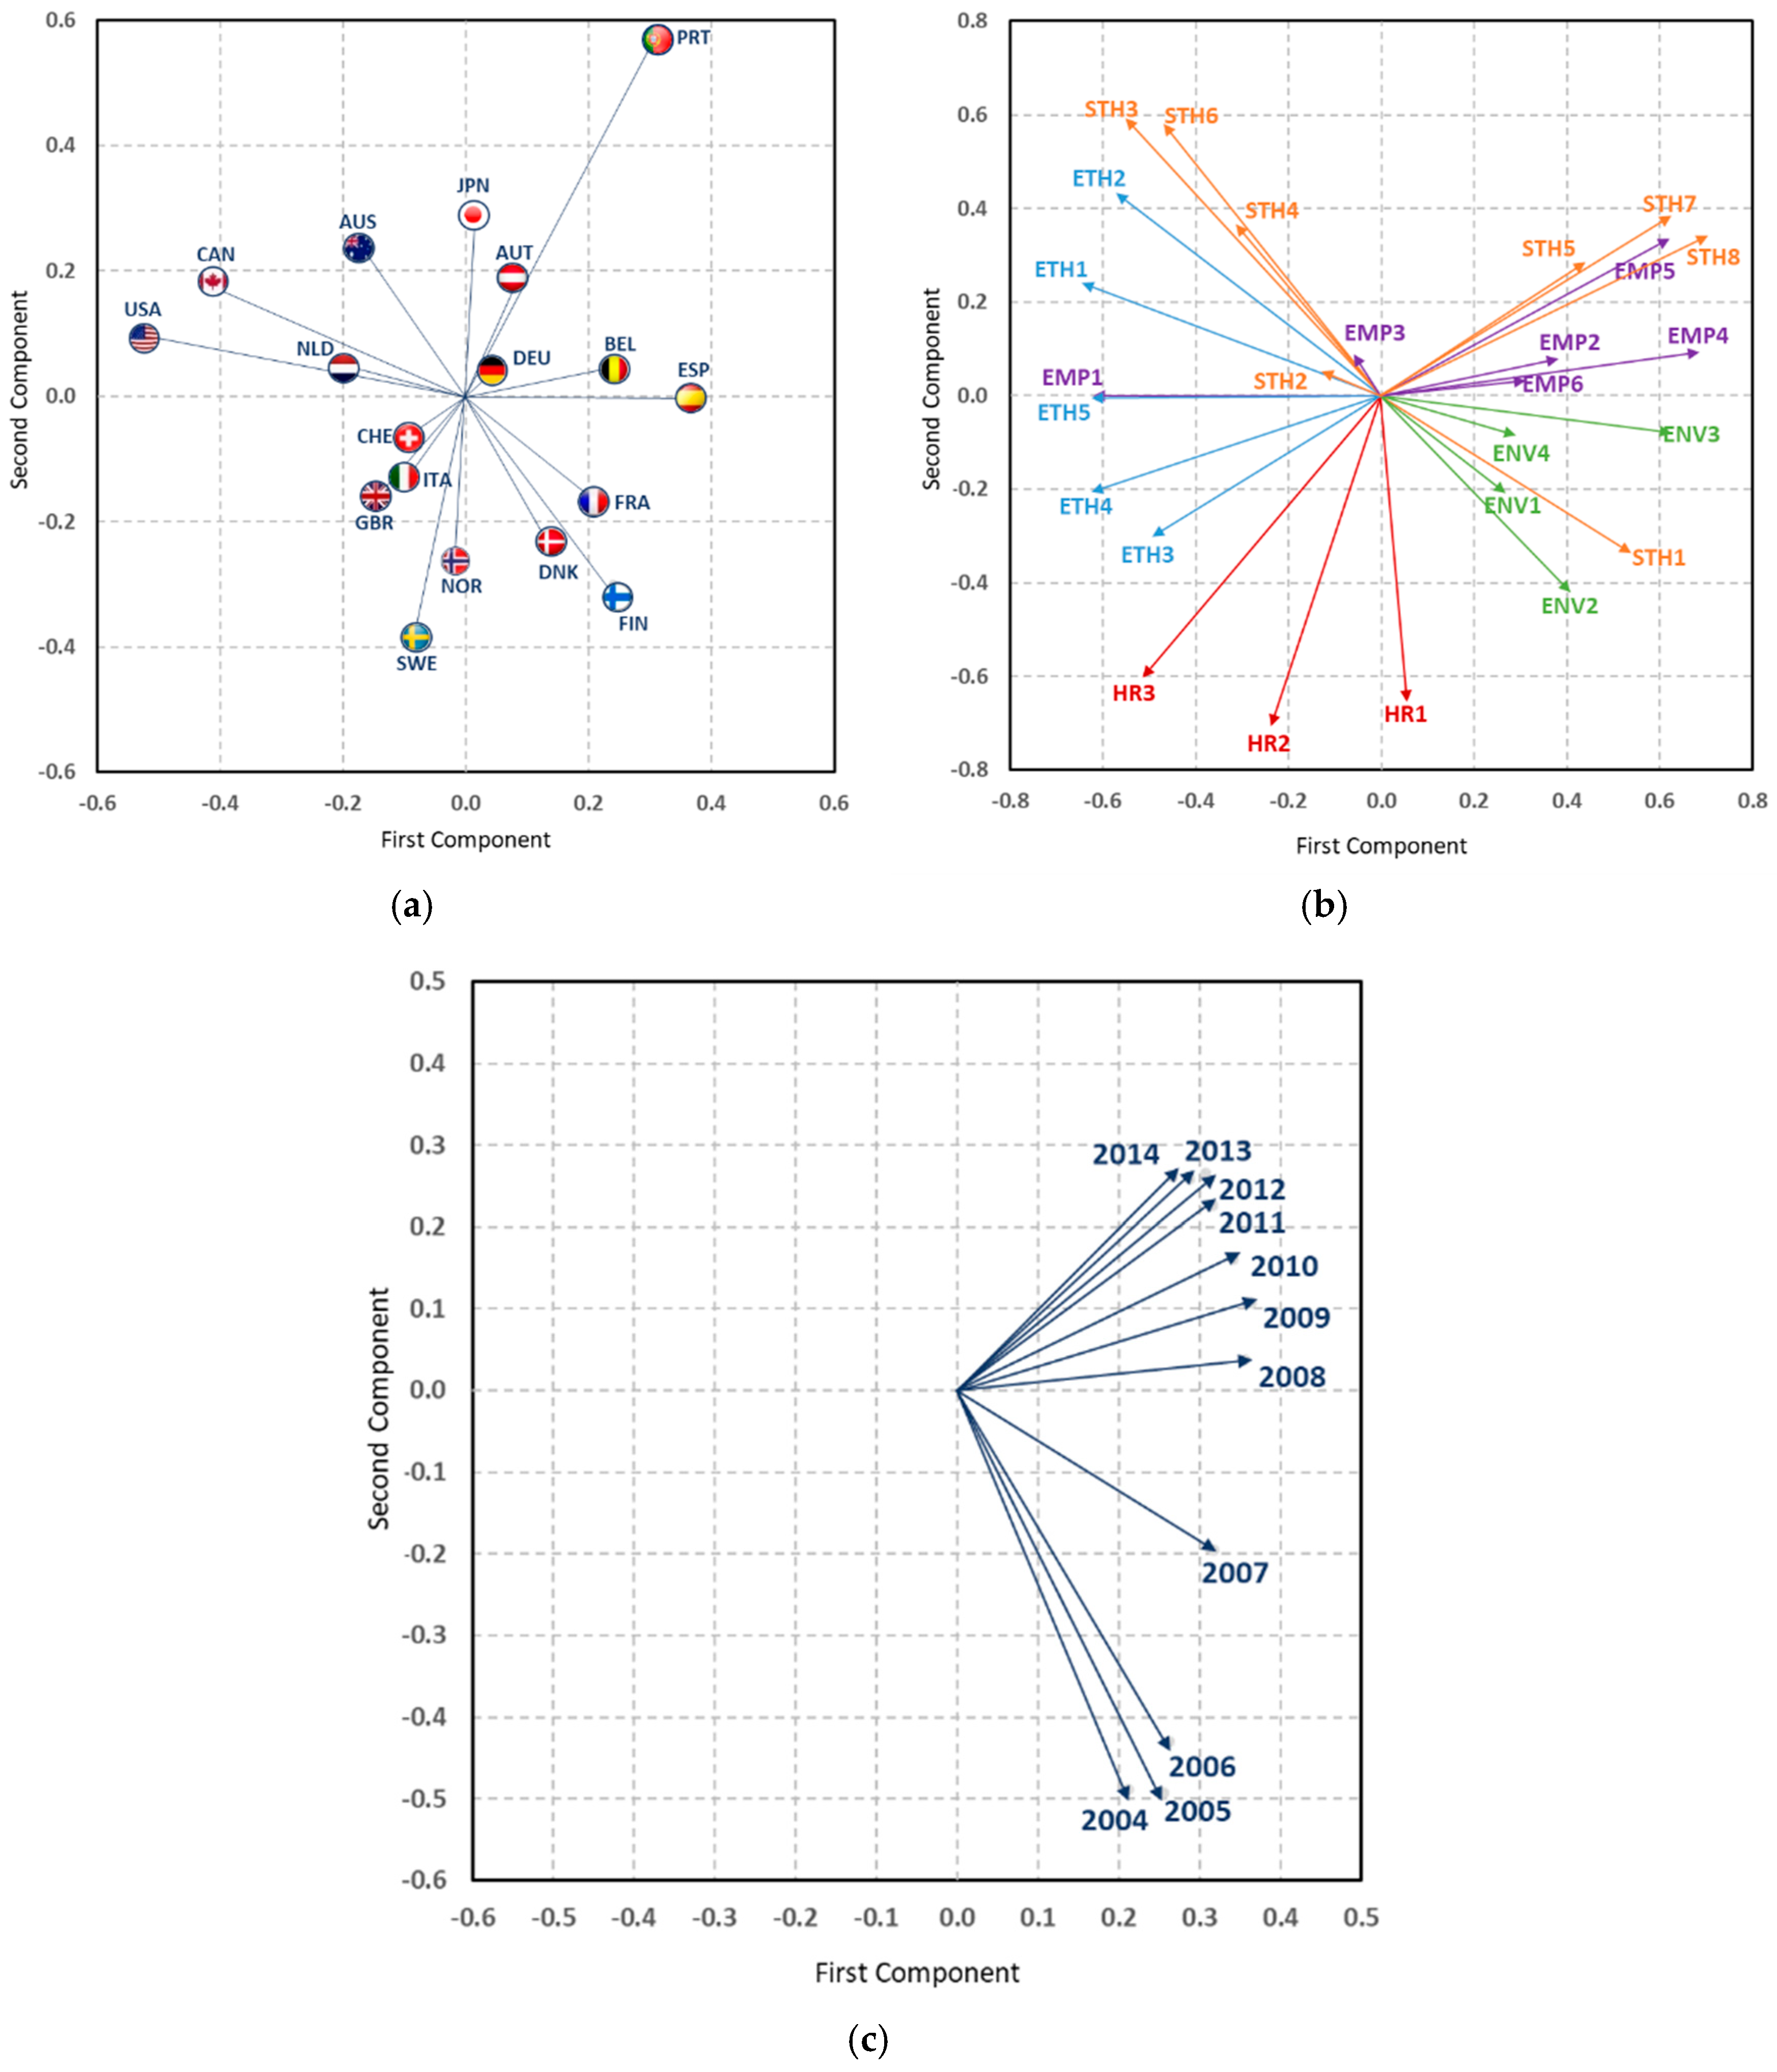
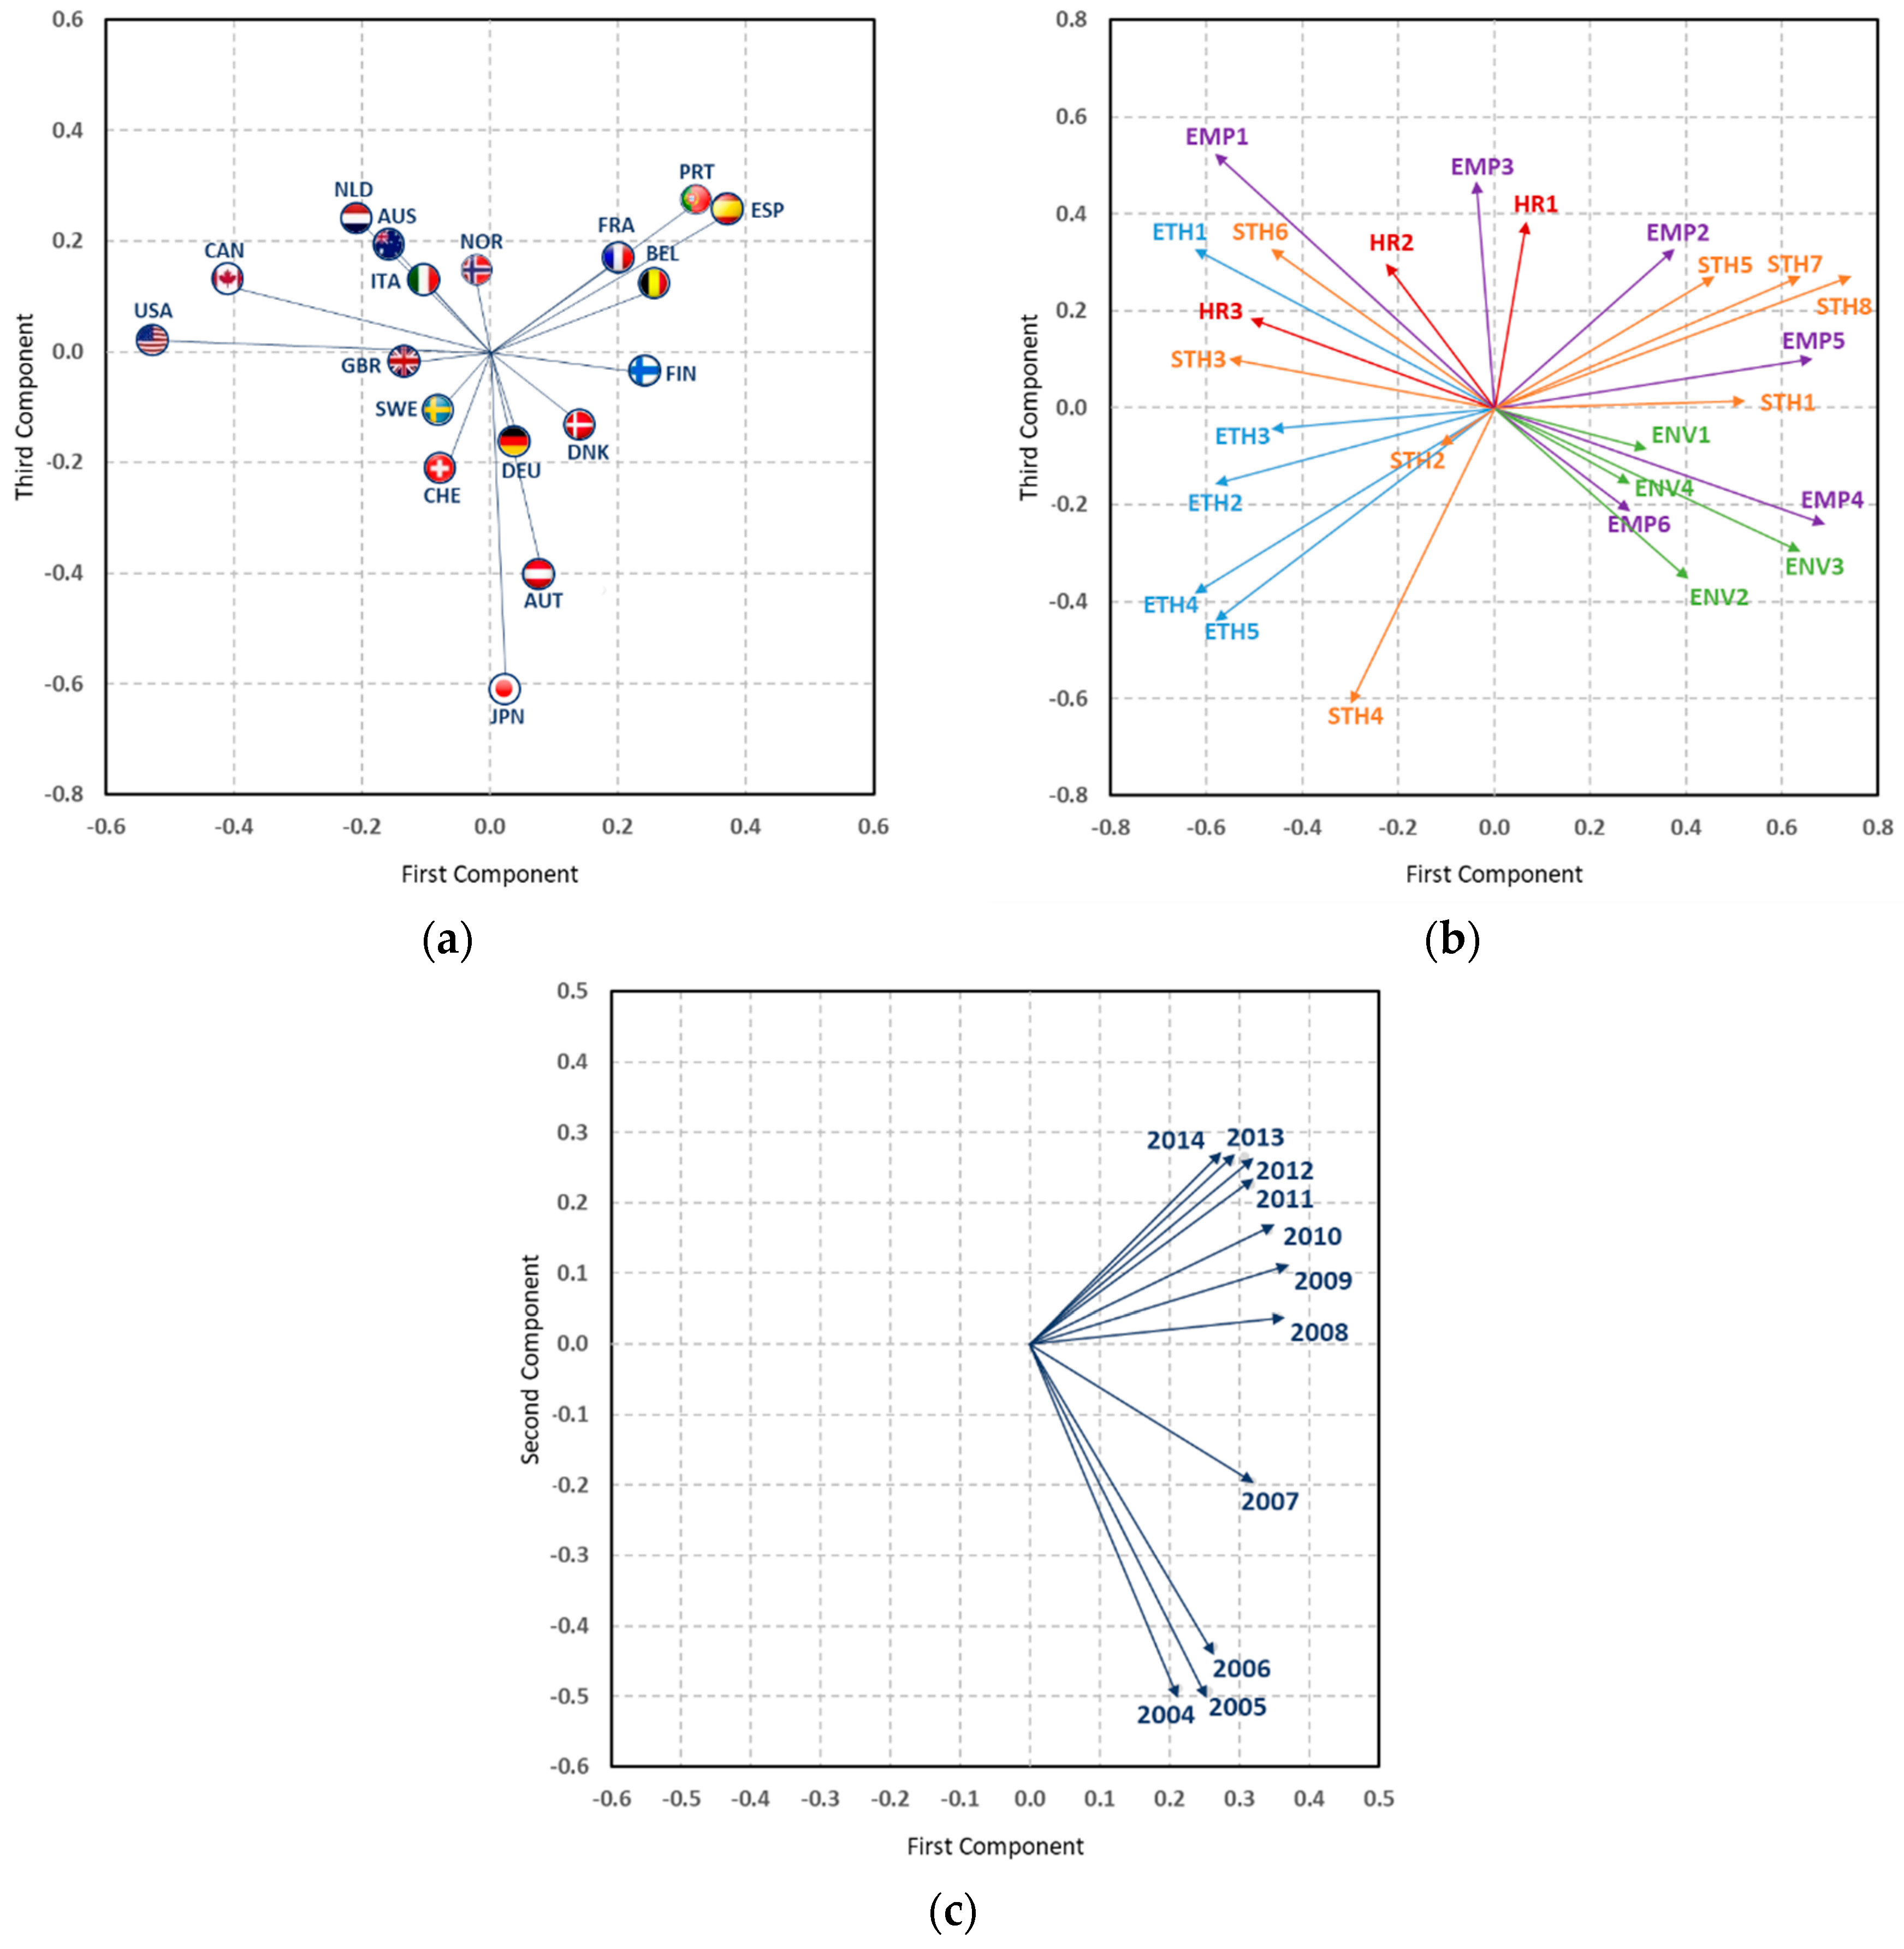
The first element of the core matrix that is interpreted is G111, in which we analyse the first component of each mode (Figure 12); this element absorbs 23.20% of the total variability. Given that this element is positive (2.45), those countries that are located in the right semi-plane (quadrants I and IV), that is, those that obtain positive values in the first component of mode A, as shown in the first figure, present a positive interaction with the practices of CSR that are also located in the right semi-plane (quadrants I and IV) of the second figure (positive values in the first component of mode B) in all of the years of study, since all of them obtain positive coordinates by positioning themselves in the right part of the third figure.
Core matrix element (+) × Countries (+) × CSR Practices (+) × Years (+) = Interaction (+)
Although depending on the country of origin of the companies, we can identify specific characteristics in the development and evolution of CSR practices, the analyses carried out allow us to speak of highly similar patterns for those companies whose headquarters are located in geographically close countries. In this sense, the commentary on the results obtained will be made for groups of countries whose companies show similar sustainable behaviour. Thus, for these groups of countries, the main characteristics observed in the development of CSR will be determined.
Thus, during the 2004–2014 decade, companies whose country of origin is located in southwestern Europe (Portugal, Spain, France, Belgium), as well as in Finland and Denmark, prioritise their practices in environmental issues, as well as systems that promote equal opportunities, participation, and training of their employees (EMP2, EMP4, EMP5), and good community relations, participation, systems, and reports on their stakeholders (STH1, STH5, STH7, and STH8).
In the same way, observing the opposite semi-planes, that is, the countries and practices with negative coordinates in the first components of their modes, it is evident for all of the years that the companies whose headquarters are centralised in North American countries, such as the United States and Canada, stand out for their high values in those practices aimed at ethical issues and human rights, as well as policies in favour of equal opportunities (EMP1) and policies towards their stakeholders (STH6), or the importance of these as board members (STH4) and relations with the community (STH3).
Core matrix element (+) × Countries (−) × CSR Practices (−) × Years (+) = Interaction (+)
It should be noted that the structure found for the first components of the three modes has a very high degree of similarity when compared to the results of the X-STATICO analysis (see Figure 8), where we observe that the variable ‘equal opportunities policy (EMP1)’ is the one that is separated from the rest of the practices in relation to dealing with employees, also losing its relationship with the environment; we find the same case with the variables towards the interest groups, ‘community involvement (STH3)’, ‘responsibility for stakeholders (STH4)’, and ‘stakeholders policy (STH6)’; likewise, we find the low degree of correlation of the ethical variables and of human rights with the environment. This shows that these methods should be used in a complementary way to obtain results that benefit from the advantages of each of them, since they provide results from different points of view with a strong degree of coherence.
The second element of the core matrix that is interpreted is G221. This element absorbs 8.30% of information, and, since it is formed by the second component of the first and second modes and the first of the third, it is interpreted with the same figure as in the previous case (Figure 12), with the difference that now, we observe the second components in the first two modes, that is, the vertical axes in countries and CSR practices. Thus, with this being the positive element (1.46), in all of those years, those countries and practices located in the upper semi-plane (quadrants I and II) have a positive interaction.
Core matrix element (+) × Countries (+) × CSR Practices (+) × Years (+) = Interaction (+)
That is, in all of the years of study, the firms in Portugal emphasise the training of their employees (EMP5), the participation of the community, policies, systems, and reports in favour of the participation and responsibility of the stakeholders (STH3-4-5-6-7-8), and in the implementation of a code of business ethics (ETH2).
In the same way, observing the opposite semi-planes, in all of the years of study, the companies coming from in the Nordic countries—Denmark, Finland, Norway, and Sweden—stand out for presenting the highest levels in the practices related to human rights (policy, system, and report, HR1-2-3), good measures to counteract bribery (policy, system, and report, ETH3-4-5), strong practices in the environment, and a strong commitment to the community (STH1).
Core matrix element (+) × Countries (−) × CSR Practices (−) × Years (+) = Interaction (+)
The third element of the core matrix that is interpreted is G331, which is the third component of the first and second modes, and the first component of the third mode (Figure 13); this element absorbs 5.10% of the total variability. Given that this element is positive (1.15), those countries that obtain positive values in the third component, that is, those that are located in the upper semi-plane (quadrants I and II), present a positive interaction with CSR practices that are also located in the upper semi-plane (quadrants I and II) of the second figure, or vice versa in all of the years of study, since all of them obtain positive coordinates by positioning themselves in the right part of the third figure.
Core matrix element (+) × Countries (−) × CSR Practices (−) × Years (+) = Interaction (+)
Thus, in all of the years of study, the organisations based in Japan and Austria have focussed mainly on environmental systems and reports (ENV2-3); in addition to the participation of their employees (EMP4) and the responsibility of their stakeholders (STH4) in decision-making processes, and systems and reports in the fight to counteract bribery (ETH4-5).
The fourth and fifth elements of the core matrix are interpreted are G451 and G541, which collect 3.00% and 2.00% information, respectively. The results of these elements should only be interpreted after knowing the results of the other elements of the core matrix with greater variance, understanding that these results explain less obvious differences between countries, CSR practices, and years.
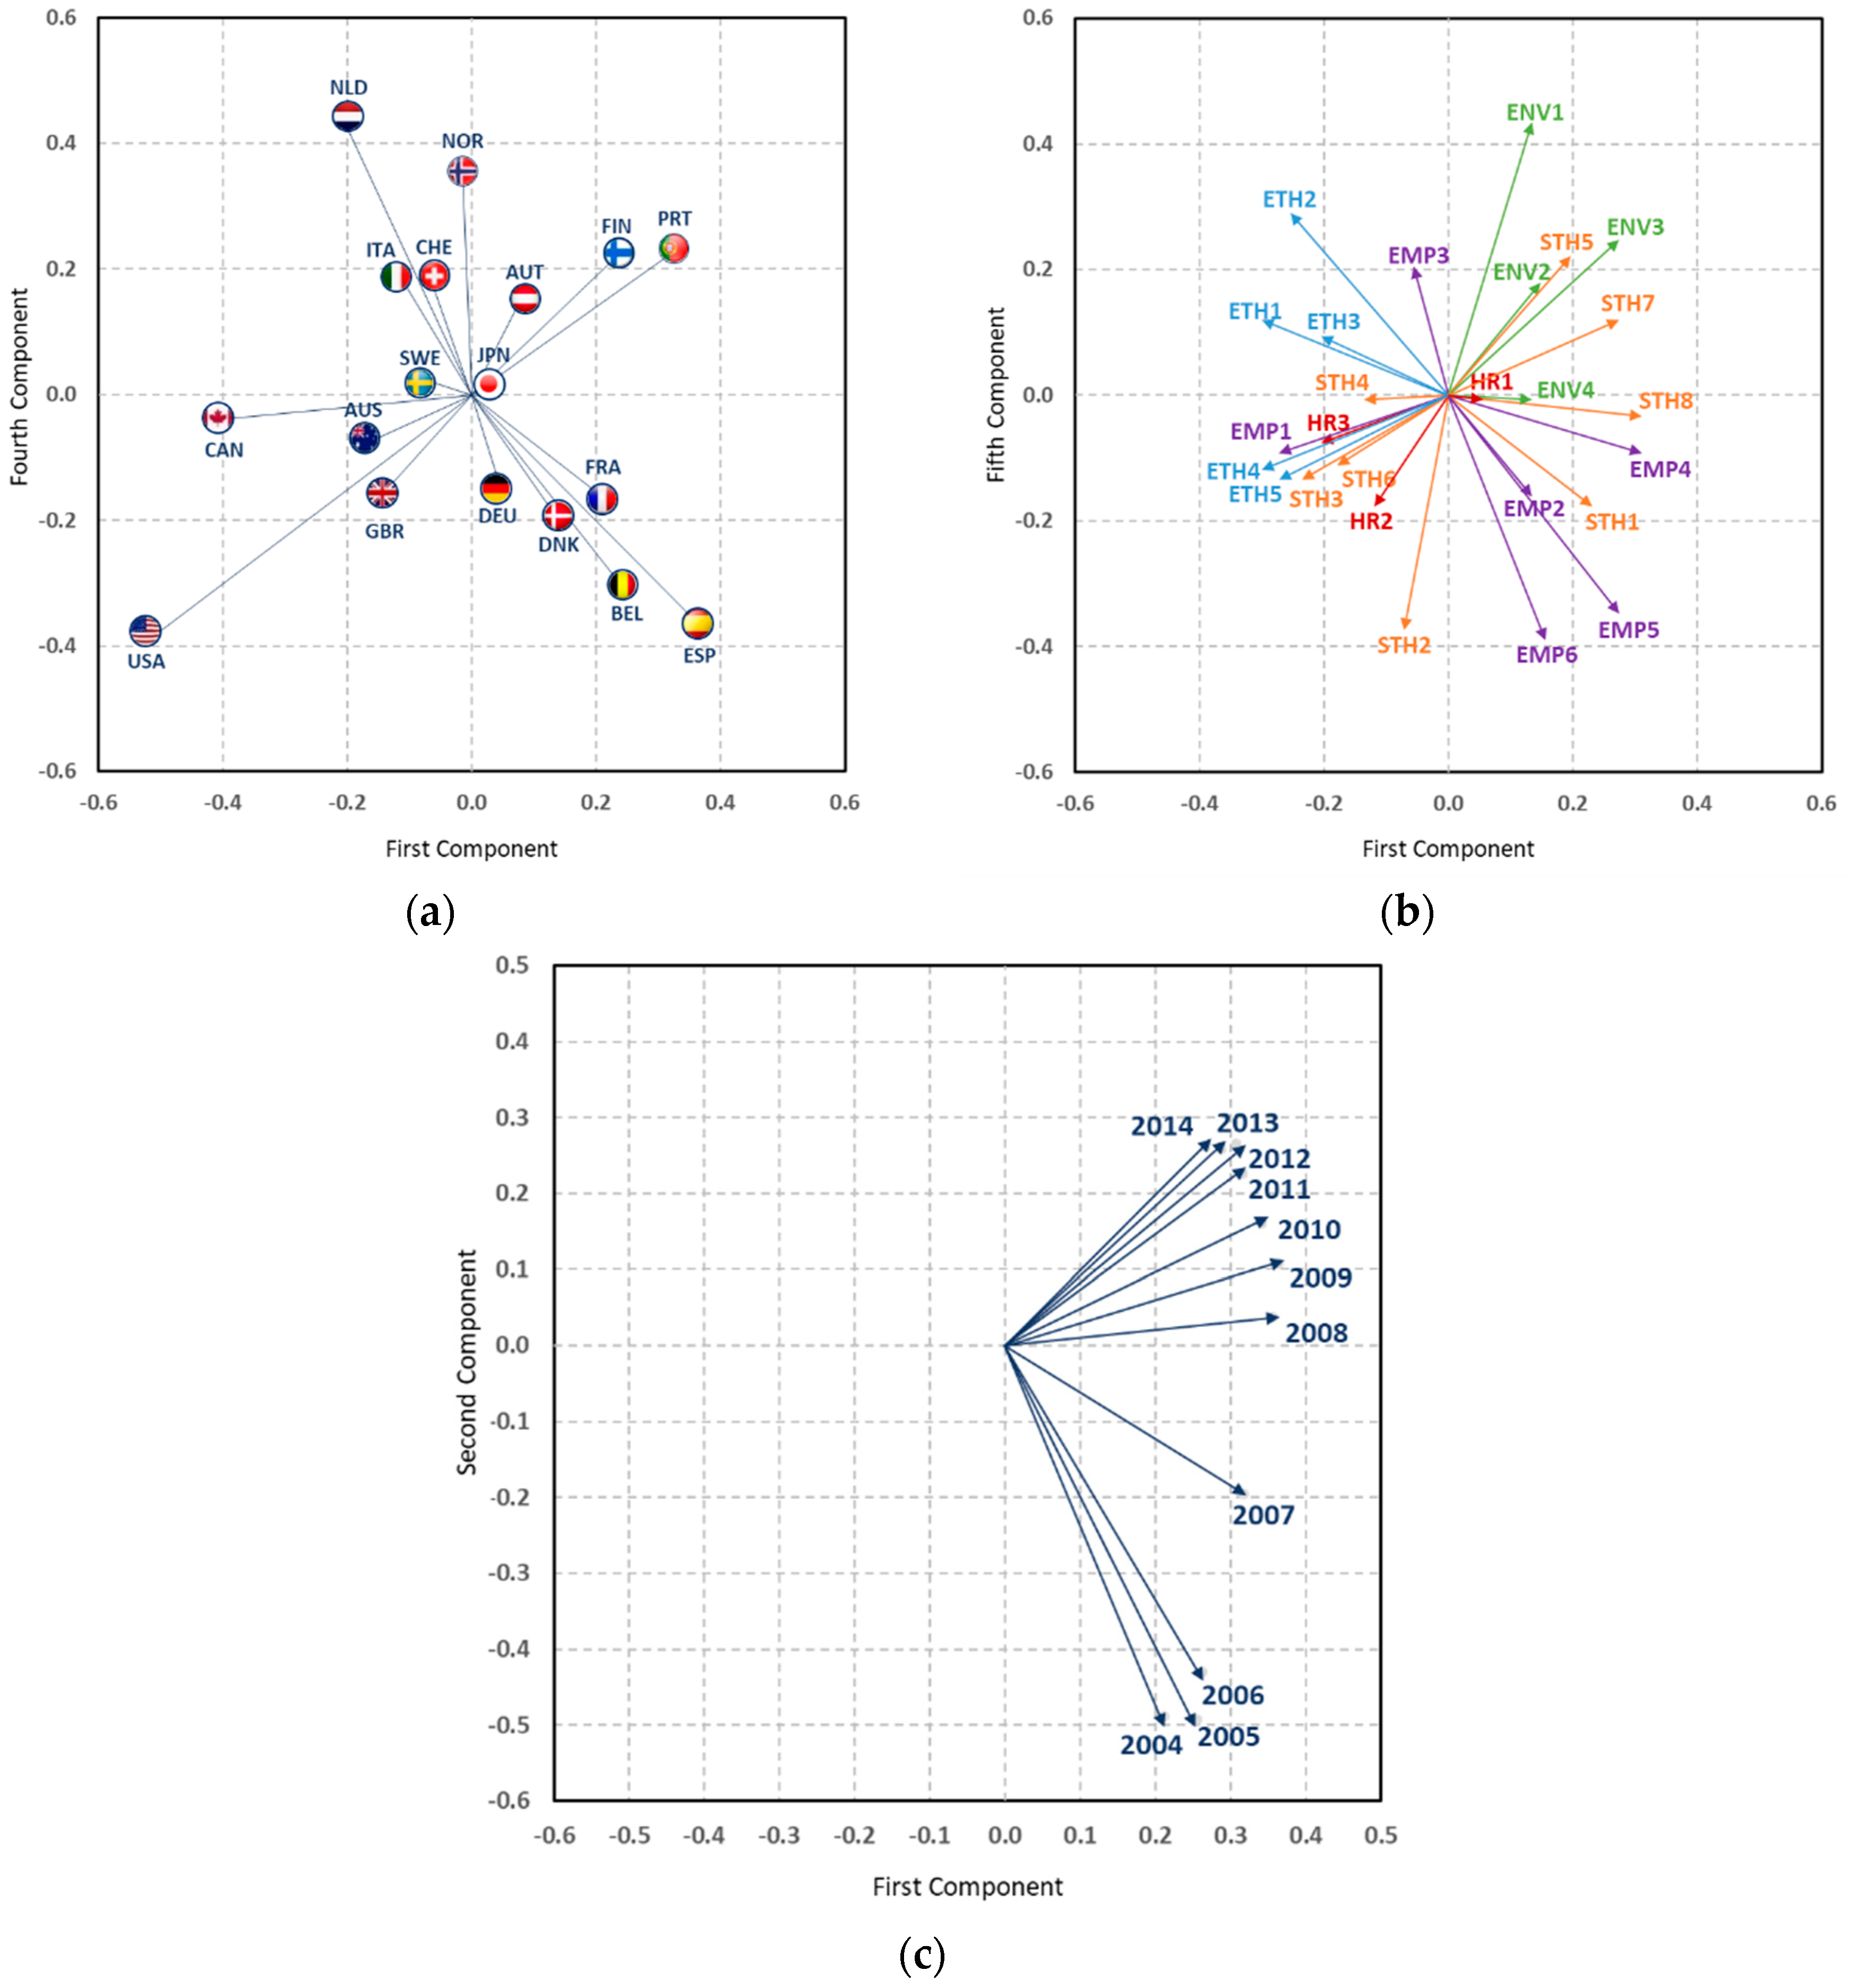
Element G451 interprets the fourth component of the first mode, the fifth of the second mode, and the first of the third mode (Figure 14). Since this element is positive (0.89), the countries that receive positive coordinates in the fourth component, that is, those located in the upper semi-plane, present during all the years of study a positive interaction with those practices equally situated in the upper semi-plane.
Core matrix element (+) × Countries (+) × CSR Practices (+) × Years (+) = Interaction (+)
In this way, in all of the years of study, the companies whose country of origin is either the Netherlands or Norway attach great importance to environmental policies and reports (ENV1-3), the health and safety of their employees (EMP3), the participation of their stakeholders (STH5), and the systems for the implementation of a code of ethics (ETH2).
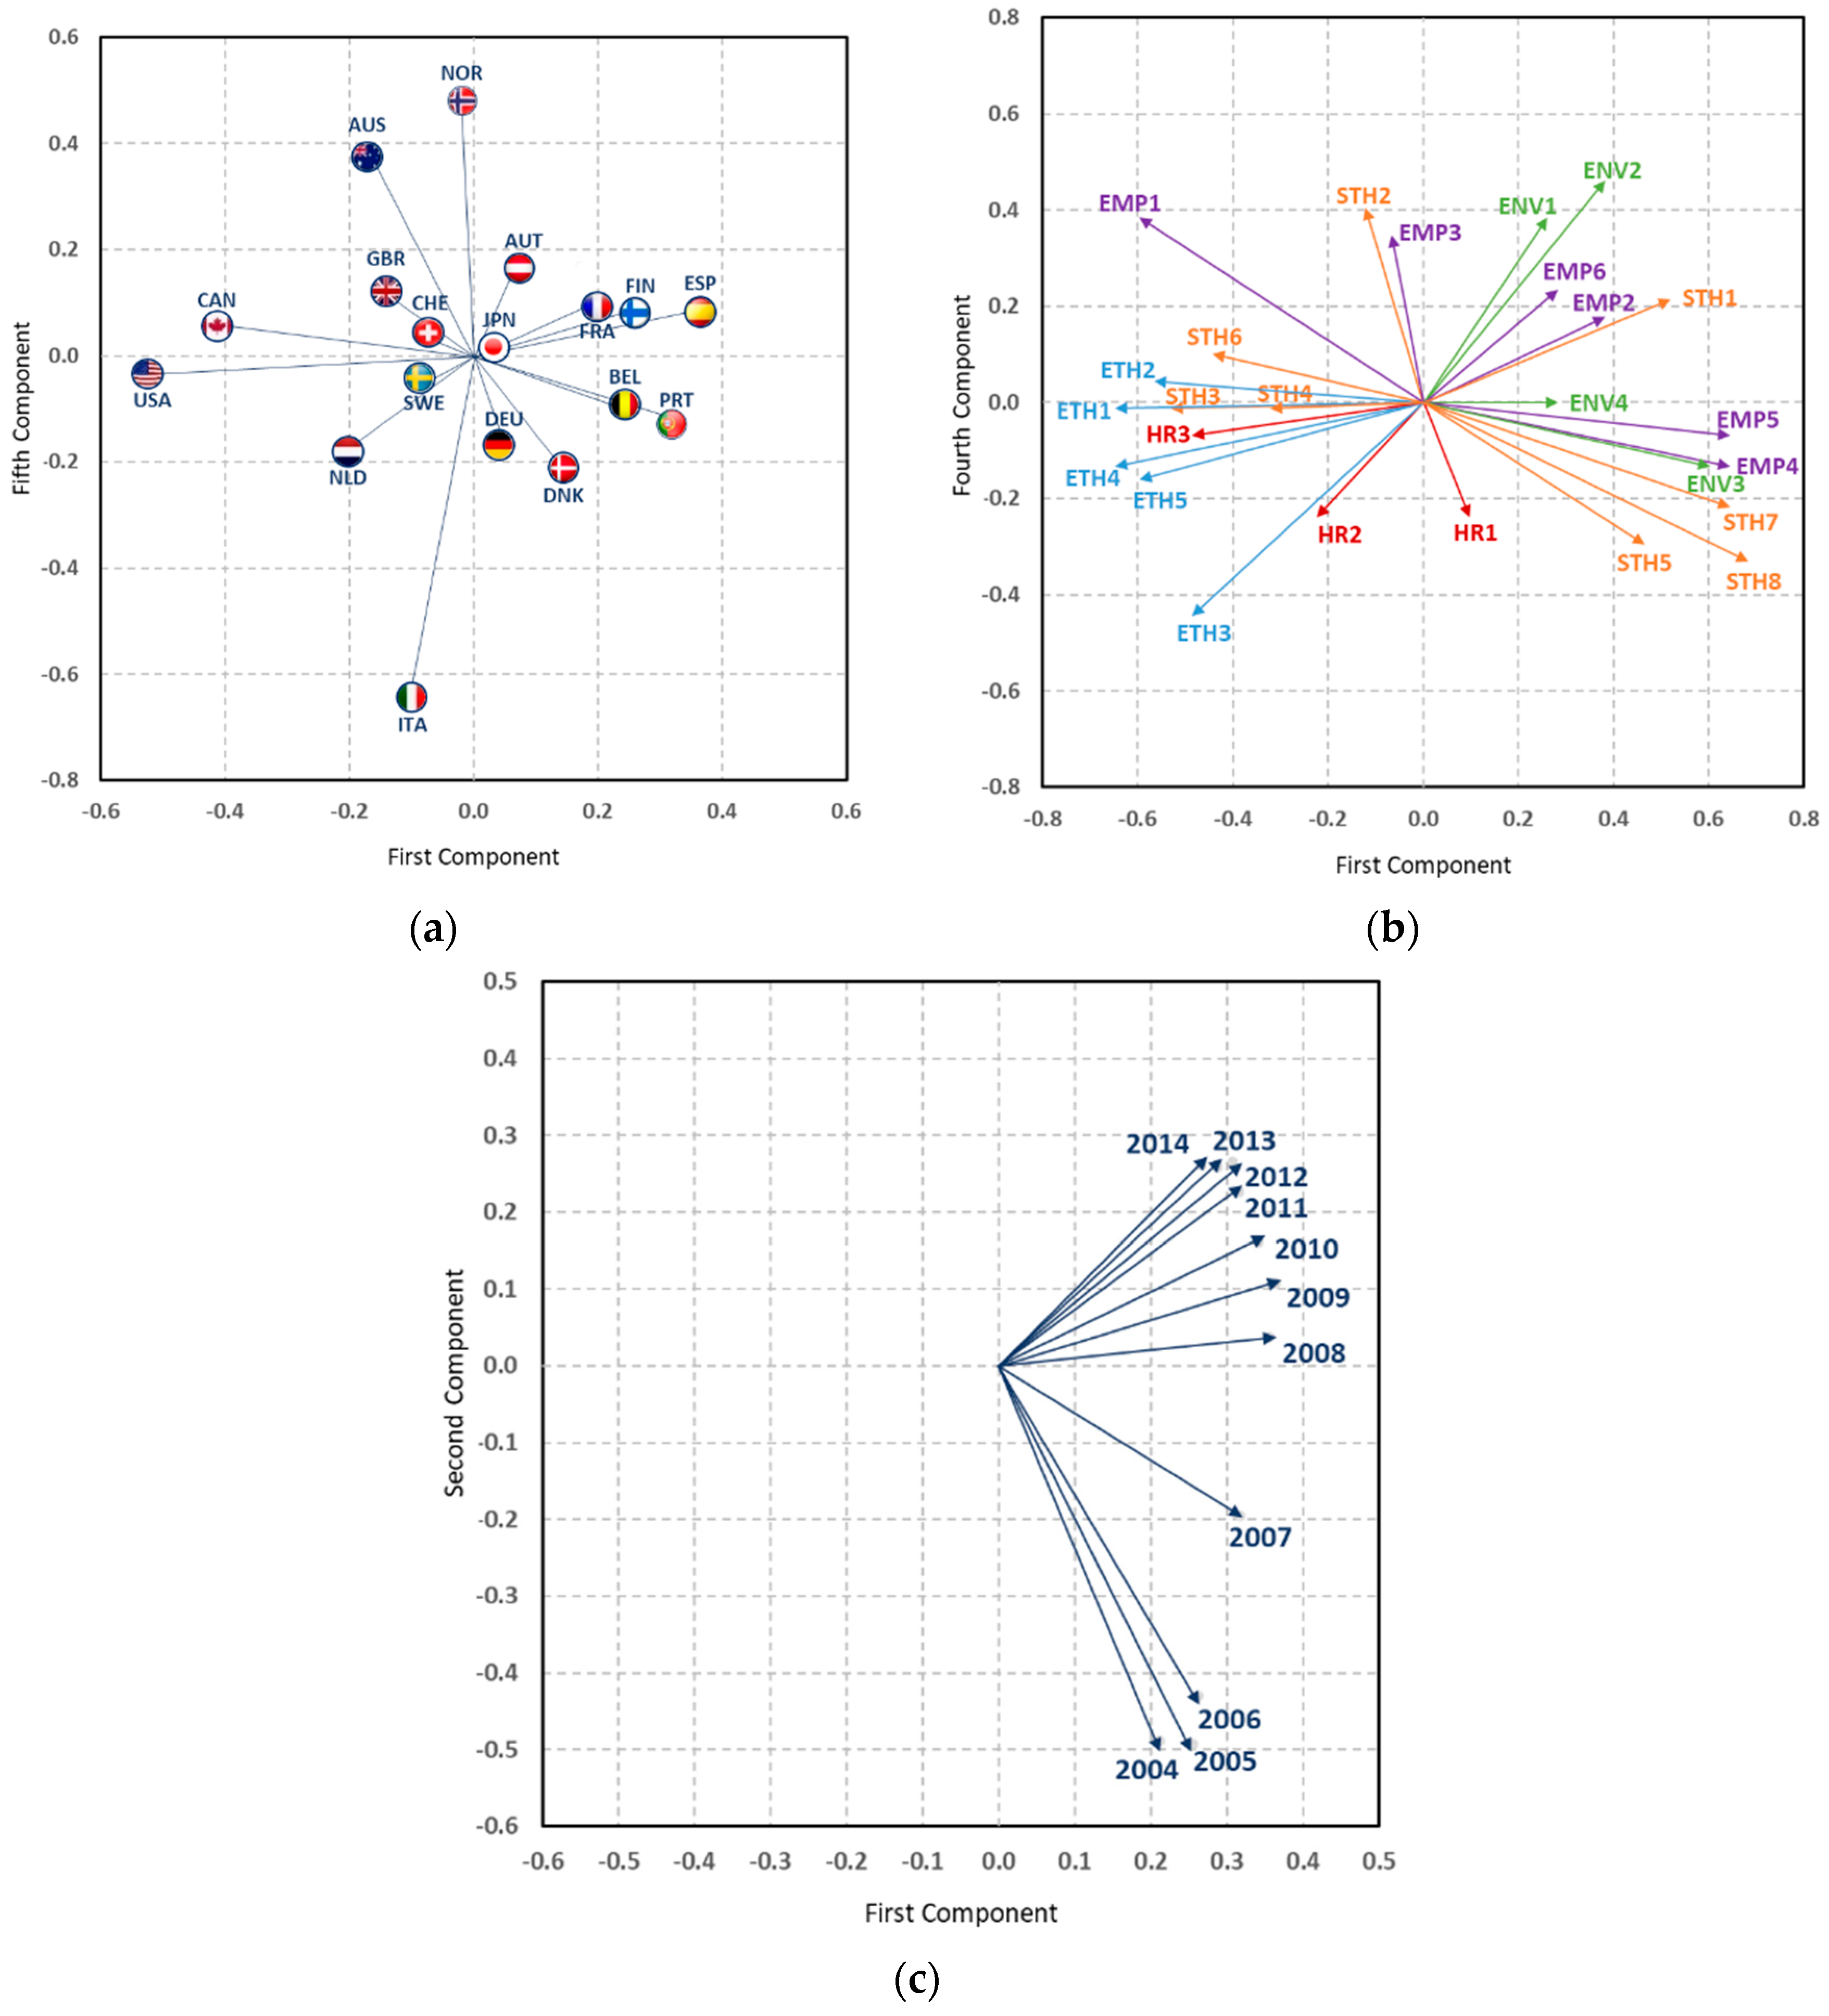
Element G541 interprets the fifth component of the first mode, the fourth of the second mode, and the first of the third mode (Figure 15). Since this element is positive (0.71), the countries that receive negative coordinates in the fifth component, that is, those located in the lower semi-plane, present during all of the years of study a positive interaction with those practices that are also located in the lower semi-plane.
Core matrix element (+) × Countries (−) × CSR Practices (−) × Years (+) = Interaction (+)
That is, in all of the years of study, the corporations based in Italy emphasise their CSR practices in human rights policies and systems (HR1 and HR2), the greater participation of their stakeholders and reports on them (STH5 and STH8), as well as policies to counter bribery (ETH3).

5. Discussion

Although we are accustomed to associating sustainability with the care and preservation of the environment, there are two more areas that an organisation must take care of in order to be considered as sustainable: the social one—with the aim of achieving an adequate relationship and a fluid communication with the people who they are related to it—and the economic one, with the aim of achieving transparent management and a correct distribution of the wealth that is generated. This research works with the environmental and social dimensions, and corroborates that environmental policies, systems, and reports naturally occupy the central part of the company’s sustainability, since a company that neglects its environmental processes cannot be considered as sustainable, without forgetting, in addition, the social pressure to disclose bad environmental news (Ekelenburg 2016; Casey and Grenier 2014; Semenova and Hassel 2008).
In reference to the social dimension of company sustainability, a large part of the practices aimed at maintaining good external relations with stakeholders acquire a similar importance or close to the environmental commitment; these practices have forged a place next to the environmental commitment, and are demanded in most countries. This is so because the CSR is based on the policies and voluntary activities arising from the expectations and pressures from the stakeholders (Matten and Moon 2008; Carroll 1991). These expectations come from the environment where the company operates and are specific to it, so if companies want to receive the approval of the society in which they are immersed, they must meet the behavioural standards imposed by those expectations (García-Sánchez et al. 2013; Campbell 2007). A similar situation occurs with practices aimed at defending the labour rights of the company’s employees, such as health and safety conditions, participation, and training; the companies develop these practices in order to demonstrate that the commitment to their employees goes beyond the levels of protection established by the regulations. In this way, the company can be considered proactive and gain in reputation or social prestige, thus obtaining associated economic advantages related to the growth and survival of the company (Jackson and Apostolakou 2010). The opposite situation occurs with practices related to business ethics, such as those aimed at the implementation of a code of ethics or policies in the fight against bribery; these practices receive less importance than the rest, and may not be entrenched in certain countries or industries. However, they surely have a place in certain companies, which, a priori, is to be assumed in less polluting companies, such as the banking and financial services (Weber 2014; Scholtens 2011; Belu 2009).
This research contrasts the relevance of national identity in the sustainable behaviour of companies with the finding of important national discrepancies, corroborating that companies are concerned with what is important in their countries of origin based on the different pressures and expectations received. Thus, companies coming from European countries are one step above the rest, highlighting those based in the Nordic countries—recognised as welfare states—as leaders in company sustainability with the highest levels in all practices (Welford 2005) and greater predominance in the social aspect, emphasising the human rights of their citizens and the fight against bribery; they are also known for occupying the first positions in the Corruption Perception Index, obviously due to its absence. The next highest commitment is found in companies whose country of origin is located in Southern Europe, partly because they present a weaker legal system than the previous ones (García-Sánchez et al. 2016). Companies in these countries prioritise environmental reports and show a predilection for systems that promote equal opportunities, the participation and training of their employees, as well as systems to maintain good relations with customers and suppliers. In reference to organisations from non-European countries, it should be noted that companies based in Japan only focus on environmental concerns, leaving aside the other practices (Ortas et al. 2015). Finally, in relation to corporations whose headquarters are centralised in North American countries—Canada and the United States—present a lagging position in comparison with their European counterparts in sustainability terms, as other researchers have previously discovered for microdata (Purdy et al. 2010; Matten and Moon 2008; Welford 2004), especially in environmental issues, since companies in these countries give preference to practices aimed at ethical issues.

6. Conclusions

The results show that the companies with the greatest concern in environmental issues, which are the most sustainable, develop with a similar or close priority to these the practices aimed at the development of management systems for labour rights and dealing with different stakeholders, which arise from the employee relationships, as well as transparent dialogue and participation with stakeholders. The practices referring to business ethics acquire a lesser importance for the companies. A great instability is observed in its trajectory during this decade, which explains that said practices are not the main requirement of the groups that are both internal and external of the companies, given the possibility that they are not entrenched in some countries; however, they can be accommodated in certain companies, such as those aimed at financial services whose environmental concern is less.
In this research, we contrast the relevance of national identity in the sustainable behaviour of corporations with the finding of important national discrepancies, which corroborates that the country of origin of companies offers a series of facilities and barriers for the development of CSR practices. Based on the results obtained, we can affirm that the country in which the firms are located is a determinant of the CSR patterns they adopt and their evolution. In addition, we can determine that there is a high level of homogeneity in the CSR practices implemented by organisations whose country of origin is located within the same continent, and there is a high geographical proximity between them. Thus, European companies are a step above in sustainability terms of the rest of countries, especially in environmental performance, more specifically:
The corporations coming from the Nordic countries, highlighting Finland and Norway, are considered the foremost in sustainability terms, presenting the highest levels of human rights practices (policy, system, and report), the fight to counter bribery (policy, system, and report), strong environmental practices, and a strong commitment to the community. Firms based in Switzerland and the Netherlands present characteristics close to these countries, highlighting the latter in human rights and ethics.
Companies whose country of origin is located in Southern Europe—Portugal, Spain, and France—prioritise their practices in environmental matters, systems that promote equal opportunities, the participation and training of their employees, as well as good relations with clients and suppliers and the systems towards the interest groups and their participation.
Other organisations based in Italy—a country that is not very prominent in the study—emphasise their practices in human rights policies and systems, the greater participation of their interest groups, and reports on them, as well as policies to counteract bribery.
Firms whose country of origin is Japan only focus on environmental concerns, leaving aside other practices. Companies based in Austria present low values in the study, giving preference to their performance and environmental reports, the participation of their employees, and the responsibility of their stakeholders in decision-making processes, systems, and reports in the fight to counteract the bribe.
Companies whose headquarters are centralised in North America countries, such as the United States and Canada, are in an inferior position to other countries in relation to their environmental practices, employees, or stakeholders; however, they improve their levels in those practices aimed at ethical issues and of human rights, with low but similar results to those found for companies of other countries, as well as policies in favour of equal opportunities and policies towards their interest groups, or the importance of these as members of the council and relations with the community.
The main contribution to the literature of this document is the usefulness of these data as an essential tool for politicians and public managers in decision-making processes, since they facilitate the observation of the economic, environmental, and social progress of each country, smoothing the road to sustainable development with medium and long-term projections. The availability of these data allows the identification of the structural drivers of growth and the establishment of priorities that allow the design of more effective policies that lead to a greater CSR commitment. The identification of virtues and deficiencies in national sustainability systems allows us to recognise where it is most necessary to adopt or improve CSR practices. These analyses can also be of great help to company managers in their own CSR strategic decisions, as it helps them understand the existing pressures on the environmental and social commitments of those foreign markets in which they decide to diversify their commercial activities.
This document presents limitations that will be considered by the authors in future lines of research. Although one of the main contributions of the study is the use of an international database, the sample is restricted to certain specific countries due to the limited information available in the different databases. In the same way, based on the results obtained, an interesting line of research is opened in order to carry out an individual follow-up of companies from leading countries in sustainable development and, on the contrary, based on those with a deficit in their CSR commercial behaviour, facilitating a comparative study of the role that the managers of the companies, especially the chief executive officer (CEO), could play in the CSR decision making. In this way, one could understand the incentives that lead the CEOs of the companies to invest in CSR practices in the long term in search of improvements in the sustainability of the commercial actions, and the knowledge of this study would help promote the strengths and correct the environmental and social deficiencies derived from economic activity.
Moreover, this document proposes that differences at the national level—the so-called effect of the country of origin—are a key factor that must be taken into account to understand why corporations differ in their approach to CSR; however, it is not reasonable to assume that national states could serve alone as the primary unit of analysis, since there are several factors at the company level that influence the practice of CSR, including the internal organisational structure and the industry in which they operate, as well as the characteristics of leadership, the composition of the board, and the size of the company. Accordingly, future work will be oriented towards analysing these limitations that may well be considered by the authors in future lines of research.

Author Contributions

Conceptualization, Formal Analysis and Writing-Original Draft, V.A.-E.; Methodology, Resources and Supervision, M.-P.G.-V.; Conceptualization, Investigation and Supervision, F.D.

Funding

This research received no external funding.

Conflicts of Interest

The authors declare no conflict of interest.

References

  1. Aaronson, Susan Ariel. 2003. Corporate Responsibility in the Global Village: The British Role Model and the American Laggard. Business and Society Review 108: 309–38. [Google Scholar] [CrossRef]
  2. Amor-Esteban, Víctor, Isabel-María García-Sánchez, and Ma-Purificación Galindo-Villardón. 2017. Analysing the Effect of Legal System on Corporate Social Responsibility (CSR) at the Country Level, from a Multivariate Perspective. Social Indicators Research n.d. , 1–18. [Google Scholar]
  3. Ariztía, Tomas, Dorothea Kleine, S. L. Maria das Graças, Nurjk Agloni, Rita Afonso, and Roberto Bartholo. 2014. Ethical Consumption in Brazil and Chile: Institutional Contexts and Development Trajectories. Journal of Cleaner Production 63: 84–92. [Google Scholar] [CrossRef]
  4. Barbieri, P., C. A. Andersson, D. L. Massart, S. Predonzani, G. Adami, and E. Reisenhofer. 1999. Modeling Bio-Geochemical Interactions in the Surface Waters of the Gulf of Trieste by Three-Way Principal Component Analysis (PCA). Analytica Chimica Acta 398: 227–35. [Google Scholar] [CrossRef]
  5. Baskin, Jeremy. 2006. Corporate Responsibility in Emerging Markets. Journal of Corporate Citizenship 24: 29–47. [Google Scholar] [CrossRef]
  6. Belu, Constantin. 2009. Ranking Corporations Based on Sustainable and Socially Responsible Practices. A Data Envelopment Analysis (DEA) Approach. Sustainable Development 17: 257–68. [Google Scholar] [CrossRef]
  7. Boudt, Kris, Jonathan Cornelissen, and Christophe Croux. 2013. The Impact of a Sustainability Constraint on the Mean-Tracking Error Efficient Frontier. Economics Letters 119: 255–60. [Google Scholar] [CrossRef]
  8. Bustamante, Silke. 2011. Localization vs. Standardization: Global Approaches to CSR Management in Mulitinational Companies. Institute of Management. Available online: http://institut-ina.de/wp-content/uploads/2015/05/2011_03_CSR-multinational-companies.pdf (accessed on 18 April 2018).
  9. Campbell, John L. 2006. Institutional Analysis and the Paradox of Corporate Social Responsibility. American Behavioral Scientist 49: 925–38. [Google Scholar] [CrossRef]
  10. Campbell, John L. 2007. Why Would Corporations Behave in Socially Responsible Ways? An Institutional Theory of Corporate Social Responsibility. Academy of Management Review 32: 946–67. [Google Scholar] [CrossRef]
  11. Carroll, Archie B. 1999. Corporate Social Responsibility Evolution of a Definitional Construct. Business & Society 38: 268–95. [Google Scholar]
  12. Carroll, Archie B. 1991. The Pyramid of Corporate Social Responsibility: Toward the Moral Management of Organizational Stakeholders. Business Horizons 34: 39–48. [Google Scholar] [CrossRef]
  13. Casey, Ryan J., and Jonathan H. Grenier. 2014. Understanding and Contributing to the Enigma of Corporate Social Responsibility (CSR) Assurance in the United States. Auditing: A Journal of Practice & Theory 34: 97–130. [Google Scholar]
  14. Davis, Keith. 1973. The Case for and against Business Assumption of Social Responsibilities. Academy of Management Journal 16: 312–22. [Google Scholar]
  15. DiMaggio, Paul, and Walter W. Powell. 1983. The Iron Cage Revisited: Collective Rationality and Institutional Isomorphism in Organizational Fields. American Sociological Review 48: 147–60. [Google Scholar] [CrossRef]
  16. Dolédec, Sylvain, and Daniel Chessel. 1994. Co-Inertia Analysis: An Alternative Method for Studying Species-Environment Relationships. Freshwater Biology 31: 277–94. [Google Scholar] [CrossRef]
  17. Dypdahl, Kristin. 2015. CSR and the Country of Origin Effect in Multinational Corporations—An Comparativ and Contextual Analysis of Brazilian and Norwegian MNCs in the Oil and Gas Industries. Master’s thesis, Utrecht University, Utrecht, The Netherlands. [Google Scholar]
  18. Ekelenburg, Matthijs van. 2016. Determinants of Voluntary External Assurance on Corporate Sustainability Reports: A Comparison between Europe and North America. Available online: http://theses.ubn.ru.nl/handle/123456789/1684 (accessed on 20 April 2018).
  19. Escoufier, Yves. 1976. Opérateur Associé à Un Tableau de Données. In Annales de l’INSEE. París: ADRES, pp. 165–79. Available online: http://www.jstor.org/stable/20075217 (accessed on 17 April 2018).
  20. Esteban, Victor Amor, Ma Purificacion Galindo Villardon, and Isabel Maria Garcia Sanchez. 2017. Cultural Values on CSR Patterns and Evolution: A Study from the Biplot Representation. Ecological Indicators 81: 18–29. [Google Scholar] [CrossRef]
  21. Filatotchev, Igor, and Günter K. Stahl. 2015. Towards Transnational CSR. Corporate Social Responsibility Approaches and Governance Solutions for Multinational Corporations. Organizational Dynamics 44: 121–29. [Google Scholar] [CrossRef]
  22. Florini, Ann, and Saleena Saleem. 2011. Information Disclosure in Global Energy Governance. Global Policy 2: 144–54. [Google Scholar] [CrossRef]
  23. García-Sánchez, Isabel-Maria, Beatriz Cuadrado-Ballesteros, and Jose-Valeriano Frias-Aceituno. 2016. Impact of the Institutional Macro Context on the Voluntary Disclosure of CSR Information. Long Range Planning 49: 15–35. [Google Scholar] [CrossRef]
  24. García-Sánchez, Isabel-María, and Emma García-Meca. 2017. CSR Engagement and Earnings Quality in Banks. The Moderating Role of Institutional Factors. Corporate Social Responsibility and Environmental Management 24: 145–58. [Google Scholar] [CrossRef]
  25. García-Sánchez, Isabel-María, Lázaro Rodríguez-Ariza, and José-Valeriano Frías-Aceituno. 2013. The Cultural System and Integrated Reporting. International Business Review 22: 828–38. [Google Scholar] [CrossRef]
  26. Gjølberg, Maria. 2009. Measuring the Immeasurable? Scandinavian Journal of Management 25: 10–22. [Google Scholar] [CrossRef]
  27. Gjølberg, Maria. 2012. The Political Economy of Corporate Social Responsibility (CSR). Ph.D. dissertation, University of Oslo, Oslo, Norway. [Google Scholar]
  28. Grauel, Jonas, and Daniel Gotthardt. 2016. The Relevance of National Contexts for Carbon Disclosure Decisions of Stock-Listed Companies: A Multilevel Analysis. Journal of Cleaner Production 133: 1204–17. [Google Scholar] [CrossRef]
  29. Habisch, André, Jan Jonker, Martina Wegner, and René Schmidpeter. 2005. Corporate Social Responsibility across Europe. Berlin: Springer, Available online: https://books.google.nl/books?hl=es&lr=&id=4tu5VKLfy2UC&oi=fnd&pg=PA1&dq=Habisch,+A.,+Jonker,+J.,+%26+Wegner,+M.+(2005).+Corporate+social+responsibility+across+Europe.+Berlin:+Springer.&ots=hCT_ZjTDHZ&sig=GRtqhd9oGcQpZ6tdl1gHGSA_Nhk (accessed on 18 April 2018).
  30. Halkos, George, and Antonis Skouloudis. 2016. National CSR and Institutional Conditions: An Exploratory Study. Journal of Cleaner Production 139: 1150–56. [Google Scholar] [CrossRef]
  31. Ioannou, Ioannis, and George Serafeim. 2012. What Drives Corporate Social Performance? The Role of Nation-Level Institutions. Journal of International Business Studies 43: 834–64. [Google Scholar] [CrossRef]
  32. Jackson, Gregory, and Androniki Apostolakou. 2010. Corporate Social Responsibility in Western Europe: An Institutional Mirror or Substitute? Journal of Business Ethics 94: 371–94. [Google Scholar] [CrossRef]
  33. Jaffrenou, Pierre-Alain. 1978. Sur l’analyse Des Familles Finies de Variables Vectorielles: Bases Algébriques et Application à La Description Statistique. Ph.D. Thèse, Université de Lyon, Lyon, France. [Google Scholar]
  34. Jamali, Dima, Yusuf Sidani, and Khalil El-Asmar. 2009. A Three Country Comparative Analysis of Managerial CSR Perspectives: Insights from Lebanon, Syria and Jordan. Journal of Business Ethics 85: 173–92. [Google Scholar] [CrossRef]
  35. Kiers, Henk A. L., and Albert Kinderen. 2003. A Fast Method for Choosing the Numbers of Components in Tucker3 Analysis. British Journal of Mathematical and Statistical Psychology 56: 119–25. [Google Scholar] [CrossRef] [PubMed]
  36. Kolk, Ans, and Paolo Perego. 2010. Determinants of the Adoption of Sustainability Assurance Statements: An International Investigation. Business Strategy and the Environment 19: 182–98. [Google Scholar] [CrossRef]
  37. Kroonenberg, Pieter M. 2008. Applied Multiway Data Analysis. Hoboken: John Wiley & Sons, vol. 702. [Google Scholar]
  38. Lenssen, Gilbert, Wojciech Gasdparski, Boleslaw Rok, Peter Lacy, Atle Midttun, Kristian Gautesen, and Maria Gjølberg. 2006. The Political Economy of CSR in Western Europe. Corporate Governance: The International Journal of Business in Society 6: 369–85. [Google Scholar]
  39. León, Juan Ángel Poyatos. 2015. Análisis de la Relación Causal de la Responsabilidad Social Corporativa y la Performance Financiera de las Empresas. Ph.D. dissertation, Universitat Politècnica de València, València, Spain, March 31. [Google Scholar] [CrossRef]
  40. L’Hermier des Plantes, H. 1976. Structuration Des Tableauya Trois Indices de La Statistique. Thése de 3eme Cycle. Montpellier: Université Montpellier II. [Google Scholar]
  41. Maignan, Isabelle, and David A. Ralston. 2002. Corporate Social Responsibility in Europe and the US: Insights from Businesses’ Self-Presentations. Journal of International Business Studies 33: 497–514. [Google Scholar] [CrossRef]
  42. Martínez-Ferrero, Jennifer, and Isabel-María García-Sánchez. 2016. Coercive, Normative and Mimetic Isomorphism as Determinants of the Voluntary Assurance of Sustainability Reports. International Business Review 26: 102–18. [Google Scholar] [CrossRef]
  43. Matten, Dirk, and Jeremy Moon. 2008. ‘Implicit’ and ‘Explicit’ CSR: A Conceptual Framework for a Comparative Understanding of Corporate Social Responsibility. Academy of Management Review 33: 404–24. [Google Scholar] [CrossRef]
  44. Matten, Dirk, and Jeremy Moon. 2004. Implicit and Explicit CSR. A Conceptual Framework to Understand CSR in Europe. ICCSR Research Paper Series 29: 1–27. [Google Scholar]
  45. Noorderhaven, Niels G., and Anne-Wil Harzing. 2003. The ‘Country-of-Origin Effect’ in Multinational Corporations: Sources, Mechanisms and Moderating Conditions. In Management and International Review. Berlin: Springer, pp. 47–66. [Google Scholar]
  46. Oliver, Christine. 1991. Strategic Responses to Institutional Processes. Academy of Management Review 16: 145–79. [Google Scholar] [CrossRef]
  47. Ortas, Eduardo, Igor Álvarez, Jacques Jaussaud, and Ainhoa Garayar. 2015. The Impact of Institutional and Social Context on Corporate Environmental, Social and Governance Performance of Companies Committed to Voluntary Corporate Social Responsibility Initiatives. Journal of Cleaner Production 108: 673–84. [Google Scholar] [CrossRef]
  48. Pauly, Louis W., and Simon Reich. 1997. National Structures and Multinational Corporate Behavior: Enduring Differences in the Age of Globalization. International Organization 51: 1–30. [Google Scholar] [CrossRef]
  49. Purdy, Jill M., Elizabeth A. Alexander, and Stern Neill. 2010. The Impact of National Institutional Context on Social Practices: Comparing Finnish and US Business Communities. European Journal of International Management 4: 234–56. [Google Scholar] [CrossRef]
  50. Ringov, Dimo, and Maurizio Zollo. 2007. The Impact of National Culture on Corporate Social Performance. Edited by Gilbert Lenssen. Corporate Governance: The International Journal of Business in Society 7: 476–85. [Google Scholar] [CrossRef]
  51. Scholtens, Bert. 2011. Corporate Social Responsibility in the International Insurance Industry. Sustainable Development 19: 143–56. [Google Scholar] [CrossRef]
  52. Scott, W. Richard. 1995. Institutions and Organizations. Foundations for Organizational Science. London: SAGE Publication. [Google Scholar]
  53. Semenova, Natalia, and Lars G. Hassel. 2008. Financial Outcomes of Environmental Risk and Opportunity for US Companies. Sustainable Development 16: 195–212. [Google Scholar] [CrossRef]
  54. Simier, Monique, L. Blanc, Frédéric Pellegrin, and Daniel Nandris. 1999. Approche Simultanée de $ K $ Couples de Tableaux: Application à l’étude Des Relations Pathologie Végétale-Environnement. Revue de Statistique Appliquée 47: 31–46. [Google Scholar]
  55. Tang, Lu, and Hongmei Li. 2009. Corporate Social Responsibility Communication of Chinese and Global Corporations in China. Public Relations Review 35: 199–212. [Google Scholar] [CrossRef]
  56. Thioulouse, Jean, Monique Simier, and Daniel Chessel. 2004. Simultaneous Analysis of a Sequence of Paired Ecological Tables. Ecology 85: 272–83. [Google Scholar] [CrossRef]
  57. Tucker, Ledyard R. 1966. Some Mathematical Notes on Three-Mode Factor Analysis. Psychometrika 31: 279–311. [Google Scholar] [CrossRef] [PubMed]
  58. Weber, Jessica Lee. 2014. Corporate Social Responsibility Disclosure Level, External Assurance and Cost of Equity Capital. University of Colorado at Boulder. Available online: http://gradworks.umi.com/36/35/3635946.html (accessed on 20 April 2018).[Green Version]
  59. Welford, Richard. 2004. Corporate Social Responsibility in Europe and Asia: Critical Elements and Best Practice. The Journal of Corporate Citizenship 13: 31–47. [Google Scholar] [CrossRef]
  60. Welford, Richard. 2005. Corporate Social Responsibility in Europe, North America and Asia: 2004 Survey Results. The Journal of Corporate Citizenship 17: 33–52. [Google Scholar] [CrossRef]
  61. Whetten, David A., Gordon Rands, and Paul Godfrey. 2002. What Are the Responsibilities of Business to Society. In Handbook of Strategy and Management. London: SAGE, pp. 373–408. [Google Scholar]
  62. Whitley, Richard. 1992. European Business Systems: Firms and Markets in Their National Contexts. Newcastle upon Tyne: SAGE. [Google Scholar]
  63. Witt, Michael A., and Gordon Redding. 2011. The Spirits of Corporate Social Responsibility: Senior Executive Perceptions of the Role of the Firm in Society in Germany, Hong Kong, Japan, South Korea and the USA. Socio-Economic Review 10: 109–34. [Google Scholar] [CrossRef]
Figure 1. Diagram of procedure on which the X-STATICO analysis is based.
Admsci 08 00050 g001
Figure 2. Scheme of procedure on which the X-STATIS analysis is based.
Admsci 08 00050 g002
Figure 3. Scheme of procedure on which the Tucker3 analysis is based.
Admsci 08 00050 g003
Figure 4. Example model selection of a Tucker3 analysis.
Admsci 08 00050 g004
Figure 5. Interpretation diagram core matrix elements of a Tucker3 analysis.
Admsci 08 00050 g005
Figure 6. Diagram of the procedure of X-STATICO analysis.
Admsci 08 00050 g006
Figure 7. Factorial plane 1–2 representation with the ordering of the sampling years, interstructure study of the X-STATICO analysis.
Admsci 08 00050 g007
Figure 8. Compromise analysis of X-STATICO. (a) environmental practices; (b) social practices.
Admsci 08 00050 g008
Figure 9. Corporate Social Responsibility (CSR) practical trajectories, X-STATICO analysis.
Admsci 08 00050 g009
Figure 10. Diagram Procedure Tucker3 analysis.
Admsci 08 00050 g010
Figure 11. Model selection graph, Tucker3 analysis.
Admsci 08 00050 g011
Figure 12. Graphics for the interpretation of the G111 and G221 elements of core matrix, Tucker3 analysis. (a) countries; (b) CSR practices; (c) years.
Admsci 08 00050 g012
Figure 13. Graphics for the interpretation of the G331 element of core matrix, Tucker3 analysis. (a) countries; (b) CSR practices; (c) years.
Admsci 08 00050 g013
Figure 14. Graphics for the interpretation of the G451 element of core matrix, Tucker3 analysis. (a) countries; (b) CSR practices; (c) years.
Admsci 08 00050 g014
Figure 15. Graphics for the interpretation of the G541 element of core matrix, Tucker3 analysis. (a) countries; (b) CSR practices; (c) years.
Admsci 08 00050 g015
Table 1. Distribution of companies by country of origin.
CountriesObservations% CountriesObservations%
1Australia4627.02Austria440.7
3Belgium771.24Canada4406.7
5Denmark1211.86Finland1101.7
7France4296.58Germany4076.2
9Italy1432.210Japan110016.6
11Netherlands1652.512Norway661.0
13Portugal440.714Spain1652.5
15Sweden2754.216Switzerland2203.3
17United Kingdom106716.118United States126519.1
Total6600100.0
Table 2. Composition of Corporate Social Responsibility Practices. EIRIS: Ethical Investment Research Services.
Environmental Dimension
Environment
ENV1Environmental policyHow does EIRIS rate the company’s environmental policy and commitment?
ENV2Environmental systemsHow does EIRIS rate the company’s environmental management system?
ENV3Environmental reportingHow does EIRIS rate the company’s environmental reporting?
ENV4Environmental performanceWhat level of improvements in environmental impact can the company demonstrate?
Social dimension
Human Rights
HR1Human rights policyWhat is the extent of policy addressing human rights issues?
HR2Human rights systemsWhat is the extent of systems addressing human rights issues?
HR3Human rights reportingDoes the company report on human rights issues?
Employees
EMP1Equal opportunities (policy)How good is the company’s policy on equal opportunity and diversity issues?
EMP2Equal opportunities (systems)How clear is the evidence of systems and practices to support equal opportunities and diversity?
EMP3Health and safety systemsHow clear is the evidence of health and safety systems?
EMP4Trade unions and employee participationHow clear is the evidence of systems that manage employee relations?
EMP5TrainingHow clear is the evidence of systems that support employee training and development?
EMP6Job creation and securityHow clear is the evidence of systems and practices that advance job creation and security?
Stakeholders
STH1Community relationsHow clear is the company’s commitment to community or charitable work?
STH2Customer/supplier relations policyDoes the Ccmpany have policies on maintaining good relations with customers and/or suppliers?
STH3Community involvementHow clear is the evidence of systems that maintain good relations with the community?
STH4Responsibility for stakeholdersHow many stakeholder issues have been allocated to board members?
STH5Stakeholder engagementWhat level of engagement with stakeholders is disclosed by the company?
STH6Stakeholder policyHow good are the company’s policies towards its stakeholders overall?
STH7Stakeholder systemsHow good is the company’s quantitative systems on stakeholder relationships?
STH8Stakeholder reportingHow good are the company’s management reporting for stakeholders overall?
Ethics and Governance
ETH1Codes of ethicsDoes the company have a code of ethics and, if so, how comprehensive is it?
ETH2Codes of ethics systemsDoes the company have a system for implementing a code of ethics and, if so, how comprehensive is it?
ETH3Countering bribery policyWhat is the extent of the company’s policy for countering bribery?
ETH4Countering bribery systemsWhat is the extent of the company’s system for countering bribery?
ETH5Countering bribery reportingWhat is the extent of the company’s reporting on countering bribery?
ETH6Board practiceHow many of the core elements of corporate governance does the company have?
ETH7ESG risk managementHow well do the board and senior management address company-wide ESG (Environmental, Social, and Governance) risks and opportunities?
Table 3. All Combinations of Possible Models, Tucker3 Analysis.
Summary of All Permissible Analyses with Components Less Than 5 × 5 × 5. Overall Fitted and Residual Sum of Squares (SS)
Model SizeSum of Components (S)Best given SDifference in Prop. FitSS(Res)Proportional SS (Fit)Proportional SS (Res)Number of Iterations
11 × 1 × 13*0.23619.859890.23620.763819
21 × 2 × 25 19.466440.25130.748724
31 × 3 × 37 19.365550.25520.744831
41 × 4 × 49 19.305200.25750.742530
51 × 5 × 511 19.269060.25890.741138
62 × 1 × 25 19.544060.24830.751724
72 × 2 × 15*0.10717.076680.34320.656850M
82 × 2 × 26*0.01116.803650.35370.646350M
92 × 2 × 37 16.781060.35460.645450M
102 × 2 × 48 16.775410.35480.645250M
112 × 3 × 27 16.174050.37790.622150M
122 × 3 × 38 16.131950.37950.620550M
132 × 3 × 49 16.106930.38050.619550M
142 × 3 × 510 16.100820.38070.619350M
152 × 4 × 28 15.927830.38740.612650M
162 × 4 × 39 15.835000.39100.609050M
172 × 4 × 410 15.799690.39230.607750M
182 × 4 × 511 15.788500.39280.607250M
192 × 5 × 310 15.678870.39700.603050M
202 × 5 × 411 15.612180.39950.600550M
212 × 5 × 512 15.584460.40060.599450M
223 × 1 × 37 19.478510.25080.749250M
233 × 2 × 27 16.314060.37250.627533
243 × 2 × 38 16.242970.37530.624727
253 × 2 × 49 16.223520.37600.624050M
263 × 2 × 510 16.207270.37660.623450M
273 × 3 × 17*0.07114.960000.42460.575450M
283 × 3 × 28*0.02114.425260.44520.554850M
293 × 3 × 39 14.359780.44770.552350M
303 × 3 × 410 14.333470.44870.551350M
313 × 3 × 511 14.315490.44940.550650M
323 × 4 × 29 13.733590.47180.528250M
333 × 4 × 310 13.641080.47530.524750M
343 × 4 × 411 13.600550.47690.523150M
353 × 4 × 512 13.576350.47780.522250M
363 × 5 × 210 13.115280.49560.504450M
373 × 5 × 311 13.011220.49960.500450M
383 × 5 × 412 12.952150.50180.498250M
393 × 5 × 513 12.912160.50340.496650M
404 × 1 × 49 19.428400.25280.747250M
414 × 2 × 28 16.072940.38180.618234
424 × 2 × 39 15.990500.38500.615035
434 × 2 × 410 15.965330.38590.614150M
444 × 2 × 511 15.947400.38660.613450M
454 × 3 × 29 13.920070.46460.535450M
464 × 3 × 310 13.816350.46860.531450M
474 × 3 × 411 13.772970.47030.529750M
484 × 3 × 512 13.751820.47110.528950M
494 × 4 × 19*0.03213.580590.47770.522350M
504 × 4 × 210*0.03912.558890.51700.483050M
514 × 4 × 311 12.440250.52150.478550M
524 × 4 × 412 12.359330.52460.475450M
534 × 4 × 513 12.330070.52580.474250M
544 × 5 × 211*0.03011.769550.54730.452750M
554 × 5 × 312 11.625590.55290.447150M
564 × 5 × 413 11.532610.55640.443650M
574 × 5 × 514 11.484480.55830.441750M
585 × 1 × 511 19.403790.25370.746350M
595 × 2 × 310 15.889050.38890.611132
605 × 2 × 411 15.843460.39060.609433
615 × 2 × 512 15.822710.39140.608650M
625 × 3 × 210 13.757250.47090.529150M
635 × 3 × 311 13.612200.47650.523550M
645 × 3 × 412 13.552780.47870.521350M
655 × 3 × 513 13.528120.47970.520350M
665 × 4 × 211 12.181210.53150.468550M
675 × 4 × 312 12.044180.53680.463250M
685 × 4 × 413 11.938680.54080.459250M
695 × 4 × 514 11.896040.54250.457550M
705 × 5 × 111 12.375260.52400.476050M
715 × 5 × 212*0.02911.011600.57650.423550M
725 × 5 × 313*0.00610.850580.58270.417350M
735 × 5 × 414*0.00610.705680.58820.411850M
745 × 5 × 515*0.00110.668970.58970.410350M
Note: * = best solution for a given value of the sum of number of components. M = maximum number of iterations was reached.
Table 4. Combinations with Better Fit, Tucker3 Analysis.
Sum of ComponentsModel SizeDifference in Prop. FitProp. SS (Fit)
131 × 1 × 10.236160.2362
752 × 2 × 10.107050.3432
862 × 2 × 20.010500.3537
2773 × 3 × 10.070910.4246
2883 × 3 × 20.020570.4452
4994 × 4 × 10.032490.4777
50104 × 4 × 20.039300.5170
54114 × 5 × 20.030360.5473
71125 × 5 × 20.029150.5765
72135 × 5 × 30.006190.5827
73145 × 5 × 40.005570.5882
74155 × 5 × 50.001410.5897
Table 5. Variance Explained by Modes and Total, Tucker3 Analysis.
ModeVariance TotalComponents by Mode
12345
ACountries0.5760.2430.1250.1020.0650.041
BCSR Practices0.5760.2410.1280.0870.0630.057
CYears0.5760.4980.079
Total variance explained0.576
Table 6. Core Matrix, Tucker3 Analysis.
CORE MATRIXMode 2 ComponentsMode 2 Components
Sum of Residual SquaresVariance Explained (%)
1234512345
Mode 3, Component 1Mode 1 components12.45−0.090.03−0.09−0.0623.200.000.000.000.00
20.091.46−0.62−0.16−0.010.008.301.500.100.00
3−0.070.641.15−0.65−0.010.001.505.101.600.00
40.050.09−0.40−0.470.890.000.000.600.903.00
50.080.220.410.710.530.000.200.602.001.10
Mode 3, Component 2Mode 1 components1−0.24−0.100.230.030.380.200.000.200.000.60
20.210.60−0.010.530.060.201.400.001.100.00
30.23−0.48−0.05−0.190.440.200.900.000.100.80
4−0.27−0.32−0.42−0.36−0.180.300.400.700.500.10
50.010.120.00−0.02−0.210.000.100.000.000.20

