1. Introduction
In many countries, Germany included, the legislative authorities are falling behind in enforcing laws to regulate corruption. The pharmaceutical industry, and specifically the companies which are members of the European Federation of Pharmaceutical Industries and Associations (EFPIA) or its German equivalent, the Verband der forschenden Arzneimittelhersteller (vfa), is stepping ahead with its implementation of a new transparency disclosure code for cooperation between pharmaceutical companies and health care professionals (HCPs) and health care organisations (HCOs). In Germany, this transparency code (“Transparenzkodex”) has been applicable since January 2015, and will be publicly available starting 2016. There is no empirical work that addresses the impact of the transparency code on cooperation between HCPs, HCOs and the pharmaceutical companies, including the possibilities for conducting competitive analysis of the available data.
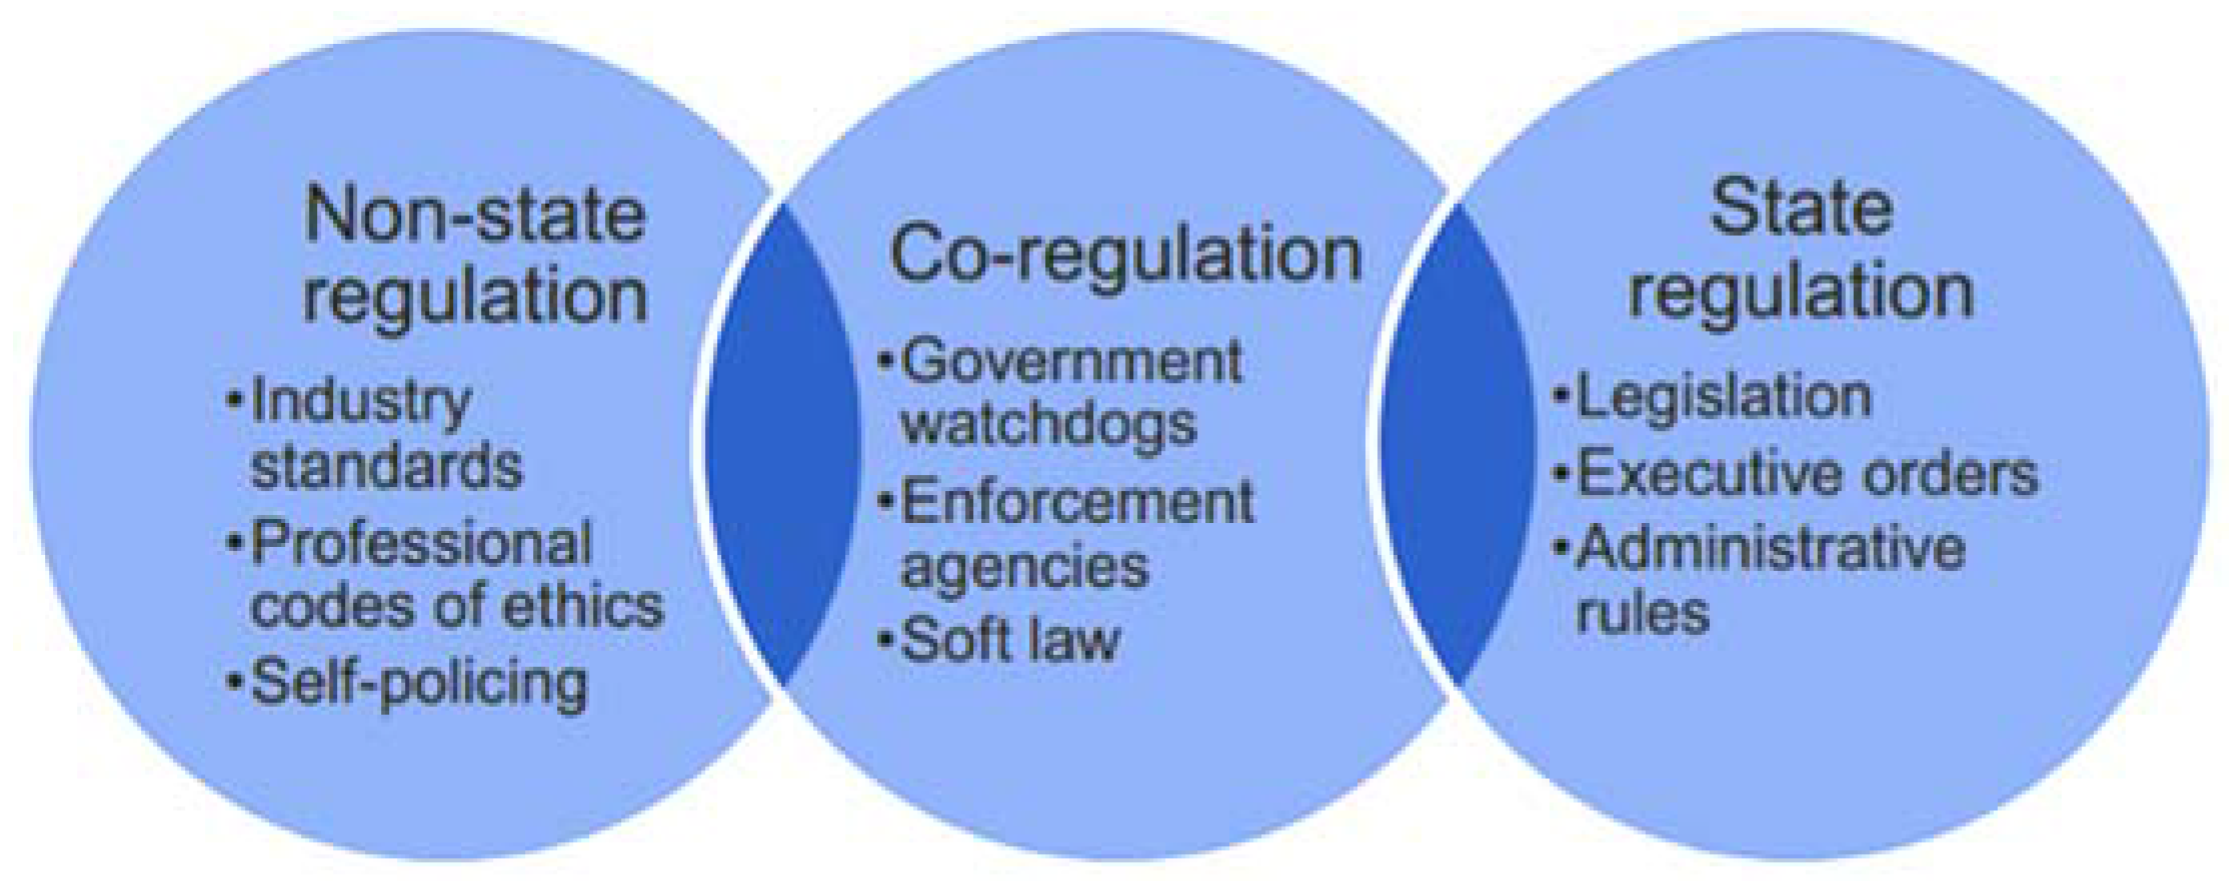
Regulatory styles vary considerably between countries and industries, and their impact on the economy depends on the nature of the regulation and how efficiently and effectively it is implemented [
1].
Figure 1 shows the three basic options.
State regulations are generally associated with heavy costs for companies, both in terms of complying with new laws and also with regards to the degree of competitive freedom of doing business. In addition, in today’s global economy, country-specific laws may not be sufficient, and self-regulation is vital to maintain industry standards, to develop and apply codes of professional ethics and to ensure consumer confidence. In some industries, such as the tobacco industry, self-regulation may be considered a failure [
2]. Most recent banking regulations and laws seem not have been gone far enough [
3]. Blinder [
4] calls self-regulation in financial markets an oxymoron. Haufler [
5] looked at self-regulation in the dimensions of environment, labour, and information privacy with an equally critical assessment. In other industries, including forestry, marine fisheries and the food industry, self-regulation has successfully led to the setting of standards that improve the industry as a whole [
6].
The manufacture of drugs in the pharmaceutical industry is one of the most regulated processes world-wide. Local laws regulate standards for e.g., drug production as well as for drug promotion to customers (including physicians and patients). In Germany, the law for promotion of drugs regulates promotional activities by pharmaceutical companies. In addition, a number of self-regulation codices, local as well as European, govern various aspects of drug manufacture and distribution. Nevertheless, failures of both governmental regulations and self-regulation are regularly reported and remain a problem worldwide, e.g., with regards to counterfeit drugs or promotion of drugs outside the indicated label—so called off-label promotion [
7,
8,
9].
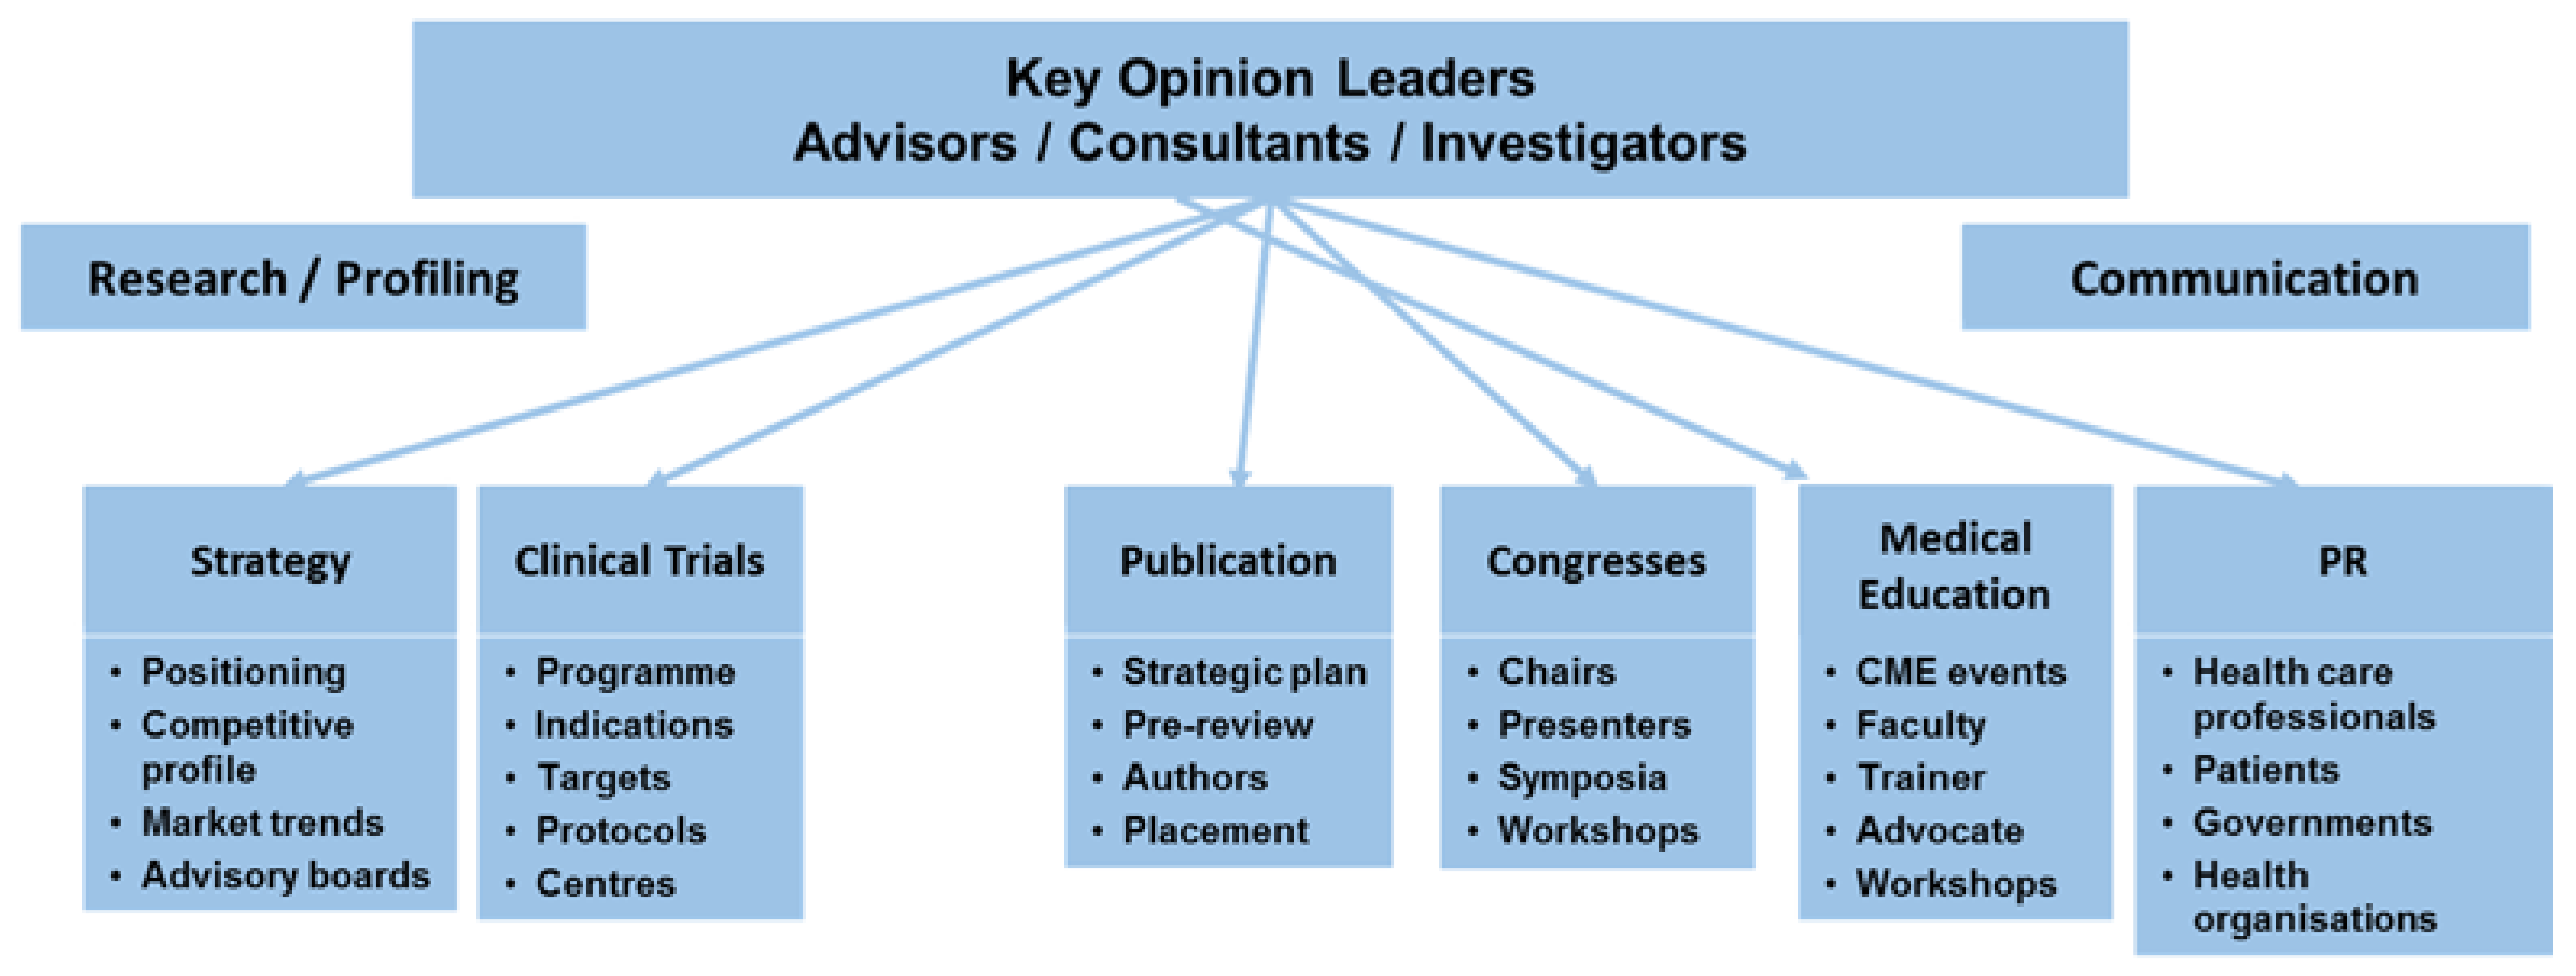
Throughout the drug life cycle, pharmaceutical companies regularly interact with HCPs/HCOs. Interactions may occur as early as during the design phase, e.g., in form of advisory work by experts in the field, during the research phase of the clinical testing in various trials, and also at later stages during launch and promotion of drugs, e.g., in the form of further advisory board participations, conference talks, and certainly during promotional visits by sales representatives or visits by medical representatives for drug or disease related queries.
Figure 2 summarises important cooperation between pharmaceutical companies and HCPs/HCOs during the drug’s life cycle. These interactions are of great importance and benefit to both HCPs/HCOs and the pharmaceutical companies in terms of exchange of information and education, as well as response to existent market needs.
Figure 2 is not exhaustive and may vary between different types of drugs as well as different countries according to local regulations.
It has been noted that in the last two decades that the dominant business model of major pharmaceutical companies has been characterised by massive spending on marketing, especially directed towards physicians [
10,
11].
In 2010, the enactment of the Physician Payment Sunshine Act (PPSA) in the U.S.A marked the first governmental involvement in disclosures related to promotional spending [
12]. The PPSA built on existing state-laws and voluntary industry measures, and requires disclosure of payments and gifts to physicians in addition to prohibiting giving select gifts altogether [
13]. Overall, the PPSA has improved transparency in marketing and other activities between HCPs/HCOs and pharmaceutical companies [
12].
The European Federation of Pharmaceutical Industries and Associations (EFPIA) disclosure code aims to increase transparency in the pharmaceutical industry with respect to collaboration between HCOs/HCPs and the pharmaceutical companies. The national implementation in Germany of this European code is the transparency code (“Transparenzkodex”) which is led by the vfa and the “Freiwillige Selbstkontrolle für die Arzneimittelindustrie e.V.” (FSA), a voluntary self-regulation organisation for the pharmaceutical industry [
14,
15]. In agreement with the EFPIA disclosure code, from 1 January 2015, German pharmaceutical companies who are members of the vfa will document their payments to HCPs/HCOs in a way that enables making the data publicly available in the following year,
i.e., 2016, for the first time. Disclosure of payments to physicians has already been done to varying degrees in some European countries for some time. In the UK, for example, the members of the Association of the British Pharmaceutical Industry (ABPI) committed themselves in 2010 to disclosing the total sums paid and the total number of physicians who they worked with and sums given to patients’ organisations [
16]. Compared to the USA or other European countries, Germany decided rather late to aim for more transparency in the cooperation between pharmaceutical companies and HCPs/HCOs. To lead the way, members of the vfa committed themselves to report details on four types of transactions with HCPs/HCOs:
- (1)
Research and development;
- (2)
Donations (without return services);
- (3)
Support for educational events, e.g., travel, registration fees etc. and
- (4)
Consultancy honoraria [
15].
Since the German transparency code is not a law, it is enforced through personal commitment by the members of the vfa. Although this includes the majority of pharmaceutical companies, there are some notable exceptions, including Teva Pharmaceuticals ranking 11th globally in terms of profits of pharmaceutical companies in 2014. Furthermore, Germany has some of the most strict personal data protection laws. Making allowance for these laws, the physicians have to “opt in” to the transparency agreement, i.e., they have to agree that the payments made to them by the companies are made publicly available. If they opt out of the transparency code, their payments are reported in an aggregated form by the company for each type of transaction described above. It is currently not known how many physicians will opt out of the code, which would naturally undermine the effectiveness of the code.
The German pharmaceutical market is the largest market in Europe and the fourth largest market worldwide [
17]. It has played an important role in the Germany economy since its establishment, and approximately 110,000 people were employed in the pharmaceutical industry in Germany in 2013 [
18], in 920 companies [
17]. The pharmaceutical industry in Germany is represented by several associations, including the German Association of Research-based Pharmaceutical Companies (vfa), the German Association for the Pharmaceutical Industry (BPI), and the German Association of Pharmaceutical Producers (BAH). The BAH has the most members among the pharmaceutical industry associations in Germany, with more than 450 members; primarily pharmaceutical producers, but also pharmacists, lawyers, publishers, agencies, as well as market and opinion research institutes in the healthcare field [
19]. The BPI [
20] represents approximately 240 companies, including traditional pharmaceutical companies, pharmaceutical service providers, and companies in the fields of biotechnology, herbal medicine and homeopathy/anthroposophy. The vfa [
14] represents the interests of 44 global leaders in research-based pharmaceutical companies and more than 100 subsidiaries and affiliated companies in healthcare, research, and economic policy. The members of the vfa have founded the FSA which promotes voluntary self-regulation in the drug industry [
15]. Finally, those companies that manufacture generic and biosimilar products in Germany have formed “Pro Generika” [
21], counting 16 member companies in Germany.
2. Experimental Section
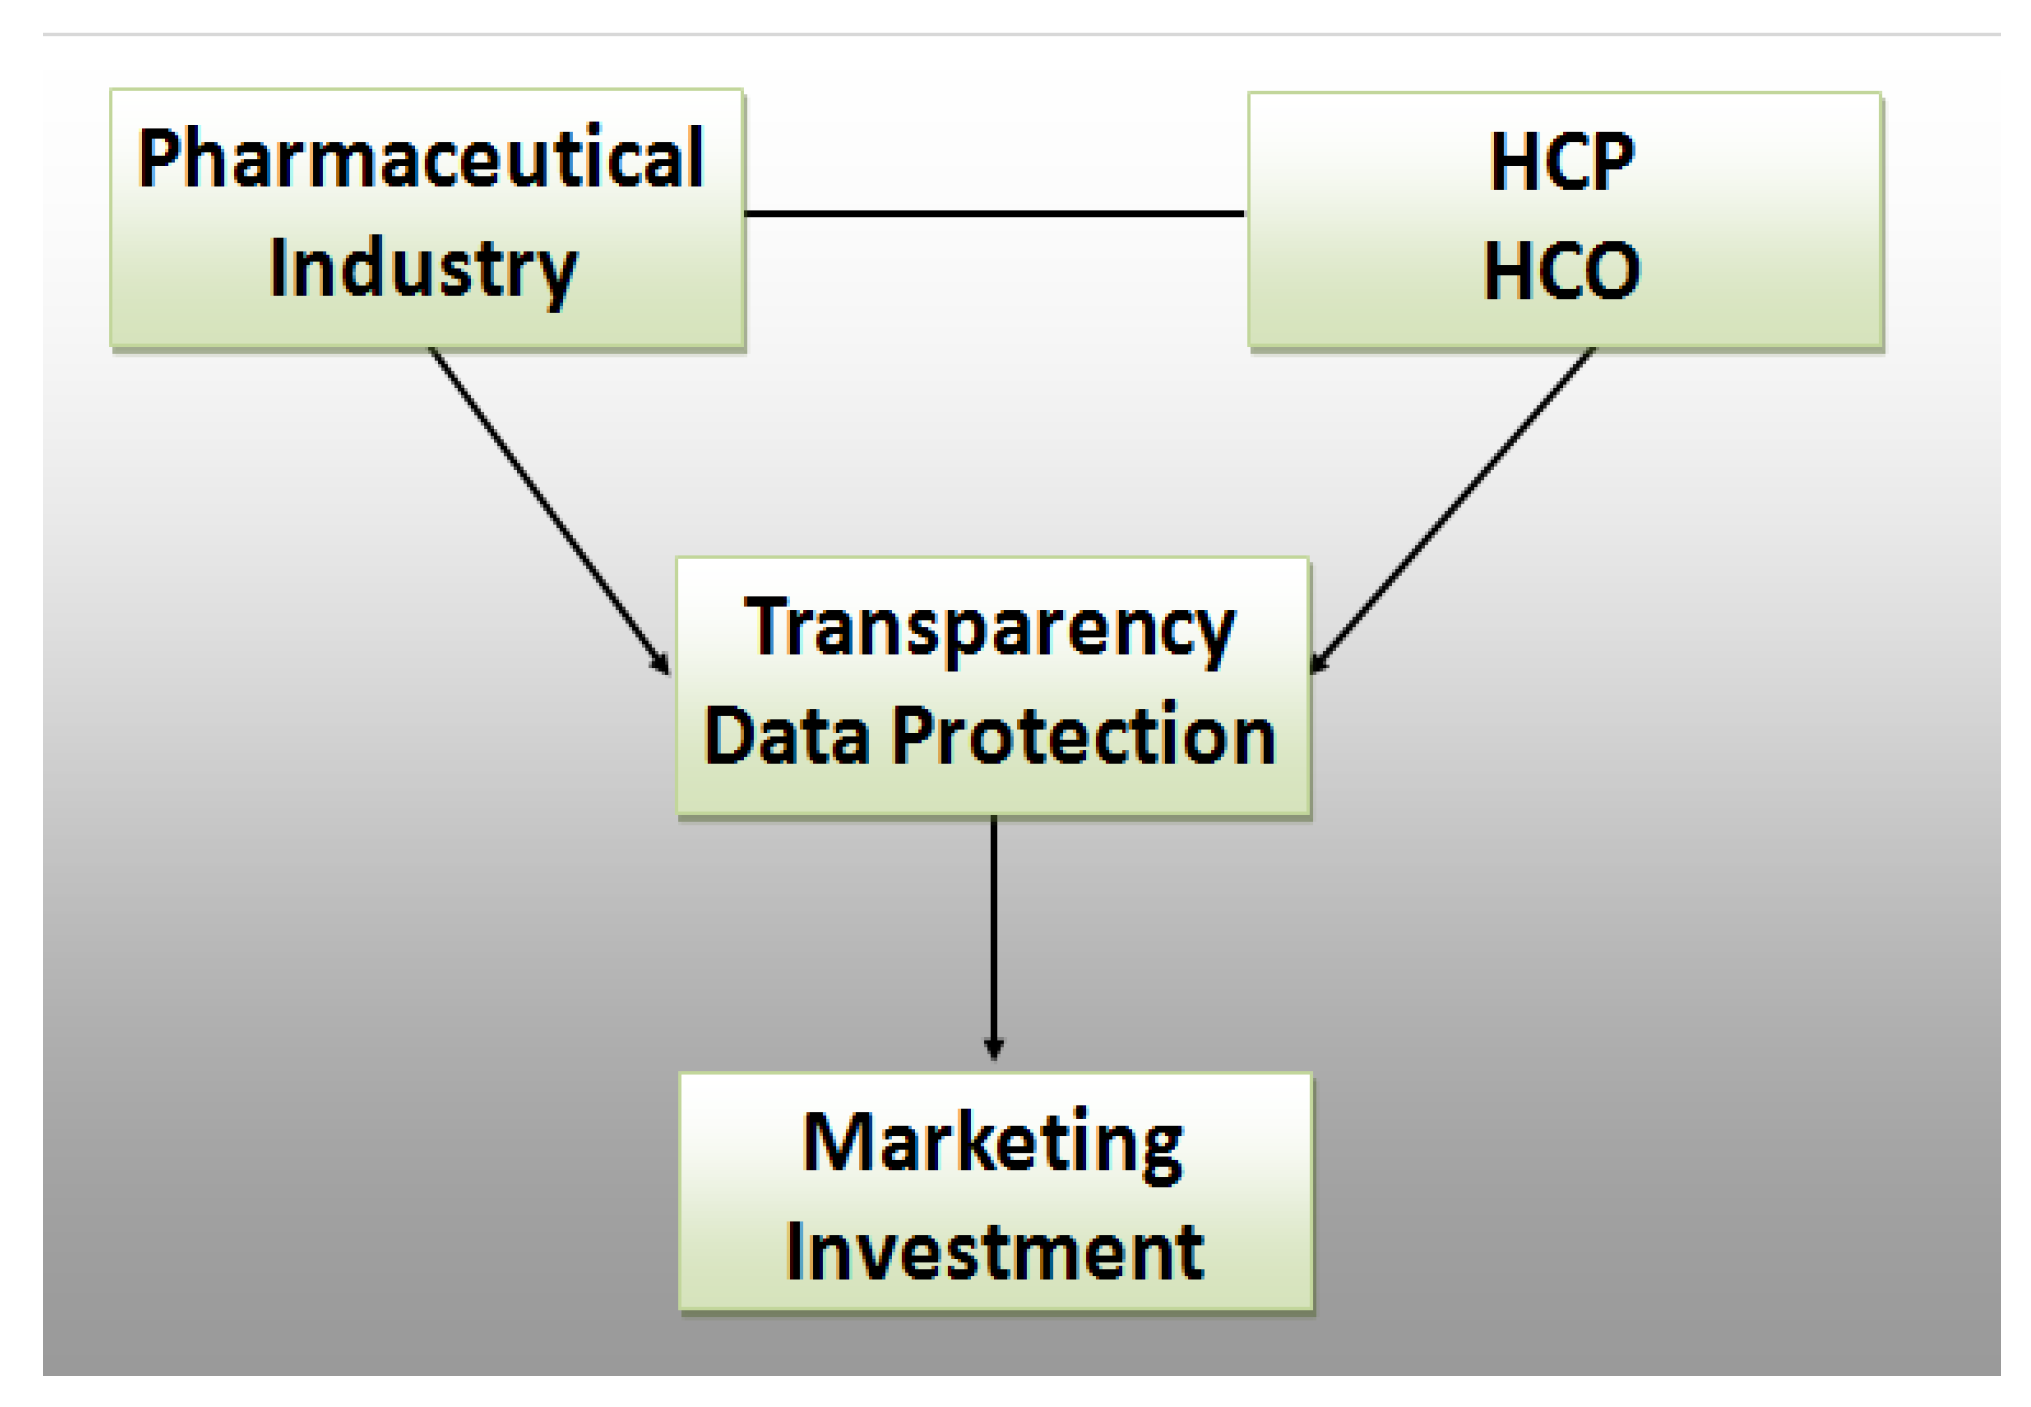
With our research we tried to predict the behaviour of pharmaceutical companies in light of the new self-regulation, see
Figure 3.
Pharmaceutical industry and HCO/HCP have been transactional partners for ages. Whereas the Transparency Code tries to shed light on the relationship, data protection works the opposite way by strengthening non-disclosure rights of individuals and organisations. In theory, if the market is fully transparent, then the pharmaceutical industry should allocate their marketing investments in the most economical way possible. However, human behaviour is not always rational. To predict possible reactions, we conducted expert interviews of pharmaceutical decision makers and let them play a zero sum game. The focus was on key opinion leaders (KOL).
The Research Objectives were:
- -
To forecast pharmaceutical companies’ likely reaction to the transparency code;
- -
To assess the perceived advantages and disadvantages for different departments;
- -
To identify major factors that impact decision making of pharmaceutical companies;
- -
To study the anticipated marketing investment in KOL;
- -
To predict whether the transparency code will pass the test of time.
The interview guideline was divided into six parts starting with questions on the transparency code in general, moving to possible implications for the cooperation between HCPs/HCOs and the pharmaceutical companies, and finally addressing the possibility of competitive analysis by using the available data. We did not focus on HCPs and HCOs because pharmaceutical companies are in the driver’s seat by allocating funds; analysing the receiving end is beyond the scope of this paper. Further research may look into group differences between HCP professionals such as cardiologists, oncologists, dentists etc. and types (demographics) of HCOs.
Our research was conducted in a mixed method approach [
22]. Besides qualitative interview questions, the respondents were asked to give numerical values to specific questions. For this, a 1 (totally agree) to 5 (totally disagree) Likert scale was used.
The 11 interviewees of the sample were identified as key personnel within their organisation dealing with the transparency code. Identification criteria for participation in the survey included e.g., being a member of the compliance department, being a member of the working group dealing with the transparency code within the company, and/or being directly affected by the implementation of the transparency code, i.e., by being in regular contact with HCPs/HCOs in their daily work. In this way, participants included employees in a variety of positions in the pharmaceutical industry, and also from both vfa member and non-member companies. No honoraria were paid to the participants.
Combined turnover of the sampled companies represents 80% of the German pharmaceutical industry. A broader sample would have been desirable but there are currently just a few specialised key employees in each company. Diluting the sample with people who are unfamiliar with the upcoming regulation would have biased the results. The participants were recruited for participation by the authors through personal contacts or by recommendation. The authors provided names and company demographics to the reviewers but cannot make it public. In this article, we will call the interviewees, as a matter of simplification, “participants”.
Participants rated the statement “the new transparency code will help to make the cooperation between pharmaceutical companies and HCP/HCO more transparent” with an average 2.18, suggesting that most participants agreed with this statement. Nevertheless, in the qualitative interview, some general criticism was voiced when asked for comments on the transparency code. Most participants stated that they do not believe the transparency code will meet its full objective being voluntary, unlike the PPSA which is law. In the qualitative part of the interviews, some participants anticipated that it is only a matter of time until the disclosure will become a law in Germany as well. In any case, participants assumed that although some HCPs are sceptical with regard to the disclosure code, both the pharmaceutical industry and the physicians will quickly get used to this increase in transparency. Although these statements cannot be generalised since they were only voiced by some of the participants, one may assume that others agree, since no contradictory statements were voiced during the interviews.
To evaluate possible investments in KOLs, the authors designed a simple game consisting of four companies. All players had a background in pharmaceuticals. The players were faced with a dilemma: they could invest heavily in KOL engagement and risk that their competitors do the same, which reduces overall market profitability. Alternatively, they could spend less with a sustainable profit. The latter works best for all four companies if all spend 25 out of a total of 100. If every company allocated more than 50 points (out of 100) then all companies face a loss. The companies may be able to compensate in the short term through their carried forward profit, but nevertheless this would harm their own profitability as well as their competitors. If all companies choose extreme strategies (0 or 100) they will also face a loss. The dilemma game gave insight into the potential effects of future KOL marketing investment, as well as potential effects of company size and liquidity on risk taking and competitive spending.
The authors facilitated five games each covering 10 rounds and hypothesised that players do not behave rationally when confronted with choices concerning their own (company) well-being
versus the overall (market) well-being [
23]. The following hypotheses were postulated:
The company with the highest profit (in the scenario) takes the most risk;
Non-sales people are more risk-averse;
Companies will compete irrationally for KOLs beyond economic reasoning;
Players will continuously increase spending due to fear of losing out and hoping competitors will pull back.
As previously mentioned, the objective of the simulation game was to analyse the behaviour of pharma decision makers in the context of KOL marketing investment. Four pharmaceutical companies (
i.e., four players) compete for KOLs. To reflect the real economy the four companies start with different carried forward profits which are:
| Company (= Player) A | 500 |
| Company (= Player) B | 1000 |
| Company (= Player) C | 1500 |
| Company (= Player) D | 2000 |
Each company could allocate between 0 and 100 KOL points per round (participants were told to think of it as a percentage of the total marketing budget allocated for KOLs).
Companies were not allowed to collaborate i.e., talk to each other!
Each company had fixed costs of 1000 per round. Ten rounds were played.
Profit was calculated as follows:
- (1)
Profit per KOL: 200 − total allocated points of all four companies
- (2)
Total profit of round: Profit per KOL × KOL points − 1000 (fixed costs)
- (3)
Total profit: Profit of current round + profit carried forward from last round
Example:
| Company/Player | allocated KOL points |
| A | 10 |
| B | 35 |
| C | 15 |
| D | 50 |
3. Results and Discussion
The interview participants generally agreed that any physicians wishing to hide their income will continue to find a way to do so. This is in agreement with a statement issued by the German Society of Haematology and medical Oncology (Deutsche Gesellschaft für Hämatologie und medizinische Onkologie, DGHO); the society is one of the leading oncology societies in Germany and one may assume that their opinion is shared by other societies, although currently, no society positions itself as clearly as the DGHO. In an official statement, the DGHO “embraces transparency” as a crucial element to allow trust between patients and physicians, but regrets that it is a voluntary participation and calls for governmental intervention as previously mentioned in the literature review [
24].
Most participants agreed that the implementation of the disclosure changes the cooperation between the companies and the HCPs/HCOs (mean = 2.36). Qualitative answers detailed that HCPs/HCOs would be more selective in their cooperation with pharmaceutical companies, but at the same time also more careful in maintaining working relationships with several (competing) companies in order to avoid being accused of bribery for prescription of drugs from the same companies. On the other hand, some companies stated that they will only continue to enter into contracts with those physicians who opt in to the disclosure code, which may potentially decrease the number of physicians available for e.g., consultancy services (if suitable physicians opt out of disclosure).
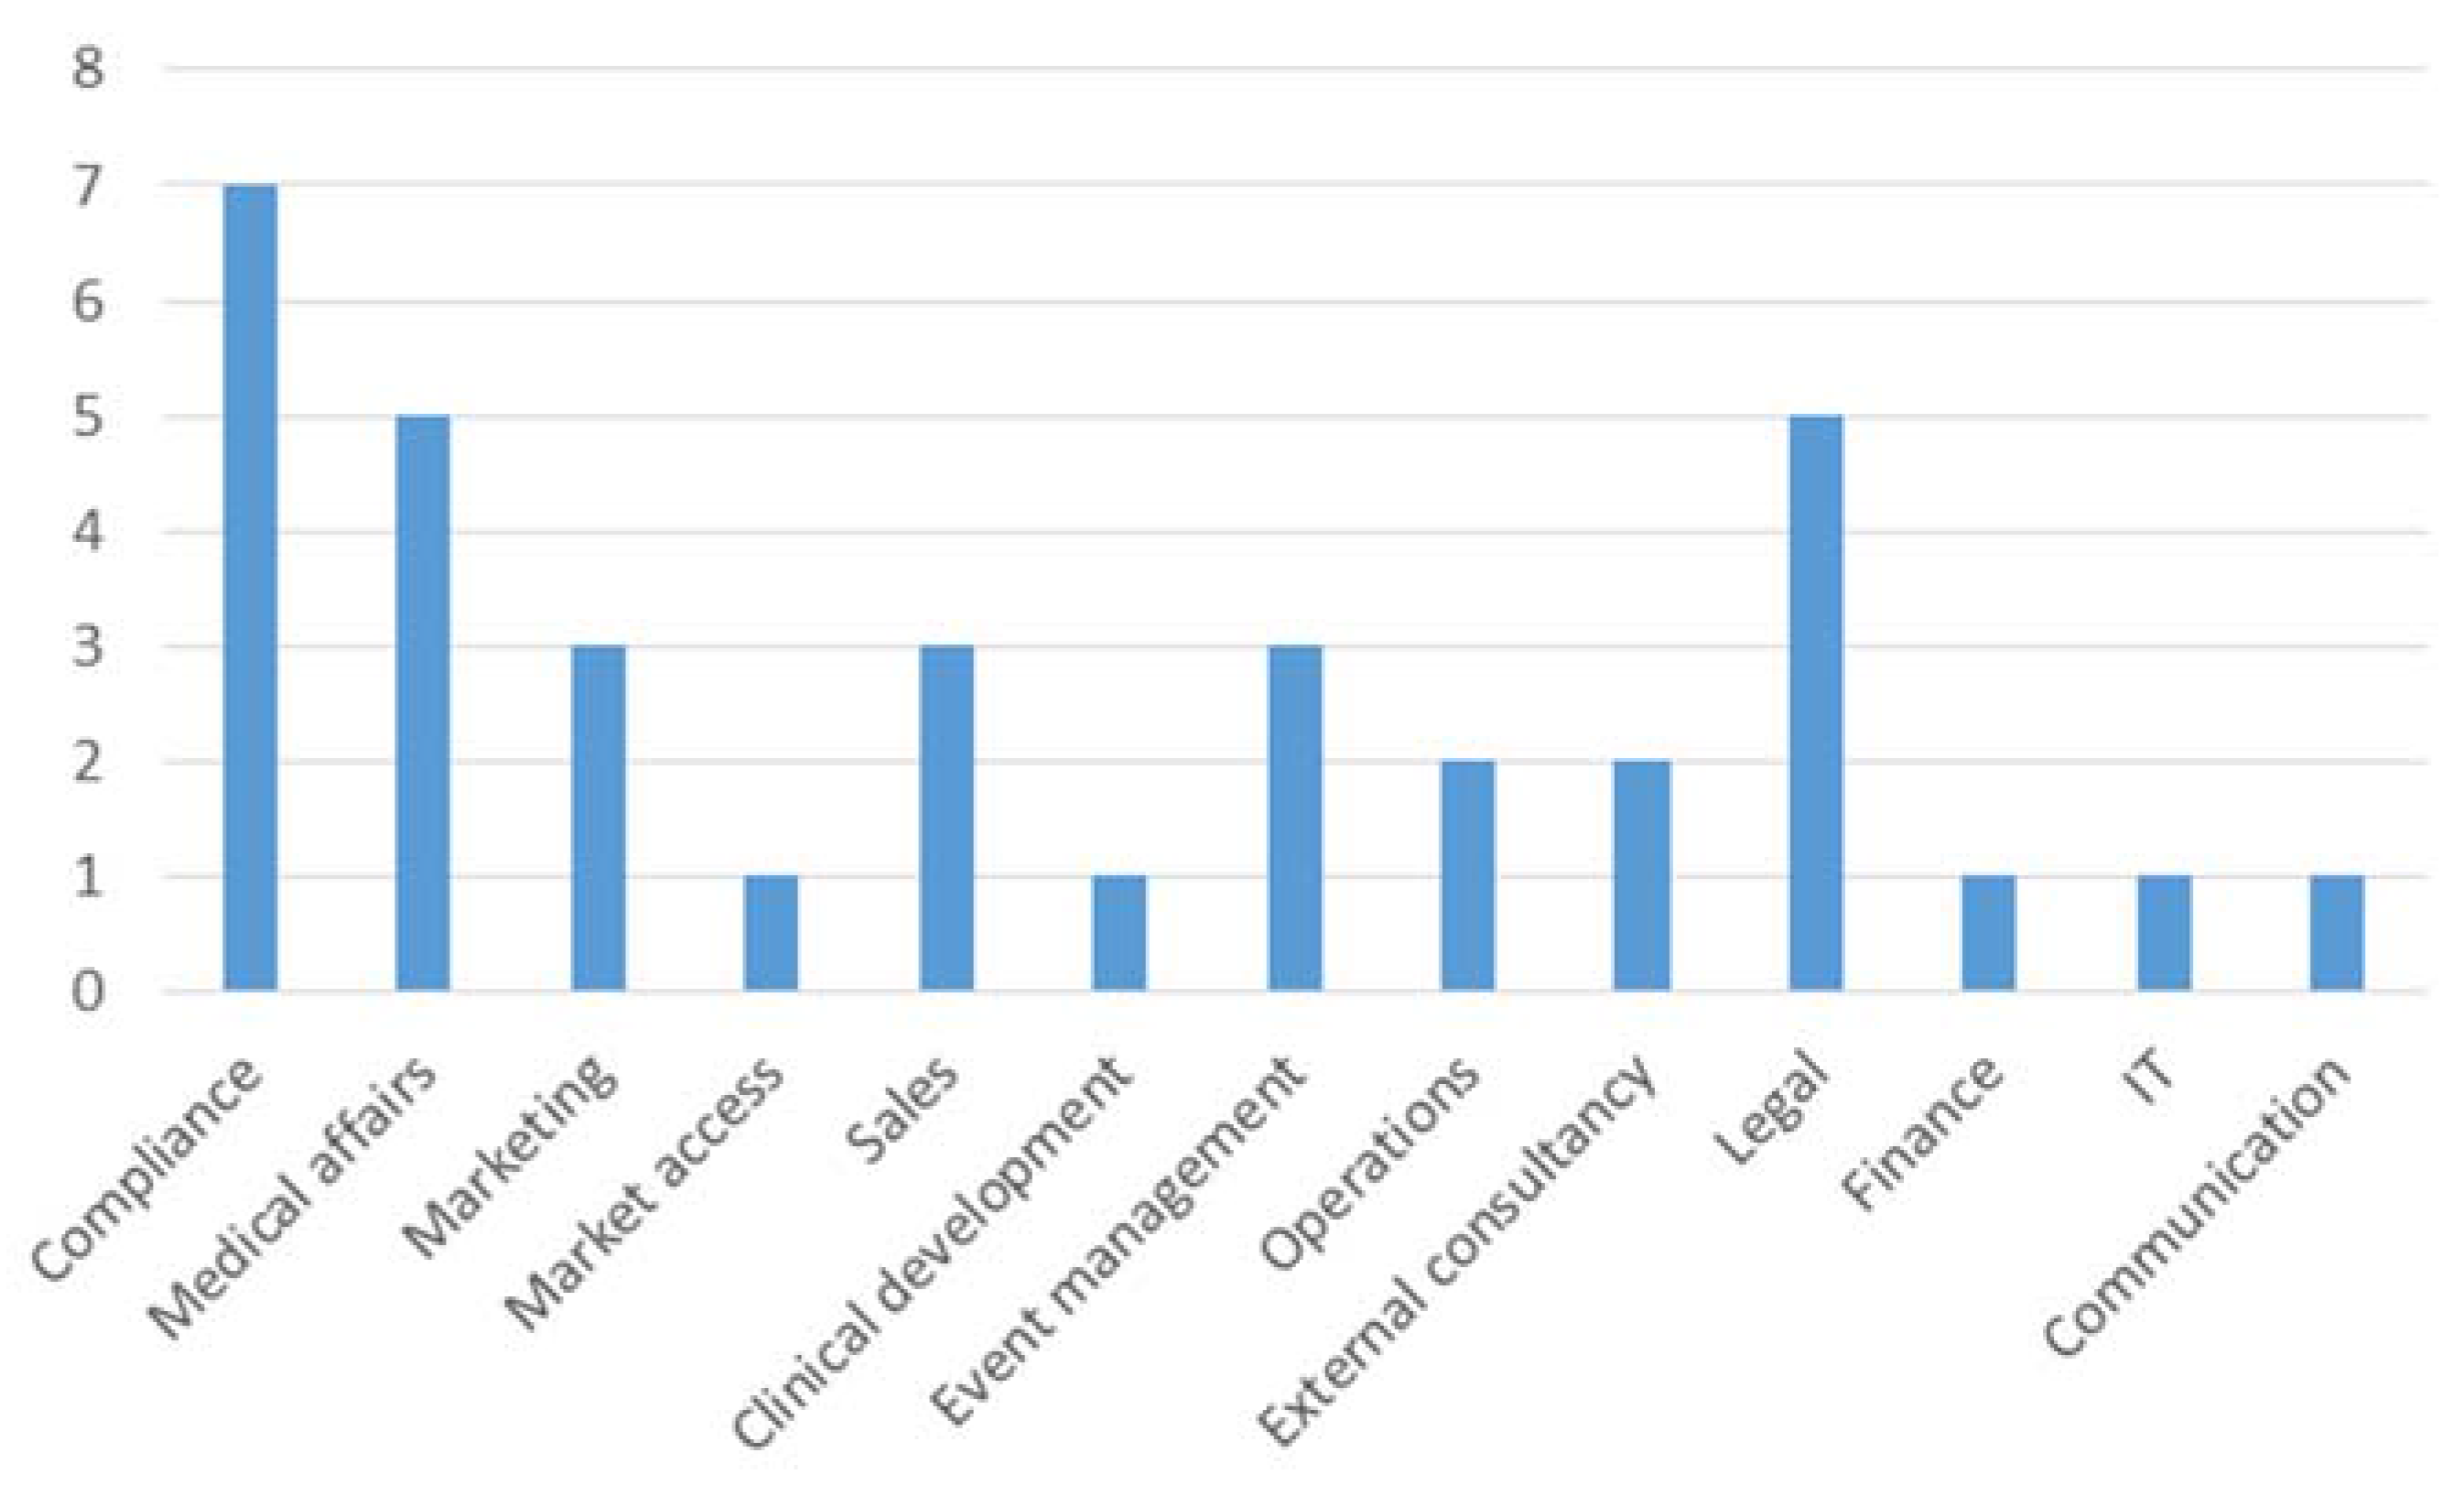
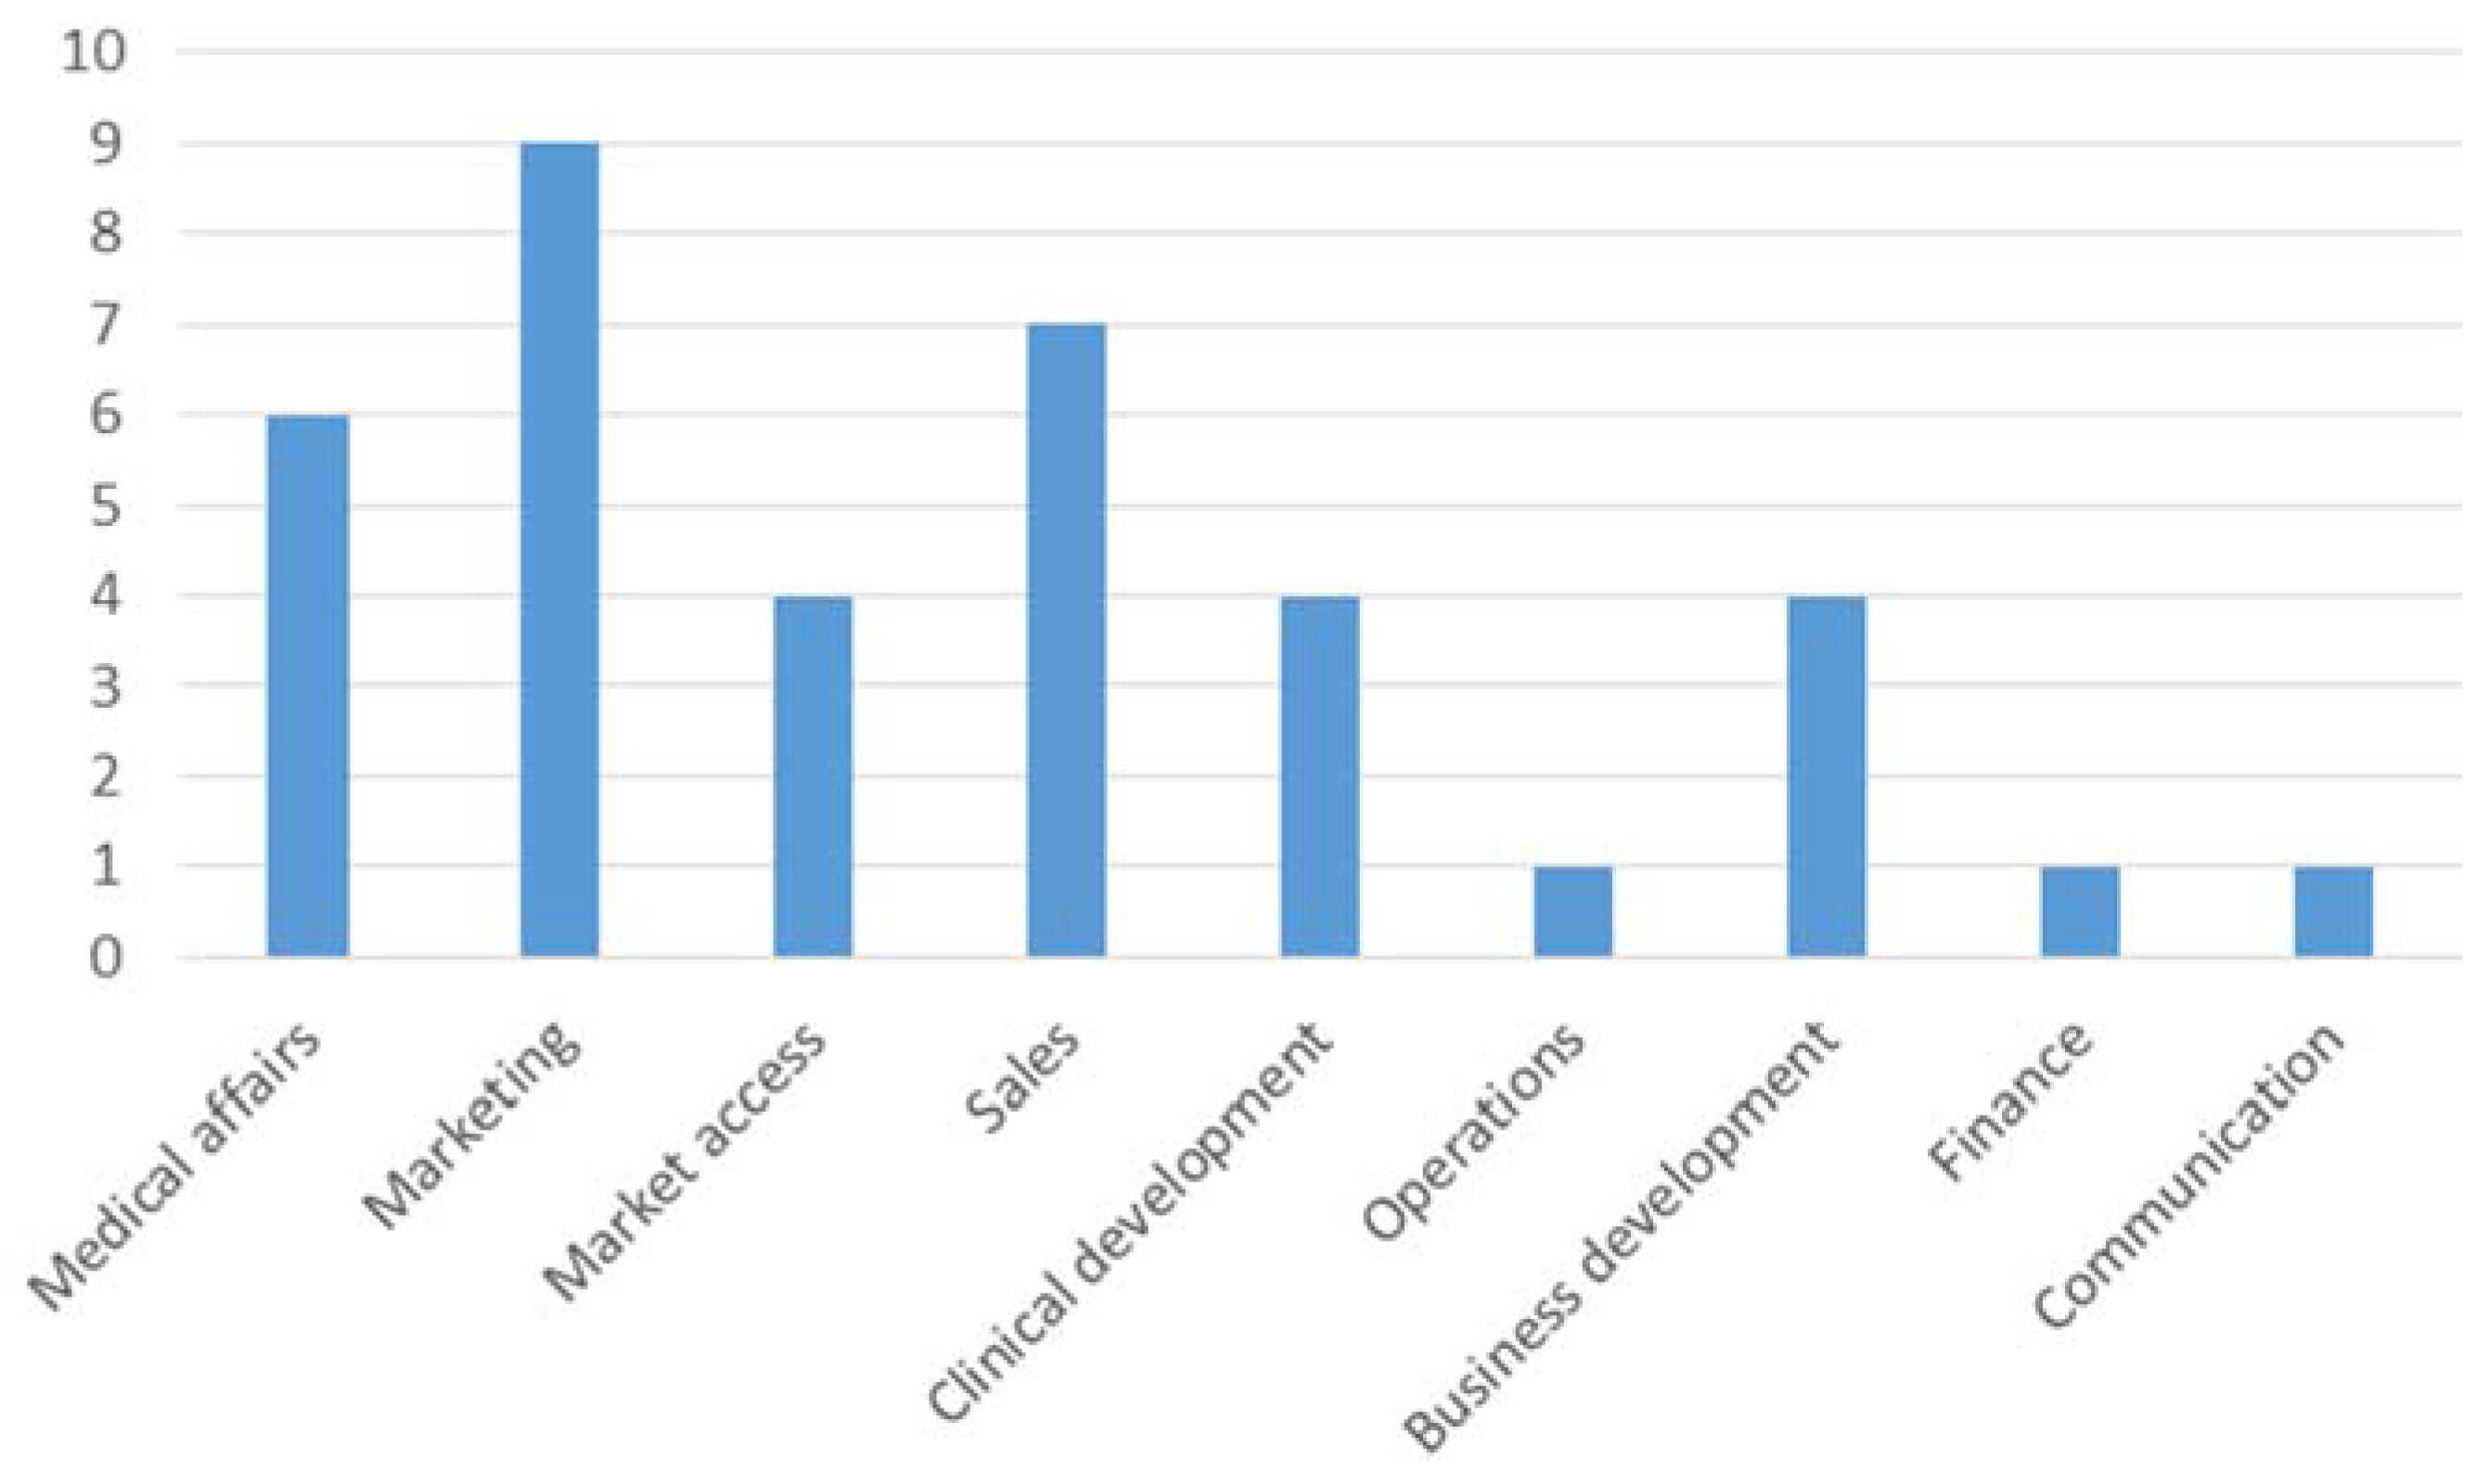
Interestingly, there was no significant difference between vfa members and non-members in our survey. This may be explained by several reasons including the fact that some companies agreed to fulfil the requirements even though they are not members of the vfa. On average, participants tended to be neutral when asked about differences between clinicians and practitioners with regards to the transparency code. Participants who agreed that the transparency code will change their cooperation with HCP/HCO also agreed that internal process changes within the company are vital (mean = 2.30). Asked which departments are currently involved in implementing the code, it comes as no surprise that the compliance department was mentioned most frequently, see
Figure 4.
In general, it can be observed that more administrative departments than market oriented ones are involved. This may change when the market intelligence potential has been grasped. Only three participants replied that their company considers potential benefits of the collected data relating to transparency (mentioned twice) and image improvement for an industry that carries the stigma of corruption (also mentioned twice).
One participant suggested that companies will aim to better communicate potential benefits arising from the code to their employees in order to increase the internal backing that is required in order to implement process changes.
Most participants agreed that they consider the data from competitors as interesting (mean = 1.91). However, some participants did point out that this would strongly depend on the quality of the data, which will only become apparent when the data are published for the first time in the middle of 2016.
Marketing and sales departments rated the benefit highest, closely followed by the medical affairs department, see
Figure 5.
Since most participants stated that the quality of the data will naturally influence its value, no consistent response was given in terms of how much companies would be willing to spend on the analysed data for competitive analysis.
Although the participants noted that the outcome of the data quality is uncertain, they highly agreed that the data would be useful for analysis of customer networks and for hiring consultants (means of 1.64 and 1.82).
There was consensus that tax authorities would likely show considerable interest in the generated data, since payments made to physicians are a considerable potential source of tax income for the government.
An equal number of participants agreed that they will continue to work with physicians opting out of the transparency code, while the same number responded that they will not continue to do so.
A factor analysis reducing 32 Likert scale questions in form of a factor analysis resulted in two factors.
Table 1 lists the factors with high (> 0.7) factor loadings only. The first dimension can be described as the marketing dimension. The second dimension is the effect dimension. It focuses on the internal and external effects between company and HCPs and between clinicians and practitioners, see
Table 1.
In contrast to the stipulated involvement of current departments the factor analysis extracted the marketing component as the major factor in the competitive potential of the transparency code.
There may be a need to hire consulting companies to crunch the numbers and come up with competitive intelligence information. A regression analysis with the dependent variable of hiring an external consulting company for gaining competitive information though the transparency code was also conducted. The regression model (stepwise) resulted in an acceptable fit (R square > 0.6) with one predictor: the statement that the data are useful for KOL analysis. The standardised coefficient was 0.63 which, by definition, is the same as the correlation coefficient and being significant at 0.95 level. One can imagine that the identification of KOLs from the competition is a gift in disguise for any company. Even more so since the return on sales visit per doctor has been declining steadily over the years [
25].
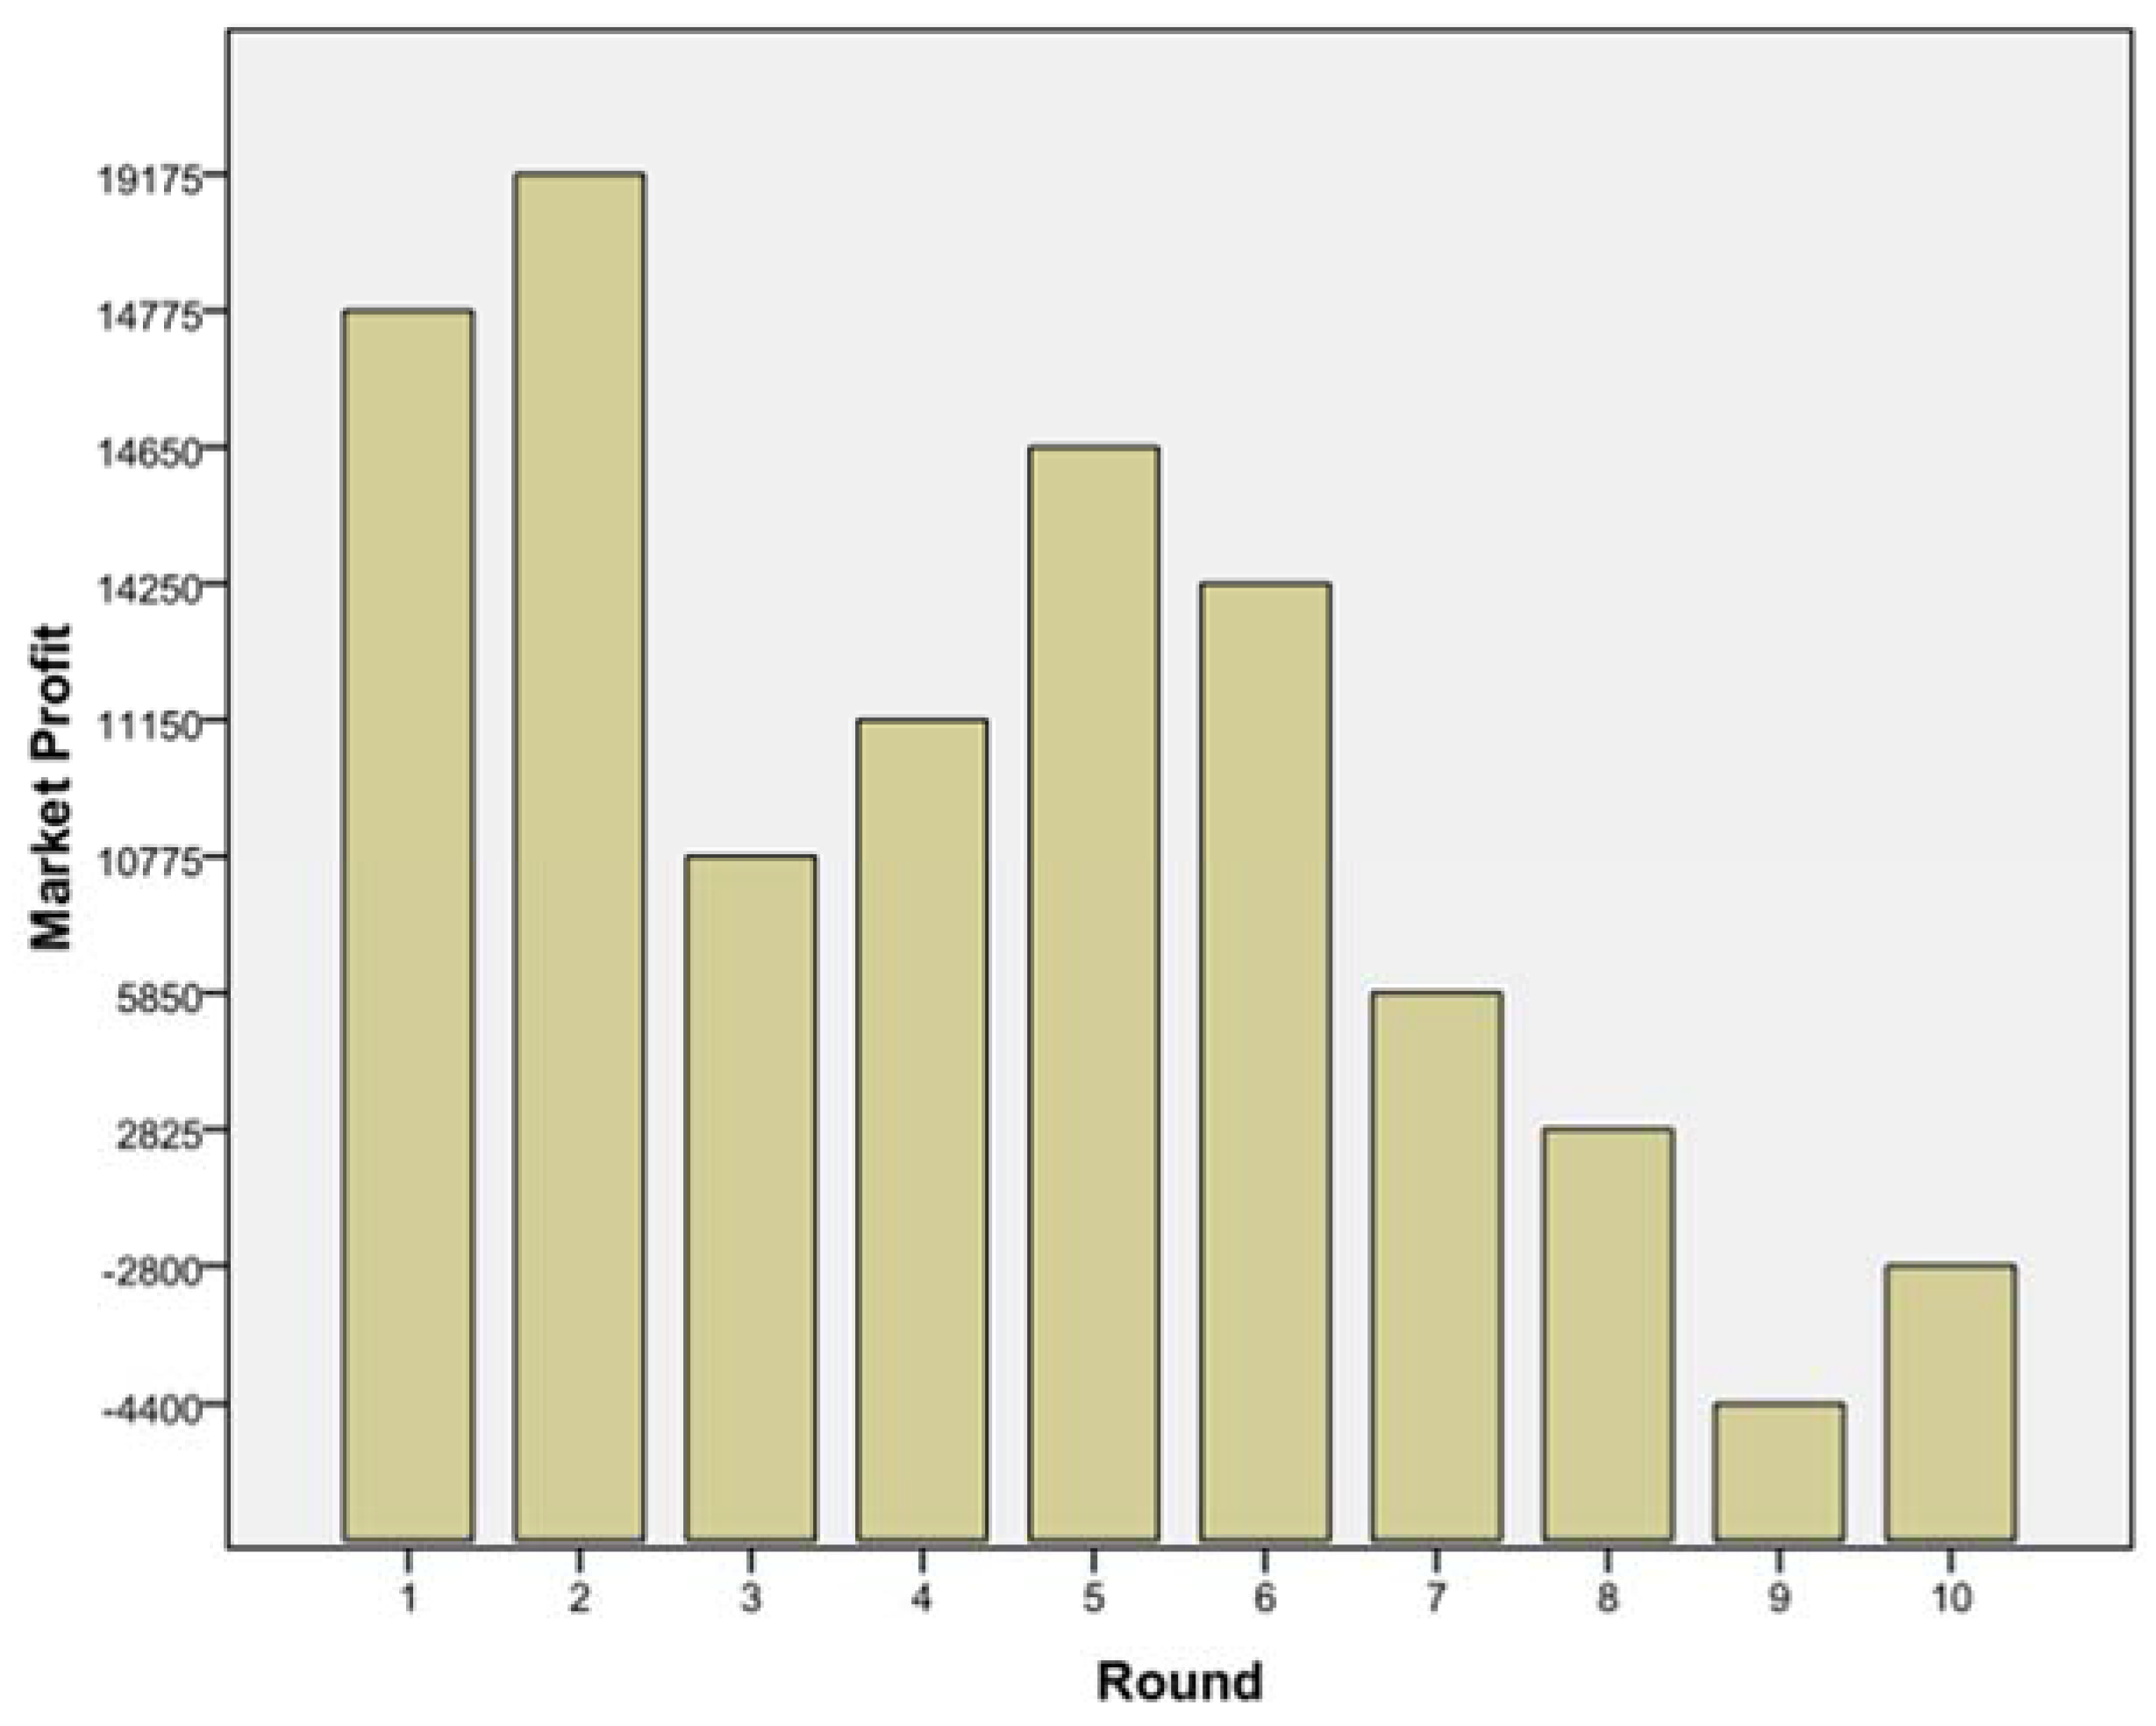
The subsequent game helped to understand how far companies might go to attract KOLs from competitors. After five games were finished, the authors analysed the results and found similar patterns in all games. Looking at
Figure 6, one may name several phases of the game:
- (1)
Everyone is happy: round 1 and 2;
- (2)
Someone rocks the boat: round 3;
- (3)
Unstable equilibrium found: round 4, 5, 6;
- (4)
The decline: round 7 onwards.
For example, in one game, in round 3, player B increased investment from 25% (points) to 80%. When asked why he did this, he said: “Sometimes one has to take risks, and it paid off.” Also interesting was the behaviour of player D, a sales person. Knowing that the whole market will face a loss if everyone goes for 50% or above, she stayed more or less all the time above it. Her scenario may have encouraged her to take risk because she had the highest carried forward profit initially. She also made good profit in the initial rounds, making her more confident in taking higher risks compared to her competitors. She defended her strategy as follows: “Once one starts with the hard hitting strategy, one needs to have the guts to stick with it.” When asked about his strategy, player C stated that he knew that if every player allocated 25 points consistently, this would maximise profits for all four companies. However, because two competitors invested much higher amounts, this strategy was not working out and he started to raise his investments as well. Richter and Schmidt [
26] reported similar experiences in their strategic analysis of the pharmaceutical industry; best possible reaction is a fast response
i.e., no time lag between strategy (in our case: KOL acquisition) and implementation.
When looking at all five games there were following patterns: The companies with the highest initially carried forward profits started with higher than average spending on KOL engagement, and with subsequent wins these companies kept up the high spending. This suggests that bigger companies are willing to take on more risks, viewing the additional information on their competitors’ spending as leverage to gaining competitive advantage. The game outcome suggests that this will go far beyond economic reasoning. In none of the games did the players reach a stage where all of them profited equally in the sense of equilibrium. In contrast, players did not trust one another and thus kept increasing their spending aiming to optimise their own profit. In all games, players got more aggressive and competitive regardless of the position in the company and previous professional background.
The game suggests that spending for KOL engagement may actually increase after implementation of the transparency code. It can be argued that there is a limit to how much HCPs would be able to accept for cooperation, especially taking into account that amounts will be made transparent. However, as previously mentioned, HCP in Germany can to opt out of individual transparency. A possible scenario would be that if honoraria increase due to competitive payments between companies, more HCPs will opt out to take advantage of the higher additional income. Differences between clinicians and practitioners may surface, as previously discussed. Also, one may suggest that non-vfa members would increase their spending patterns to use the additional information as a competitive advantage without having to disclose the same information themselves. It remains to be seen how the dynamics of these complex interactions develop after implementation of the transparency code. The results of the games support an increased marketing investment in KOLs.
4. Conclusions
In our analysis, we examined how experts in the German pharmaceutical industry judge and plan to capitalise on the new transparency code. Whereas right now there are mainly administrative departments involved, these results identify the marketing potential through competitive analysis as beneficial. Specifically, the identification of key opinion leaders is ranked highly. The market can be regarded as a zero sum game. By allowing public identification of such key HCPs and HCOs, the amount spent on them might increase and not decrease. In a way, the transparency code may foster more channelled marketing spending. Under the assumption that marketing budgets are predetermined, the only option is to spend more on KOLs and less on average doctors. Although a bit farfetched, one may take the analogy of soccer where clubs pay high sums to keep or get the Ronaldos and Messies. In light of such, the transparency code may change the apparently corrupt pharmaceutical landscape into a place that is even more money driven. Frey
et al. [
27] found in a quasi-experimental design with sports athletes that employees care about their relative income. If translated into the pharmaceutical industry, it could mean that doctors will look at their peers’ benefits and eventually push for more in order to be at the top of the league. The other extreme would be that doctors fear the tax implications and decline payments or cite data protection reasons for opting out altogether. In essence, there may be two groups: one that can be described as promotion focussed (ranking high on the pharmaceutical payroll)
vs. the prevention focussed (complying with tax) one. Those with a promotion focus may adopt a more concrete way of thinking about the monetary benefits in the distant future, whereas those with a prevention focus may foresee the tax implications in the near future [
8].


