Article

Distribution, Sources, and Risk Assessment of Polycyclic Aromatic Hydrocarbons in the Estuary of Hongze Lake, China

1
College of Biology and the Environment, Nanjing Forestry University, Nanjing 210037, China
2
Co-Innovation Center for the Sustainable Forestry in Southern China, Nanjing Forestry University, Nanjing 210037, China
3
National Positioning Observation Station of Hung-tse Lake Wetland Ecosystem in Jiangsu Province, Hongze 223100, China
*
Author to whom correspondence should be addressed.
Environments 2019, 6(8), 92; https://doi.org/10.3390/environments6080092
Submission received: 9 June 2019 / Revised: 1 August 2019 / Accepted: 2 August 2019 / Published: 6 August 2019

Abstract

:
Hongze Lake is the first natural sink for transferring drinking water along the east route of the South-to-North Water Diversion Project in China. Thus, the assessment of health risk associated with sediment and soil in Hongze Lake is of vital importance in terms of protecting public health. This study surveyed the distribution of sixteen polycyclic aromatic hydrocarbons in different types of bank soils and sediments at the estuary area of Hongze Lake. The total concentrations of PAHs range between 562.4 and 1585.8 ng/g, and 3- and 4-ring PAHs are the majority in all samples, accounting for 78.2% to 92.3% of the total PAHs. Source analysis was conducted, and the results showed that PAHs in the estuary area mainly come from the burning of fossil fuels, leakage of oil products, low temperature combustion, biomass fuel, and transportation. The risk assessment of the study area showed that the K values of all the points were between 0.1~3, indicating that there was a low ecological risk. This study indicates that further policies for controlling pollution sources of PAHs are needed for reducing health risks associated with fresh water in Hongze Lake.

1. Introduction

Polycyclic aromatic hydrocarbons (PAHs) are a group of organic pollutants that consist of two or more benzene rings in a straight chain, angular or strung form. Because PAHs are structurally stable, difficult to degrade, and some PAH have the characteristics of persistent organic pollutants (POPs) such as carcinogenic, bioaccumulative, and long-range migration effects, the US Environmental Protection Agency has selected 16 PAHs as their priority monitoring indicators [1,2]. PAHs exists widely in the air, water, soil, and sediment. Sources of PAHs in the present environment mainly include chemical industry pollution, transportation pollution, domestic pollution, and other sources of pollution [3]. PAHs continue to migrate, transform, and degrade. They can accumulate in an organism through the respiratory tract and skin and greatly endanger human health [4]. Through a series of complex physical and chemical processes, PAHs could cause acute or chronic toxic effects on the regional benthic organisms and coastal wetland ecosystems. Meanwhile, the pollutants which are adsorbed in the sediment as the potential pollution source to downstream could lead to secondary pollution through the continuous adsorption and analysis process [5]. Research on PAHs is mainly focused on 16 kinds of priority control pollutants. The physicochemical properties are shown in Appendix A.
The South-to-North Water Diversion Project started in 2013 in order to solve the problem of water shortages in North China. The project plans to provide drinking water to ~100 million persons living in North China after the project is completed. There are three transfer water routes (east, middle, west) from the Yangze River to northern regions. The Eastern Route Project draws water from the mainstream of the Yangtze River near Yangzhou, Jiangsu Province, and uses the Beijing-Hangzhou Grand Canal and its parallel river to connect Hongze Lake, Luoma Lake, Nansi Lake, and Dongping Lake, which act as impounded lakes. After the station gradually lifted water into Dongping Lake, it provided production and domestic water to the eastern part of the Huang-Huai-Hai Plain and the Jiaodong area and the Beijing-Tianjin-Hebei region. This route involves the Yangtze River, the Yellow River, the Huai River, the Haihe River Basin, and four major lakes. Hongze Lake is the first natural sink for transferring drinking water along the east route of the South-to-North Water Diversion Project. Serving as the fourth largest freshwater lake in China, it is located at the intersection point between the east route of the South-to-North Water Diversion Project and the Huai River. Sediment and soil are the sink of pollutants. Therefore, soil and water sediment become potential sources of PAH pollution in the water environment, affecting water quality, biology, and the regional ecological environment [6,7]. In watersheds involved in the South-to-North Water Diversion Project, there are already studies on PAH pollution in various rivers and three other lakes, and there is a lack of research on Hongze Lake [8,9,10,11,12,13,14,15]. In this study, the estuary area of Hongze Lake was studied. The objective was to understand the distribution and sources of PAHs in this estuary area. This study also evaluated the ecological risk of PAHs in the area to provide a theoretical basis for future environmental protection in this area and the supervision of the East Route Project of the South-to-North Water Transfer Project.

2. Material and Methods

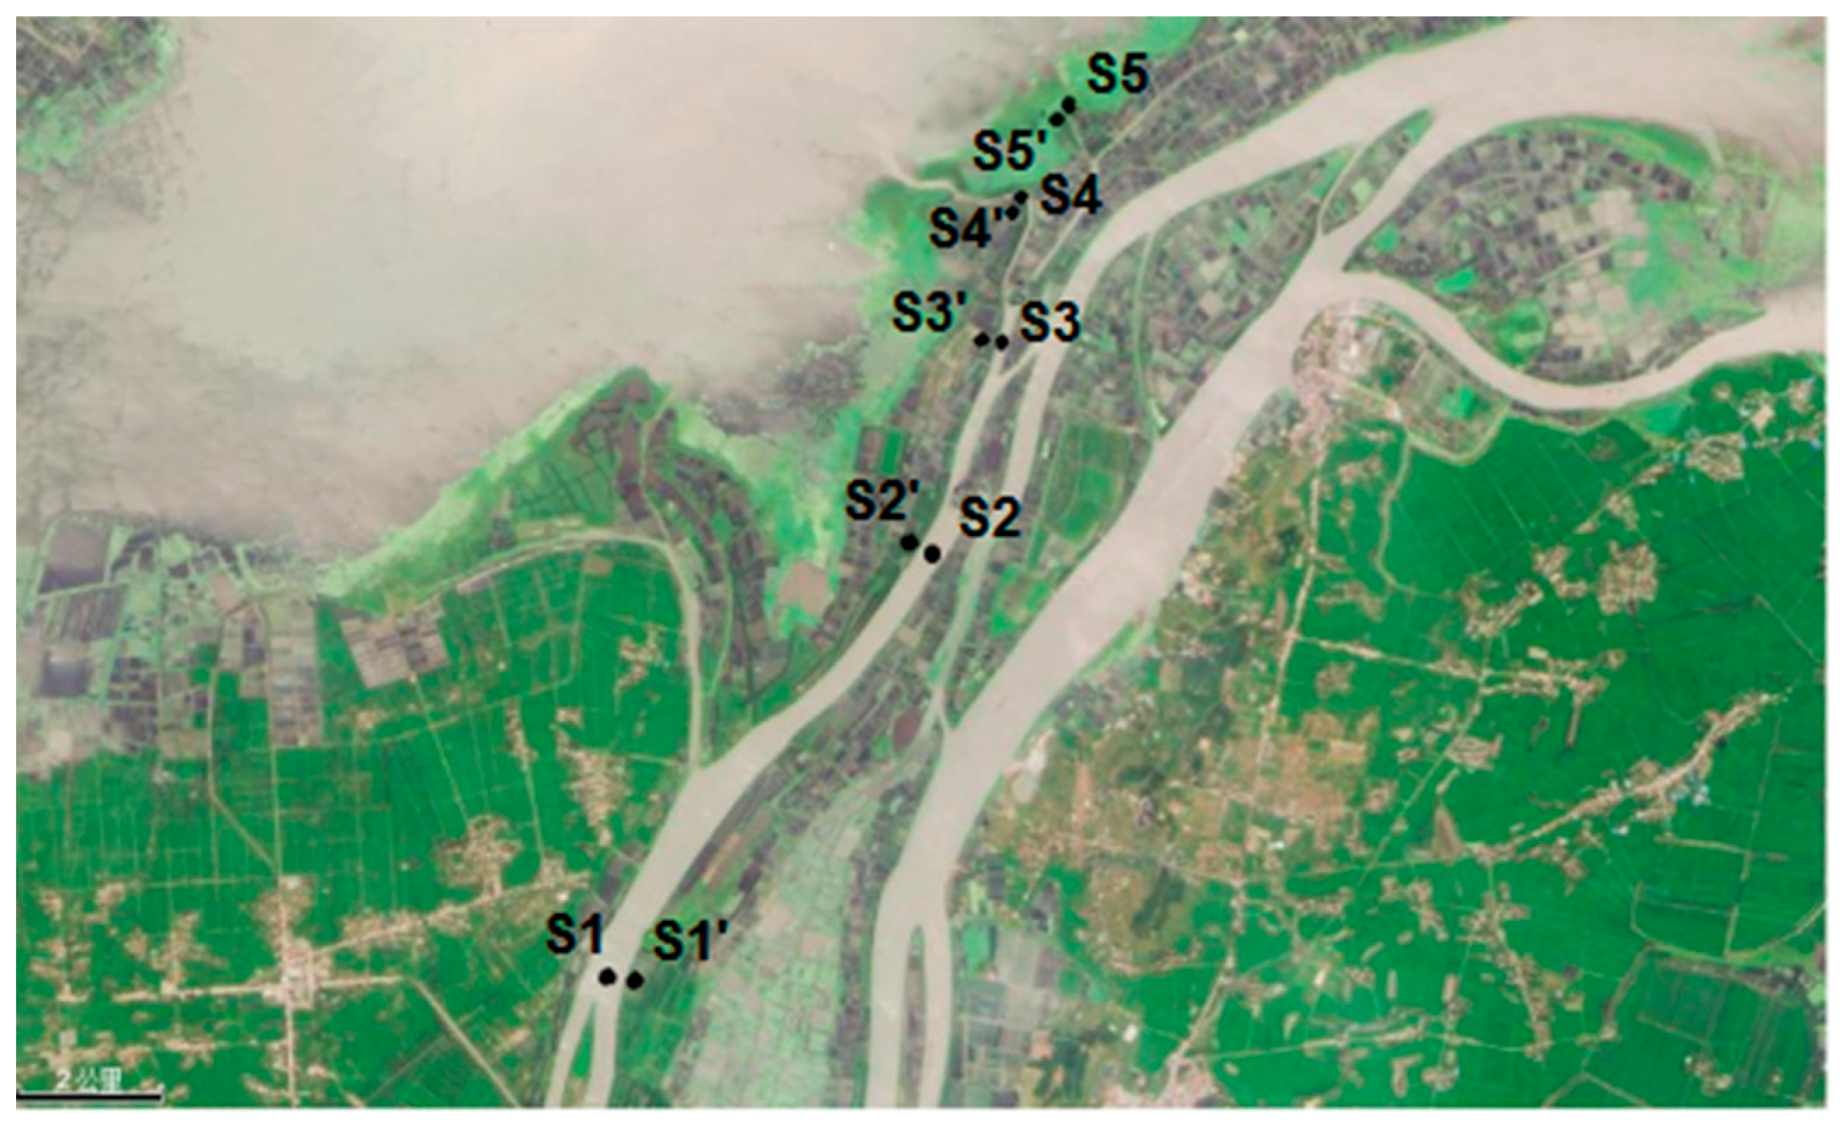
2.1. Study Area and Sampling

The land use patterns of the Hongze Lake estuary area have changed in the past decades. Culture ponds and farmland area showed an increasing trend while open water area and the community of arbor and shrub plants showed a decreasing trend. Ten sampling points were set up in this study to include a variety of different land use patterns. As shown in Figure 1, there were five soil points with different utilization patterns, including S1’ (Culture Pond), S2’ (Farmland), S3’ (Reed Field), S4’ (Poplar Forest), and S5’ (Withy Grove). Five sediment samples were set up for the corresponding river courses with serial numbers of S1, S2, S3, S4, and S5 respectively. Ten samples were collected for each sample point, and the distance between each sample was about 20 m.
The samples were collected in April and August 2016. All samples were collected using a columnar sediment sampler (model AMS Layered Sludge and Sediment Sampling Kit) with a depth of 0–20 cm. The sediment and soil samples were freeze-dried using a freeze dryer and impurities were removed. Then, samples were grinded using agate mortar and passed through a 100-mesh sieve and stored in ziplocked bag at −20 °C until analysis for PAHs.

2.2. PAHs Extraction and Analyses

Five (5.00) g of freeze-dried, homogenized sample was weighted and ultrasonically extracted three times using a mixture of acetone/methylene (1:1, v/v). The extraction liquid was centrifuged with 5 mL acetone/dichloromethane (1:1, v/v). The extracts were concentrated to 1 mL using a rotary evaporator at 40 °C and solvent-exchanged with 4 mL of n-hexane. The concentrated extract was passed through a silica gel glass column with 2 cm anhydrous sodium sulfate on the top for cleanup and fractionation. Elution was performed with 25 mL hexane and 25 mL hexane/dichloromethane (3:2, v/v). The eluting solutions containing PAHs were concentrated to near dryness with a rotary evaporator at 40 °C, transferred with 5 mL methylene chloride, concentrated with purified nitrogen steam to near dryness, constant-volumed with 2 mL acetonitrile, and preserved at −18 °C.
All pretreated samples were analyzed for 16 PAHs using Agilent 1200 high-performance liquid chromatography (HPLC). The qualitative and quantitative analysis of PAHs was determined using a diode-array detector (DAD) connected with a fluorescence detector (FLD). The reversed-phase chromatographic column used was Spelcosil LC-PAHs (3.0 mm × 250 mm, particle size: 5 μm, Supelco, Bellefonte, PA, USA). The column temperature was programmed at 30 °C, the pump flow rate was 0.75 mL/min, and the standard injection was performed with an injection volume of 20 μL. Gradient elution conditions: 0–15 min with 60% acetonitrile and 40% pure water, 15–30 min with 60–100% acetonitrile, 30–40 min with 100% acetonitrile, 40–40.1 min with 60–100% acetonitrile, the time was 48 min. The DAD detector wavelength was set to 254 nm, and the FLD detector excitation and emission wavelength conditions are shown in Appendix B.
Quality control included three parallel samples in precision monitoring for every sample, a blank control in each experiment, and 20% of the samples being randomly selected for repetitive tests. Spiked samples with surrogate standards were used to monitor procedural performance. The experimental results showed that the recoveries of 16 PAHs using HPLC-DAD/FLD are 76–108%. The detection limit of this method is 0.09–3.52 ng/g. Reported concentrations were corrected according to the recoveries of the surrogate standards.

2.3. Data Statistical Analysis

Statistical analyses of the results were performed using Microsoft Excel and SPSS 20.0. Six molecular ratios of LMW/HMW (low molecular weight/high molecular weight), FIa/Pyr, Fla/(Fla + Pyr), Ant/(Ant + Phe), BaP/Pyr, and BaA/(BaA + Chr) were used to identify the possible PAH sources.
The SPSS 20.0 software was used to load and calculate the PAHs in the program editor. The concentrations of 13 PAHs measured in 16 PAHs were selected as the factor analysis variables. The distribution of each source was effectively determined using principal component analysis (PCA) by extracting the eigenvalues for dimensionality reduction.
Effects range low (ERL) values and effects range median (ERM) values which were established by 10% and 50% effective concentrations respectively were applied in this study [16]. In general, PAH concentrations lower than ERL are considered not to be harmful to organisms, while concentrations higher than ERM are considered to be harmful frequently [17]. The ecological risk of PAHs is evaluated whether the content of PAHs exceeds the ERL value by excessive coefficient K [10,11], which is calculated as follows:
K = w(PAHs)/ERL
K is the excessive coefficient. ERL (ng/g) is effects range-low values and w(PAHs) (ng/g) is the measured value of PAHs.

3. Results and Discussion

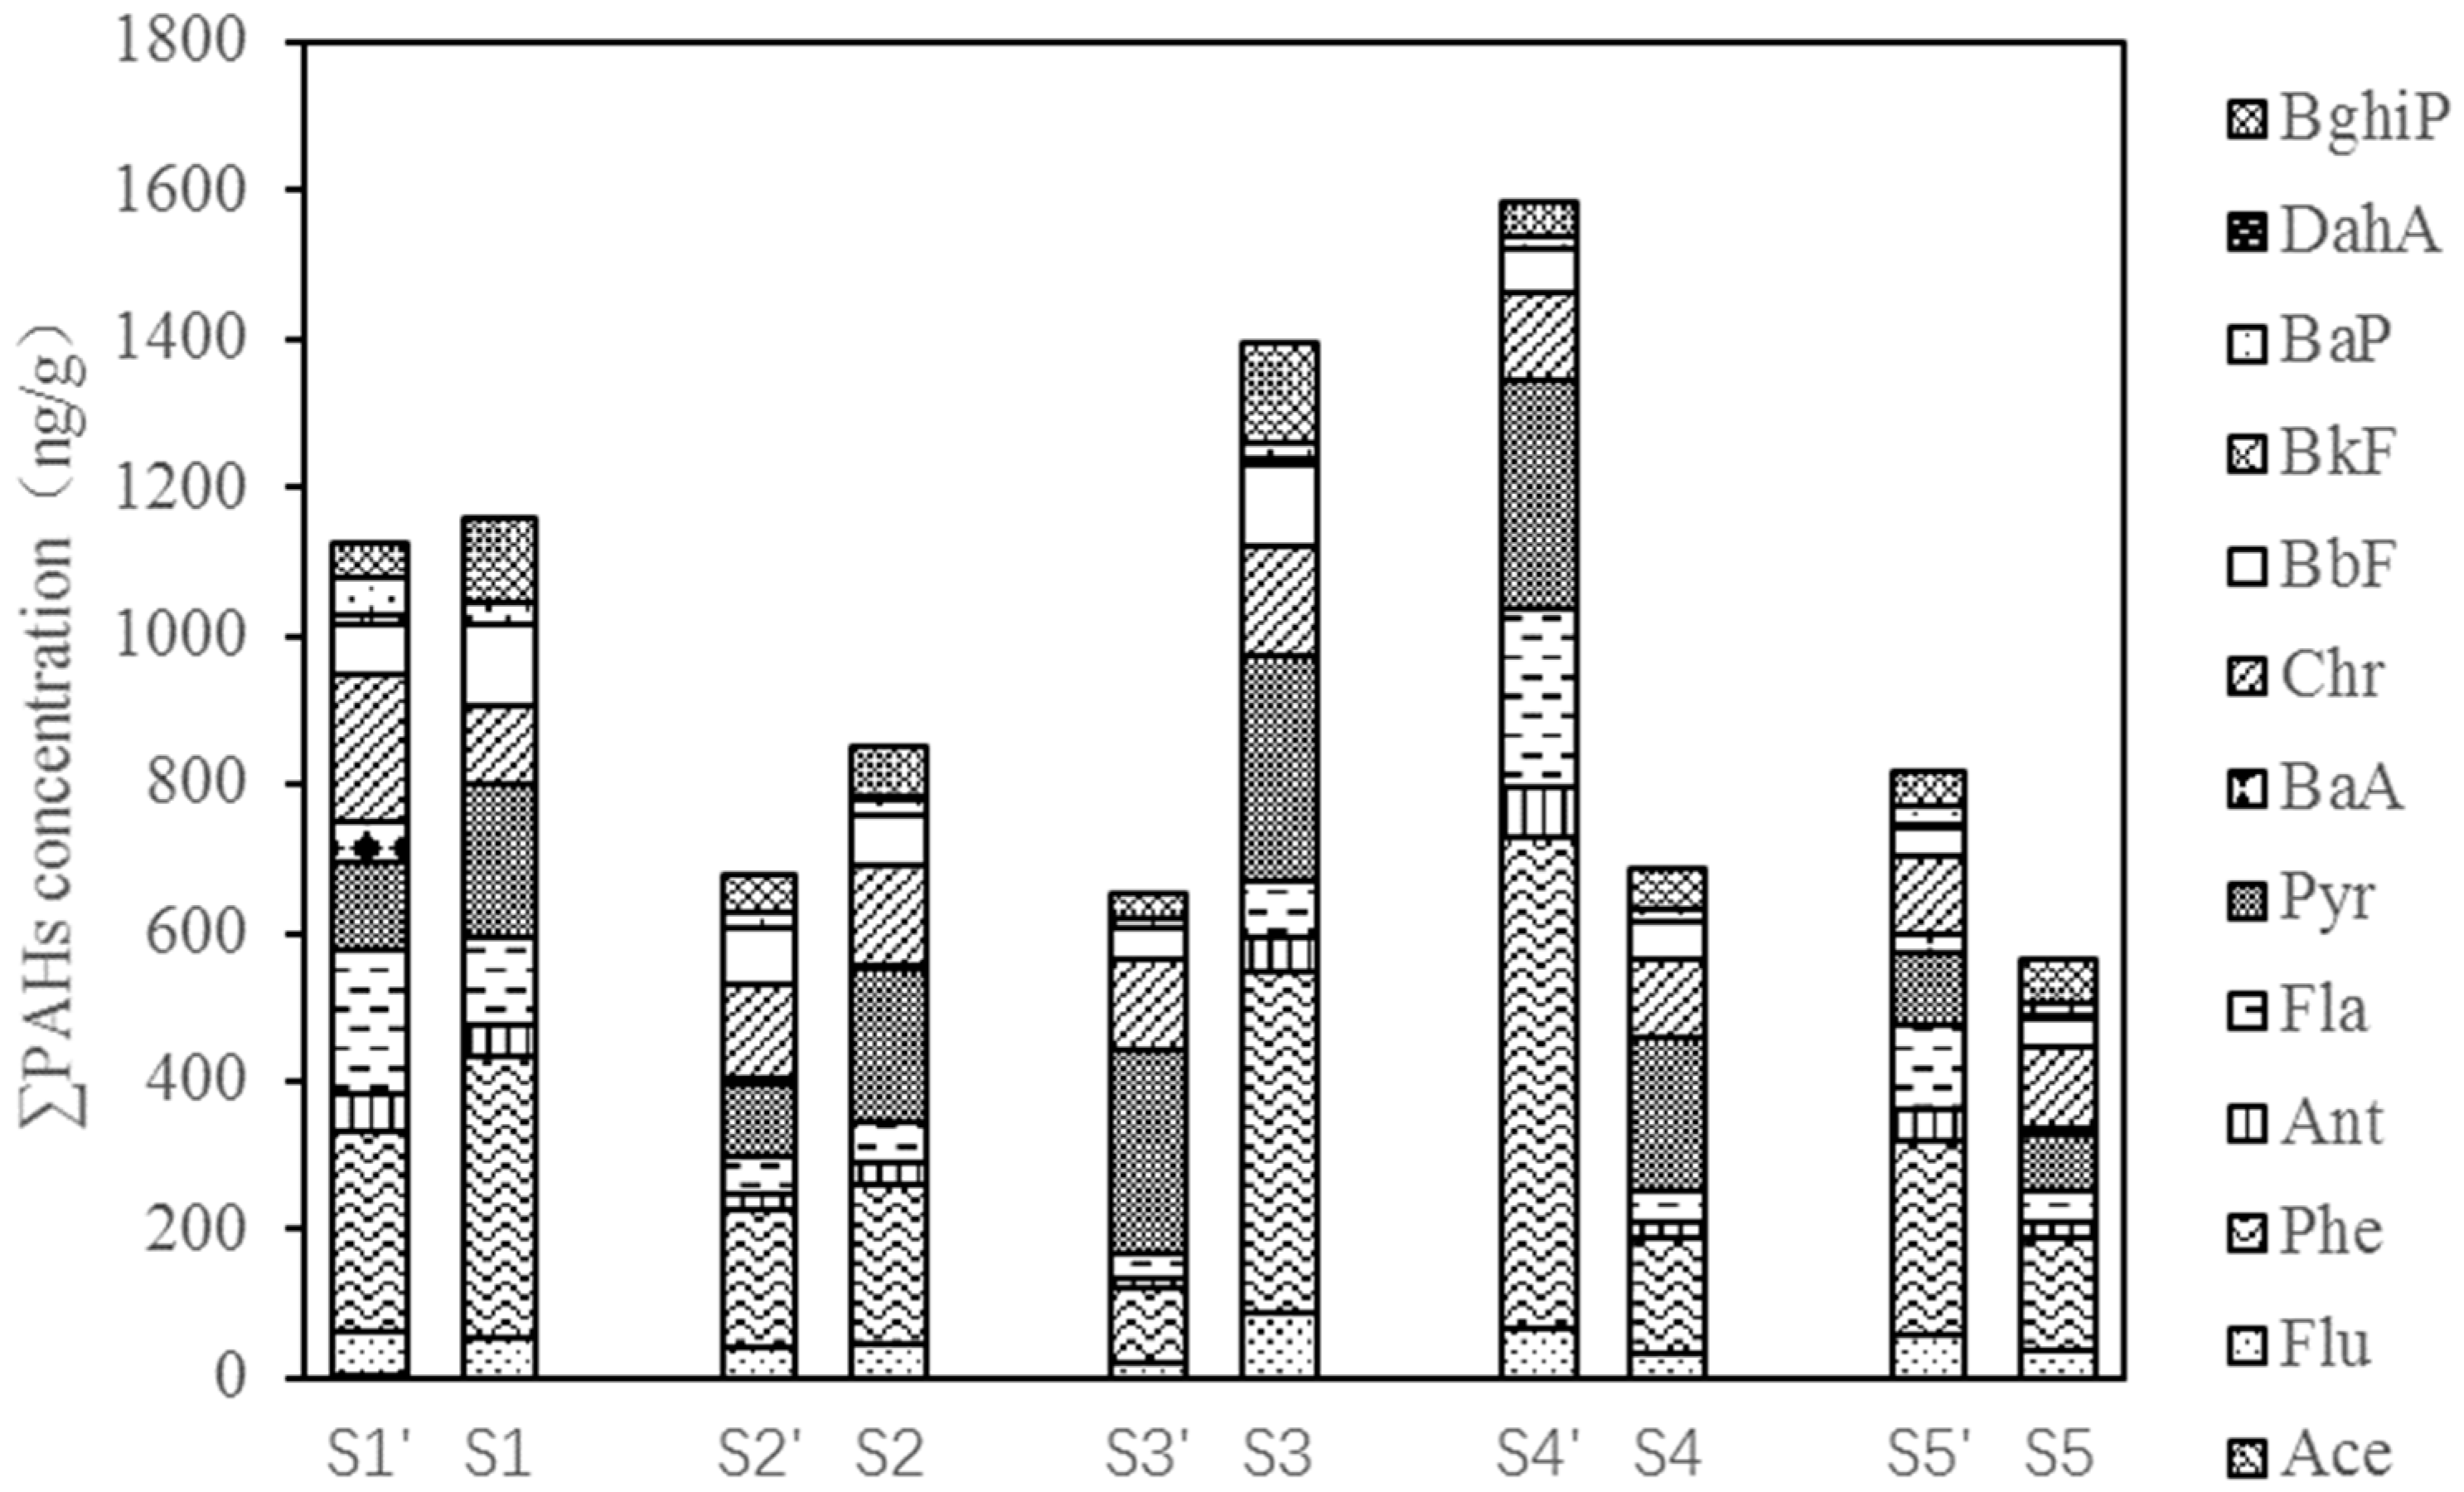
3.1. Presence of PAHs

Concentrations of PAHs in all 10 samples are shown in Appendix B. The ∑PAH in each sample varies between 562.4 and 1585.8 ng/g. Figure 2 shows the distribution of ∑PAH. Phe has the highest concentration while NaP, Acy, and InP are not detected.
In the five soil samples, the total content of PAHs ranges from 651.0 to 1585.8 ng/g with an average value of 970.7 ng/g. The order of contents was Poplar forest (S4’) > Culture Pond (S1’) > Withy Grove (S5’) > Farmland (S2’) > Reed Land (S3’). In the five sediment samples, the total content of PAHs ranges from 562.4 to 1396.0 ng/g (average 930.7 ng / g), with the order of S3 > S1 > S2 > S4 > S5.
Pollution levels of ∑PAHs was previously classified into four groups: unpolluted (0–200 ng/g), low (200–600 ng/g), moderate (600–1000 ng/g), and high (greater than 1000 ng/g) [18]. As shown in Appendix B, in soil spots, Culture Pond(S1’) and Poplar Forest (S4’) were highly polluted. Other sites were moderately polluted. In sediment spots, S1 and S3 were highly polluted, S5 was low polluted, while other spots were moderately polluted.
Polycyclic aromatic hydrocarbons with 2-ring and 3-ring are low-molecular-weight (LMW) PAHs, and PAHs with a ring number of ≥ 4 are high-molecular-weight (HMW) PAHs. In the estuary of Hongze Lake, PAHs are dominated by 3 and 4 rings (Figure 3), accounting for 78.2% to 92.3% of the total PAHs at all points. It was reported that the concentration of PAHs in the mid-lower reaches of the Huai river was low and were dominated by LMW PAHs [2]. The estuary is the destination and accumulator for the migration and transformation of pollutants in the upper reaches of the river [6]. Therefore, the large accumulation of pollutants in the estuary and the transformation occurring during the migration may be the reason for the increase of pollutant concentration and the higher proportion of HMW PAHs.
The PAH pollution of river (water and sediment) and lake (sediment) involved in the east route of the South-to-North Water Transfer Project is shown in Table 1. Due to the stability of PAHs, it is easier to deposit in sediment (Luoma lake). Studies on rivers such as the Yangtze River and the Yellow River have also shown that the pollution level of river sediment is generally higher than water. The data also showed that the concentration of PAHs becomes higher from the upstream to the middle and lower reaches. As the lower reaches of the Huai River Basin, Hongze Lake has a higher degree of PAH pollution. Among the four impounded lakes in the east route of the South-to-North Water Transfer Project, Hongze Lake has the highest degree of PAH pollution. Overall, there is a decreasing trend of PAHs from south to north. This may be related to the level of urban development. This also means that in the water transfer project, the supervision department should pay more attention to whether the pollution in the water source area has an impact on the water supply area. It is also necessary to consider whether water transfer affects the watershed ecology of other areas.

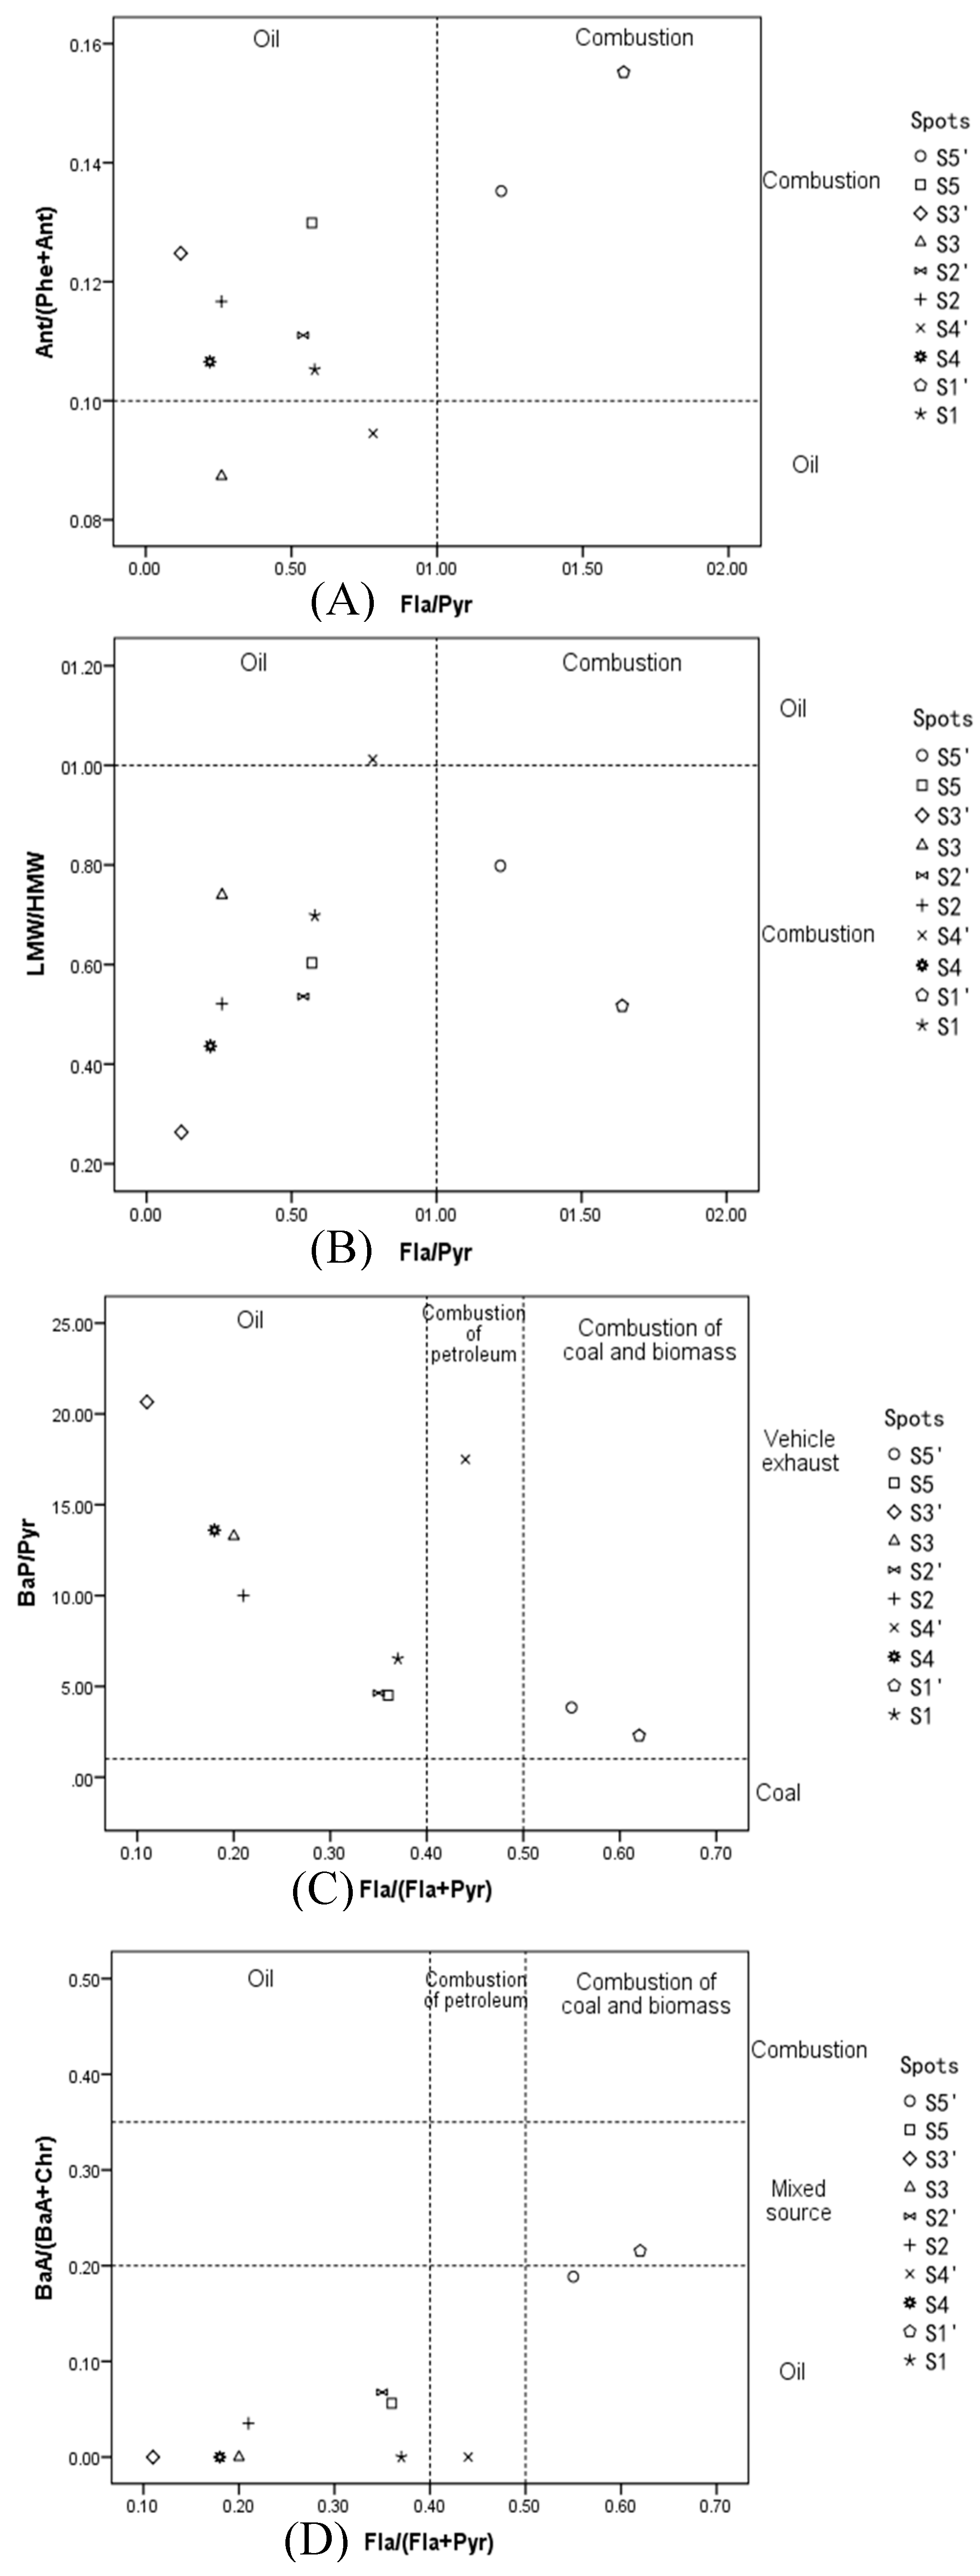
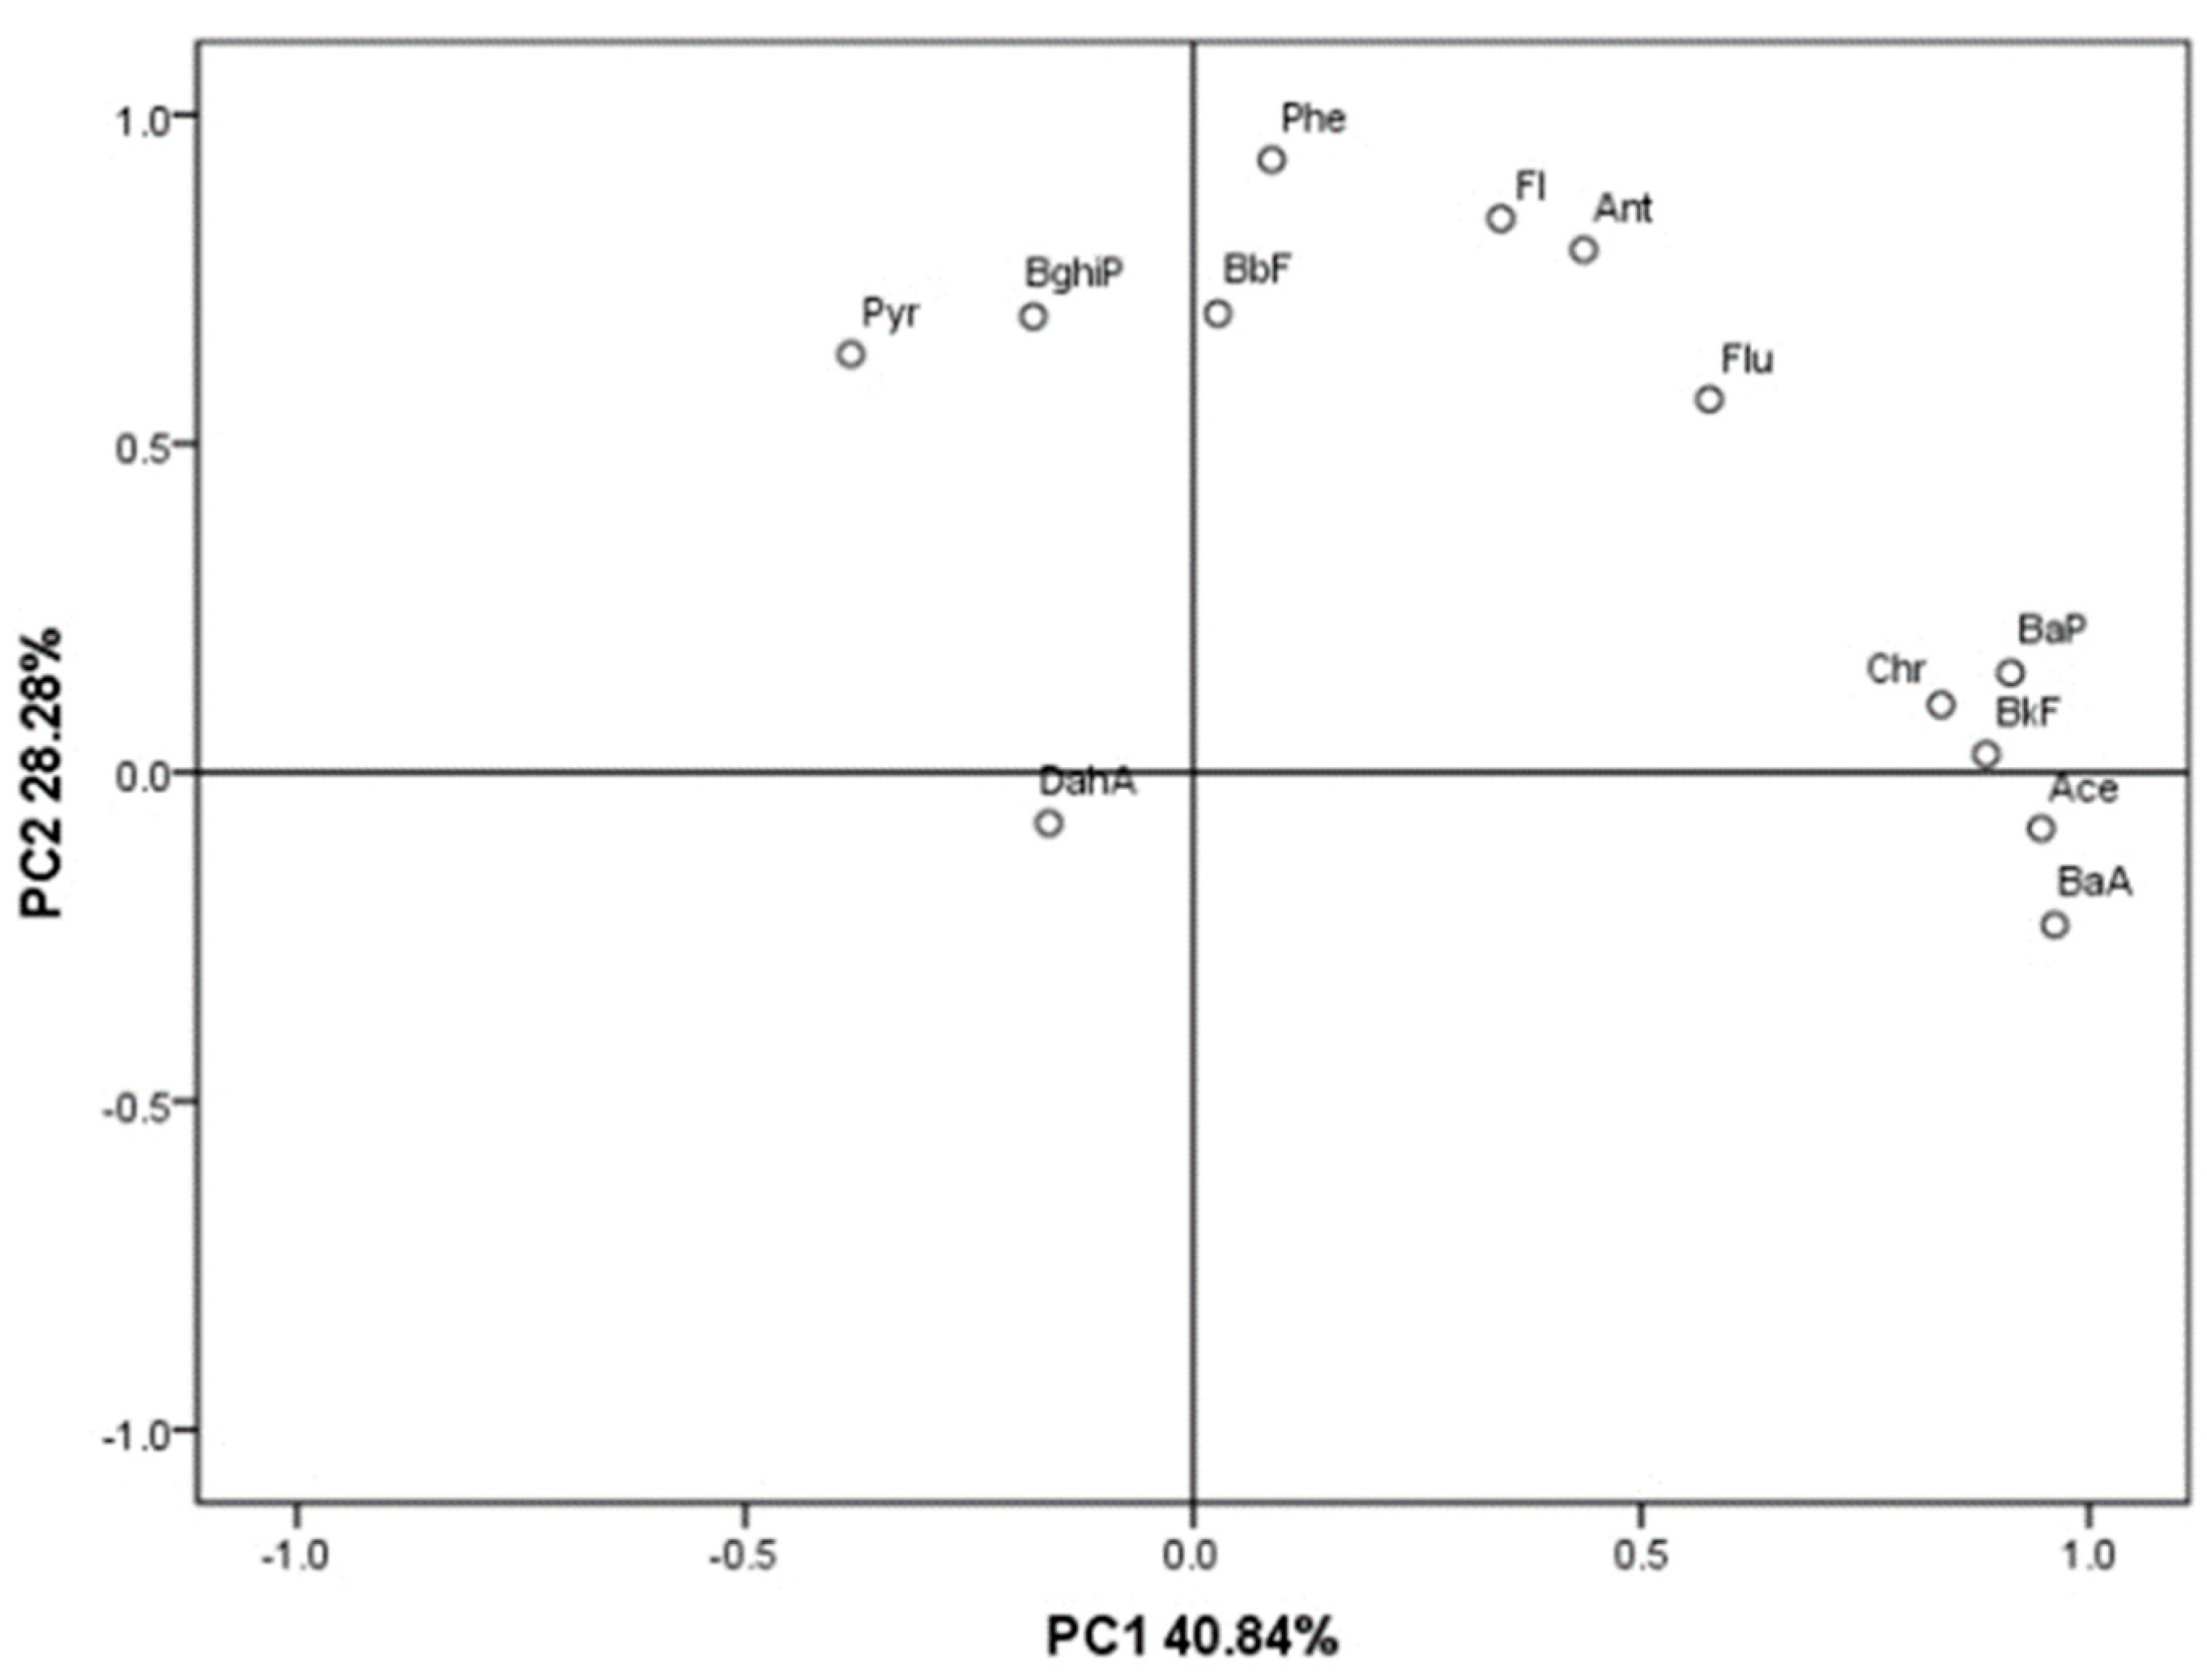
3.2. Sources of PAHs

The distribution of PAHs in the environment is determined by their chemical structures, sources, and combustion temperature. Ratio analysis provides an effective tool to understand sources of PAHs. In general, LMW-PAHs are derived from the incomplete combustion and natural formation of petroleum products, fossil fuels, and biomass at low temperatures, whereas HMW-PAHs are formed mainly through the incomplete combustion of organic materials at high temperatures (Table 2) [19]. The ratio of LMW and HMW could distinguish petrogenic and pyrogenic PAHs. Ant/(Phe + Ant), Fla/(Fla + Pyr), BaA/(BaA + Chr), BaP/Pyr have great range of stability, which could be used as indicators [20]. Ant/(Ant + Phe) < 0.10 is indicative of oil sources, while the ratio of Ant/(Ant + Phe) > 0.10 suggests coal and biomass sources of PAH contamination. Fla/(Fla + Pyr) < 0.4 implies an oil origin, between 0.4 and 0.5 implies oil combustion, and >0.5 as combustion of coal and biomass. BaA/(BaA + Chr) < 0.20 is usually taken to indicate oil origins; the ratio >0.35 is probably attributable to combustion origins [21,22].
The results of the source ratio of PAHs in the 10 samples are shown in Figure 4. All sampling sites showed a combustion source with LMW/HMW < 1 except S4’. Combined with a less than 1 Fla/Pyr ratio, it is believed that petroleum is the major source. Therefore, most sampling sites showed a mixed source of petroleum and combustion. According to the ratio of Ant/(Phe + Ant) and F1a/(F1a + Pyr), most of the sampling points were in the range of Ant/(Phe + Ant) > 0.1 and F1a/(F1a + Pyr) < 0.4. It showed the mixed source of oil and combustion. There was ratio of F1a/(F1a + Pyr) > 0.5 in S5’ and S1’ showing the combustion source of coal and biomass. S2, S2’, and S5’ showed a petroleum source. Combined with the BaP/Pyr ratio, all sampling points were in BaP/Pyr > 1, indicating that they were related to vehicle exhaust. The results of different ratio showed that the sources of PAHs in the estuary of Hongze Lake were similar. The main source was mixed oil and combustion, and all spots were related to a transportation source. Three sites were related to coal and biomass combustion.
The distribution of each source was also effectively determined by using the principal component analysis (PCA). In this study, two factors with eigenvalues >2 were extracted, and two principal components were extracted. The cumulative contribution rate was 69.12%. The principal components (PC1 and PC2) were identified and respectively accounted for 40.84% and 28.28% of the total variance. Characteristic compounds emitted from various sources are shown in Table 3. PC1 had loaded for most PAHs with high-ring (BaA, BaP, BkF, Chr) and highly weighted by Ace which is considered to be derived from combustion of fossil fuel. PC2 had loaded for most PAHs with low-ring (Ant, Phe, Flu) which is considered to be an oil source (showed in Figure 5).
Source analysis was conducted, and the results showed that PAHs in the estuary area mainly come from the burning of fossil fuels, leakage of oil products, low temperature combustion, biomass fuel, and transportation. The main industry of the Hongze Lake is fishery. However, the source of PAHs in the region was oil and combustion. This is because Hongze Lake has brought together pollutants from the upper and middle reaches of the Huai river. The Huai river mainstream and Huainan area are areas of concentrated heavy chemical industry and the usage of crankcase oil in urban areas could produce PAHs [11]. Therefore, the PAHs in the upstream area are likely to migrate through the atmosphere, water, and soil, which will increase the PAHs in the soil and sediment of the estuary area of Hongze Lake and become the main sources.

3.3. Risk Assessment

Effects range low (ERL) and effects range median (ERM) have been used to evaluate the ecological effects of PAHs in sediment [9]. Generally, if the concentration of PAHs in the environment is lower than ERL (4022 ng/g), the toxicity to organisms is considered to be low with a risk probability less than 10%. On the other hand, if the concentration of PAHs is higher than ERM (44,792 ng/g), the potential biological risk is high with a risk probability more than 50%. The risk probability is between 10% and 50% if the concentration of PAHs falls between the ERL and ERM.
Excessive coefficient K has been used to evaluate the risk probability by comparing the concentration of PAHs to ERL (Equation (1)) K [10,11]. K < 0.1 is considered as no potential risk, 0.1 ≤ K < 3 as low potential risk, 3 ≤ K < 7 as moderate potential risk, 7 ≤ K ≤ 10 as high potential risk, and when K > 10 it is considered that there may be ecological risk.
The resulting K values of PAHs in all samples are shown in Table 4. The K values of the sediment samples follow the order S4 > S1 > S5 > S2 > S3, whereas the soil samples follow the order of S3’ > S1’ > S2’ > S4’ > S5’. All samples have K values far less than 10 and should cause no serious ecological risk to the estuary of Hongze Lake. Most samples have a value of K in the range of 0.1–3, indicating a low potential ecological risk. The K values of Flu are the highest among all 16 PAHs in all samples, and the K value of four sampling points is higher than 3, indicating moderate potential risks. The K value for Flu, Phe, Ant, Fla, Pyr, BaA, and BbF indicates that there is a low potential ecological risk. A previous study showed there is no ecological risk in the upper reaches of the Huai River and Ace, Flu, Ant, and BaA may have a potential ecological risk [11]. In the middle reaches of the Huai River, NaP, Ace, Flu, Phe, Ant, Pyr, and BaA have middle level ecosystem risks [12]. The ecological risk in the middle reaches of the Huai River is much higher than the upper reaches, mainly due to the high population in this area and the development of the chemical industry. PAHs which have low potential ecological risk in Hongze Lake are highly correlated with PAHs in the middle reaches of the Huai River. The risk reduction may be due to river flow and the self-purification capacity of the water body.

4. Conclusions

This study has provided data on the distributions and sources of PAHs in soil and surface sediments in the estuary of Hongze Lake. The PAHs in this area are mainly derived from high temperature sources and petroleum sources, and some are derived from motor vehicles, industrial sources, and coal/biomass combustion. The ecological risk assessment shows that the K values of the PAHs at the points of soil and sediment in the estuary of Hongze Lake are between 0.1 and 3, which means a low potential ecological risk. The pollution and ecological risk of PAHs in the area are mainly due to the influence of industrial activities in the middle reaches of the Huai River. Environmental monitoring and the management department need to focus on this problem. Through the analysis of the sources of PAHs, the upstream source needs to be controlled to reduce the accumulation of PAHs in the ecological environment and to reduce the harm to aquatic organisms and human health. The local government could cooperate with the government departments in the upper reaches of the region to carry out basin management. In the east route of the South-to-North Water Diversion Project, it is also necessary to strengthen the supervision of the river basin, ensure water quality, and reduce the impact on aquatic organisms and ecological environment in the water supply area.

Author Contributions

P.L. is responsible for project coordination and fund management. C.L. is responsible for methodology and investigation. Q.R. is responsible for drafting and editing articles. J.H. is responsible for project management and resource management. C.Z. is responsible for investigation and Data Curation.

Funding

This study was supported by PAPD with no grant number.

Acknowledgments

This study was supported by Priority Academic Program Development of Jiangsu Higher Education Institutions (PAPD).

Conflicts of Interest

The authors declare no conflict of interest. To the best of our knowledge, the named authors have no conflict of interest, financial or otherwise.

Appendix A

Table A1. Physical and chemical properties of 16 PAHs.
PAHsMolecular FormulaSolubility (S)Ring NumbersBoiling PointCarcinogenic *
NapC10H831.72218
AcyC12H816.13279
AceC12H103.83275
FluC13H81.93298
PheC14H101.13340
AntC14H100.0453341
PyrC16H100.1324384
FlaC16H100.264384
ChrC18H120.00154448*
BaAC18H120.0114438*
BkFC20H120.00085481*
BbFC20H120.00155481*
BaPC20H120.00385500*
InPC22H120.000196N/A*
DBAC22H140.00065N/A*
BghiPC22H120.000266542*
* This kind of PAH is carcinogenic.

Appendix B

Table A2. The excitation and emission wavelengths of florescence detector (FLD) for quantitative analysis of PAHs.
Time (min)Excitation Wavelength (λem/nm)Emission Wavelength (λem/nm)
2280330
9.2260380
14280450
16.5260380
28290410
35.5290500

Appendix C

Table A3. The contents of 16 kinds of PAHs in the estuary of Hongze Lake (ng/g).
Sampling PointsCulture Pond (S1’)Culture Pond Sediment (S1)Farmland (S2’)Farmland Sediment (S2)Reed Land (S3’)Reed Land Sediment (S3)Poplar Forest (S4’)Poplar Forest Sediment (S4)Withy Grove (S5’)Withy Grove Sediment (S5)
PAHs
NaP0000000000
Acy0000000000
Ace3.0000000000
Flu59.253.240.144.719.687.468.734.960.537.6
Phe271.1378.4185.0218101.7461.8660.1155.1260.9151.4
Ant49.844.523.128.814.544.268.918.540.822.6
Fla193.3118.152.454.032.877.2239.044.2115.242.7
Pyr118.0204.296.8207.0272.7302.6308.0205.494.174.4
BaA a54.808.94.9000025.26.7
Chr a199.6108.6122.5134.5124.1146.8119.7106.2108.5112.5
BbF a68.5106.775.968.139.7111.556.652.334.938.5
BkF a11.500005.8006.53.3
BaP a51.631.320.920.713.222.817.615.124.516.5
DBA a0003.1000000
BghiP44.0113.050.967.033.0135.647.254.744.856.2
InP a0000000000
Total1124115867685165113961586686816562
a Carcinogenic.

References

  1. Elie, M.; Clausen, C.; Yestrebsky, C. Reductive degradation of oxygenated polycyclic aromatic hydrocarbons using an activated magnesium/co-solvent system. Chemosphere 2013, 91, 1273–1280. [Google Scholar] [CrossRef] [PubMed]
  2. Chen, G.; Liu, L.; Zhang, J.; Tan, F.; Zhao, X.; Wang, X.; Zheng, B.; Ma, J.; Liu, Z.; Meng, W. Distribution characteristics and ecological risk assessment of PAHs in the sediments of Huaihe River. J. Environ. Health 2012, 29, 555–560. [Google Scholar]
  3. Cui, H.; Wang, Y.; Wang, X.; Li, C. Research on pollution situation of PAHs remediation. Green Sci. 2012, 6, 134–136. [Google Scholar]
  4. Sany, T.; Rezayi, H.; Rahman, S.; Sasekumar, S. Human health risk of polycyclic aromatic hydrocarbons from consumption of blood cockle and exposure to contaminated sediments and water along the Klang Strait, Malaysia. Mar. Pollut. Bull. 2014, 84, 268–279. [Google Scholar] [CrossRef] [PubMed]
  5. An, L.; Zheng, B.; Zhang, L.; Jia, N.; Qin, Y.; Zhao, X.; Jia, J. Heavy metal pollution and potential ecological risk assessment of sediments in Bohai Bay estuary. Chin. Environ. Sci. 2010, 30, 666–670. [Google Scholar]
  6. Eatherall, A.; Naden, P.S.; Cooper, D.M. Simulating carbon flux to the estuary: The first step. Sci. Environ. 1998, 210, 519–533. [Google Scholar] [CrossRef]
  7. Qiu, H. Migration mechanism of organic pollutants in national water-body sediments. J. Geogr. Geol. 2011, 3, 239. [Google Scholar] [CrossRef]
  8. Xiao, Q.; Liang, B.; Liu, X.; Liu, X.; Wang, J.; Liu, F.; Cui, B. Distribution, sources, and ecological risk assessment of polycyclic aromatic hydrocarbons in surface sediments from the Haihe River, a typical polluted urban river in Northern China. Environ. Sci. Pollut. Res. 2017, 24, 17153–17165. [Google Scholar]
  9. Feng, J.; Hu, P.; Zhang, F.; Wu, Y.; Liu, S.; Sun, J. Ecological risk assessment of polycyclic aromatic hydrocarbons in surface sediments from the middle and lower reaches of the Yellow River, China. Hum. Ecol. Risk Assess. Int. J. 2015, 1, 22–33. [Google Scholar] [CrossRef]
  10. Huang, L.; Zhang, J.; Wu, Y. Distribution and source analysis of polycyclic aromatic hydrocarbons (PAHs) in surface sediments of the Yangtze River Basin. J. Ecotoxicol. 2016, 11, 566–572. [Google Scholar]
  11. Feng, J.; Zhai, M.; Sun, J.; Liu, Q. Distribution and sources of polycyclic aromatic hydrocarbons (PAHs) in sediment from the upper reach of Huaihe River, East China. Environ. Sci. Pollut. Res. 2012, 19, 1097–1106. [Google Scholar] [CrossRef] [PubMed]
  12. Liu, Z.; Huang, W. Polycyclic aromatic hydrocarbons in the water-SPM-sediment system from the middle reaches of Huai River, China: Distribution, partitioning, origin tracing and ecological risk assessment. Environ. Pollut. 2017, 230, 61–71. [Google Scholar]
  13. Liu, H.; Liu, D.; Chen, S. The Source and Ecological Risk of PAHs in Surface Sediments of Dongping Lake. Environ. Eng. 2014, 32, 126–129. [Google Scholar]
  14. Shi, S.; Yang, Y.; Shi, L. The Distributions and Sources of Polycyclic Aromatic Hydrocarbons in Surface Sediments of the Nansi Lake. J. Qingdao Univ. 2005, 20, 95–99. [Google Scholar]
  15. Zheng, X.; Yao, J.; Jiang, H.; Hao, B. Distribution and Risk Assessment of Polycyclic Aromatic Hydrocarbons in Surface Sediments from Luoma Lake. J. Anhui Agric. 2010, 38, 10858–10861. [Google Scholar]
  16. He, X.R.; Pang, Y.; Song, X.J.; Chen, B.L.; Feng, Z.H.; Ma, Y.Q. Distribution, sources and ecological risk assessment of PAHs in surface sediments from Guan River estuary, China. Mar. Pollut. Bull. 2014, 80, 52–58. [Google Scholar] [CrossRef] [PubMed]
  17. Long, E.; Macdonald, R.; Smith, D.; Calder, D. Incidence of adverse biological effects within ranges of chemical concentrations in marine and estuarine sediments. Environ. Manag. 1995, 19, 81–97. [Google Scholar] [CrossRef]
  18. Maliszewska-Kordybach, B. Polycyclic aromatic hydrocarbons in agricultural soils in Poland: Preliminary proposals for criteria to evaluate the level of soil contamination. Appl. Geochem. 1996, 11, 121–127. [Google Scholar] [CrossRef]
  19. Mei, W.; Ruan, H.; Wu, H.; Le, H.; Jiang, M. Distribution and risk assessment of polycyclic aromatic hydrocarbons in Dishui lake sediments. Chin. Environ. Sci. 2013, 33, 2069–2074. [Google Scholar]
  20. Yunker, M.B.; Macdonald, R.W.; Goyette, D.; Paton, D.; Fowler, B.R.; Sullivan, D.; Boyd, J. Natural and anthropogenic inputs of hydrocarbons to the Strait of Georgia. Sci. Total Environ. 1999, 225, 181–209. [Google Scholar] [CrossRef]
  21. Yunker, M.B.; Macdonald, R.W.; Vingarzan, R.; Mitchell, R.H.; Goyette, D.; Sylvestre, S. PAHs in the Fraser River basin: A critical appraisal of PAH ratios as indicators of PAH source and composition. Org. Geochem. 2002, 33, 489–515. [Google Scholar] [CrossRef]
  22. Soclo, H.H.; Garrigues, P.; Ewald, M. Origin of Polycyclic Aromatic Hydrocarbons (PAHs) in Coastal Marine Sediments: Case Studies in Cotonou (Benin) and Aquitaine (France) Areas. Mar. Pollut. Bull. 2000, 40, 387–396. [Google Scholar] [CrossRef]
  23. Khalili, N.R.; Scheff, P.A.; Holsen, T.M. PAH source fingerprints for coke ovens, diesel and, gasoline engines, highway tunnels, and wood combustion emissions. Atmos. Environ. 1995, 29, 533–542. [Google Scholar] [CrossRef]
  24. Lim, L.H.; Harrison, R.M.; Harrad, S. The contribution of traffic to atmospheric concentrations of polycyclic aromatic hydrocarbons (Statistical Data Included). Environ. Sci. Technol. 1999, 33, 3538–3542. [Google Scholar] [CrossRef]
  25. Nielsen, T.; Jørgensen, H.; Larsen, J.; Poulsen, M. City air pollution of polycyclic aromatic hydrocarbons and other mutagens: Occurrence, sources and health effects. Sci. Total Environ. 1996, 189, 41–49. [Google Scholar] [CrossRef]
  26. Zhang, W.; Zhang, S.; Wan, C.; Yue, D.; Ye, Y.; Wang, X. Surface runoff of urban road and source analysis of PAHs in related media in Beijing. Environ. Sci. 2008, 29, 478–1483. [Google Scholar]
  27. Lee, J.H.; Gigliotti, C.L.; Offenberg, J.H.; Eisenreich, S.J.; Turpin, B.J. Sources of polycyclic aromatic hydrocarbons to the Hudson River Airshed. Atmos. Environ. 2004, 38, 5971–5981. [Google Scholar] [CrossRef]
  28. Tian, F.; Chen, J.; Qiao, X.; Wang, Z.; Yang, P.; Wang, D.; Ge, L. Sources and seasonal variation of atmospheric polycyclic aromatic hydrocarbons in Dalian, China: Factor analysis with non-negative constraints combined with local source fingerprints. Atmos. Environ. 2009, 43, 2747–2753. [Google Scholar] [CrossRef]
Figure 1. Distribution of sampling points in the estuary.
Environments 06 00092 g001
Figure 2. Distribution of 16 polycyclic aromatic hydrocarbons (PAHs) in the estuary of Hongze Lake.
Environments 06 00092 g002
Figure 3. The specific gravity of different ring number PAHs at different points.
Environments 06 00092 g003
Figure 4. The results of PAHs source ratio analysis. (A) Ratios of Fla/(Pyr) vs. Ant/(Ant + Phe), (B) Fla/(Pyr) vs. LMW/HMW (C) Fla/(Fla + Pyr) vs. BaP/Pyr, (D) Fla/(Fla + Pyr) vs. BaA/(BaA + Chr).
Environments 06 00092 g004
Figure 5. PAHs principal component analysis load.
Environments 06 00092 g005
Table 1. Comparison of the content of PAHs in the estuary with worldwide research area.
LocationTotal Concentration (ng/g)Average (ng/g)Number of PAHs References
Haihe River171.4–9511.2 2125.416[8]
Yellow River4010–80108[9]
Yangze River, China10.3–1239178.014[10]
Huai River (upper reach)95.2–877.516[11]
Huai River (middle reach)810–28228795516[12]
Huai River, China5.4–1293143.016[2]
Dongping Lake49.40–133.6716[13]
Nansi Lake229.17–609.9414[14]
Taihu Lake, China262.1–1087443.0216[15]
The estuary of Hongze Lake562.4–1586950.716Present research
Table 2. The characteristic ratio of pollution source of PAHs.
RatioOil SourceCombustion SourceTransportation Source
OilCoal and Biomass
LMW/HMW>1 <1
FIa/Pyr<1 >1
Ant/(Phe + Ant)<0.1 >0.1
Fla/(Fla + Pyr)<0.40.4–0.5>0.5
BaA/(BaA + Chr)<0.2 >0.35
BaP/Pyr <11–6
LMW means PAHs with 2-ring and 3-ring, and HMW means PAHs with a ring number of ≥ 4.
Table 3. Characteristic compounds emitted from various sources [23,24,25,26,27,28].
Pollution SourceCharacteristic Compounds
Byproduct of coal tarNap
Oil sourceFlu, Fla, Pyr, BkF, In(1,2,3-cd)P
Diesel sourcePhe, Flu, Pyr, Ant
Stable combustion sourceAce, Acy, Chr, BkF
Motor vehicles with liquefied petroleumFlu, Pyr, B(g, h, i)P
Lubricating oil and industrial sourcesFlu, high-ring PAHs
Table 4. Ecological risk assessment of PAHs in the estuary.
PAHsERLERMK
S1S2S3S4S5S1’S2’S3’S4’S5’
NaP16021000000000000
Acy446400000000000
Ace16500000000.190000
Flu195402.802.354.601.841.983.122.111.033.623.18
Phe24015001.580.911.920.650.631.130.770.422.751.09
Ant8510000.520.340.520.220.270.590.270.170.810.48
Fla6005100.200.090.130.070.070.320.090.050.400.19
Pyr66526000.310.310.460.310.110.180.150.410.460.14
BaA261160000.02000.030.210.03000.10
Chr38428000.280.350.380.280.290.520.320.320.310.28
BbF32018800.330.210.350.160.120.210.240.120.180.11
BkF2801620000.0200.010.040000.02
BaP43016000.070.050.050.040.040.120.050.030.040.06
DBA6326000.0500000000
BghiP43016000.260.160.320.130.130.100.120.080.110.10
InP
Total402244,7920.290.170.160.390.200.280.210.350.170.14

