Next Article in Journal
Distribution, Sources, and Risk Assessment of Polycyclic Aromatic Hydrocarbons in the Estuary of Hongze Lake, China
Next Article in Special Issue
Nitrogen Mineralization in a Sandy Soil Amended with Treated Low-Phosphorus Broiler Litter
Previous Article in Journal
Is a Land Use Regression Model Capable of Predicting the Cleanest Route to School?
Previous Article in Special Issue
Effect of the Type of Gas-Permeable Membrane in Ammonia Recovery from Air
 
 
Correction published on 24 September 2019, see Environments 2019, 6(10), 109.
Article

Differences in Microbial Communities and Pathogen Survival Between a Covered and Uncovered Anaerobic Lagoon

by
Thomas F. Ducey
1,*,
Diana M. C. Rashash
2 and
Ariel A. Szogi
1
1
Coastal Plains Soil, Water, and Plant Research Center, Agricultural Research Service, USDA, Florence, SC 29501, USA
2
North Carolina Cooperative Extension Service, Jacksonville, NC 28540, USA
*
Author to whom correspondence should be addressed.
Environments 2019, 6(8), 91; https://doi.org/10.3390/environments6080091
Submission received: 21 June 2019 / Revised: 31 July 2019 / Accepted: 1 August 2019 / Published: 6 August 2019

Abstract

:
Anaerobic lagoons are a critical component of confined swine feeding operations. These structures can be modified, using a synthetic cover, to enhance their ability to capture the emission of ammonia and other malodorous compounds. Very little has been done to assess the potential of these covers to alter lagoon biological properties. Alterations in the physicochemical makeup can impact the biological properties, most notably, the pathogenic populations. To this aim, we performed a seasonal study of two commercial swine operations, one with a conventional open lagoon, the other which employed a permeable, synthetic cover. Results indicated that lagoon fecal coliforms, and Escherichia coli were significantly influenced by sampling location (lagoon vs house) and lagoon type (open vs. covered), while Enterococcus sp. were influenced by sampling location only. Comparisons against environmental variables revealed that fecal coliforms (r2 = 0.40), E. coli (r2 = 0.58), and Enterococcus sp. (r2 = 0.25) significantly responded to changes in pH. Deep 16S sequencing of lagoon and house bacterial and archaeal communities demonstrated grouping by both sampling location and lagoon type, with several environmental variables correlating to microbial community differences. Overall, these results demonstrate that permeable synthetic covers play a role in changing the lagoon microclimate, impacting lagoon physicochemical and biological properties.

1. Introduction

Anaerobic lagoons remain the preferred option of manure treatment for confined swine production systems in the Southeastern United States. These earthen structures, utilized for both passive treatment and storage, are aimed at reducing the organic load of fresh manure and consequently, concentrating the nutrients contained within these waste materials. These nutrients, combined with anaerobic conditions, provide a suitable growth environment for a variety of microorganisms, including a number of pathogenic bacteria [1]. In the Southeastern U.S., liquid manure is collected under the barns using slotted floors and a shallow pit filled daily or weekly with the supernatant lagoon effluent. Any excess lagoon liquid not used for filling the shallow pit is land applied on spray fields during the crop season. Therefore, pathogens can be reintroduced into the barns with recycled lagoon liquid or deposited into the surrounding environment during land application of the lagoon wastewater, where they may eventually infect livestock or truck crops, thereby potentially entering the food chain [2].
While the construction of anaerobic lagoons tend to follow general engineering design criteria [2], swine operators have the discretion to add additional safeguards and management measures as long as such modifications continue to meet federal, state, and local regulations [3]. For instance, swine operations adjacent to communities may opt to employ synthetic lagoon covers for the control of ammonia and other malodorous compounds [4,5]. These covers can be permeable (e.g., geotextile, foam, straw) or impermeable (e.g., plastic, wood, concrete), and despite differences in cover composition, they all serve a similar purpose—to reduce emissions. One benefit to permeable covers is their ability to allow oxygen penetration, resulting in microclimate formation at the cover/lagoon interface [6,7], and such microclimates have been documented to result in the formation of biofilms [7], enhance protozoa fauna populations [6], and alter nutrient cycling patterns [4].
Given the reliance on anaerobic lagoons by the swine industry as a waste treatment measure, significant research has been conducted into understanding pathogen fate [8], nutrient cycling [9], and emissions [10] in these systems. Many of these studies have focused on open (i.e., uncovered) lagoons, primarily because they dominate the treatment landscape. Despite research demonstrating that lagoon covers utilized in swine production reduce ammonia and malodor emissions, there remains a paucity of information regarding the microbial community composition of covered lagoons, and the potential for synthetic covers to impact pathogenic populations.
Given the lack of information on the microbial communities that populate covered lagoons, and whether these lagoons can control pathogenic populations, this study was conducted with two major objectives: (i) determine potential differences in pathogen kill rates and (ii) assess microbial community differences between a covered and uncovered lagoon. A third objective, if differences are identified in the first two objectives, is to determine the relationship between environmental factors and the noted differences between the two types of lagoon systems.

2. Materials and Methods

2.1. Site Description and Sample Collection

Two commercial swine finishing operations were chosen for this study. The first operation, supporting between 2100 and 2200 animals per cycle, had an uncovered 0.55 ha lagoon, while the second operation, supporting between 1200 and 1500 animals per cycle, functioned with a synthetic, permeable membrane covering the 0.4 ha lagoon, details of which have been previously described [6]. The covered lagoon operation employed a flush tank recirculation system, while the open lagoon operation employed a shallow pit with a pull-plug flushing system for moving waste out of the house. Samples were collected seasonally, starting with a spring sampling in April of 2017, and ending with a winter sampling in February of 2018. Samples from both lagoons and houses were performed in triplicate. For the uncovered house, samples were collected from the recirculation pump, while samples collected from the covered house were collected inside, during the flushing event. Lagoon samples were collected from the top of the water column at three separate locations.

2.2. Sample Analysis

Dissolved oxygen and temperature were recorded on site using a YSI ProODO optical dissolved oxygen meter (YSI Incorporated, Yellow Springs, OH, USA) prior to transport and storage of lagoon liquid samples on ice. Additional wastewater analyses, which included total suspended solids (TSS), volatile suspended solids (VSS), pH, ammonium (NH4-N), and total Kjeldahl-N (TKN) were performed according to Standard Methods for the Examination of Water and Wastewater [11]. Anions (Cl, SO4-S, NO3-N, NO2-N) were measured by chemically suppressed ion chromatography using a Dionex 2000 Ion Chromatograph according to ASTM Standard Method D4327-11 [12], while cations (Ca, K, Mg, and Na) were measured according to ASTM Standard Method D6919-09 [13].

2.3. Pathogen Detection

Escherichia coli, fecal coliforms, and Enterococcus sp. were enumerated on CHROMAgar E. coli (CHROMagar, Paris, France), mFC (Sigma, St. Louis, MO, USA), and mE (Becton Dickinson, Franklin Lakes, NJ) agar, respectively. To determine colony-forming units (CFU), wastewater samples were serially diluted in sterile phosphate-buffered saline (PBS) and spiral plated in triplicate on the corresponding plates. All incubations were done aerobically, at temperatures and times as follows: E. coli at 37 °C for 24 h; fecal coliforms at 44.5 °C for 24 h; and Enterococcus sp. at 37 °C for 48 h. Due to the variability in suspended solids from sample to sample, all CFU were adjusted per gram of volatile suspended solids (CFU/gVSS) prior to log10 normalization for statistical analysis purposes.

2.4. DNA Extraction

A total of 2 mL of each wastewater sample was set aside for DNA extraction using a Qiagen Allprep PowerViral DNA/RNA Kit (Qiagen Sciences Inc, Germantown, MD). A total of 200 μL of each sample was used per extraction using protocol modifications designed to extract DNA only (no RNA) from wastewater and manure samples (i.e., no β-mercaptoethanol added to buffer solutions, and DNase steps skipped). The remaining wastewater samples were archived at −80 °C. DNA purity was determined by absorbance at 260 and 280 nm using a spectrophotometer, and quantity was determined fluorometrically using a Qubit dsDNA assay kit (ThermoFisher Scientific, Waltham, MA, USA).

2.5. Deep 16S sequencing and Analysis

Deep 16S sequencing of the V3–V4 region was performed on an Ion Torrent PGM sequencer, using a 316v2 chip and Hi-Q View sequencing reagents. Barcoded bacterial 341F (5’-CCTAYGGGRBGCASCAG-3’) and 806R (5’-GGACTACNVGGGTWTCTAAT-3’), and archaeal ARC787F (5’-ATTAGATACCCSBGTAGTCC-3’) and ARC1059R (5’-GCCATGCACCWCCTCT-3’) primers were designed according to the Ion Amplicon Library Preparation Fusion Methodology (Life Technologies, Carlsbad, CA, USA), and included 12 base pair error-correcting Golay barcodes [14]. Primers were synthesized by Integrated DNA Technologies (IDT, Coralville, IA, USA). Individual amplicon libraries for bacterial and archaeal community analysis were generated by PCR using the following protocol: activation of enzyme at 94 °C for 3 min, followed by 40 cycles of denaturation at 94 °C for 30 s, annealing at 58 °C for 30 s, and elongation at 68 °C for 45 s. Amplicons were quantified using a Qubit Fluorometer (Invitrogen, Carlsbad, CA, USA), quality controlled on an Agilent 2100 BioAnalyzer (Agilent, Santa Clara, CA, USA), and amplicons from each sample were mixed in equimolar amounts prior to sequencing.
Full-length forward- and reverse-direction sequencing libraries for each sample were verified for read quality, assembled, and analyzed using the Ion Reporter v5.10 platform and metagenomics workflow (ThermoFisher Scientific, Waltham, MA, USA). Operational taxonomic units (OTUs) were assigned at a cutoff of 97% for genus identification using the curated MicroSEQ 16S v2013.1 and Greengenes v13.5 [15] reference libraries. For determination of substrate utilization for methanogenesis, archaeal families were sorted into three groups: acetoclastic, hydrogenotrophic, and methylotrophic. Methanosaetaceae, Methanosarcinaceae, and Methermicoccaceae were classed as acetoclastic. The Methanomassiliicoccaceae was classed as methylotrophic. The remaining were classed as hydrogenotrophic.

2.6. Statistical Analysis

All statistical analyses were performed using Minitab 17 (Minitab Incorporated, State College, PA). Analysis variance (ANOVA) was conducted using the general linear model, with pairwise comparisons using Fisher’s Least Square Difference Method (LSD); difference between any two means was considered significant with p < 0.05. Regressions of bacterial CFUs (log10 CFU/gVSS) with environmental variables were performed using a linear model. Non-metric multidimensional scaling (NMS) of microbial community population data was performed in PC-Ord v.6 (MJM Software Design, Gleneden Beach, OR, USA).

3. Results and Discussion

3.1. Wastewater Characteristics

Wastewater physicochemical characteristics are summarized in Table 1. Results are consistent with the wastewater properties of other swine-studied anaerobic lagoons [8,9]. Seasonal effects were documented for temperature, with summer samples showing significantly higher (p < 0.05) temperatures than other samples, and dissolved oxygen, with spring samples (0.74 ± 0.07 SE mg L−1) demonstrating significantly higher dissolved oxygen (DO) levels (p < 0.05) than fall samples (0.37 ± 0.01 SE mg L−1). Sampling location (i.e., lagoon vs house) was significant (p < 0.05) for pH, temperature, TSS/VSS, and TKN. Lastly, when examining the lagoons, the type of system (i.e., open versus covered) demonstrated significant differences (p < 0.05) for pH and TKN. Covered lagoons (1009 ± 24 SE mg L−1) have more than double the TKN of open lagoons (473 ± 44 SE mg L−1), this may be explained by the TKN levels originating in the animal houses that feed into those lagoons. TKN in the house feeding into the covered lagoon had mean TKN levels of 3632 ± 339 SE mg L−1, while the house feeding into the open lagoon had mean TKN levels of 1306 ± 211 SE mg L−1. These results differ from those of VanderZaag et al. [4], which showed no significant difference between TKN levels of a covered lagoon system when compared to an open control lagoon system filled from the same wastewater source.
Analysis of cation and anion concentrations of swine wastewater are found in Table 2. While NO2-N and NO3-N were assayed, they were below detectable limits throughout the course of the study. No significant seasonal effects were noticed amongst samples, although sampling location was significant for all cations and anions detected, with significantly increased concentrations (p = 0.05) in swine houses. When examining the lagoon system used, SO4-S was significantly higher (p < 0.05) in the open lagoons (30.8 ± 4.9 SE mg L−1) as compared to covered lagoons (4.5 ± 0.6 SE mg L−1); conversely, NH4-N was significantly increased (p < 0.05) in covered lagoons (858 ± 11 SE mg L−1) as compared to open lagoons (379 ± 38 SE mg L−1). As already noted for TKN, the higher NH4-N concentrations in the covered lagoon most likely were a consequence of higher N loading in the more concentrated wastewater derived from the house feeding into it.

3.2. Pathogen Reduction

Fecal coliforms, E. coli, and Enterococcus sp. were identified and enumerated in all samples (Supplementary Table S1). The highest rates of enumeration were found in animal houses, and at no point were CFU rates higher in a lagoon when compared to its respective house.

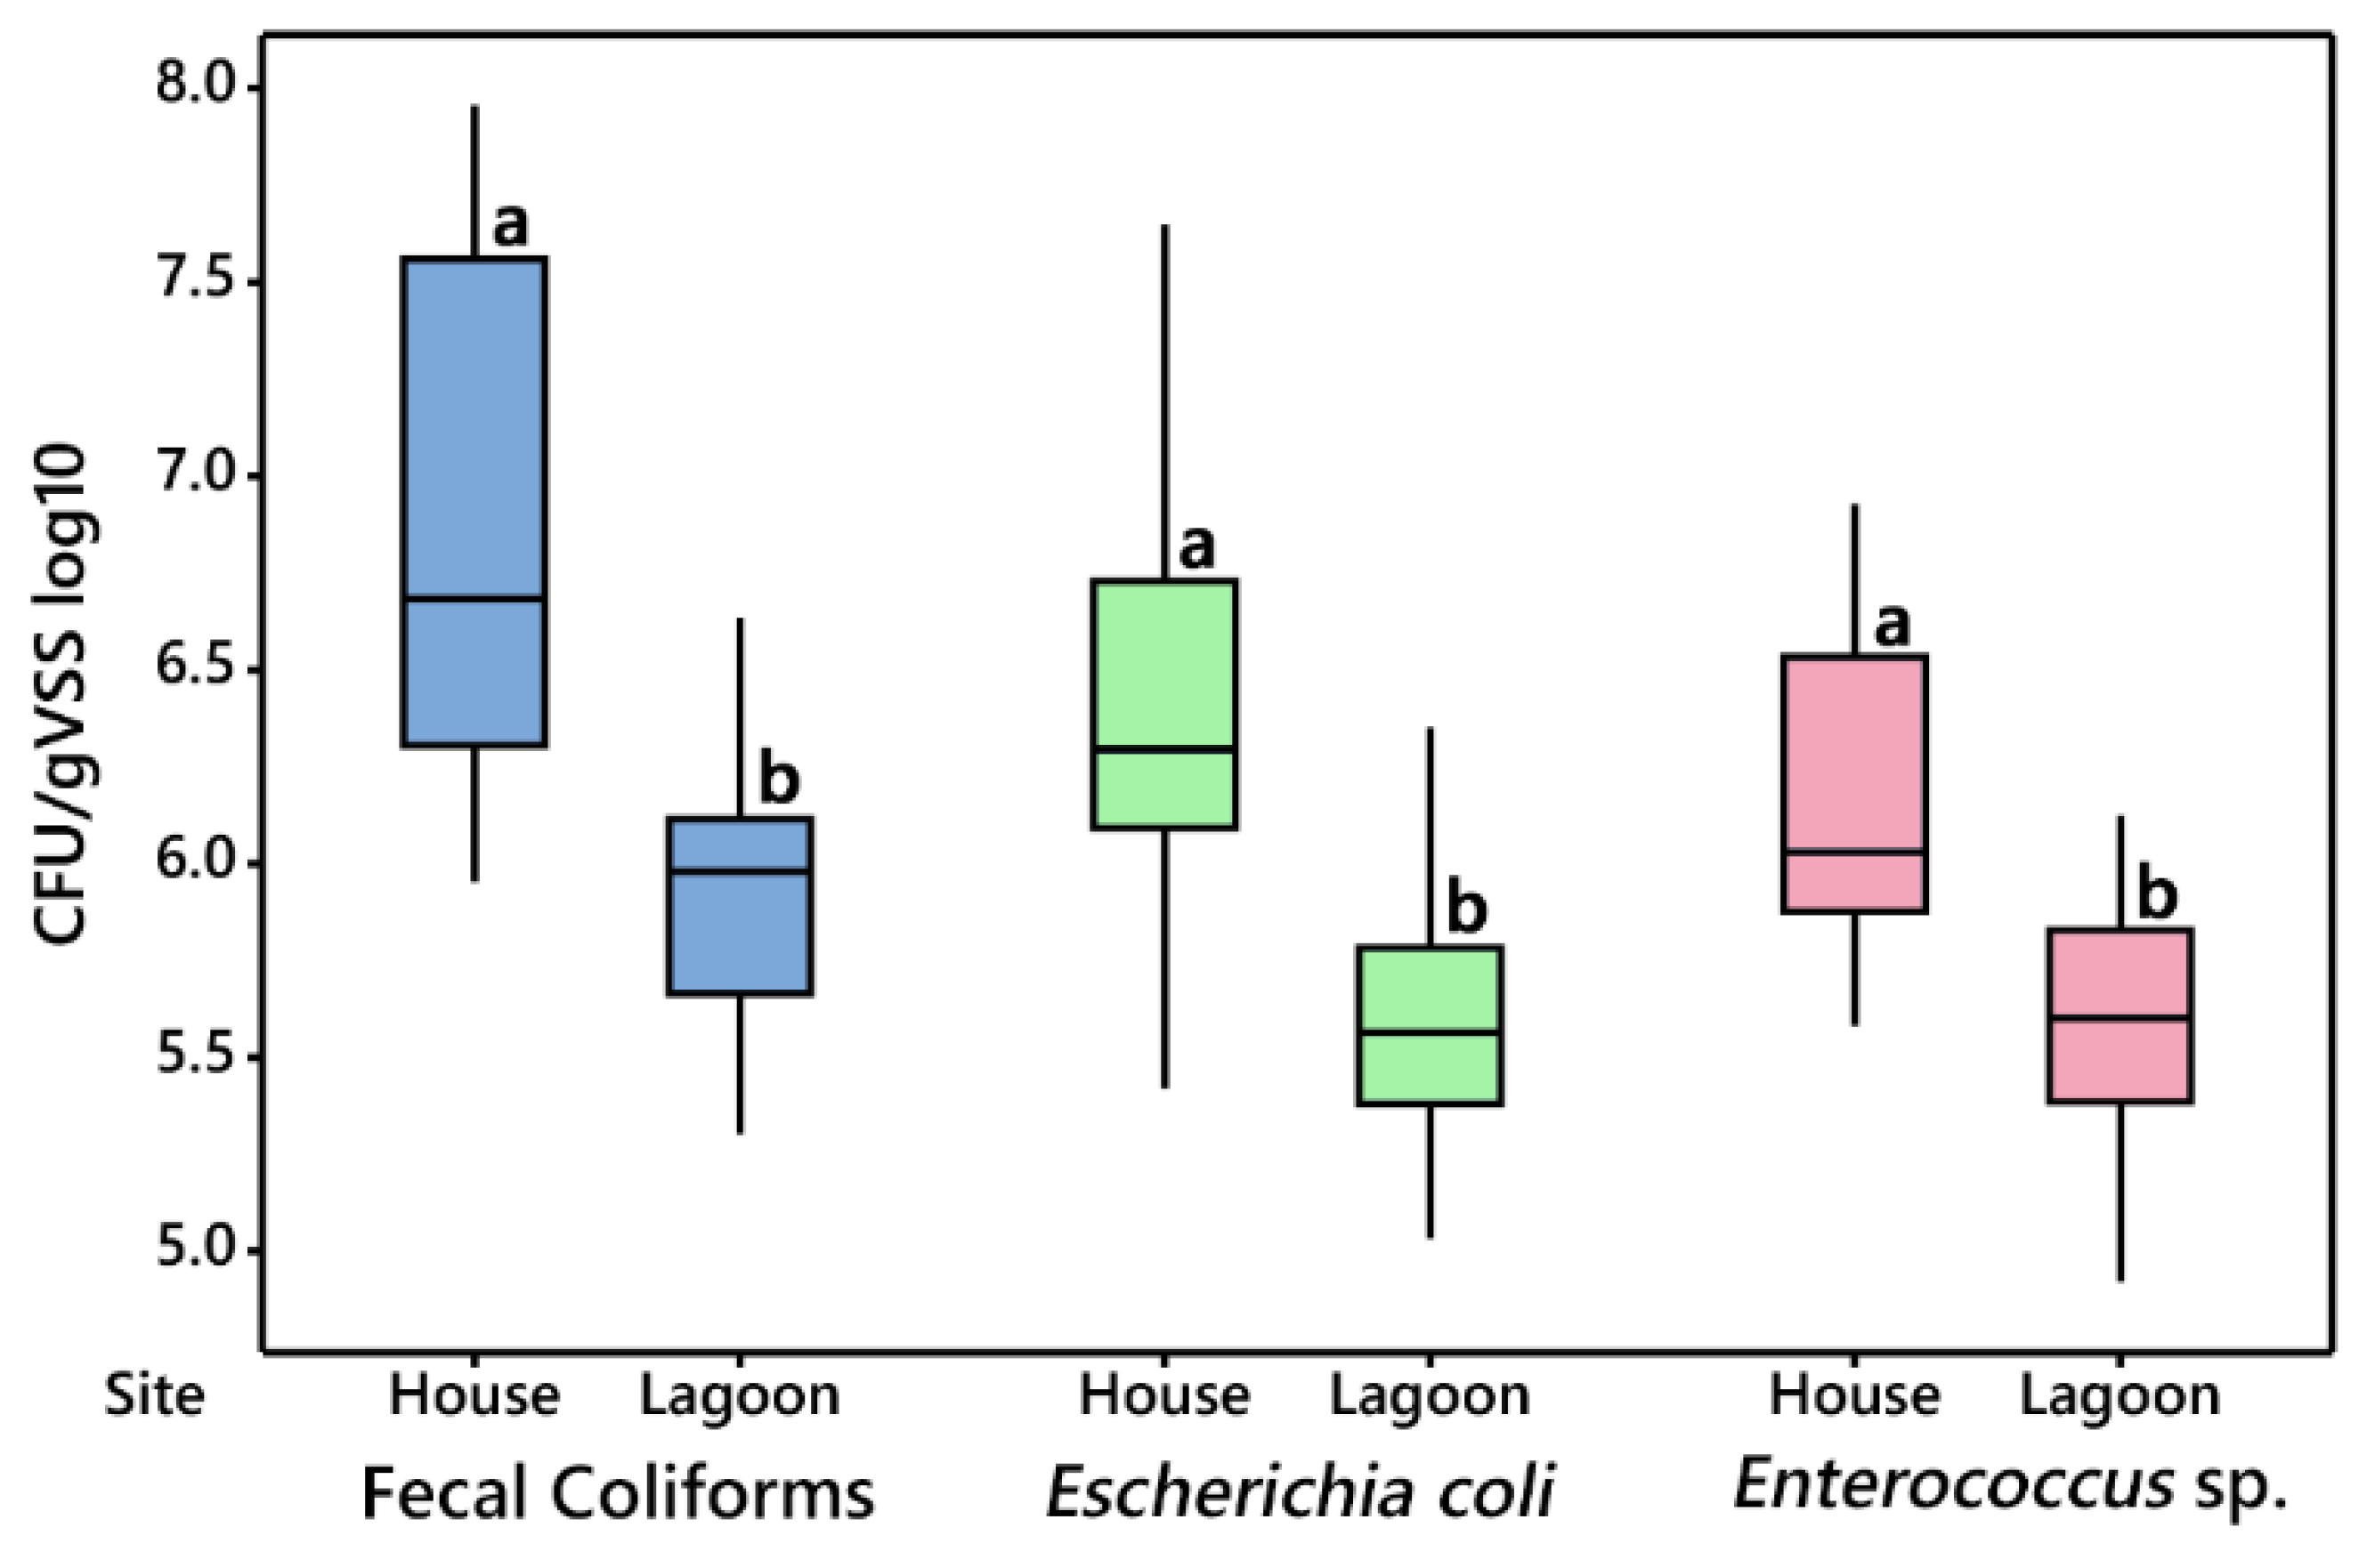
3.2.1. House vs. Lagoon

Comparisons between animal houses and their respective lagoon can be found in Figure 1. Differences in bacterial levels (Figure 1; Supplementary Table S1) between the houses and wastewater lagoons demonstrate that transfer of wastewater from the houses to the lagoons results in significant reductions to all three bacterial indicators measured. Given that all CFUs were adjusted based on volatile suspended solid levels, these reductions are independent of the solids concentration of the wastewater. Significant relationships (p < 0.05) were observed between fecal coliforms, E. coli, and Enterococcus sp. with pH, N (TKN; NH4), chloride, K, and Na. These chemical properties demonstrated significantly higher concentrations in the houses as compared to the lagoons (Table 1 and Table 2). These results are supported by Viancelli et al. [16] that similarly documented reductions in total coliforms and E. coli after movement of swine manure to anaerobic lagoons, a result that may be due to reductions in organic material leading to increased competition for resources.

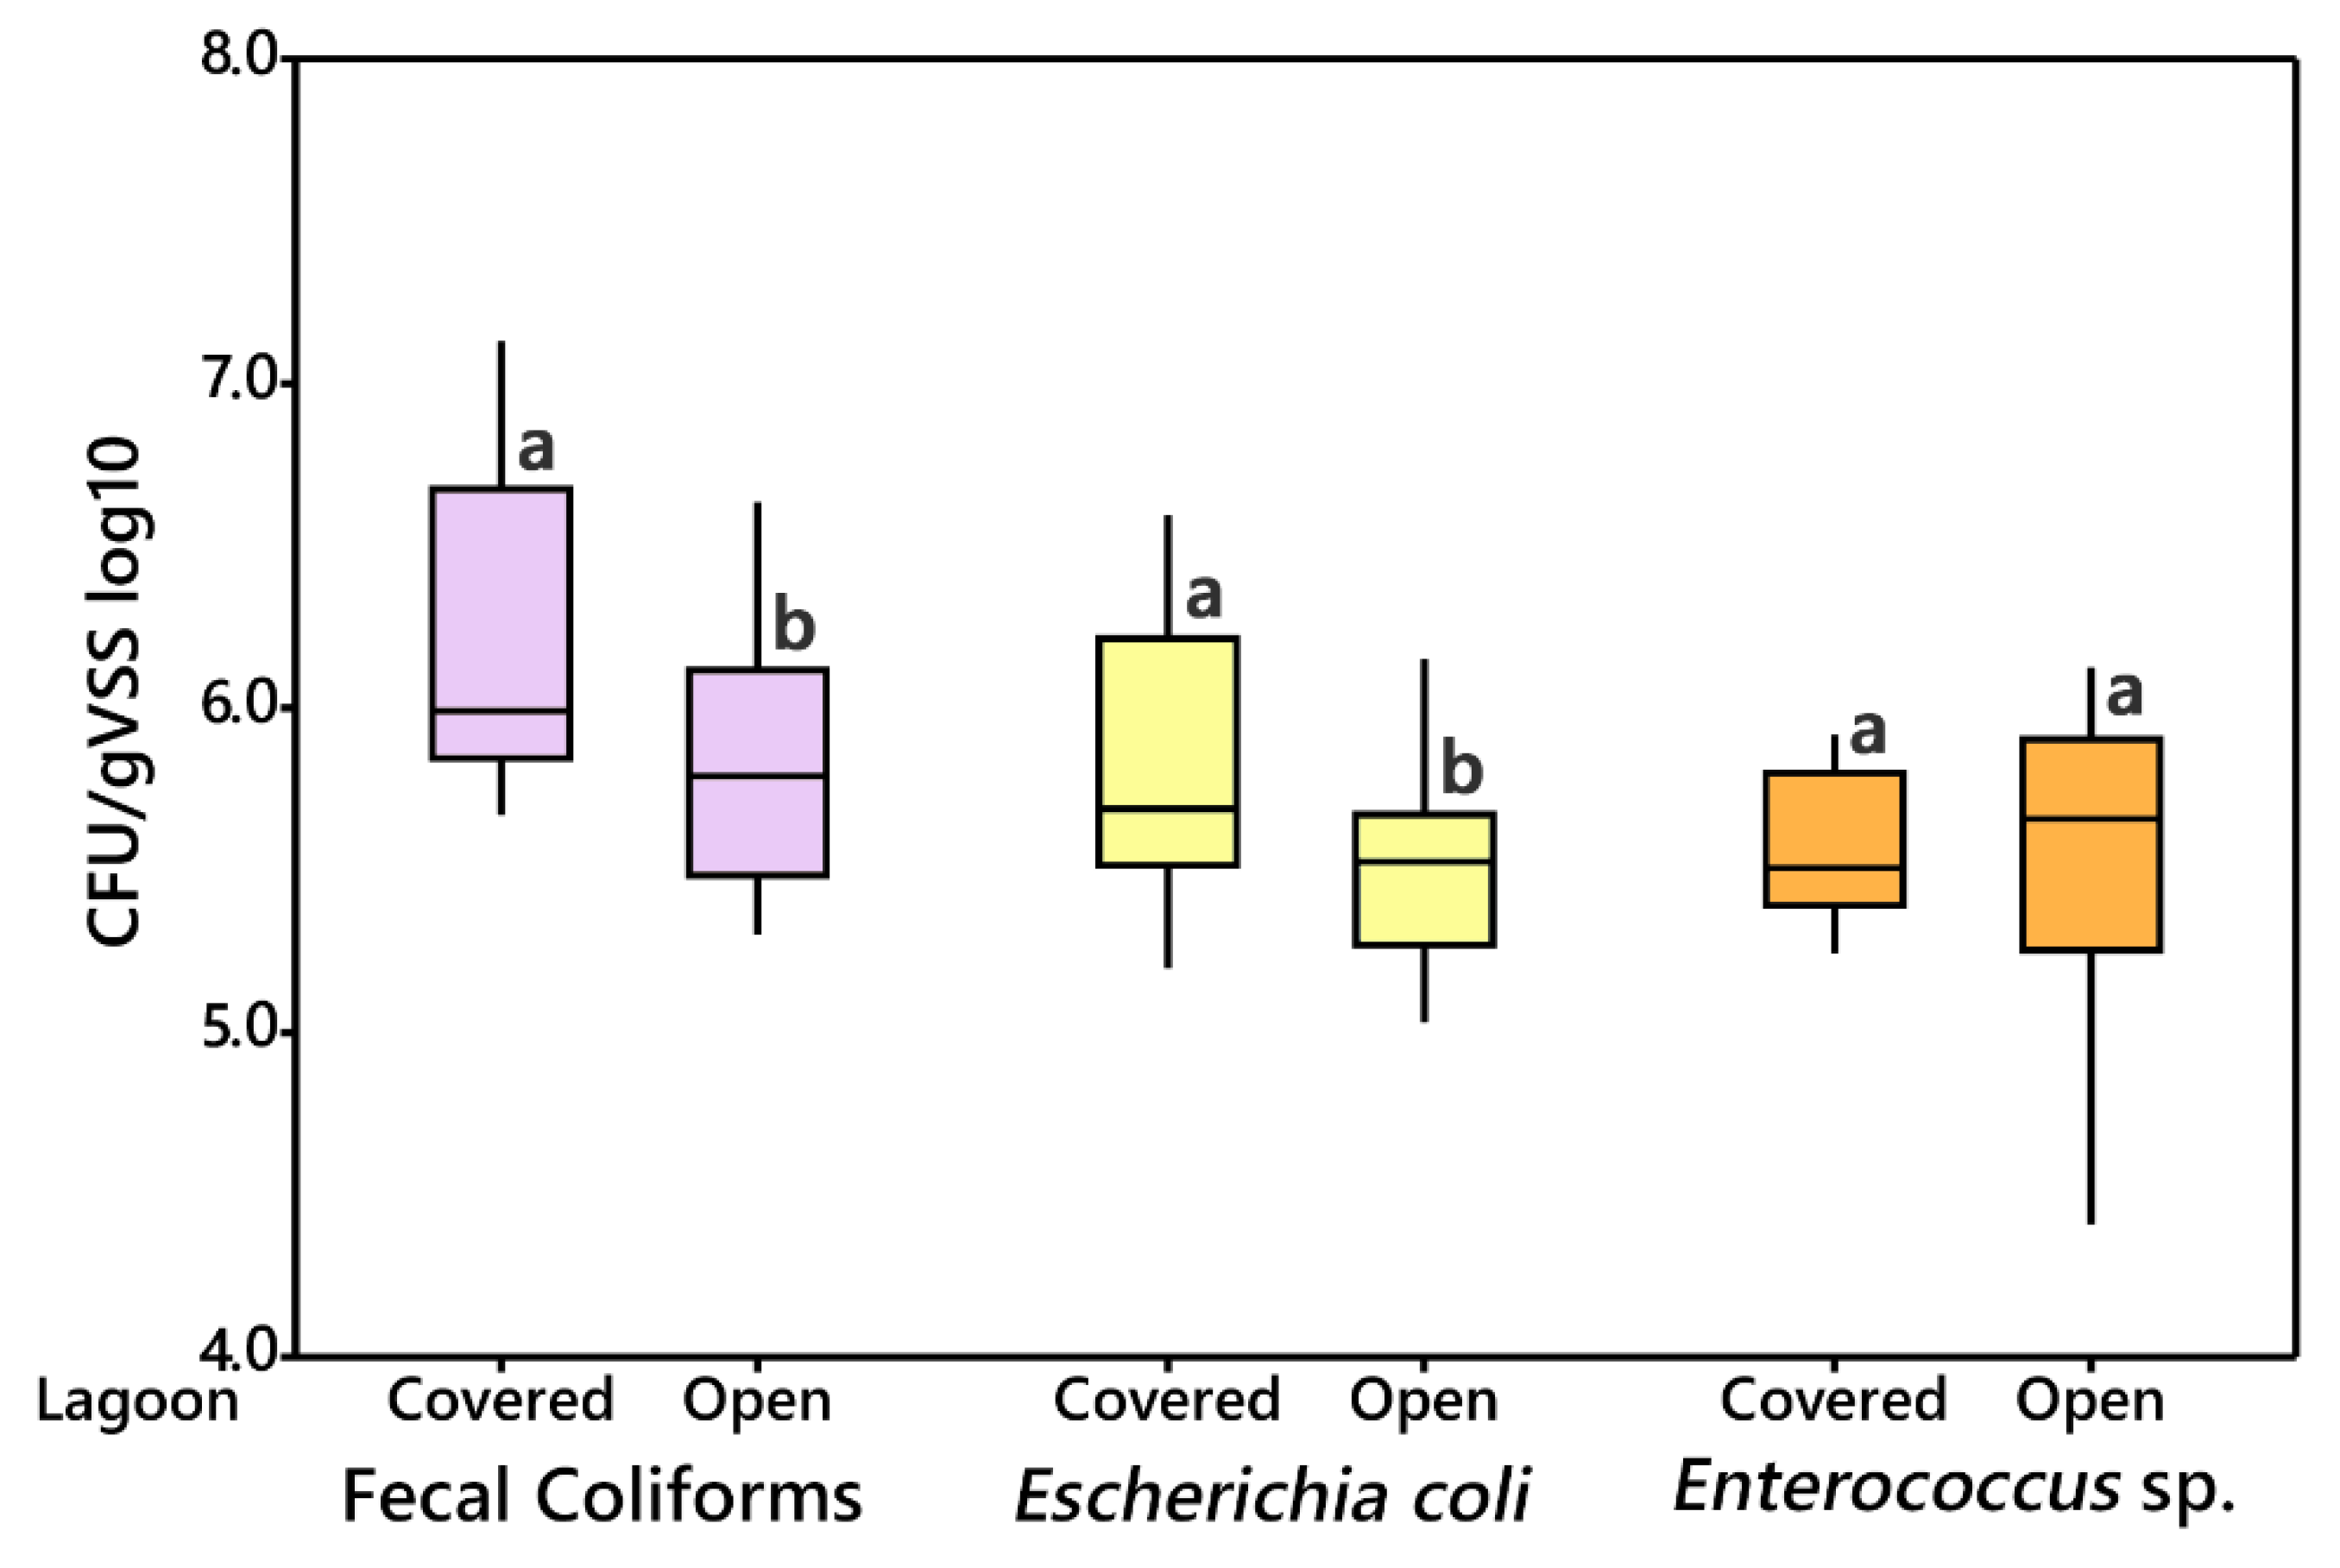
3.2.2. Open vs. Covered Lagoon

Comparisons between open and covered lagoons can be found in Figure 2. Fecal coliform densities in the open lagoon ranged from 5.41 to 6.35 CFU/gVSS log10 to 5.73 to 7.04 CFU/gVSS log10 in the covered lagoon. E. coli ranged from 5.13 to 5.83 CFU/gVSS log10 in the open lagoon, to 5.34 to 6.47 CFU/gVSS log10 in the covered lagoon. Enterococcus sp. counts ranged from 4.88 to 5.94 CFU/gVSS log10 in the open lagoon, to 5.44 to 5.86 CFU/gVSS log10 in the covered lagoon. The CFU counts are listed in Supplementary Table S1.
Analysis of variance examining seasonal, site specific, and sampling location effects demonstrated that all three variables play significant roles in pathogen reduction. While seasonal patterns emerged in CFU counts for all three measured bacterial populations, with highest densities tending to be in the summer samplings, and the lowest densities observed during the winter, only fecal coliform counts demonstrated a significant relationship with temperature (r2 = 0.485, p = 0.003). Examination between pathogen counts and physicochemical characteristics revealed significant relationships between pH and fecal coliforms (r2 = 0.404, p = 0.008), E. coli (r2 = 0.577, p = 0.001), and Enterococcus sp. (r2 = 0.248, p = 0.05). For E. coli, significant relationships between TKN (r2 = 0.261, p = 0.04), chloride (r2 = 0.471, p = 0.003), potassium (r2 = 0.272, p = 0.04), and sodium (r2 = 0.394, p = 0.009) were also identified. No further influences on bacterial counts by physicochemical parameters were noted.
Additionally, for the lagoons, it appears that the addition of a cover had a significant impact on fecal coliform and E. coli levels, resulting in increased CFUs. It is possible that these higher bacterial densities in the covered lagoon may be due to solar radiation. Reductions in solar radiation have been demonstrated to result in increased bacterial counts [8], and may be a contributing factor in the increased bacterial counts in the studied covered lagoon. For the open lagoon, pH was significantly higher as compared to its covered counterpart (Table 1), and Curtis et al. identified that pH levels over 7.5, combined with sunlight, reduced fecal coliform levels [17]. E. coli thrive in a relatively neutral pH range, up to around pH 7.75, after which they begin to become stressed [18]. It should be noted that the open lagoon had pH ranges at or above this 7.75 pH value and could be contributing to the lower CFU counts observed. While increased pH may contribute to reductions in bacterial pathogens, it also results in increased ammonia volatilization. To counter this phenomenon, acidification is employed to reduce ammonia emissions from swine wastewater [19], and if modest reductions in pH (by two to three units) can also achieve significant pathogen reduction levels, it may provide producers with an additional means to reduce environmental impacts. This was demonstrated by Odey et al. who utilized lactic acid fermentation to inactivate fecal coliforms in human fecal sludge by reducing the pH to 3.9 [20]. Additionally, E. coli is considered a major reservoir of antibiotic resistance genes [21], so any employable means to reduce E. coli CFUs could prove to be a treatment capable of disrupting the cycle of antimicrobial resistance of animal origin.

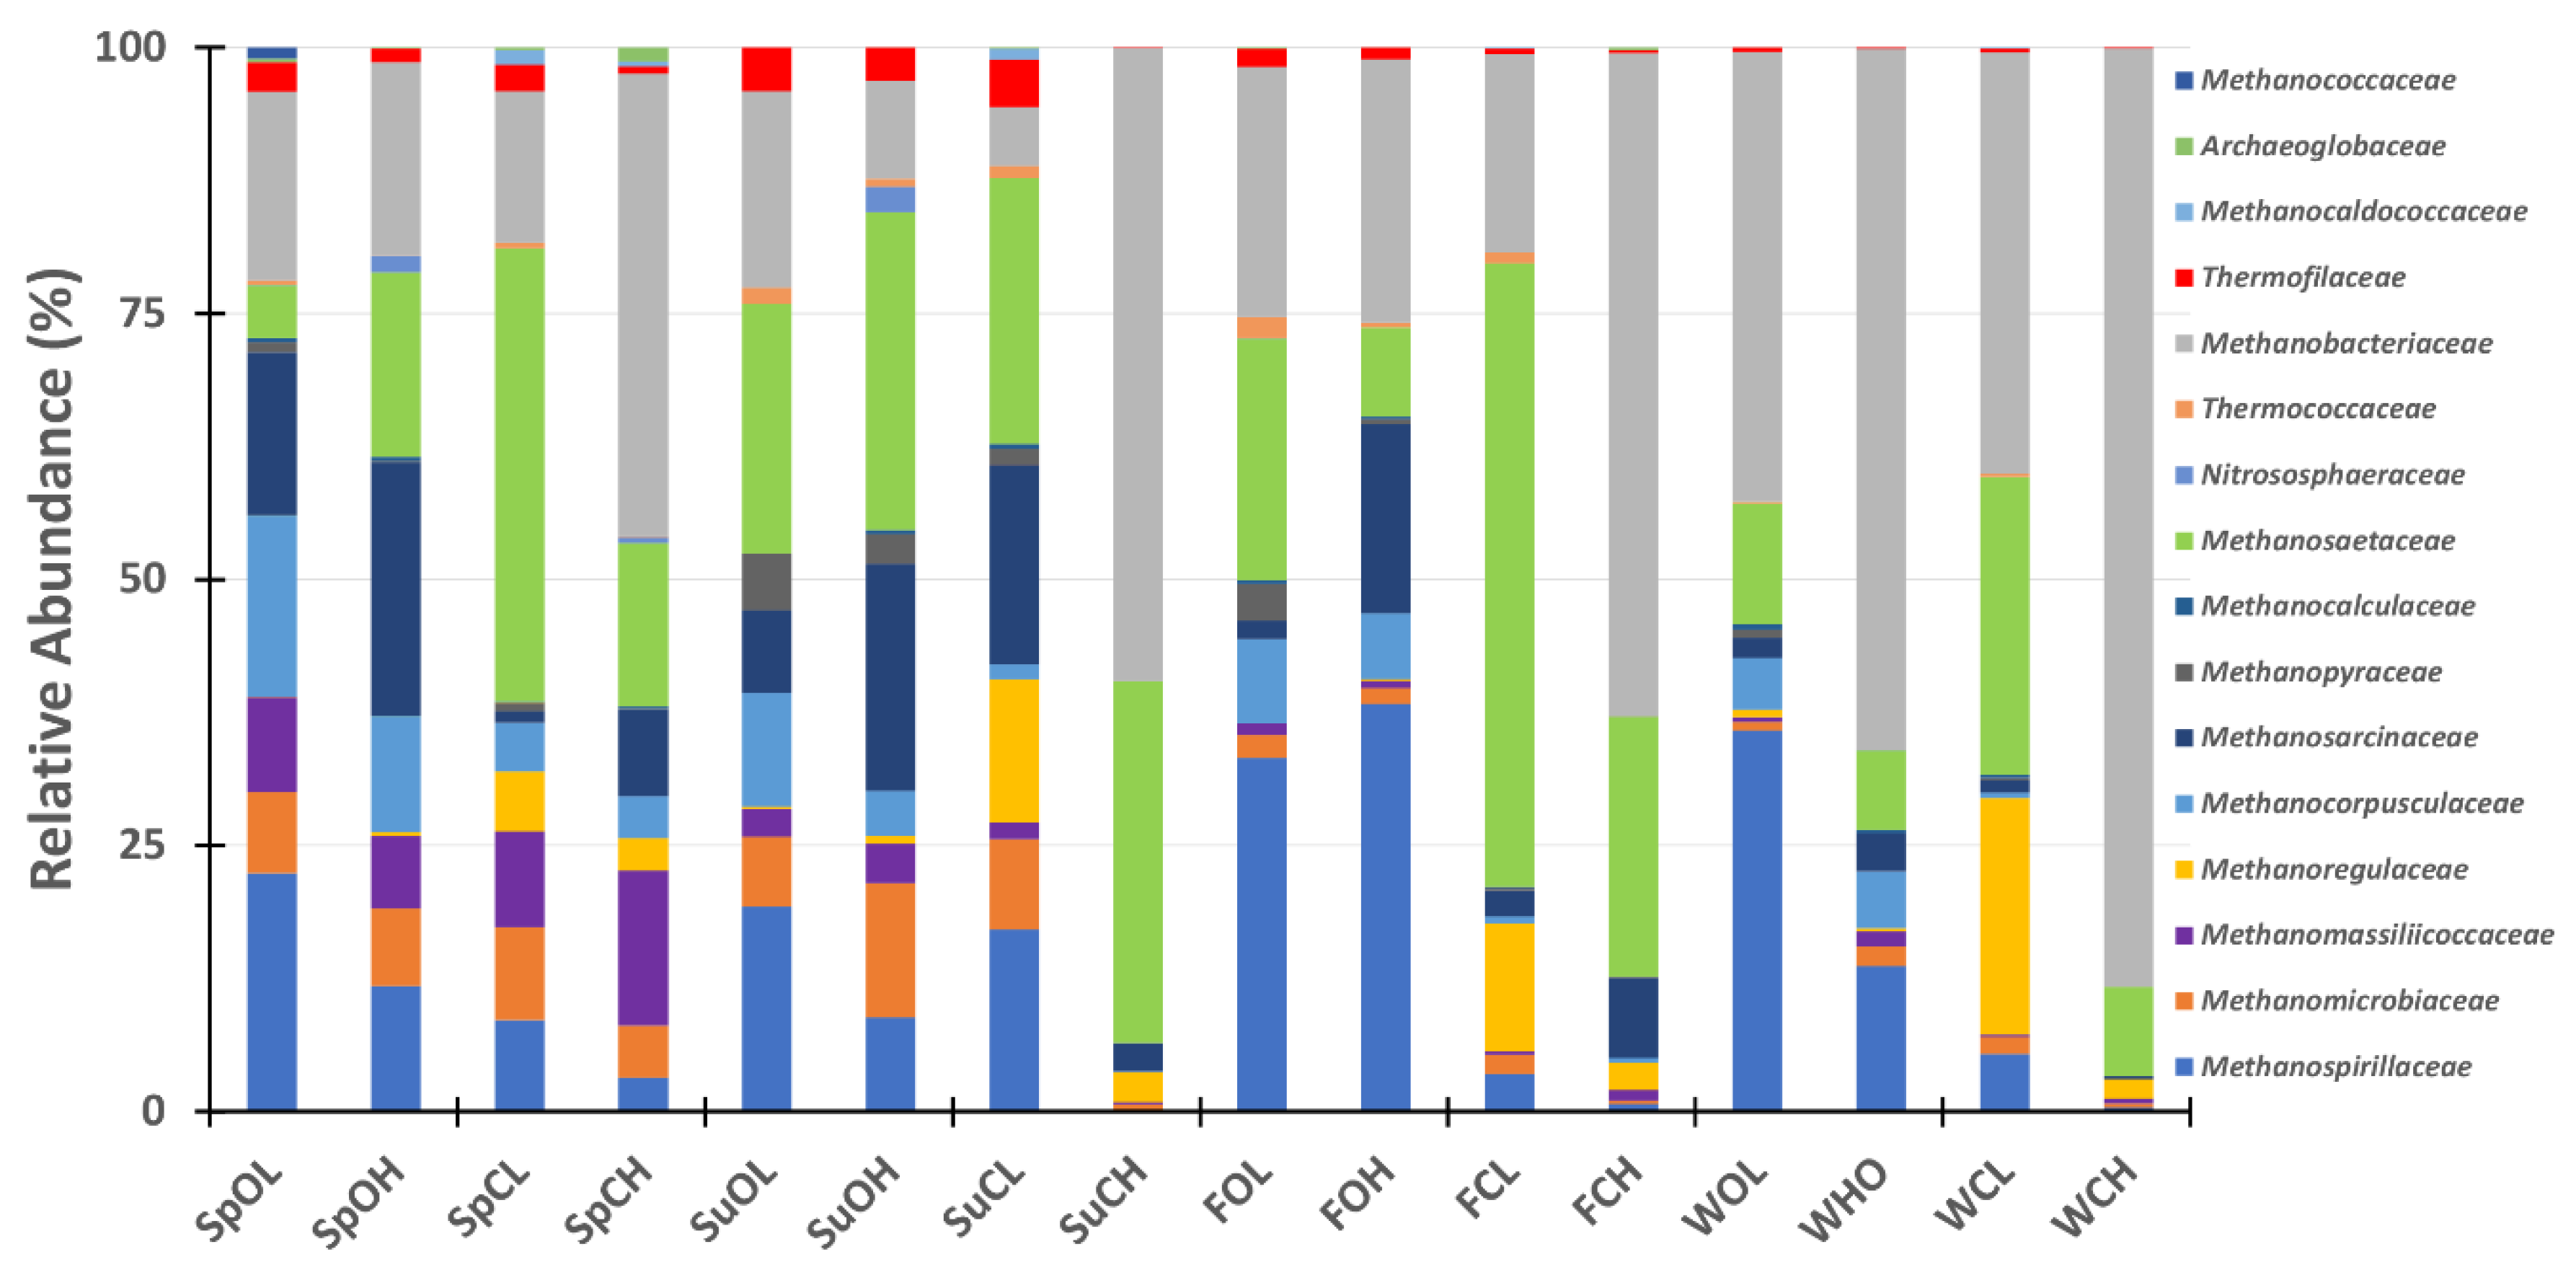
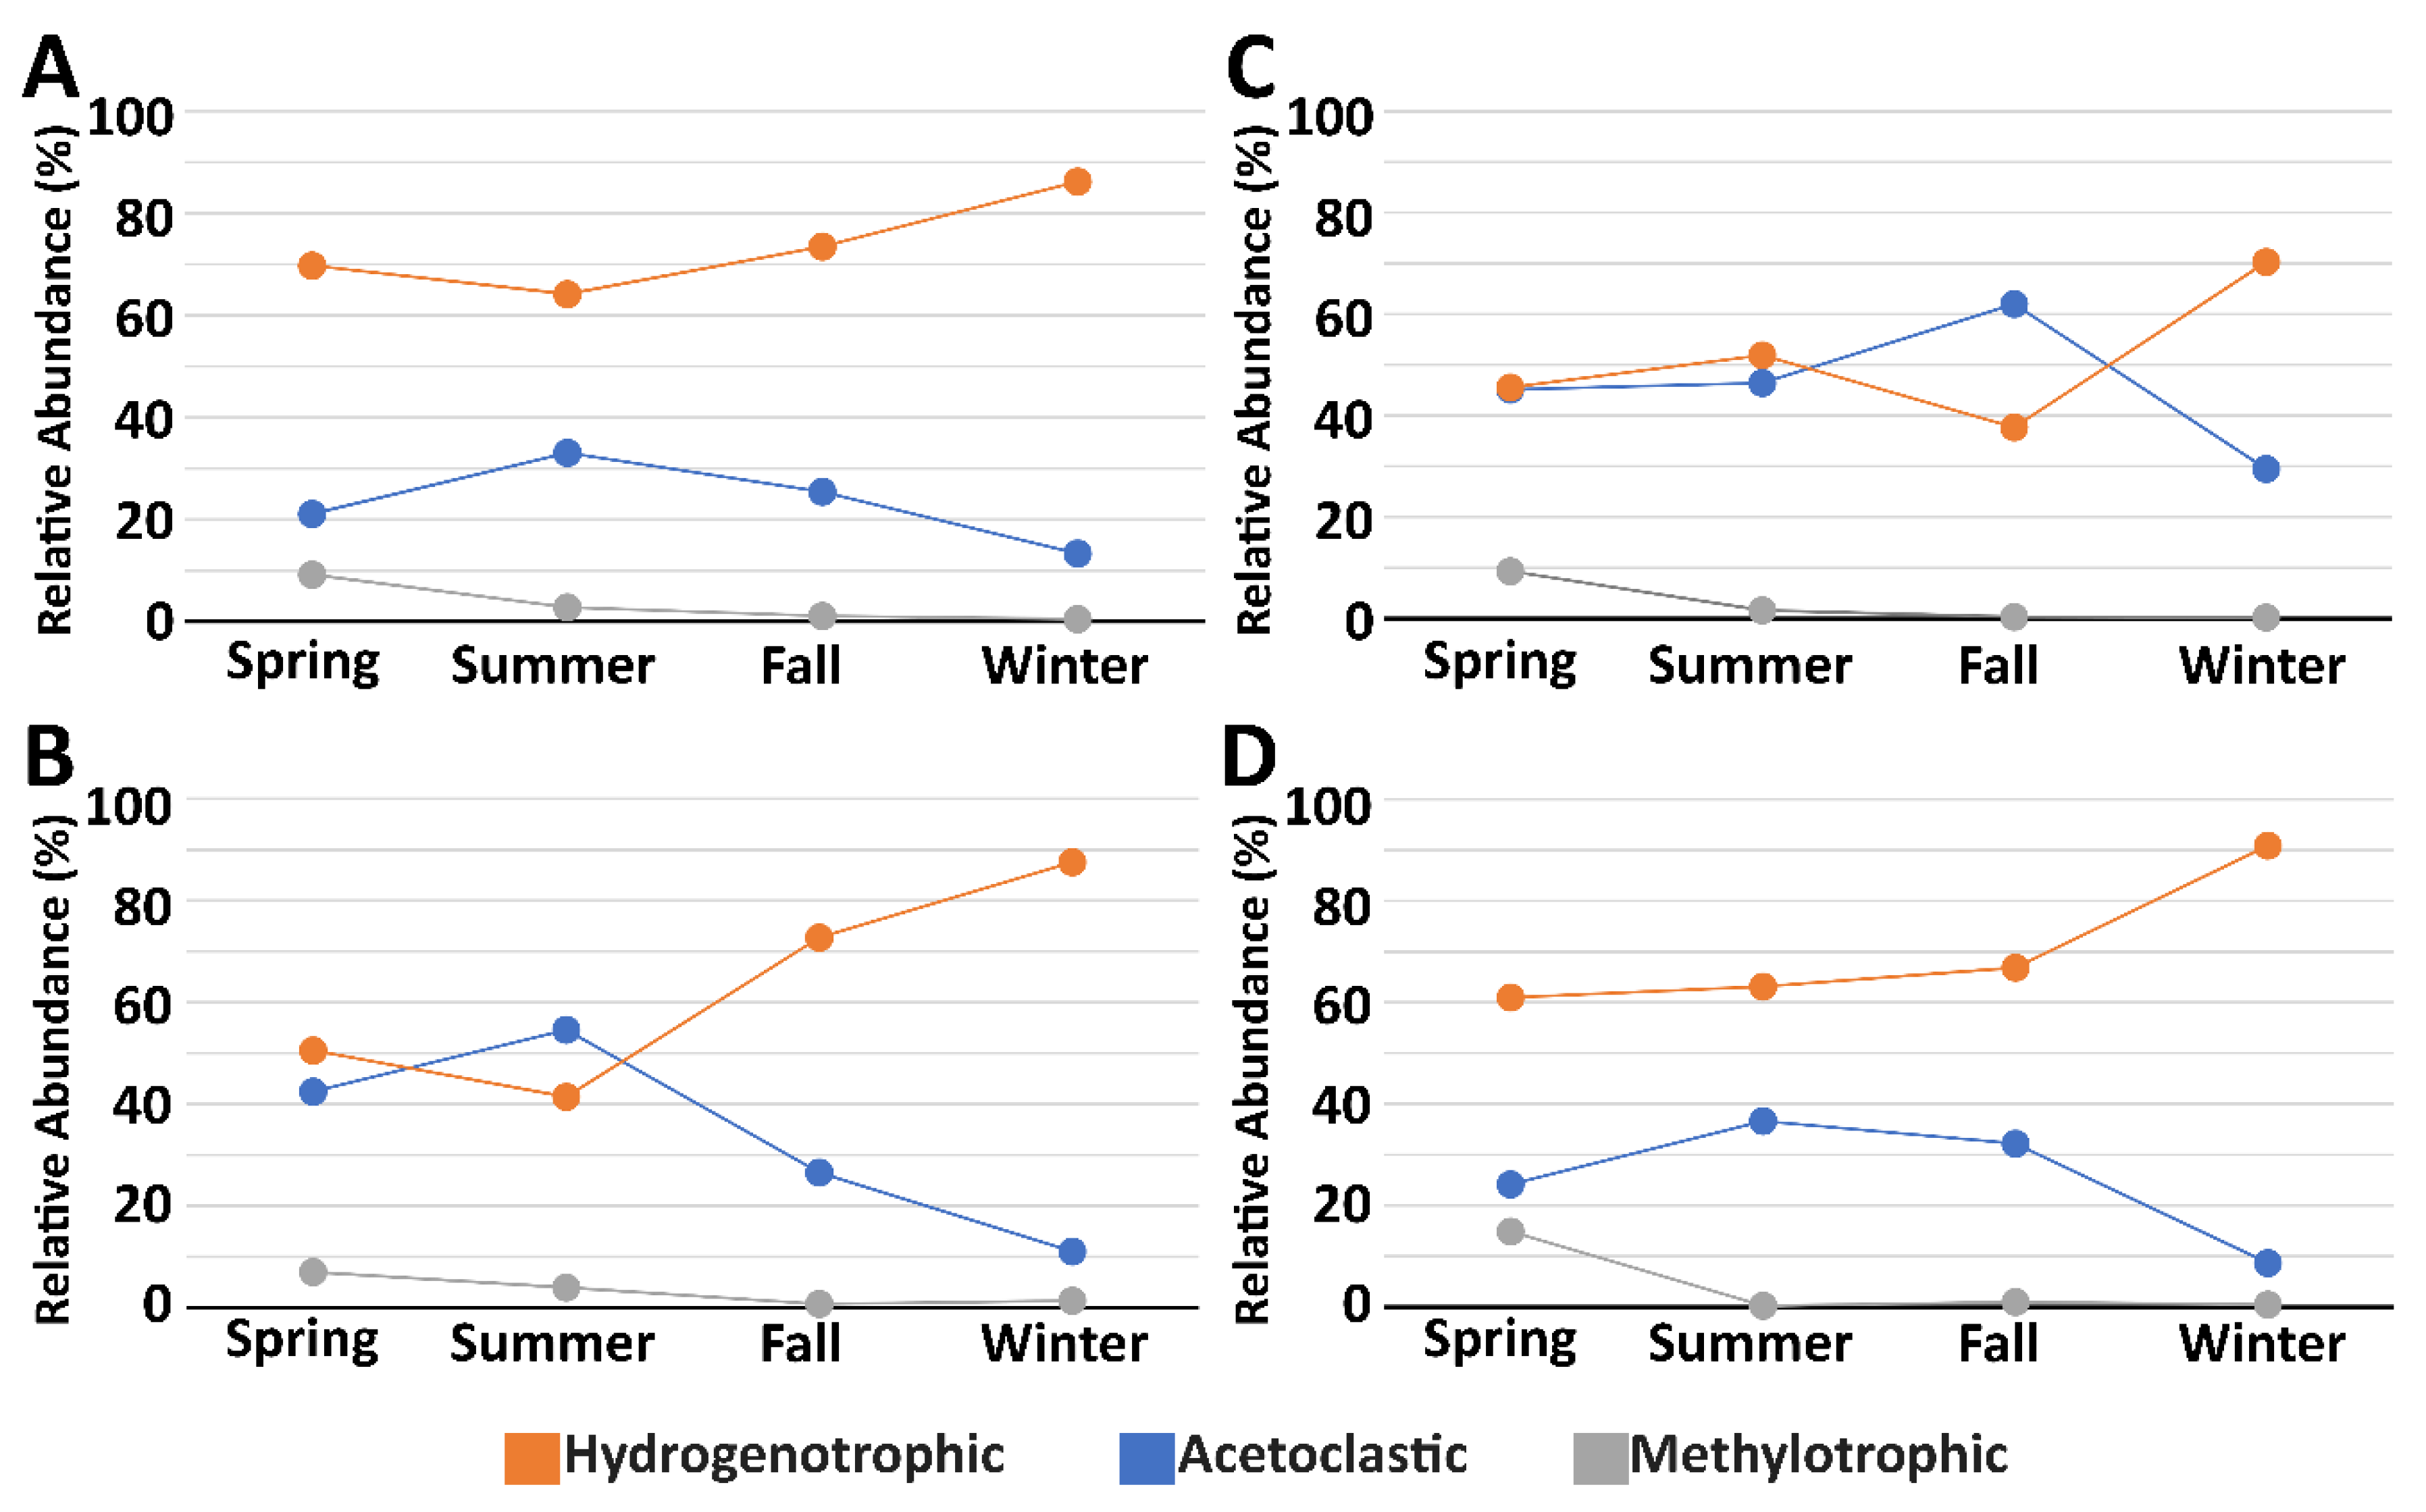
3.3. Microbial Community Composition

Microbial community analysis using non-metric multidimensional scaling (Figure 3 and Figure 4) revealed significant differences in the bacterial and archaeal population structures of the open and covered systems. While the samples taken from the lagoon and house of the open system showed a high degree of similarity, as evidenced by their overlapping groupings (Figure 3 and Figure 4), the lagoon and house from the covered system neither overlapped with the open system, or each other. This pattern was similar in both the bacterial and archaeal NMS plots, and indicate larger differences in the population structure of the covered system. A number of environmental relationships correlate with these differences for bacterial populations (Figure 3), and are as follows: along the first axis, pH (r2 = 0.354), TSS/VSS (r2 = 0.467), TKN (r2 = 0.513), K (r2 = 0.532), and Na (r2 = 0.338); and along the second axis, chloride (r2 = 0.316), pH (r2 = 0.266), and Na (r2 = 0.258). Both TKN and suspended solids have been previously demonstrated to correlate with bacterial community structure [22]. Archaeal populations (Figure 4) correlated with several environmental variables along the first axis, Ca (r2 = 0.468), K (r2 = 0.468), and TKN (r2 = 0.422). Calcium has been demonstrated to impact anaerobic digestion at concentrations as low as 100 mg L−1 [23], while potassium has been reported as toxic to acetate-utilizing methanogens [24].
The bacterial populations of both the covered and open lagoons demonstrate similarity to lagoons previously reported [22,25]. Of the 231 families identified in the 16 waste samples collected over the course of the study, using the universal bacterial primer set, only 22 bacterial families (9.5%) were represented in all 16 samplings. However, these bacterial families account for an average of 62.2% (± 4.2% SE; range 33.1% to 86.3%) of the OTU sequences classified in each sample (Figure 5; Supplementary Material Table S2). A total of 34 (14.7%) bacterial families were represented in all 8 lagoon samplings (see Supplementary Material Table S2). Of these 34 families, several were previously reported as being ubiquitous in analyzed anaerobic swine lagoons [22], such as Ruminococcaceae, Chlostridiaceae, Lachnospiraceae, Peptostreptococcaceae, and Synergistaceae. One noticeable difference is that while previous studies demonstrated high levels of Chromatiaceae, in this particularly study, this family went unidentified in the covered lagoon samples. The Chromatiaceae, also referred to as purple sulfur bacteria, rely primarily on phototrophic growth [26], and their growth in open lagoons is often quite evident, particularly when the lagoons adopt a purplish to red hue [27]. This family accounted for approximately half the OTU sequences for the open lagoon in the spring (56.3%) and summer (55.0%) samplings (see Figure 5). The greenish tint of the covered lagoon samples compared to the purplish tint of the open lagoon samples during sampling lent support to these findings. These findings potentially correlate with the significantly higher levels of SO4-S in the open lagoons as compared to the covered lagoons, due to sulfate oxidation by purple sulfur bacteria [28]. These results are similarly reflected in the identification of Desulfomicrobiaceae, a family of sulfate reducers [29], only in samples taken from the open lagoon system. Additional sulfate reducers belonging to the families Desulfobacteraceae (8 of 8), Desulfobulbaceae (8 of 8), and Desulfovirbrionaceae (7 of 8) were found in a majority of all lagoon samples [30]. Additionally, while primers 341F and 806R were designed as bacterial-specific, they have been known to pick up archaeal sequences [31]. This led to the identification of the Methanobacteriaceae, an archaeal family of hydrogenotrophic (H2/CO2) methane (CH4) producers, and the Methanosaetaceae, a family of archaeal acetoclastic methanogens, both of which were found in all 16 samples. The identification of these two archaeal families is of particular importance given the interest of the pork industry to use impermeable lagoon covers to trap methane for energy production in their “manure-to-energy” program initiative [32].
A closer look at the archaeal community composition (Figure 6; Supplementary Table S3), using archaeal-specific primers confirmed the presence of OTUs classified to Methanobacteriaceae and Methanosaetaceae, as well OTUs classified to five other methanogenic archaeal families, identified in all 16 samples: Methanospirillaceae, Methanomicrobiaceae, Methanosarcinaceae, Methanocorpusculacea, and the methylotropic Methanomassiliicoccaceae. The family Thermofilaceae was also identified in all 16 samples, bringing the number of families found in all 16 samples up to eight. When looking at just the eight lagoon samples, a total of 11 families were identified, and include the above-mentioned eight, as well as Methanpyraceae, Methanocalculaceae, and Thermococcaceae. The remaining classified OTUs were assigned to families not found in all samples, and typically found in low percentages (often less than 1%). Examination of archaeal families in relation to sampling source reveals a number of associations (Supplementary Figure S4). For example, both the Methanosaetaceae and Methanoregulaceae associate closely with the closed lagoon samples, while the Methanospirillaceae, Methanocorpusculaceae, and Methanopyraceae closely associate with the open lagoons and houses. The Methanobacteriaceae, on average the most identified archaeal family across all samples (Mean: 34.5%; SE: ± 6.0%), associate most closely with the closed house samples.
Of all the archaeal families identified, a majority of the OTUs corresponded to three, Methanospirillaceae, Methanobacteriaceae, and Methanosaetaceae, with the first two classified as being hydrogenotrophic methanogens, and the third classified as acetoclastic methanogens. Overall, our results demonstrate that while hydrogenotrophic methanogens make up the largest segment of methanogens in the two systems studied, acetoclastic methanogens also make up a sizeable portion of the overall methanogenic community. Seasonally, methylotrophic methanogenic OTUs were highest in the spring, acetoclastic methanogenic OTUs were highest in the summer and fall, and hydrogenotrophic methanogenic OTUs peaked in the winter (Figure 7). These OTUs point to both the open and covered lagoons as having significant potential for methane production—a process likely supported by the anaerobic conditions of the lagoons and houses, as indicated by low DO measurements (Table 1).

4. Conclusions

While synthetic covers provide an option for swine producers to reduce odor emissions from anaerobic lagoons, there have been few studies focused on analyzing the biological responses to the microclimates generated at the cover/lagoon interface. Several wastewater physicochemical characteristics demonstrated seasonal variation, while additional differences were seen in comparisons by sampling site (lagoon vs. house) and by the type of lagoon system employed (open vs. covered). Fecal coliforms, E. coli, and Enterococcus sp., all demonstrated significant relationships with pH. When looking at fecal coliforms and E. coli, significant differences in CFU were identified seasonally, by sampling site, and type of lagoon system. Enterococcus sp. were unaffected by the lagoon system employed.
Microbial community analysis identified over 200 bacterial families, with 10.4% represented in all 16 samples, and an additional 19 archaeal families were identified, with eight represented by OTUs in all 16 samples. Evidence for the potential for sulfate-reduction, acetoclastic, hydrogenotrophic, and methylotrophic methanogenesis in the lagoons was demonstrated by the identification of microbial populations responsible for those processes across all lagoon samples. The in-depth sequence analysis of methanogenic communities indicates the potential for—or presence of—methane production from these anaerobic lagoons, although inhibitory concentrations of several nutrients such as Ca and K, need to be accounted for if lagoons are converted for biogas capture with impermeable covers.

Supplementary Materials

The following are available online at https://www.mdpi.com/2076-3298/6/8/91/s1, Figure S4: NMS ordination plot, as seen in Figure 4, demonstrating lagoon and house community structure in relation to individual archaeal family relative abundances, Table S1: Fisher pairwise comparisons of lagoon and house pathogen levels (CFU/gVSS log10), Table S2: Relative abundances of OTUs identified using universal bacterial primer set, presented as relative abundances (%) Only bacterial families are counted in Figure 5 and discussion involving bacterial family identification, Table S3: Relative abundances of OTUs identified using archael primer set, presented as relative abundances (%).

Author Contributions

Individual contributions were as follows: conceptualization and methodology, T.F.D.; investigation, T.F.D. and D.M.C.R.; formal analysis, T.F.D. and A.A.S.; writing—original draft preparation, TFD.; writing—review and editing, T.F.D., D.M.C.R., A.A.S.

Funding

This work was supported under USDA-ARS National Program 212.

Acknowledgments

The authors would like to thank Hannah Rushmiller and Paul Shumaker for their technical expertise. The mention of firm names or trade products does not imply that they are endorsed or recommended by the U.S. Department of Agriculture over other firms or similar products not mentioned.

Conflicts of Interest

The authors declare no conflict of interest.

References

  1. Bicudo, J.R.; Goyal, S.M. Pathogens and manure management systems: A review. Environ. Technol. 2003, 24, 115–130. [Google Scholar] [CrossRef] [PubMed]
  2. USEPA. Wastewater Technology Fact Sheet: Anaerobic Lagoons; USEPA: Washington, DC, USA, 2002. [Google Scholar]
  3. USDA-NRCS. Conservation Practice Standard: Waste Treatment Lagoon (Code 359); USDA-NRCS: Washington, DC, USA, 2017. [Google Scholar]
  4. VanderZaag, A.; Gordon, R.; Jamieson, R.; Burton, D.; Stratton, G. Permeable synthetic covers for controlling emissions from liquid dairy manure. Appl. Eng. Agric. 2010, 26, 287–297. [Google Scholar] [CrossRef]
  5. Zahn, J.A.; Tung, A.E.; Roberts, B.A.; Hatfield, J.L. Abatement of ammonia and hydrogen sulfide emissions from a swine lagoon using a polymer biocover. J. Air Waste Manag. 2011, 51, 562–573. [Google Scholar] [CrossRef]
  6. Miner, J.; Humenik, F.; Rice, J.; Rashash, D.; Williams, C.; Robarge, W.; Harris, D.; Sheffield, R. Evaluation of a permeable, 5 cm thick, polyethylene foam lagoon cover. Trans. ASAE 2003, 46, 1421. [Google Scholar] [CrossRef]
  7. Miller, D.N.; Baumgartner, J.W. Nitrification and denitrification potential associated with semi-permeable swine waste lagoon covers. In Proceedings of the International Symposium on Air Quality and Waste Management for Agriculture, Broomfield, Colorado, 16–19 September 2007; American Society of Agricultural and Biological Engineers: St Joseph, MI, USA, 2007; p. 14. [Google Scholar]
  8. McLaughlin, M.R.; Brooks, J.P.; Adeli, A. Temporal flux and spatial dynamics of nutrients, fecal indicators, and zoonotic pathogens in anaerobic swine manure lagoon water. Water Res. 2012, 46, 4949–4960. [Google Scholar] [CrossRef] [PubMed] [Green Version]
  9. Ducey, T.F.; Shriner, A.D.; Hunt, P.G. Nitrification and denitrification gene abundances in swine wastewater anaerobic lagoons. J. Environ. Qual. 2011, 40, 610–619. [Google Scholar] [CrossRef] [PubMed]
  10. Blunden, J.; Aneja, V.P. Characterizing ammonia and hydrogen sulfide emissions from a swine waste treatment lagoon in North Carolina. Atmos. Environ. 2008, 42, 3277–3290. [Google Scholar] [CrossRef]
  11. APHA. Standard Methods for the Examination of Water and Wastewater, 20th ed.; APHA: Washington, DC, USA, 1998. [Google Scholar]
  12. ASTM. D4327-11, Test Method for Anions in Water by Chemically Suppressed Ion Chromatography; ASTM International: West Conshohocken, PA, USA, 2011. [Google Scholar]
  13. ASTM. D6919-09, Test Method for Determination of Dissolved Alkali and Alkaline Earth Cations and Ammonium in Water and Wastewater by Ion Chromatography; ASTM International: West Conshohocken, PA, USA, 2009. [Google Scholar]
  14. Caporaso, J.G.; Lauber, C.L.; Walters, W.A.; Berg-Lyons, D.; Lozupone, C.A.; Turnbaugh, P.J.; Fierer, N.; Knight, R. Global patterns of 16S rRNA diversity at a depth of millions of sequences per sample. Proc. Natl. Acad. Sci. USA 2010, 108, 4516–4522. [Google Scholar] [CrossRef] [Green Version]
  15. McDonald, D.; Price, M.N.; Goodrich, J.; Nawrocki, E.P.; DeSantis, T.Z.; Probst, A.; Andersen, G.L.; Knight, R.; Hugenholtz, P. An improved greengenes taxonomy with explicit ranks for ecological and evolutionary analyses of bacteria and archaea. ISME J. 2011, 6, 610–618. [Google Scholar] [CrossRef]
  16. Viancelli, A.; Kunz, A.; Steinmetz, R.L.; Kich, J.D.; Souza, C.K.; Canal, C.W.; Coldebella, A.; Esteves, P.A.; Barardi, C.R. Performance of two swine manure treatment systems on chemical composition and on the reduction of pathogens. Chemosphere 2013, 90, 1539–1544. [Google Scholar] [CrossRef]
  17. Curtis, T.P.; Mara, D.D.; Silva, S.A. Influence of pH, oxygen, and humic substances on ability of sunlight to damage fecal coliforms in waste stabilization pond water. Appl. Environ. Microbiol. 1992, 58, 1335–1343. [Google Scholar] [PubMed]
  18. Curtis, T. Bacterial removal in wastewater treatment plants. In Handbook of Water and Wastewater Microbiology; Mara, D., Horan, N., Eds.; Academic Press: Cambridge, MA, USA, 2003; pp. 477–490. [Google Scholar]
  19. Fangueiro, D.; Hjorth, M.; Gioelli, F. Acidification of animal slurry—A review. J. Environ. Manag. 2015, 149, 46–56. [Google Scholar] [CrossRef] [PubMed]
  20. Odey, E.A.; Li, Z.; Zhou, X.; Yan, Y. Optimization of lactic acid fermentation for pathogen inactivation in fecal sludge. Ecotoxicol. Environ. Saf. 2018, 157, 249–254. [Google Scholar] [CrossRef] [PubMed]
  21. Bailey, J.K.; Pinyon, J.L.; Anantham, S.; Hall, R.M. Commensal Escherichia coli of healthy humans: A reservoir for antibiotic-resistance determinants. J. Med. Microbiol. 2010, 59, 1331–1339. [Google Scholar] [CrossRef] [PubMed]
  22. Ducey, T.F.; Hunt, P.G. Microbial community analysis of swine wastewater anaerobic lagoons by next-generation DNA sequencing. Anaerobe 2013, 21, 50–57. [Google Scholar] [CrossRef] [Green Version]
  23. Sharma, J.; Singh, R. Effect of nutrients supplementation on anaerobic sludge development and activity for treating distillery effluent. Bioresour. Technol. 2001, 79, 203–206. [Google Scholar] [CrossRef]
  24. Schnürer, A.; Zellner, G.; Svensson, B.H. Mesophilic syntrophic acetate oxidation during methane formation in biogas reactors. FEMS Microbiol. Ecol. 1999, 29, 249–261. [Google Scholar] [CrossRef]
  25. Whitehead, T.R.; Cotta, M.A. Characterisation and comparison of microbial populations in swine faeces and manure storage pits by 16S rDNA gene sequence analyses. Anaerobe 2001, 7, 181–187. [Google Scholar] [CrossRef]
  26. Imhoff, J.F. The Chromatiaceae; Springer: New York, NY, USA, 2006; pp. 846–873. [Google Scholar]
  27. Sletten, O.; Singer, R.H. Sulfur bacteria in red lagoons. J. Water Pollut. Control Fed. 1971, 43, 2118–2122. [Google Scholar]
  28. Ghosh, W.; Dam, B. Biochemistry and molecular biology of lithotrophic sulfur oxidation by taxonomically and ecologically diverse bacteria and archaea. FEMS Microbiol. Rev. 2009, 33, 999–1043. [Google Scholar] [CrossRef] [Green Version]
  29. Kuever, J.; Galushko, A. The Family Desulfomicrobiaceae; Springer: Berlin/Heidelberg, Germany, 2014; pp. 97–102. [Google Scholar]
  30. Belila, A.; Abbas, B.; Fazaa, I.; Saidi, N.; Snoussi, M.; Hassen, A.; Muyzer, G. Sulfur bacteria in wastewater stabilization ponds periodically affected by the ‘red-water’ phenomenon. Appl. Microbiol. Biotechnol. 2012, 97, 379–394. [Google Scholar] [CrossRef] [PubMed]
  31. Yang, S.; Phan, H.V.; Bustamante, H.; Guo, W.; Ngo, H.H.; Nghiem, L.D. Effects of shearing on biogas production and microbial community structure during anaerobic digestion with recuperative thickening. Bioresour. Technol. 2017, 234, 439–447. [Google Scholar] [CrossRef] [PubMed]
  32. Smithfield Foods Announces Landmark Investment to Reduce Greenhouse Gas Emissions. Available online: https://www.smithfieldfoods.com/press-room/company-news/smithfield-foods-announces-landmark-investment-to-reduce-greenhouse-gas-emissions (accessed on 14 June 2019).
Figure 1. Comparison of colony-forming units (CFU)/gVSS log10 values between animal houses and lagoons, for fecal coliforms (blue), Escherichia coli (green), and Enterococcus sp. (red). Means followed by the same letter are not significantly different at p = 0.05.
Environments 06 00091 g001
Figure 2. Comparison of CFU/gVSS log10 values between the covered and open lagoon, for fecal coliforms (blue), Escherichia coli (green), and Enterococcus sp. (red). Means followed by the same letter are not significantly different at p = 0.05.
Environments 06 00091 g002
Figure 3. Non-metric multidimensional scaling (NMS) plot of microbial communities (based on relative abundances of bacterial families identified). Only explanatory environmental variables with a combined r2 > 0.45 for both axes are included as vectors. Centroid for each group is marked by (+). O = open; C = cover; L = lagoon; H = house.
Environments 06 00091 g003
Figure 4. Non-metric multidimensional scaling (NMS) plot of archaeal communities (based on relative abundances of archaeal families identified). Only explanatory environmental variables with a combined r2 > 0.45 for both axes are included as vectors. Centroid for each group is marked by (+). O = open; C = cover; L = lagoon; H = house.
Environments 06 00091 g004
Figure 5. Bacterial community structure, shown as relative abundance. The legend listing selected bacterial families is displayed to the right of the chart. Samples are distinguished by columns. Sp = spring; Su = summer; F = fall; W = winter; O = open; C = cover; L = lagoon; H = house.
Environments 06 00091 g005
Figure 6. Archaeal community structure, shown as relative abundance. The legend listing specific families is displayed to the right of the chart. Samples are distinguished by columns. Sp = spring; Su = summer; F = fall; W = winter; O = open; C = cover; L = lagoon; H = house.
Environments 06 00091 g006
Figure 7. Relative abundance of classified operational taxonomic units (OTUs) potentially involved in methanogenic pathways. (A) Open Lagoon; (B) Open House; (C) Covered Lagoon; (D) Covered House.
Environments 06 00091 g007
Table 1. Fisher pairwise comparisons of lagoon and house physicochemical characteristics.
SeasonSystemSitepHDOTempTotal Suspended SoilsVolatile Suspended SolidsTotal Kjeldahl Nitrogen
mg L−1°C mg L−1
SpringOpenLagoon8.11 a10.60 bcde20.5 i189 e166 d630 gh
House7.24 d0.96 a21.5 h3200 e3125 d1741 e
CoverLagoon6.92 h0.66 bcd20.6 i293 e289 d906 fg
House7.33 def0.86 ab26.1 c6275 de5975 cd2445 d
SummerOpenLagoon7.86 b0.92 a27.3 b149 e124 d276 i
House7.24 efg0.25 gh28.3 a15,600 d13,900 c1850 e
CoverLagoon7.16 fg0.53 def27.0 b410 e285 d985 f
House6.67 i0.23 h27.5 b100,100 a89,600 a4823 a
FallOpenLagoon7.72 bc0.40 efgh20.9 i276 e237 d399 hi
House7.35 def0.33 fgh22.2 k325 e265 d546 hi
CoverLagoon7.28 efg0.35 fgh21.9 gh483 e410 d1110 f
House7.04 gh0.40 defgh24.1 e51,400 b44,850 b3848 b
WinterOpenLagoon7.76 bc0.55 cdef23.3 f467 e413 d588 ghi
House7.36 def0.81 abc25.6 d1927 e1755 d1088 f
CoverLagoon7.41 de0.53 def19.1 j427 e373 d1033 f
House7.13 fgh0.53 cdefg25.5 d41,375 c37,250 b3410 c
1 Means followed by the same letter are not significantly different at p = 0.05.
Table 2. Fisher pairwise comparisons of lagoon and house anions and cations (mg L−1)1.
SeasonSystemSiteClNH4-NPO4-PSO4-SCaKMgNa
SpringOpenLagoon491.8 f2490.0 h18.7 efg41.3 c74.5 g720.1 fgh29.6 f254.4 e
House750.8 c1182.2 c33.3 cdef8.4 d123.6 bcd983.8 c34.9 cdef389.8 b
CoverLagoon444.6 g842.4 de94.0 b5.4 d113.7 cd658.5 ghi57.2 cd214.9 f
House918.3 a1420.0 b47.5 cd63.8 b82.3 efg1363.9 b43.7 cdef431.2 a
SummerOpenLagoon407.5 h204.1 j7.9 g40.0 c48.4 h598.4 i35.9 def195.4 f
House543.0 e639.8 g10.5 fg9.3 d74.4 g831.1 de51.6 cdef259.9 e
CoverLagoon440.7 gh807.7 ef8.4 g6.5 d26.1 i644.1 hi33.8 ef206.4 f
House665.8 d754.2 f25.5 cdefg2.9 d191.3 a1038.9 c60.2 cd345.1 c
FallOpenLagoon423.6 gh312.5 i16.5 fg39.0 c65.2 gh666.3 ghi46.9 cdef203.6 f
House489.7 f426.3 h21.5 defg32.7 c85.9 efg758.6 ef52.9 cdef239.0 e
CoverLagoon430.0 gh885.1 d39.5 cde4.0 d103.0 de708.8 fgh55.9 cde198.0 f
House828.3 b1580.4 a100.8 b118.6 a198.6 a1562.5 a104.2 b424.9 a
WinterOpenLagoon424.8 gh509.2 h17.8 efg2.8 d77.8 fg690.4 fgh44.6 cdef200.3 f
House579.7 e886.2 de46.3 cdBDL3101.4 def883.7 d62.2 c293.4 d
CoverLagoon433.3 gh898.0 de46.7 cd2.2 d134.8 bc736.9 fg54.8 cde203.9 f
House777.2 c1512.3 ab217.9 a46.5 c140.9 b1627.7 a290.5 a422.7 a
1 F, NO2-N, and NO3-N were below detectable limits (<2 mg/L); 2 Means followed by the same letter are not significantly different at p = 0.05; 3 BDL, below detectable limits (<2 mg/L).

