Abstract
Air, water, soil, and light are important factors in the environment. Light is the only elementary part of life that has become an almost irreplaceable part of life. Because man is more connected with the interior, the task is to ensure that natural daylight in the interior is as high as possible. Industrial lighting is currently at a level that in many cases does not meet the requirements of legislation and standards. Optimal environmental conditions depend on the purpose for which the environment is intended. Since toplighting is largely involved in the overall lighting climate, the purpose of this paper is to evaluate the visual comfort in a selected industrial hall with two types of glazing at the saddle skylight. In the study, measured values in the hall were used as boundary conditions in the simulation program Radiance The program evaluated the visual comfort for two types of sky by the Guth VCP method. The results show that the use of diffuse glazing instead of simple wire glazing reduces the brightness and glare levels, but that people’s satisfaction with visual comfort is greater with wire glazing. Furthermore, the model of the hall can be used to calculate light conditions for other types of arches as well as to compare other types of skylights. An alternative to diffusing glazing could also be verified for side windows.
1. Introduction
Visually, a person gets 75–90% of his or her information from the environment. The psychological state in which the entire visual system performs its function optimally is called visual comfort. Good lighting is a significant factor [1,2]. Visual comfort is a subjective reaction to the quantity and quality of light within any given space at a given time. The concept of visual comfort depends on our ability to control the light levels around us. Both too little and too much light can cause visual discomfort. Many authors deal with visual comfort [3,4].
Visual comfort is defined as a “subjective condition of visual well-being induced by the visual environment” [5]. Few review studies are available on visual comfort indices in the literature.
Increasing demands for quality, efficiency, and the amount of work to be done, alongside with an increasingly larger number of areas of potential improvement identified for the work environment, result in increased demands on the levels of workplane illumination, with corresponding increases in the scope and time of use of lighted areas [6,7].
Daylight lighting in industry settings is an important means for people to influence the environment. In particular, energy consumption, environmentally friendly products, and longer life span are at the forefront of concerns and considerations. Thus, economical lighting does not mean lowering the lighting level, but on the contrary, achieving the necessary level and quality in the most cost-effective way, with the lowest investment and operating costs, and the least energy consumption of all kinds [8]. All these factors are very closely related to the environment, especially in regard to pollution and other negative impacts. Artificial lighting is the cause of so-called “light pollution” (light smog), which represents light with undesirable effects. Nowadays, people are typically spending more and more time in indoor environments, losing direct contact with outdoor sunlight. The importance of daylight lies in its connection to our health, performance, and well-being [9,10].
The non-visual perception of light synchronizes the internal clock of an organism with its external environment, with the rhythm of the Earth’s cycling from day to night. Today, according to statistics, people spend up to 90% of their time inside buildings. To create a healthy lighting environment, it is important to ensure great light dynamics. During the day, lighting with a high light intensity and a blue component is suitable [11,12,13].
The primary goal in designing a lighting system is to provide the desired level of illumination for visual activity, using a system that enhances visual comfort in a working environment. Factors that can help improve visual comfort in a working environment include avoiding excessively clear surfaces inside the user’s field of view and avoiding reflections from bright surfaces on work surfaces [14].
If a skylight is directly in one’s field of vision, it can cause visual discomfort by requiring the eye to attempt to simultaneously adjust to the extremely bright skylight surface and the less clear surface of the space. The height of the ceiling relative to the size of the space affects whether a skylight causes glare. If the space is very low or bulky, it is more likely that a skylight will be inside one’s field of view. The higher the ceiling, the less likely this will be [14].
The current European technical standard for interior workroom lighting STN EN 12464-1 supports complex solutions [15,16]. The priority is to create optimal conditions for visual performance in a specific working environment so that visual comfort is maximized. In the work environment where the visual task is performed, the brightness of the surfaces located there is important. It is determined on the basis of reflectivity and surface illumination. Too high brightness contrasts your eyesight. High reflectivity floors have an adverse effect on brightness distribution [17]. The current visual comfort system is mostly focused on office buildings. However, there is limited knowledge about daylight quality and visual well-being in industrial work environments [17,18,19]. Industrial lighting is currently at a level that in many cases does not meet the requirements of legislation and standards. Slovakia has historically had a high energy-intensive industry structure, and its industry structure is dominated by the engineering industry [17,18,19].
Various factors that depend on the quality of the workplace lighting play an important role in assessing the appropriate working conditions (see Figure 1). It is essential that there is no glare.
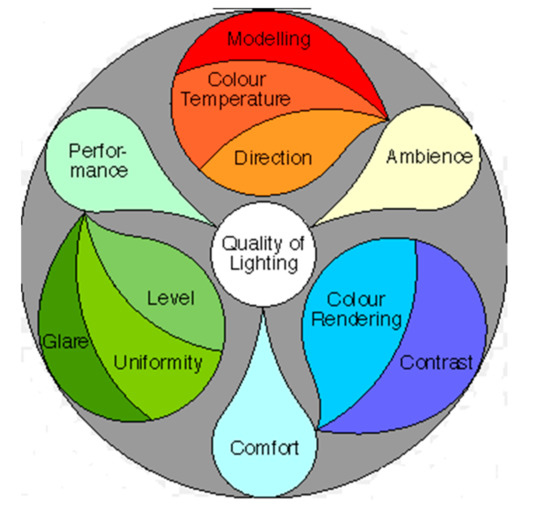
Figure 1.
Factors affecting proper lighting [15].
Lighting should be sufficient and even, without excessive brightness and contrast. The brightness distribution in the field of vision affects the level of vision adaptation, which affects the visibility of the workplace. Good brightness distribution allows for visual acuity and provides better resolving power even with small differences in brightness. The overall efficiency of vision functions is also increasing [20,21,22,23].
The design of interior and exterior lighting in the industry is based on certain requirements that arise primarily from the needs and purposes the lighting is supposed to meet. The lighting requirements are summarized in the applicable standards listed in the bibliography [24,25]. According to Ward [26] and Iringova [27], the suitability of having windows and having access to a view was important in the working environment. Adaptation can cause daylight responses that are uneven.
In the Slovak Republic, the energy intensity of industry is relatively high compared to other countries. According to the processed data, the share of final energy consumption of the industry to the total final energy consumption of the country is about 1.5 times higher than the EU average. The share of electricity consumption for lighting in industry in the Slovak Republic is about 10% [27].
Recently, more articles have appeared in scientific journals dealing with similar issues [28,29,30,31,32]. Given the complexity of the problem and the possibility of considering subjective factors, considering the marginal conditions of the calculation, the results differ, but the results are similar. It is necessary to consider that at least the reference model is verified under declared conditions in the real interior.
2. Materials and Methods
Measurement of daylighting was carried out in a single-story hall in Kosice, Slovakia. The hall is designed for work related to metal working and forming, the production of semi-finished products from sheet metal and the like. The interior dimensions of the hall are 15 m × 60 m × 8.5 m.
Production machines, tables, and cabinets are deployed throughout the hall (Figure 2). The hall is oriented longitudinally in the east–west direction. A crane track beam is located on the pillar brackets. Figure 3 shows the view of the skylight from the outside and as a result of daylight simulation with Radiance simulation program.
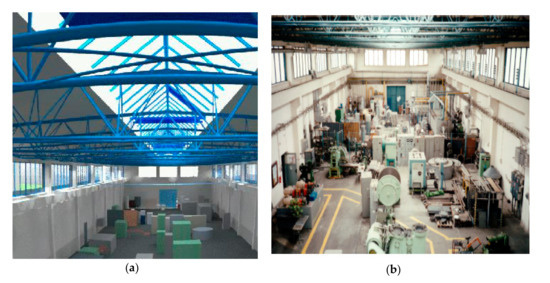
Figure 2.
Internal view of the building: (a) model of the hall; (b) view of the hall.
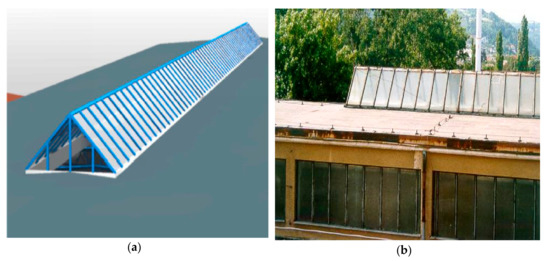
Figure 3.
External view of the building: (a) model of the skylight; (b) view of the skylight.
A combined lighting system is located in the lobby. The sidelighting system consists of 5.6 m × 1.8 m windows on the north and south perimeter walls, and 3 m × 1.8 m windows on the east and west perimeter walls. The toplighting system is a saddle-type skylight with a steel frame and a steel flange of 2.4 m × 48 m × 1.1 m. The glazing of the side windows and the skylight is made of a single wire-glass (see Figure 2b). The hall is designed for moderate work, where work of a wider kind is carried out and is therefore included in III–IV light class.
Daylighting simulation was implemented by the Radiance simulation program. In order to create a model for calculation, experimental measurements of daylighting were performed in the selected production hall. Simulation calculations of daylight and luminance ratios were performed for the given hall model. The luminance of individual surfaces was measured in the hall. From the measured luminance values of the individual surfaces and the known reflection factor of the calibration sample, we calculated the resulting reflection factor of the measured surfaces. Subsequently, the calculated values were used as input data when assigning the properties of the materials’ surfaces in the hall. The brightness values were applied to the selected glare calculation procedure.
Measurement of daylighting was carried out according to STN 36 0020 [22]. The instruments were two data loggers, ALMEMO 2690-10A and Illuminance Sensor ALMEMO FLA 623VL (AHLBORN GmbH, Prague, Czech Republic). The instrument used for measurements was the Luminance meter LS-110 (Konica Minolta, USA), which has an accuracy of 2%.
Daylight measurements were performed on three different days in December. Control points were from the floor at 850 mm. Measurements were performed at 60 control points (see Figure 4). The measured sky conditions rating gradations of sky luminance in the three considered days in December.
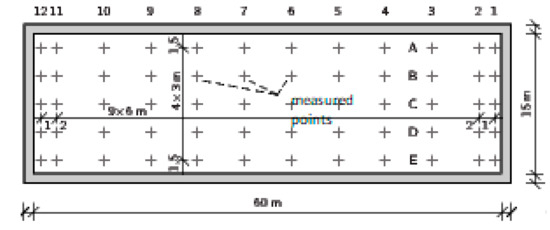
Figure 4.
The floorplan of the hall.
On selected days, the value of the external horizontal illumination at a uniformly cloudy sky ranged from 4500 lx to 8500 lx as measured by the sky brightness in all directions. Only clear sky conditions are simulated in Radiance. Considered factors in the calculation included the following: light transmittance factor of glazing of 0.8; glazing factor of the glazing on the external surface of 0.9, dirt factor of glazing on the inner surface of 0.85, and terrain reflection factor of 0.15 (dark terrain). The wall surface is creamy with a reflection factor ρ = 0.4, a white ceiling with a reflection factor of ρ = 0.7. The floor consists of a cementitious screed of dark gray with a reflection factor of ρ = 0.2. Adjacent objects are located at distances that do not affect the hall.
Methods of measurement in the hall were used and these measured values were used as boundary conditions in the simulation of the Radiance program [26]. The brightness values were then used to calculate the glare. Based on measurements in the hall, a model hall for calculations was created. There were models of a hall with a skylight with two types of glazing and two types of sky.
Simultaneous alternatives were followed by simulation calculations of the ratios. For the evaluation of visual comfort, the original wire glazing and the diffuse glazing-diffusion normal permeability of 0.5 were considered for the toplighting. A simple wire glass was considered for the side windows. The glare evaluation was performed by the Guth Visual Comfort Probability (Guth VCP) detailed glare index. This method expresses how many percent of people would feel comfortable in a given situation. An acceptable value is usually considered to be 70% [26].
3. Results
It is necessary to eliminate the high brightness values of the open structures and surfaces in the interior of the hall. It is therefore necessary to verify the brightness distribution in these areas to ensure optimum visual comfort when working with the machines.
The following pictures show the results of the luminance distribution simulation for the indoor environment of the skylight hall with two types of glazing for two types of sky. Simulation calculations were made for different views in the interior (two views were selected in the study). In the figures, some brightness point values (cd.m−2) are then displayed.
The resulting luminance values can be evaluated, for example, according to the criteria of maximum allowed luminance in the field of view of the observer between the observed object and the background, distant dark and light objects, the value of the glare factor and the ratio of the brightness of the observed object to the sky. It should be noted that the brightness of the lighting aperture itself should not exceed the standard value [13,23].
When using the model to assess the visual comfort in a combined lighting system with simple wire glazing and cloudy skies, it can be stated that visual comfort is not impaired. At the same time, however, glare occurs (Figure 5). By using diffuse glazing for only the top lighting, the brightness of the vents and individual surfaces is reduced (Figure 6). Still, glare occurs. The Figure 7 shows the glare sources for both types of glazing for overcast sky. The values are much larger from the skylight to the windows.
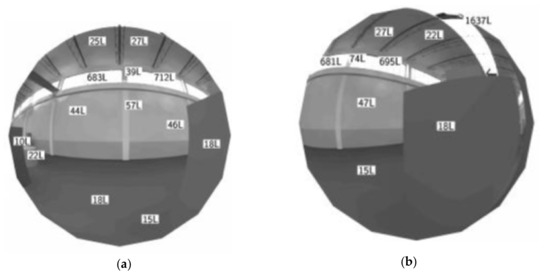
Figure 5.
Result of simulated point values of brightness (luminance value cd.m−2) at the workplace using wire skylight glazing: (a) overcast sky, north view; (b) overcast sky, northeast view.
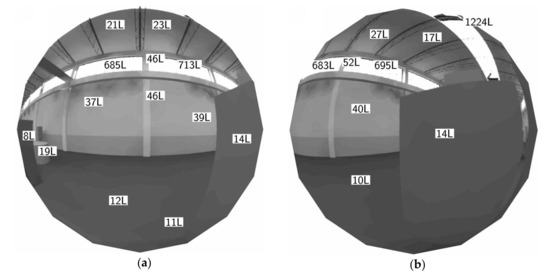
Figure 6.
Result of simulated point values of brightness (luminance value cd.m−2) at the workplace using diffuse skylight glazing: (a) overcast sky, north view; (b) overcast sky, northeast view.
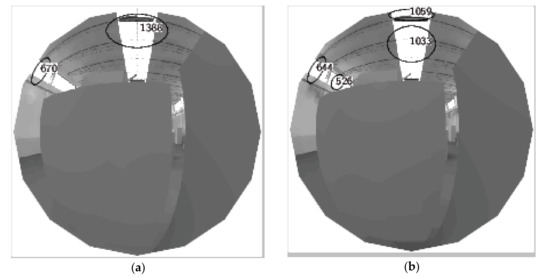
Figure 7.
Result of simulated glare sources at the workplace for overcast sky conditions: (a) wire skylight glazing; (b) diffuse skylight glazing.
Under a clear sky, visual comfort is disturbed (Figure 8), and there is also glare. In the case of diffuse glazing, despite the lower luminance values, glare occurs (Figure 9). Figure 10 shows the glare sources for both types of glazing for overcast sky conditions.
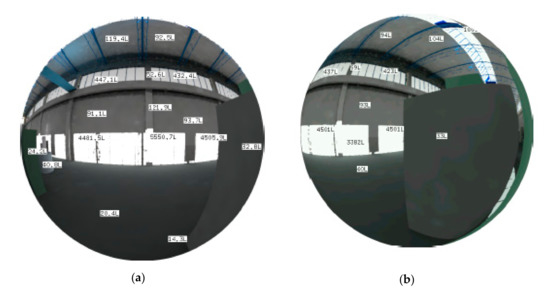
Figure 8.
Result of simulated point values of brightness (luminance value cd.m−2) at the workplace using wire skylight glazing: (a) sunny sky, north view; (b) sunny sky, northeast view.
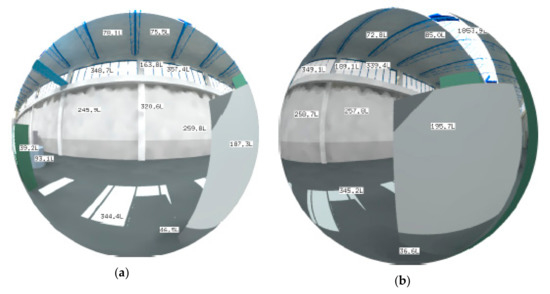
Figure 9.
Result of simulated point values of brightness (luminance value cd.m−2) at the workplace using diffuse skylight glazing: (a) sunny sky, north view; (b) sunny sky, northeast view.
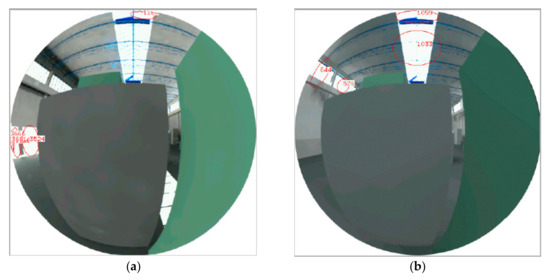
Figure 10.
Result of simulated glare sources at the workplace for sunny sky conditions: (a) wire skylight glazing; (b) diffuse skylight glazing.
From the graphs (Figure 11) that were constructed based on calculated glare indices in the individual directions, it was possible to express the theoretical percentage of satisfied people in terms of overall visual comfort. Values may vary depending on the direction of view. The graphs show that with simple wire glazing (Figure 11a), on average, 95% of people would feel comfortable with the direction of view. Using diffuse glazing, human satisfaction would be less (93%) for the same direction of view (Figure 11b).
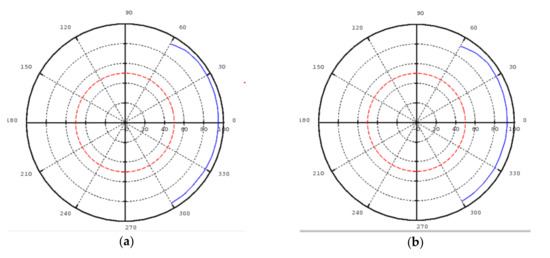
Figure 11.
Result of Guth VCP simulation for overcast sky conditions: (a) wire skylight glazing; (b) diffuse skylight glazing.
The values are much larger from the skylight to the windows. From the graph (Figure 12), it can be seen that, with a clear sky and wire glazing, on average, from 15% to 90% of people would feel comfortable with the direction of view (Figure 12a). Using diffuse glazing, human satisfaction would be much greater, from 60% to 98% for the same direction of view (Figure 12b). For both types of glazing, shielding devices are recommended.
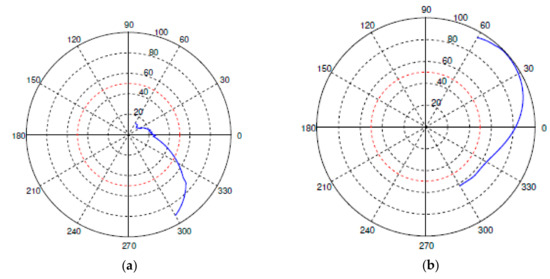
Figure 12.
Result of Guth VCP simulation for sunny sky conditions: (a) wire skylight glazing; (b) diffuse skylight glazing.
4. Conclusions
Securing daylight in industrial halls reduces the energy input needed for artificial lighting. According to the standard STN 73 0580-1, daylighting must be designed so that users of internal spaces are protected against glare. To create visual comfort conditions, the maximum average brightness ratios in the field of view of the observer should be observed. Visual disturbance is already disturbed at a ratio of 1:10 brightness, and glare occurs at a ratio of 1:100 [12,23].
According to the results of the model, glare was observed on both types of glazing and under both types of sky conditions. By using diffuse glazing, however, the brightness values were smaller. However, the diffuse glazing was considered in the alternative only for the skylight and not for the side windows and therefore it would be appropriate to consider the visual comfort for this alternative in the future.
The purpose of this article was to evaluate visual comfort through the Guth VCP glare index as one of the methods used by the Radiance simulation program. Calculation of indirect illumination in several directions is relatively simple, so it is possible to calculate the value of glare in individual directions. This shows how visual comfort is influenced by the direction of view.
An alternative to diffusing glazing could also be verified for side windows. As demonstrated in this study, computer simulations can be effectively used to identify problem areas and propose optimal solutions.
Author Contributions
Investigation: E.D.; data analysis: E.D. and D.K.; writing of the final version of the study: E.D.
Funding
This research was funded VEGA 1/0674/18 of Scientific Grant Agency, the Ministry of Education, Science, Research, and Sport of the Slovak Republic and the Slovak Academy of Sciences.
Acknowledgments
This study was conducted with the financial support of the research project VEGA 1/0674/18 of Scientific Grant Agency, the Ministry of Education, Science, Research, and Sport of the Slovak Republic and the Slovak Academy of Sciences.
Conflicts of Interest
The authors declare no conflict of interest.
References
- Boyce, P.R. Lighting research for Interiors: The Beginning of the End or the End of Beginning. Light. Res. Technol. 2004, 36, 283–294. [Google Scholar] [CrossRef]
- Liberman, J. Světlo—Lék Budoucnosti; Blue Step: Prague, Czech Republic, 2006; 228p, ISBN 80-239-6719-3. [Google Scholar]
- Lombera, J.T.; Rojo, J.C. Industrial building design stage based on a system approach to their environmental sustainability. Constr. Build. Mater. 2010, 24, 438–447. [Google Scholar] [CrossRef]
- Lombera, J.-T.S.-J.; Aprea, I.G. A system approach to the environmental analysis of industrial buildings. Build. Env. 2010, 45, 673–683. [Google Scholar] [CrossRef]
- Standards EN 12465-2011. Light and Lighting; Basic Terms and Criteria for Specifying Lighting Requirements; European Committee for Standardization: Brussels, Belgium, 2011. [Google Scholar]
- Boyce, P. Human Factors in Lighting; CRC Press: New York, NY, USA, 2014. [Google Scholar]
- Dolníková, E.; Katunský, D. Hodnotenie Svetelnej Pohody Pri Kombinovanom Osvetľovacom Systéme V Priemyselných Halách; TUKE Košice: Košice, Slovakia, 2017; 151p, ISBN 978-80-553-2809-6. [Google Scholar]
- Kalousek, M.; Mohelníková, J. Influence of Window on Solar Gains and Daylight Level. Adv. Mater. Res. 2014, 1041, 175–179. [Google Scholar] [CrossRef]
- Acosta, I.; Leon, J.; Bustamante, P. Daylight spectrum Index: A new metric to assess the affinity of light sources with daylighting. Energies 2018, 11, 2545. [Google Scholar] [CrossRef]
- Kontadakis, A.; Tsangrassoulis, A.; Doulos, L.; Topalis, F. An active sunlight redirection system for daylight enhancement beyond the perimeter zone. Build. Env. 2017, 113, 267–279. [Google Scholar] [CrossRef]
- Wirz, J.A.; Fournier, C. Light health and wellbeing: Implications from chronobiology for architectural design. World Health Design 2010, 3, 44–49. Available online: www.worldhealthdesign.com.
- Standards EN 12464-1:2012. Light and Lighting; Lighting of Work Places-Part. 1: Indoor Work Places; Slovak Republic Office of Standards, Metrology and Testing: Bratislava, Slovakia, 2012. [Google Scholar]
- Draft Standards CEN/TC/ 169/WG 11, 07/2017; prEN 17037. Daylight in Buildings (TC169WI00169068); European Committe for Standardization: Brussels, Belgium, 2017. [Google Scholar]
- Tabadkani, A.; Banihashemi, S.; Hosseini, M.R. Daylighting and visual comfort of oriental sun responsive skins: A parametric analysis. Build. Simul. 2018, 11, 663–676. [Google Scholar] [CrossRef]
- Osvetlenie v Priemysle. Available online: www.siea.sk.
- Ferencikova, M.; Darula, S. Availability of daylighting in school operating time. Light Eng. 2017, 25, 71–78. [Google Scholar]
- Katunsky, D.; Dolnikova, E.; Dolnik, B. Daytime Lighting Assessment in Textile Factory Using Connected Windows in Slovakia; Case Study. Sustainability 2018, 10, 655. [Google Scholar] [CrossRef]
- Bellia, L.; Fragliasso, F.; Stefanizzi, E. Why are daylight-linked controls (DLCs) not so spread? A literature review. Build. Env. 2016, 106, 301–312. [Google Scholar] [CrossRef]
- Tregenza, P.; Wilson, M. Daylighting Architecture and Lighting Design; Routledge: New York, NY, USA, 2011. [Google Scholar]
- Mardaljevič, J.; Christoffersen, J. Climate connectivity in the daylight factor basis of building standards. Build. Env. 2017, 113, 200–209. [Google Scholar] [CrossRef]
- Reinhart, C. Daylighting Handbook I; Massachusetts Institute of Technology (MIT): Cambridge, MA, USA, 2014. [Google Scholar]
- Standards ČSN 360020. Integral Lighting; CZ Office of Standards, Metrology and Testing Prague: Prague, Czech Republic, 2015. [Google Scholar]
- Standards STN 730580. Daylighting in Buildings, Part–1 Basic Requirements, 1986 Part–2; Daylighting of Residential Buildings; Slovak Republic Office of Standards, Metrology and Testing: Bratislava, Slovakia, 2000. [Google Scholar]
- Pham, K.; Hansen, V.G.; Isoardi, G. Approisal of the Visual Environment in an Industrial Factory: A Case Study in Subtropical Climates. Solitary 2016, 3, 12–26. [Google Scholar] [CrossRef]
- International Energy Agency (IEA). Solar and Heating Cooling Program, Task 31—Daylighting Buildings in the 21st Century; IEA: Paris, France; Available online: http://task31.iea-shc.org/ (accessed on 2 May 2017).
- Ward, G. RADIANCE Tutorial; c1993, last revision 1999. Available online: http://radsite.lbl.gov/Radiance/refer/tutorial.html (accessed on 15 July 1993).
- Iringova, A. Design of a residential building in confined urban spaces in terms of daylighting optimization and insolation of flats—A case Study. Int. Rev. Appl. Sci. Eng. 2018, 9, 95–100. [Google Scholar] [CrossRef]
- Giovannini, L.; Goia, F.; Lo Verso, V.R.M.; Serra, V. A Comparative Analysis of the Visual Comfort Performance between a PCM Glazing and a Conventional Selective Double Glazed Unit. Sustainability 2018, 10, 3579. [Google Scholar] [CrossRef]
- Molina, F.Q.; Yaguana, D.B. Indoor Environmental Quality of Urban Residential Buildings in Cuenca—Ecuador: Comfort Standard. Buildings 2018, 8, 90. [Google Scholar] [CrossRef]
- Zhang, Y.; Zhong, Y.; Gong, Y.; Zheng, L. The Optimization of Visual Comfort and Energy Consumption Induced by Natural Light Based on PSO. Sustainability 2019, 11, 49. [Google Scholar] [CrossRef]
- Cheng, B.; Fu, Y.; Khoshbakht, M.; Duan, L.; Zhang, J.; Rashidian, S. Characteristics of Thermal Comfort Conditions in Cold Rural Areas of China: A Case study of Stone Dwellings in a Tibetan Village. Buildings 2018, 8, 49. [Google Scholar] [CrossRef]
- La Fleur, L.; Rohdin, P.; Moshfegh, B. Energy Use and Perceived Indoor Environment in a Swedish Multifamily Building before and after Major Renovation. Sustainability 2018, 10, 766. [Google Scholar] [CrossRef]
© 2019 by the authors. Licensee MDPI, Basel, Switzerland. This article is an open access article distributed under the terms and conditions of the Creative Commons Attribution (CC BY) license (http://creativecommons.org/licenses/by/4.0/).