Article

Carbon Footprint and Water Footprint of Electric Vehicles and Batteries Charging in View of Various Sources of Power Supply in the Czech Republic

by
Simona Jursova
1,*,
Dorota Burchart-Korol
2 and
Pavlina Pustejovska
1
1
ENET Centre, VSB—Technical University of Ostrava, 708 33 Ostrava, Czech Republic
2
Faculty of Transport, Silesian University of Technology, 40-019 Katowice, Poland
*
Author to whom correspondence should be addressed.
Environments 2019, 6(3), 38; https://doi.org/10.3390/environments6030038
Submission received: 21 January 2019 / Revised: 14 March 2019 / Accepted: 18 March 2019 / Published: 26 March 2019
(This article belongs to the Special Issue Advances in Environmental Engineering II)

Abstract

:
In the light of recent developments regarding electric vehicle market share, we assess the carbon footprint and water footprint of electric vehicles and provide a comparative analysis of energy use from the grid to charge electric vehicle batteries in the Czech Republic. The analysis builds on the electricity generation forecast for the Czech Republic for 2015–2050. The impact of different sources of electricity supply on carbon and water footprints were analyzed based on electricity generation by source for the period. Within the Life Cycle Assessment (LCA), the carbon footprint was calculated using the Intergovernmental Panel on Climate Change (IPCC) method, while the water footprint was determined by the Water Scarcity method. The computational LCA model was provided by the SimaPro v. 8.5 package with the Ecoinvent v. 3 database. The functional unit of study was running an electric vehicle over 100 km. The system boundary covered an electric vehicle life cycle from cradle to grave. For the analysis, we chose a vehicle powered by a lithium-ion battery with assumed consumption 19.9 kWh/100 km. The results show that electricity generated to charge electric vehicle batteries is the main determinant of carbon and water footprints related to electric vehicles in the Czech Republic. Another important factor is passenger car production. Nuclear power is the main determinant of the water footprint for the current and future electric vehicle charging, while, currently, lignite and hard coal are the main determinants of carbon footprint.

1. Introduction

The Czech Republic (CR) is located in Central Europe. The population is over 10 million. The CR is one of the most developed and industrialized economies in Central and Eastern Europe. With its long tradition, the automotive industry in the CR is an important sector of the national economy. Trademarks like Skoda (nowadays included in Volkswagen Group, AG, (Mlada Boleslav, Czech Republic), Tatra (nowadays called Tatra Truck, a.s., Koprivnice, Czech Republic), Karosa (nowadays Ivecobus included in CNH Industrial, Vysoke Myto, Czech Republic), and Avia (nowadays called Avia Motors, s.r.o., a part of Czechoslovak Holding, Prague, Czech Republic) are some examples. Moreover, international companies such as Hyundai, Toyota, and PSA Peugeot Citroën have their manufacturing subsidiaries there too.
Despite its small economy, the CR is a leader in vehicle production in the European Union (EU). According to the European Automobile Manufacturers Association (ACEA), Figure 1 shows the 10 biggest car producing countries in the EU. The CR remains the EU’s fifth largest producer of passenger cars, with 1,344,182 cars in 2016 and 1,413,881 cars in 2017.
The automotive industry in the CR has accelerated since 2006 when it reached the production of 821,323 cars (Figure 2). In 2008, it fell from 880,083 to 831,748 because of the worldwide economic crisis. This drop has been largely offset by an intense production in the following years.
The European Commission adopted initiatives to build a Single European Transport Area towards a competitive and resource efficient transport system. The White Paper includes proposals to reduce Europe’s dependence on imported oil and to cut carbon emissions in transport by 60% by 2050 [3]. These initiatives have also been adopted by the Czech Government. In November 2015, it approved the National Action Plan for Clean Mobility (NAP CM) to support e-mobility in the CR [4].
Europe is slowly coming to terms with the need to switch to electric mobility. Electric vehicles are perceived as the key technology in the automotive industry contributing to sustainable development with lower greenhouse gas emissions, less air pollution, and new job opportunities with positive social impact [5,6]. Nowadays, the European Commission is considering the introduction of minimum quotas for the production and sales of zero-emission vehicles that Europe’s car makers will have to comply with. China, as the biggest car producer, confirmed a vehicle quota requiring that 10% of carmakers’ annual vehicle production be fully electric or plug-in hybrid vehicles in 2019, with an increase to 12% in 2020 [7]. At the moment, according to data by the ACEA, over 5% of all passenger cars on European roads run on alternative fuels. Petrol cars remain the most sold cars in the EU, where they represented 49.4% of market share in 2017. In the CR, electrically-chargeable vehicles amounted to 0.1% of sold cars in 2017. In comparison with other EU countries, this is the lowest market share (Table 1). The leader is Sweden with 5.2%, followed by the Netherlands (2.7%), Belgium (2.6%), and Finland (2.6%).
According to the ACEA, 76% of all electric vehicle (EV) charging points in the EU are located in just four countries. Out of 100,000 charging points across the EU today, almost 30% are located in the Netherlands (32,875), 22% in Germany (25,241), 14% in France (16,311), and 12% in the United Kingdom (14,256). A total of 684 charging points are available in the CR. Considering the country size and the fact that it has the lowest market share of electric vehicles, the number of charging points is not that small. Hungary, a much larger country, has 272 charging points, and the almost five-times larger Poland has 552 charging points at the moment, according to the data of [8].
Given the abovementioned information, the EV sector is developing worldwide. The development is accompanied by extensive research and environmental analyses of electric vehicles [9,10,11,12,13]. For example, [14] presented a comparative environmental assessment of alternative fueled vehicles. Using the Life Cycle Assessment (LCA) approach, the paper compared environmental aspects of electric vehicles with compressed natural gas (CNG) vehicles, liquid petrol gas (LPG), biogas (BG), plug-in hybrid electric vehicles (PHEV), and hybrid electric vehicles (HEV), along with conventional diesel and petrol vehicles. There are studies aimed at the environmental assessment of batteries for electric vehicles. [15] assessed the impact of Lithium Metal Polymer and Lithium-ion stationary batteries. Refs. [16,17] assessed Lithium-ion batteries as for their resistance and aging. [18] focused on costs ownership analysis of electric vehicles in comparison with internal combustion engine vehicles. There are also comparative studies assessing electric vehicles in two different countries. [19], for example, compared the research on new technologies in electromobility in China and Germany. However, these studies did not include environmental analyses of the carbon and water footprints of EVs regarding electric power generated by various sources. This paper aims to do so for the CR and the Czech national energy system, which will be supplying EV batteries for the country by 2050.
In the paper, we assess the carbon and water footprint of electric vehicles and provide a comparative analysis of energy use from the grid to charge electric vehicle batteries in the Czech Republic. The analysis is done for the period of 2015–2050 based on the Eurostat database, which provides a summary of expected trends in electricity generation by source [20]. The outlook is summarized in Table 2. In the future, an increase in the generation of nuclear energy and energy from alternative sources, such as solar, water, and biomass-waste, is expected. A decrease is expected in electricity generated from solids. From 2020 onwards, electricity generation from oil is not expected.
As electric vehicles are becoming an important element in the development strategy of the automotive industry in the CR, this analysis contributes to the assessment of various approaches to e-mobility development in the CR and assesses the environmental impact of e-mobility. The results of this study may be useful as the first step towards a holistic approach to carbon and water footprints of electric vehicles and, thus, can include all stages of a vehicle life cycle. This paper can help practitioners and decision makers in the automotive industry to understand water source impacts and develop a water management strategy to decrease their water footprint.

2. Materials and Methods

The aim of this paper was to assess the carbon and water footprints of electric vehicles’ life cycles (passenger car production, battery production, road construction, car use, maintenance, and disposal of all components.) and battery charging in the CR, taking into account the trends in power supply to charge EV batteries from 2015 to 2050.
Carbon footprint indicators were obtained based on the LCA using the Intergovernmental Panel on Climate Change (IPCC) 2013 method [20]. IPCC 2013 is the successor of the IPCC 2007 method, which was developed by the Intergovernmental Panel on Climate Change. It contains the climate change factors of IPCC with a timeframe of 100 years. The total amount of carbon footprint has direct and indirect impacts on human activities expressed by a reference unit of kg of CO2. The carbon footprint is calculated based on the global warming potential [23].
Water footprint indicators were obtained based on the LCA using the method developed by Hoekstra et al. [24]. The water footprint was calculated with SimaPro v. 8.5 (Pré Sustainability, Amersfoort, The Netherlands), which allows for the identification of regions with high water stress. SimaPro v. 8.5 has a wide range of water footprint impact assessment methods, both on midpoint and endpoint levels. This analysis was done along with the method used by Hoekstra et al. [25]. A water footprint is a measure of how much water product uses and which direct and indirect environmental impacts result from this. It can help the understanding and management of water use.
The study of water consumption of electric vehicle battery charging was conducted to explore the process’ environmental aspects and determine its water footprint. Water resource management is an important determinant of electromobility development, but, so far, the reported research on environmental impact assessment has been scarce. Water footprint (WF) methodology is a new concept introduced by Hoekstra [25,26,27] to quantify and map indirect water use and show the relevance of involving consumers and producers along the supply chains in water resource management. In the paper, the amount of water used for electric vehicle battery charging included direct and indirect water usage. Direct water use is physically used water during the process, while indirect use is water needed to create something used in the process. This indicator is applied to the consumed water volume and only assesses used water. The regional factors are weighed averages of the freshwater withdrawal by country, based on data from the Pacific Institute [28]. Data from the Pacific Institute provides information about resources to help protect and preserve fresh water around the Earth.
The LCA was conducted in accordance with ISO 14040:2006 [29] and ISO 14044:2006 [30]. The goal and scope of the study, functional unit, system boundary, and basic assumptions were defined. The LCA for carbon and water footprints was made using the SimaPro v. 8.5 package with the Ecoinvent v. 3 database [28]. The basic assumptions used for the vehicle life cycle come from the databases of [28] and Del Duce et al. [31]. The EVs data source used for the analysis was the Ecoinvent v. 3 database [28] (Table 3).
Input and output data were converted to a functional unit (FU). The FU of this study was 100 km. The system boundary includes a range of processes from cradle to grave: Passenger car production, battery production, electricity supply for EVs (the boundary of the EVs system covered the electricity mix in the CR from 2015 to 2050), road construction, car use, maintenance, and disposal of all components. The road maintenance assumes 100 years of road life. In the use phase of EVs, electricity consumption was tracked throughout its power supply chain. A vehicle equipped with a lithium-ion battery was chosen for the analysis because it is the most frequently used battery for EVs. The inventory data included battery production with a dataset for the lithium-ion type battery used for the main drive of the EVs. An EV energy consumption, including charge and discharge battery efficiency, of 19.9 kWh/100 km was assumed [28,32]. The electricity mix used for the battery charging is one of the most important parameters for the data, and it is crucial to understand which type of electricity mix will be used to charge the EVs battery. It was assumed that the primary variable determining the environmental impacts of EVs in the CR would be the energy infrastructure used to charge the batteries of electric vehicles. For this reason, evaluation was conducted on the projected changes in the energy sources of the CR. The analyses were carried out on the energy used for battery charging from the current electricity grid and on the forecast electricity grid for the years 2015–2050. Data of electricity generation for the years 2000–2050 used to charge electric vehicle batteries were obtained on the basis of national data (the Czech Republic’s National Inventory Report, 2017 [21,22]) (Table 2).

3. Results

To establish the determinants of the carbon footprint and water footprint of electric vehicles, an analysis of the environmental impacts of factors contained in the system boundary was carried out. The results of the analysis of carbon footprint (CF) and water footprint (WF) of electric vehicles in the CR are presented in Figure 3 and Figure 4, respectively.
According to the analyses, the main determinant of carbon footprint for EVs in the CR is the electricity used to recharge batteries (Figure 3). Electricity supply used to charge batteries constituted 65.46% of the CF for EVs in the CR in 2015. The large portion of CF is also related to the production of passenger cars. We found that the main determinant of the water footprint for EVs is also related to the supply of electricity to charge the vehicle batteries, which constituted 42.65% in 2015. The large portion of WF is also related to the production of passenger cars (Figure 4).
CF and WF analyses of current and future EVs were performed considering the changes in the sources of electricity mix in the CR (Figure 5 and Figure 6). Based on the inventory of electricity generation in the CR in the years 2015–2050, data for current and future electricity were identified. Other elements (such passenger car production, battery production, maintenance, and road wear) remain constant over the different time horizons of the study. The obtained results showed that the CF of EVs was 21.53 kg CO2eq/100 km in 2015; in 2050, the potential impact on CF will be 13.42 kg CO2eq/100 km. The value of the CF from 2015 over the next 35 years will decrease. The WF was 0.134 m3/100 km in 2015; in 2050 the potential impact on WF will be 0.138 m3/100 km. The value of the WF from 2015 over the next 35 years will increase.
Currently, the main sources used to generate electricity in the CR are lignite, hard coal, and nuclear energy. In the CR, the solids used for electricity generation consist mainly of lignite. In 2015, solids (lignite and hard coal) accounted for 50.07% of the Czech energy system, and nuclear energy accounted for 33.63%. In the future, the share of nuclear energy is expected to increase, while the use of solids in the electricity generation is expected to decrease.
Based on the electricity generation by source in the CR in the years 2015–2050, the shares of individual sources of electricity supply for carbon footprint and water footprint were analyzed. Figure 7 shows a carbon footprint from individual energy sources for electric vehicles battery charging in the CR. Figure 8 shows a water footprint from individual energy sources for electric vehicles battery charging in the CR.
According to the analyses, the cumulative CF indicators of electricity generation used to charge batteries will have decreased by 2050. We found that the main source of the carbon footprint is lignite. Cumulative WF indicators of electricity generation used to charge batteries will have slightly increased by 2050. This shows that the main source of the negative impact associated with water footprint is the nuclear power. A large contribution to the water footprint of electricity from nuclear energy is associated with the operational phase, where water is lost through cooling systems using freshwater. Optimization options to deal with the increasing WF related to nuclear energy production are limited. They are associated with the used nuclear reactor coolant. Even though there are other coolants besides water, such as CO2 and molten sodium, all currently operating nuclear power plants in the CR are light water reactors using water as a coolant.
The analyses also included comparative analyses of the environmental impacts of EVs and conventional gasoline cars. The specifications for the gasoline cars were based on the Ecoinvent database v. 3 [28]. A comparative analysis of carbon and water footprint of EVs and conventional gasoline cars was carried out. The results of the analysis are presented in Table 4.
Based on the comparative analysis, it was found that current and future CF indicators of EVs in the Czech Republic are lower than those for gasoline cars. The carbon footprint factor of gasoline cars was 34.23 kg CO2eq/100 km. Direct greenhouse gases (GHG) emission, particularly emission of CO2, at the stage of gasoline car use (19.99 kg CO2eq/100 km—that is, 58.43%) is the main determinant of the CF. The water footprint indicator of gasoline cars was 0.116 m3/100 km. The results showed that in the Czech Republic, the WF indicator is higher for EVs than for gasoline cars. The main determinant of the WF for gasoline cars is car production (0.077 m3/100 km—that is, 66%).

4. Conclusions

Greenhouse gas management and water resource management have become important parts of sustainable transport in recent years. This paper discusses the carbon footprint and water footprint of electric vehicles and battery charging in the CR.
A description of the energy policy in the CR was presented in “Energy Policies of Czech Republic (2016)” [20]. Currently, the main energy sources used to generate electricity in the CR are solids (hard coal and lignite) and nuclear power. In 2015, solids (hard coal and lignite) accounted for 50.07% of the Czech electricity system, nuclear accounted for 33.63%, and natural gas accounted for 7.13%. In the future, the share of nuclear power is expected to increase, while the use of coal and lignite in the electricity generation system is expected to decrease. The share of nuclear energy is expected to increase from 33.63% in 2015 to 54.20% by 2050. The share of solids is expected to decrease from 50.07% in 2015 to 17.86% in 2050. It is expected that the shares of renewable energy sources will have increased by 2050. Oil is not expected to be used in the CR energy system after 2020.
The value of the CF from 2015 over the next 35 years will decrease. The CF indicator of EVs in the CR will decrease from 21.53 kg CO2eq/100 km in 2015 to 13.42 CO2eq/100 km in 2050. This decrease of CF indicators of EVs is related to the decrease of the CFs of electricity used to charge batteries from 14.1 kg CO2eq/100 km in 2015 to 5.99 kg CO2eq/100 km in 2050. The performed analysis showed that this was primarily affected by decreased share of solids (hard coal and lignite) in the energy sources used for electricity.
The WF indicator of EVs in the CR will increase from 0.134 m3/100 km in 2015 to 0.138 m3/100 km in 2050. This increase of WF indicators of EVs is related to the increase of the WFs of electricity used to charge batteries. The performed analysis showed that this was primarily affected by changes in electricity mix in the CR, especially the increased share of nuclear energy in electricity generation.
This work was the first to account carbon footprint and water footprint for electric vehicles in the Czech Republic. The shares of the sources of electricity generation in the energy systems of the Czech Republic in the years 2015–2050 were used to perform the carbon and water footprints of current and future electric vehicle battery charging. The main sources of electric vehicles in the Czech Republic were presented. The results are summed up into following conclusions:
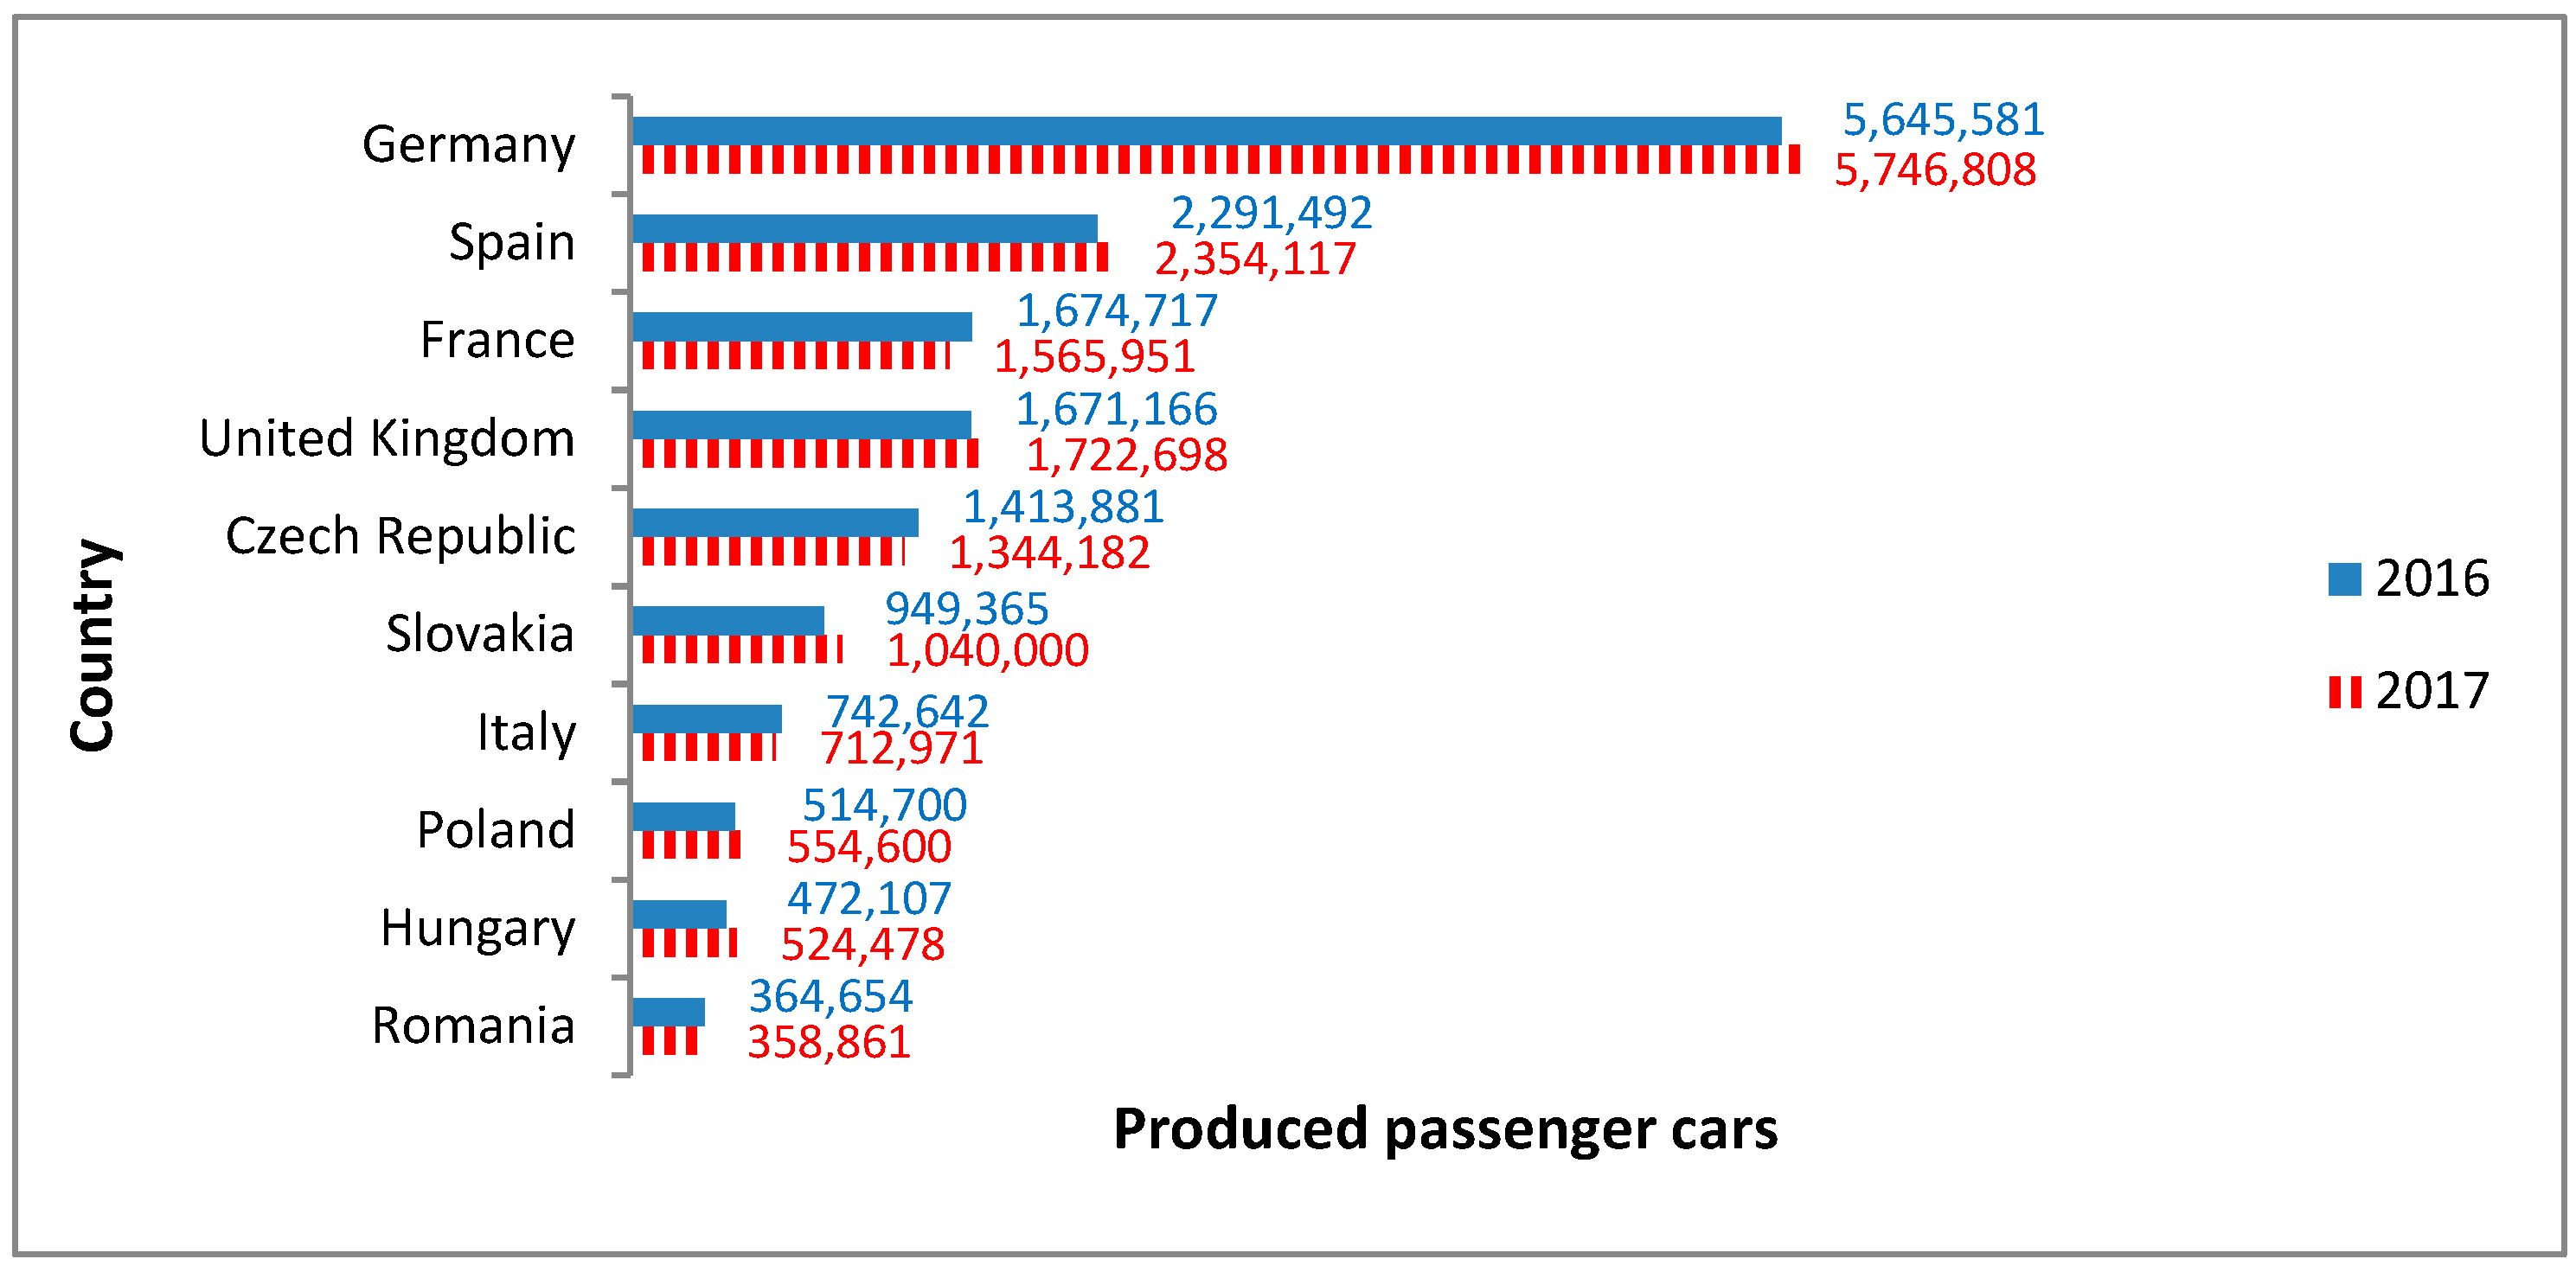
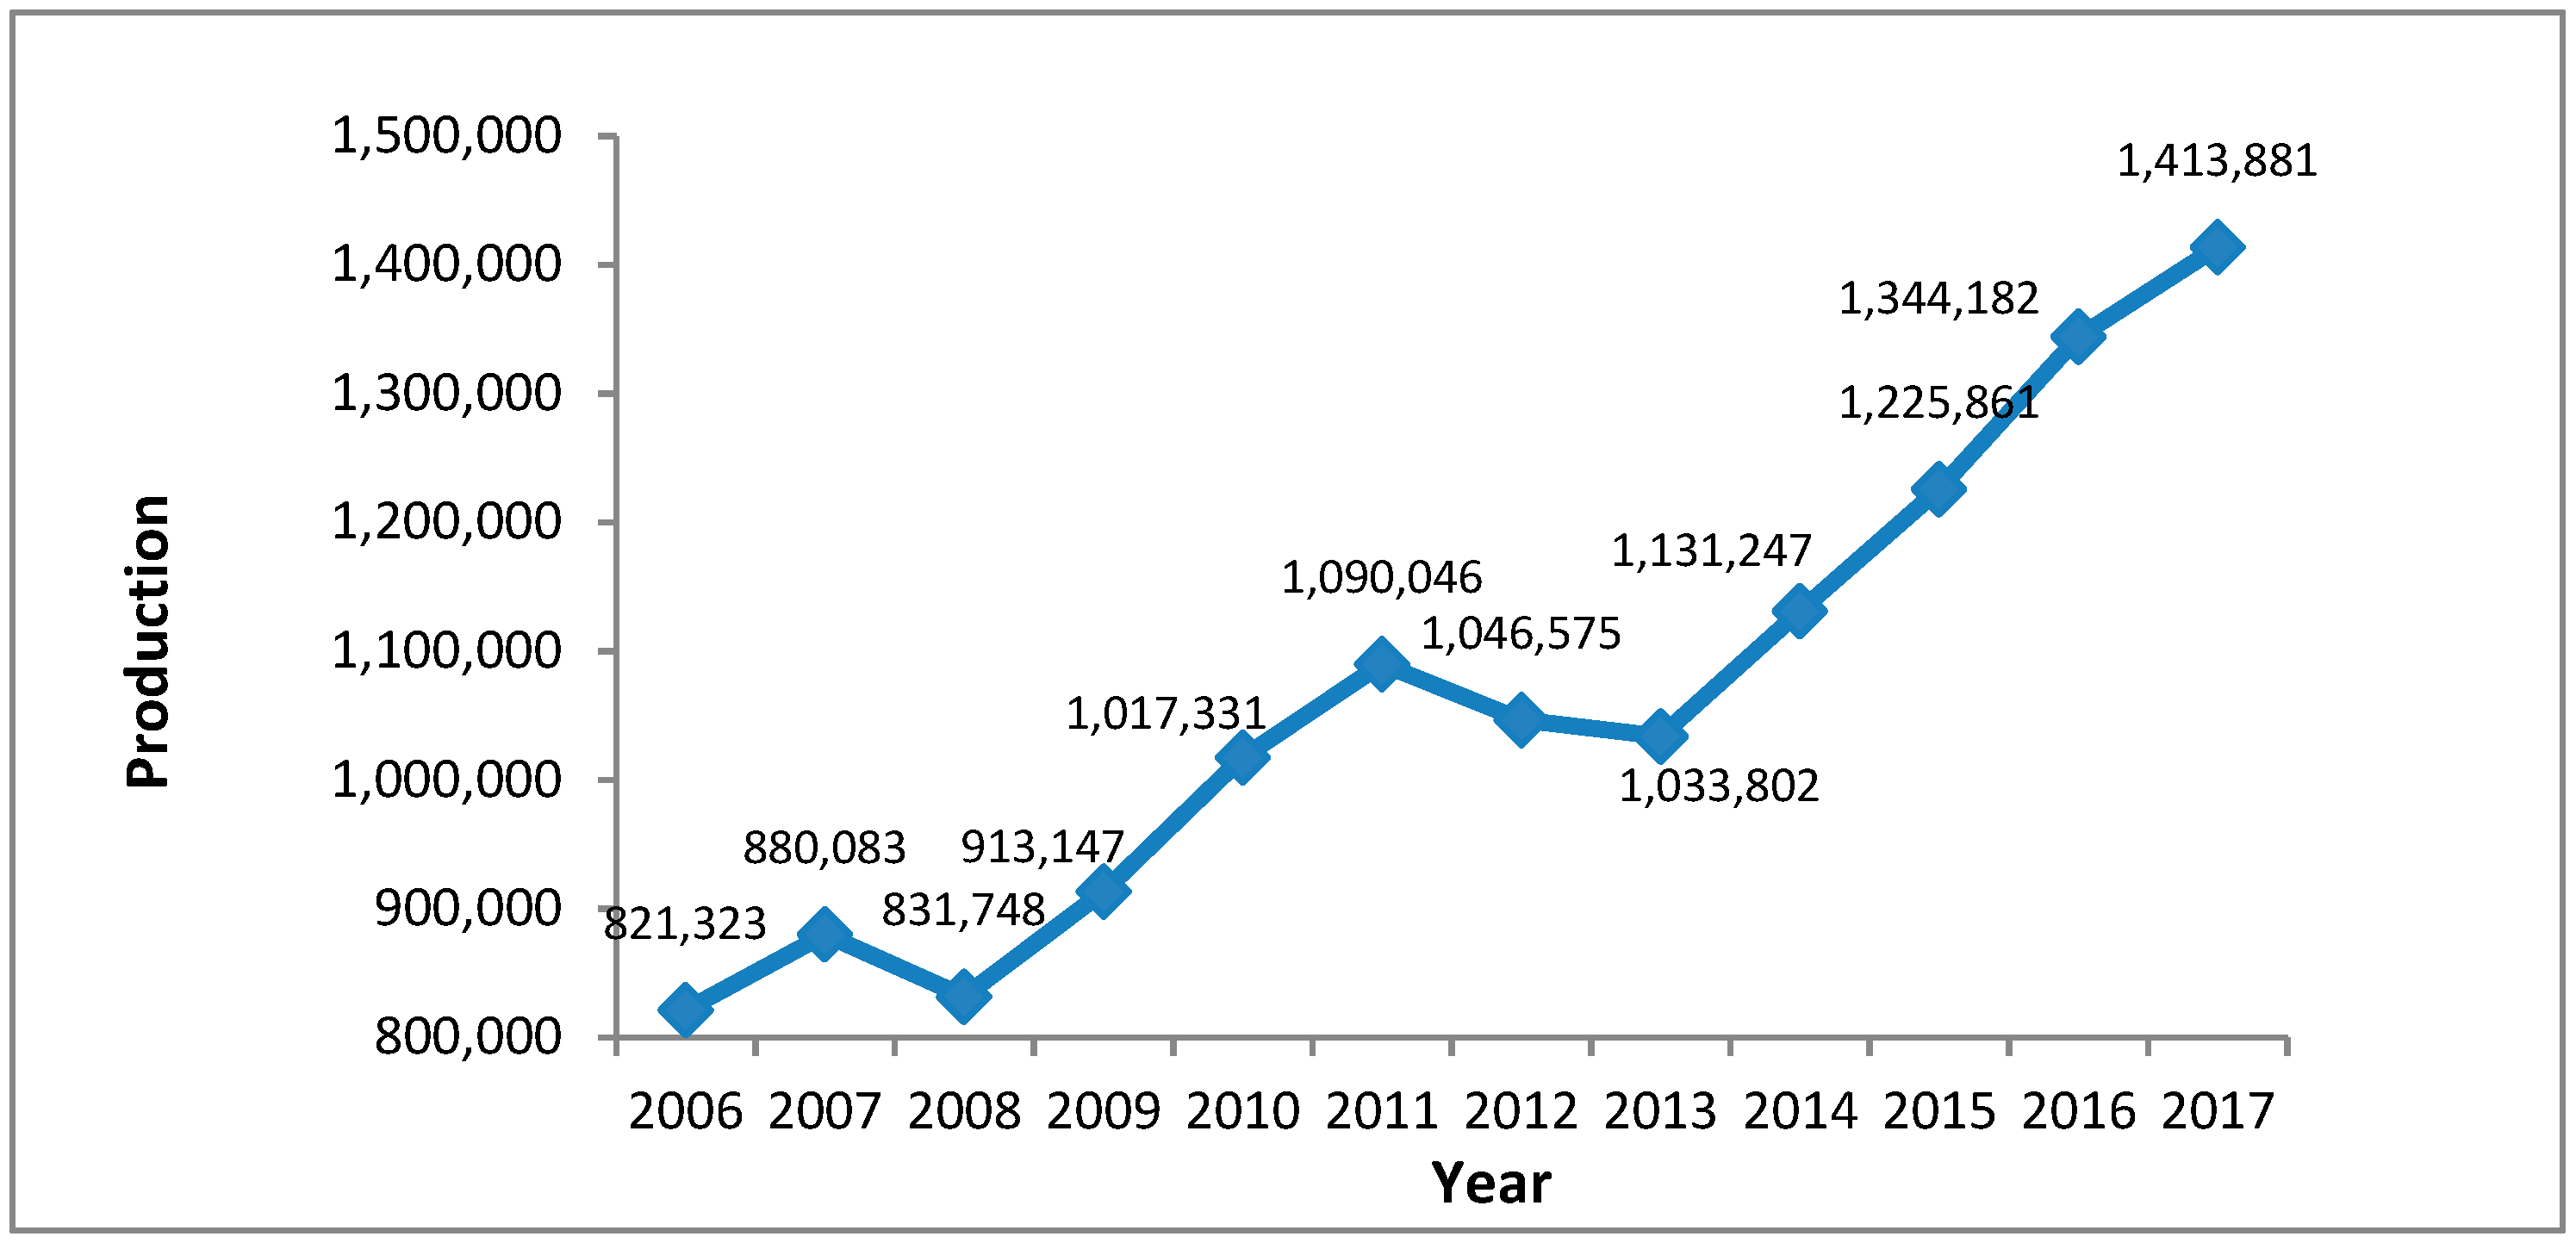
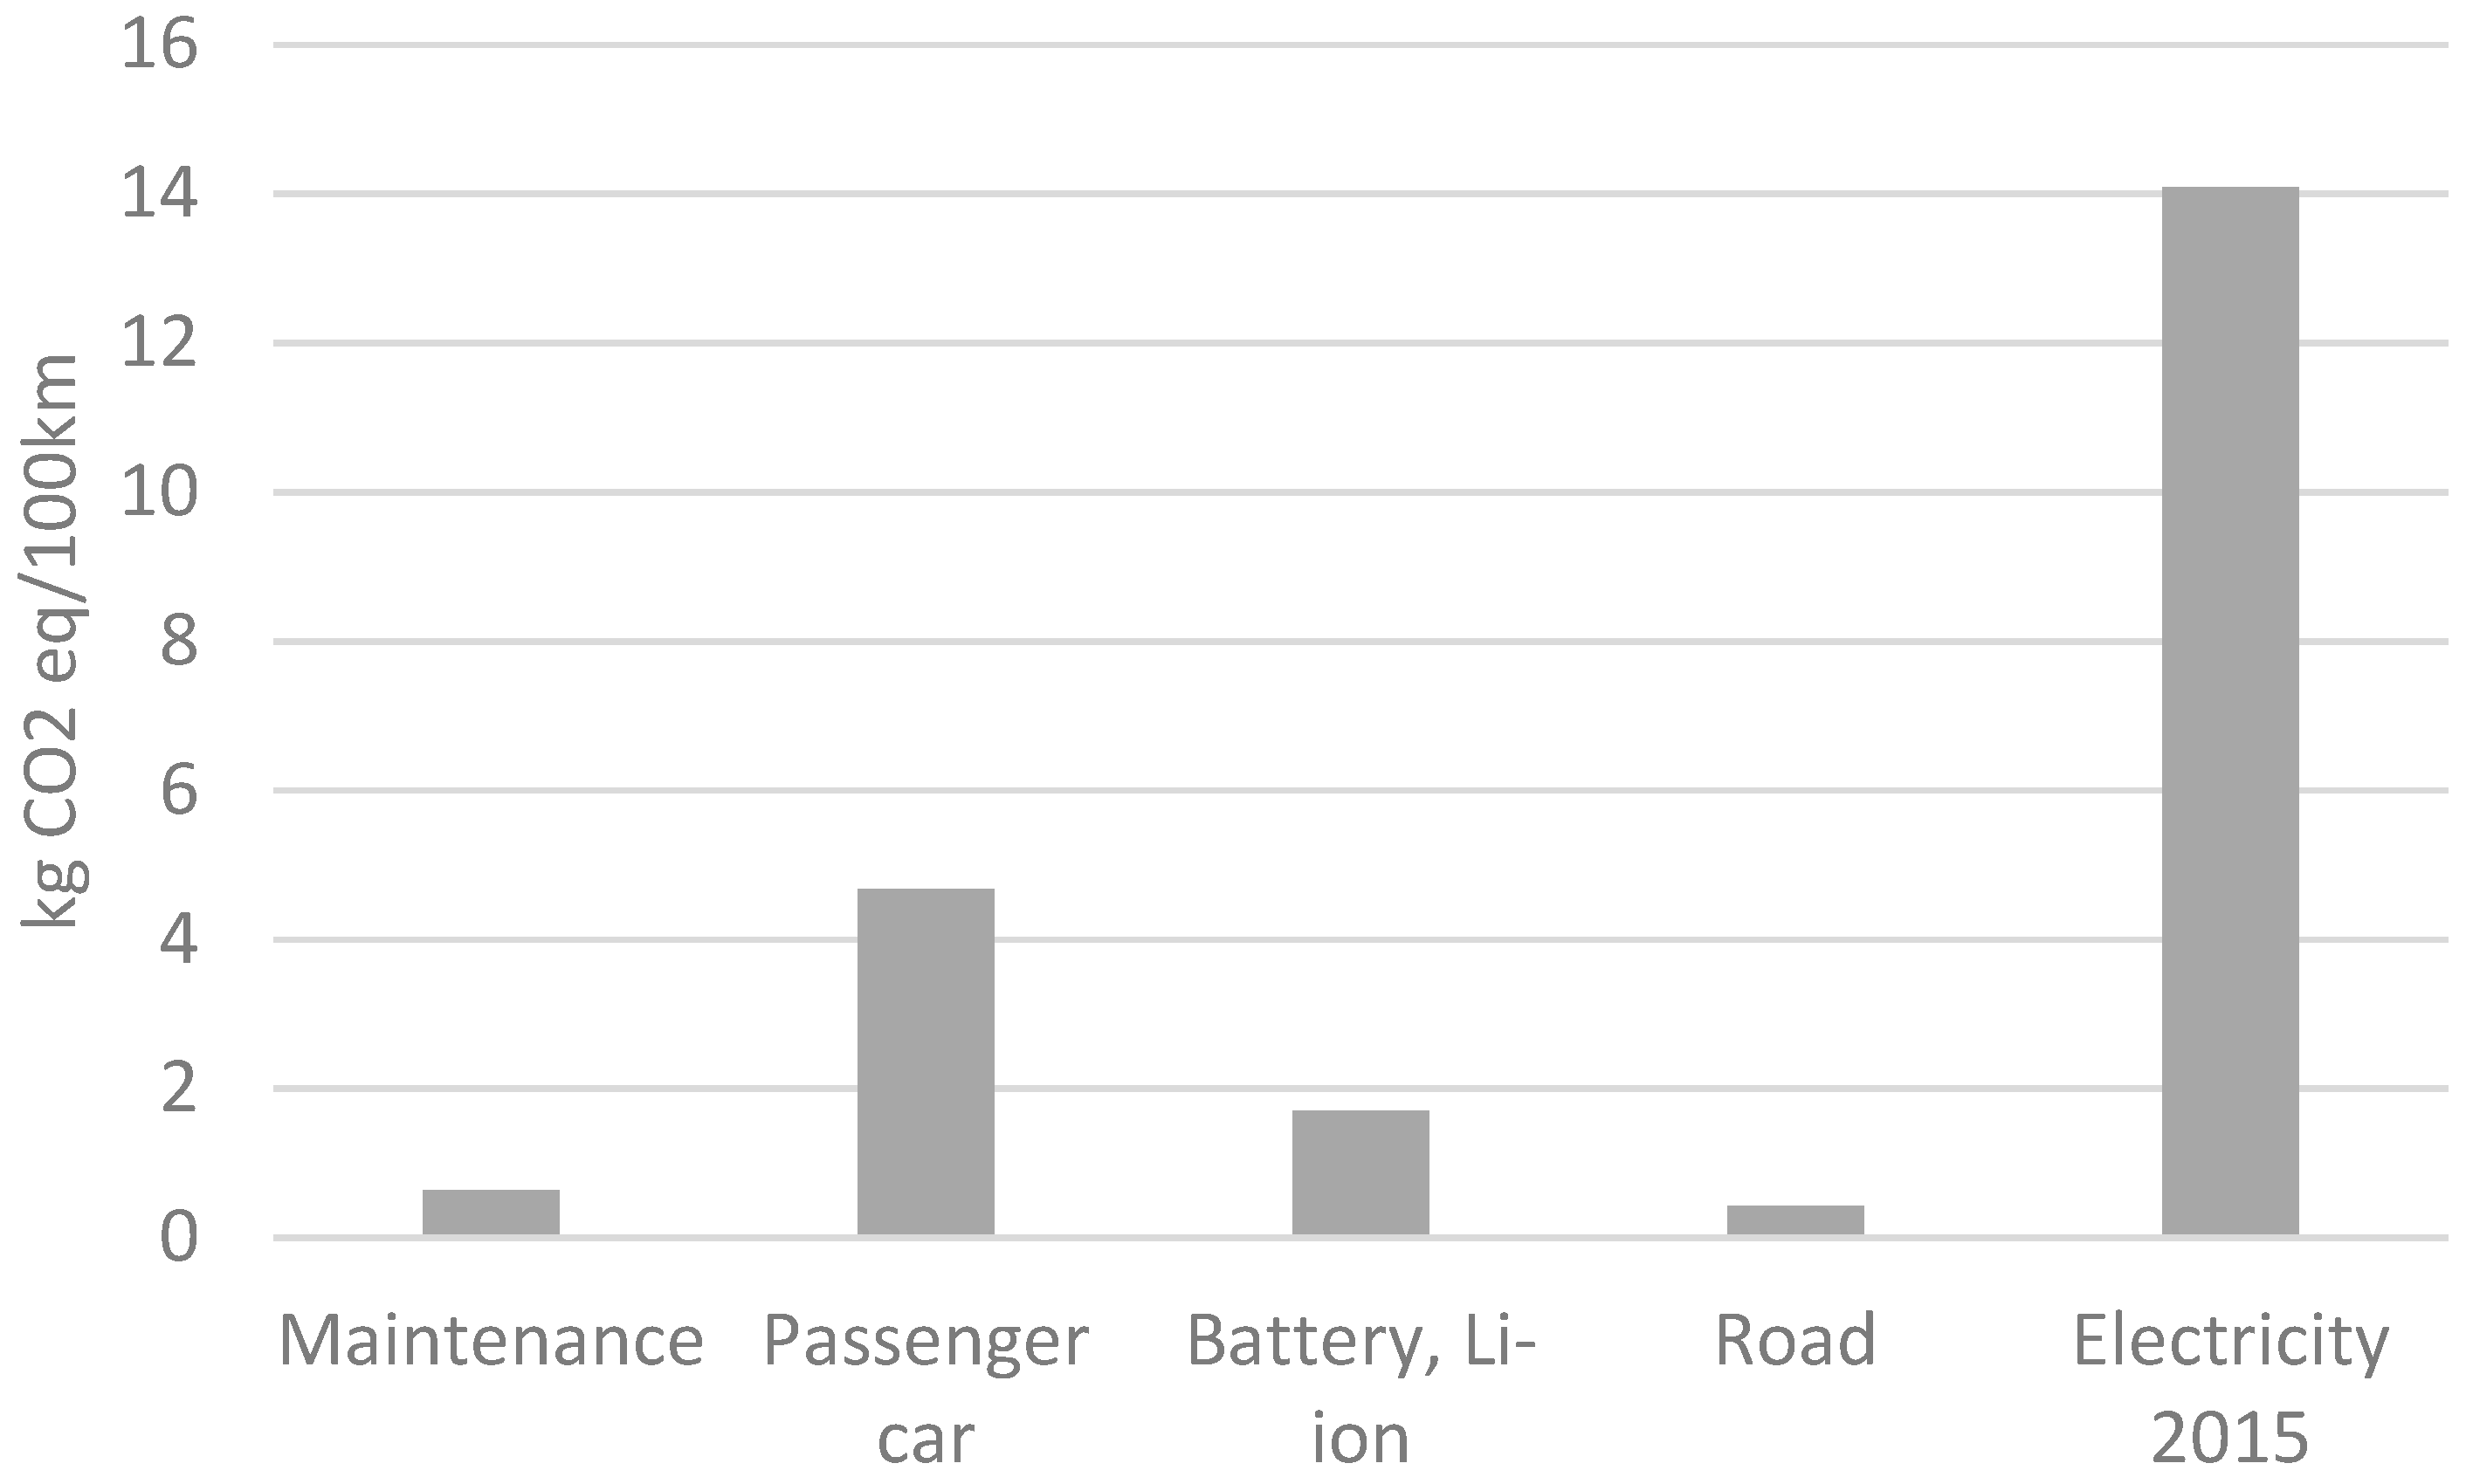
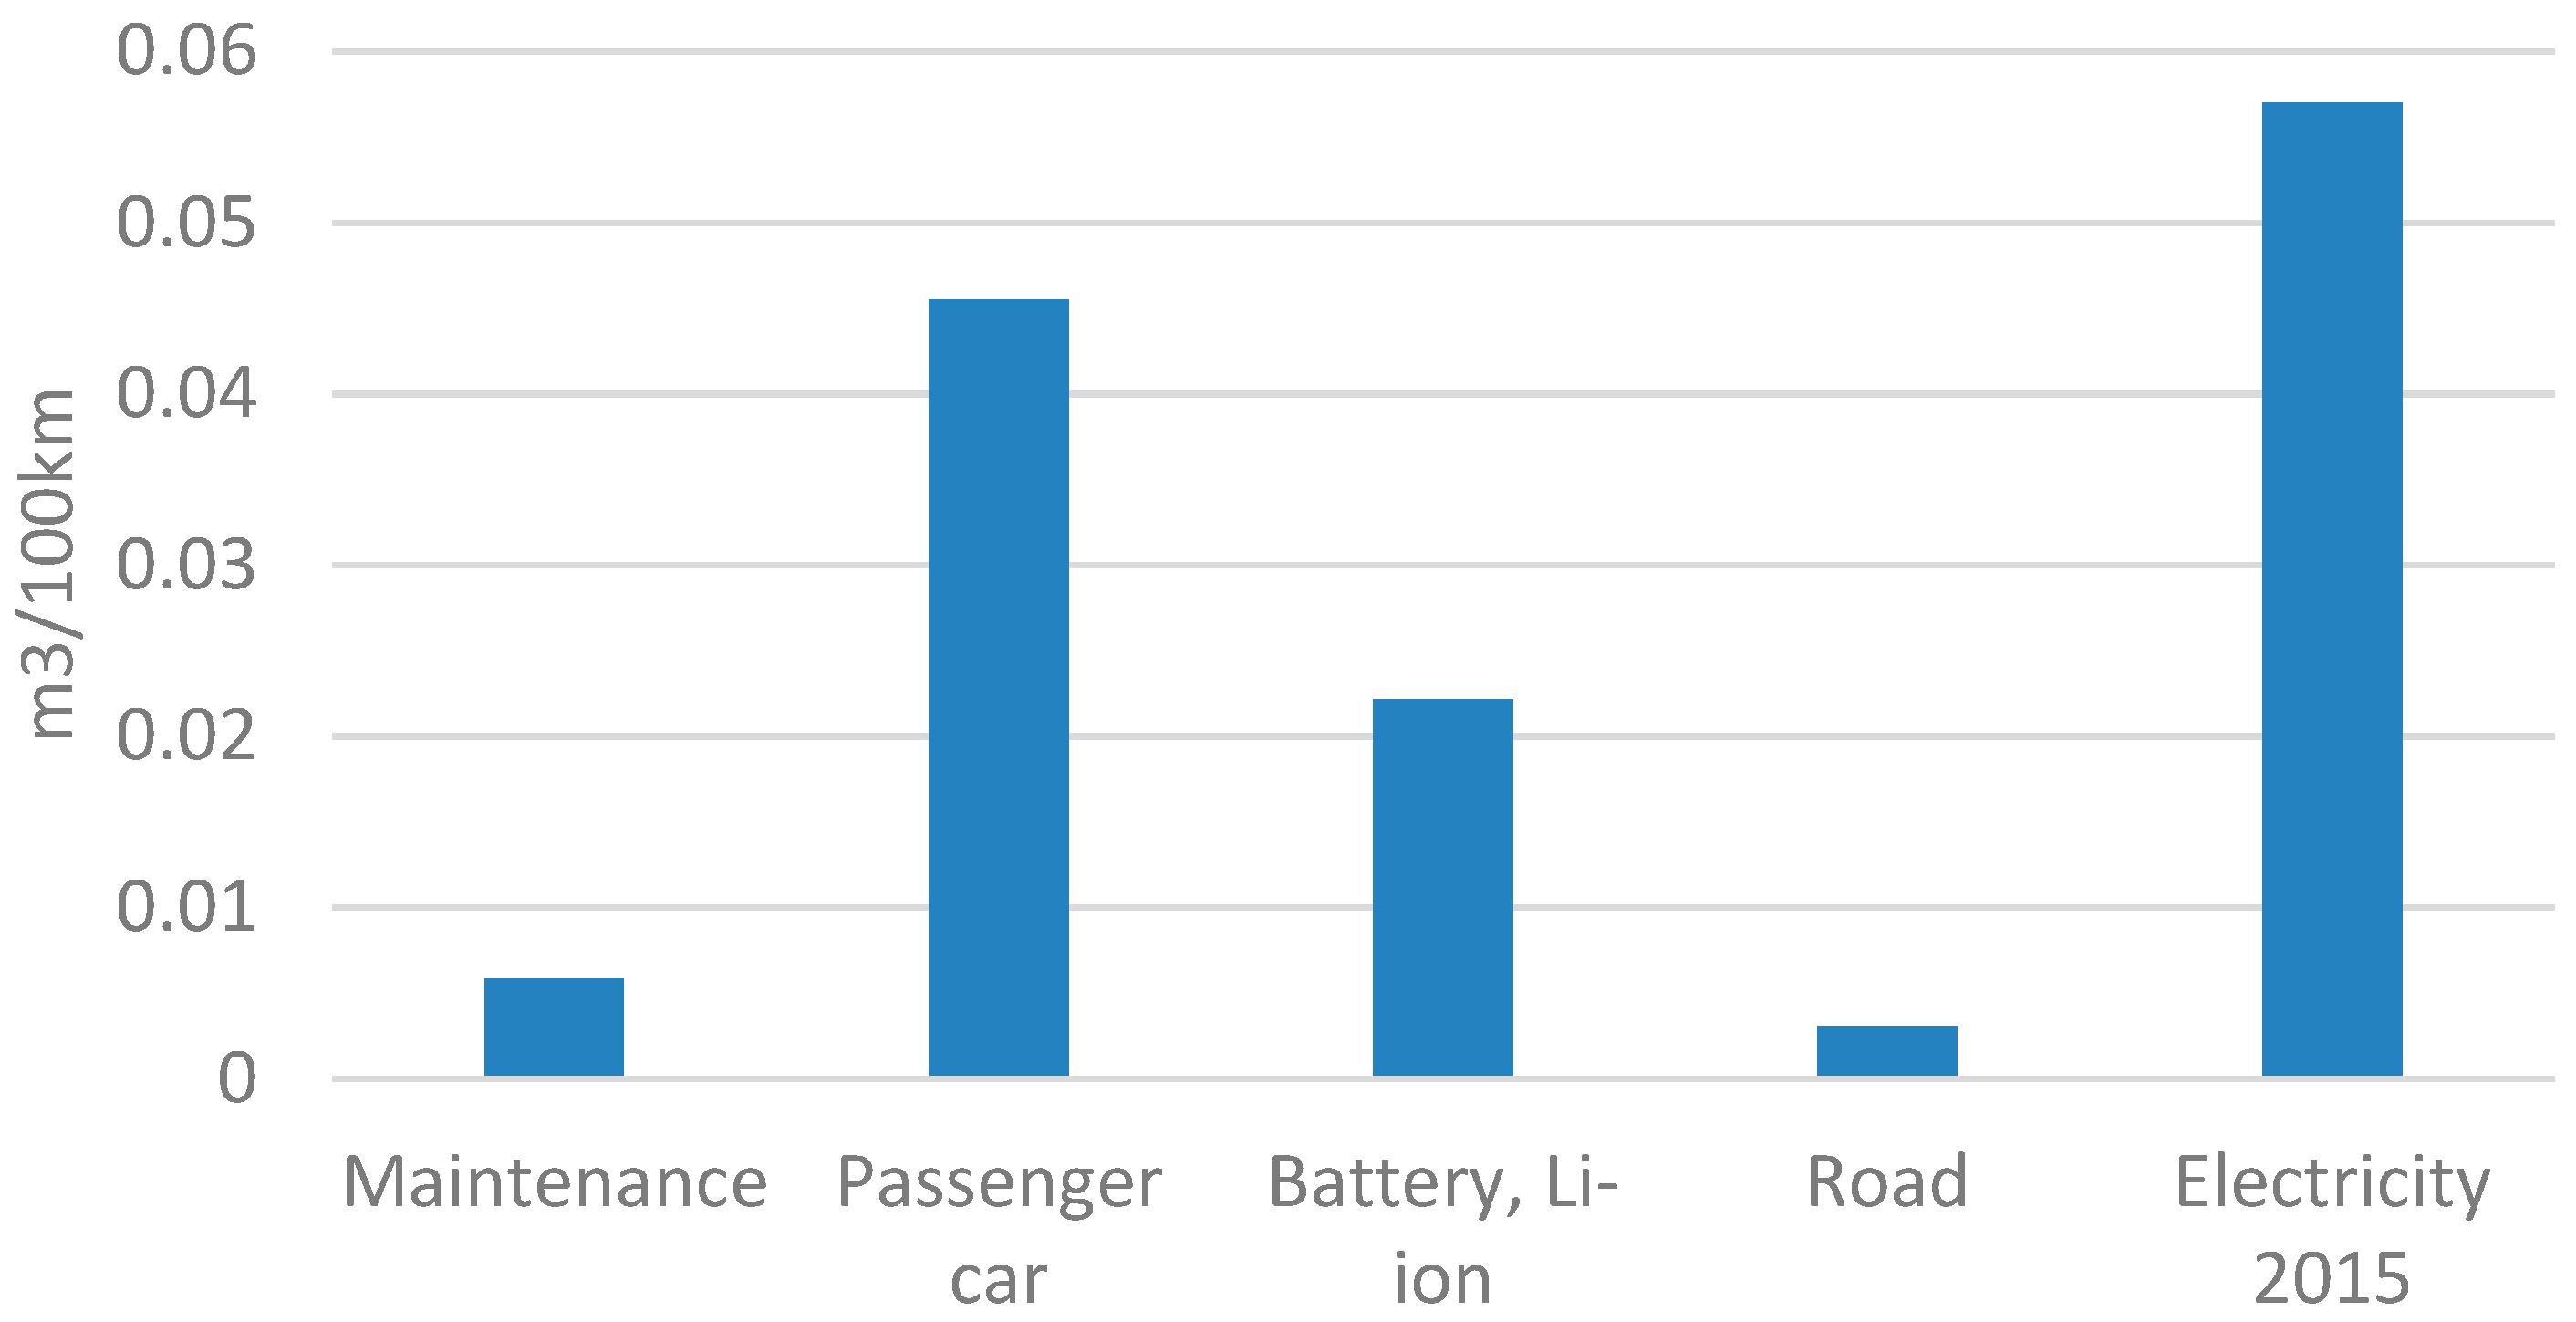
  • Electricity for battery charging is the main determinant of the CF and WF for electric vehicles in the Czech Republic. Another important factor is the production of passenger cars.
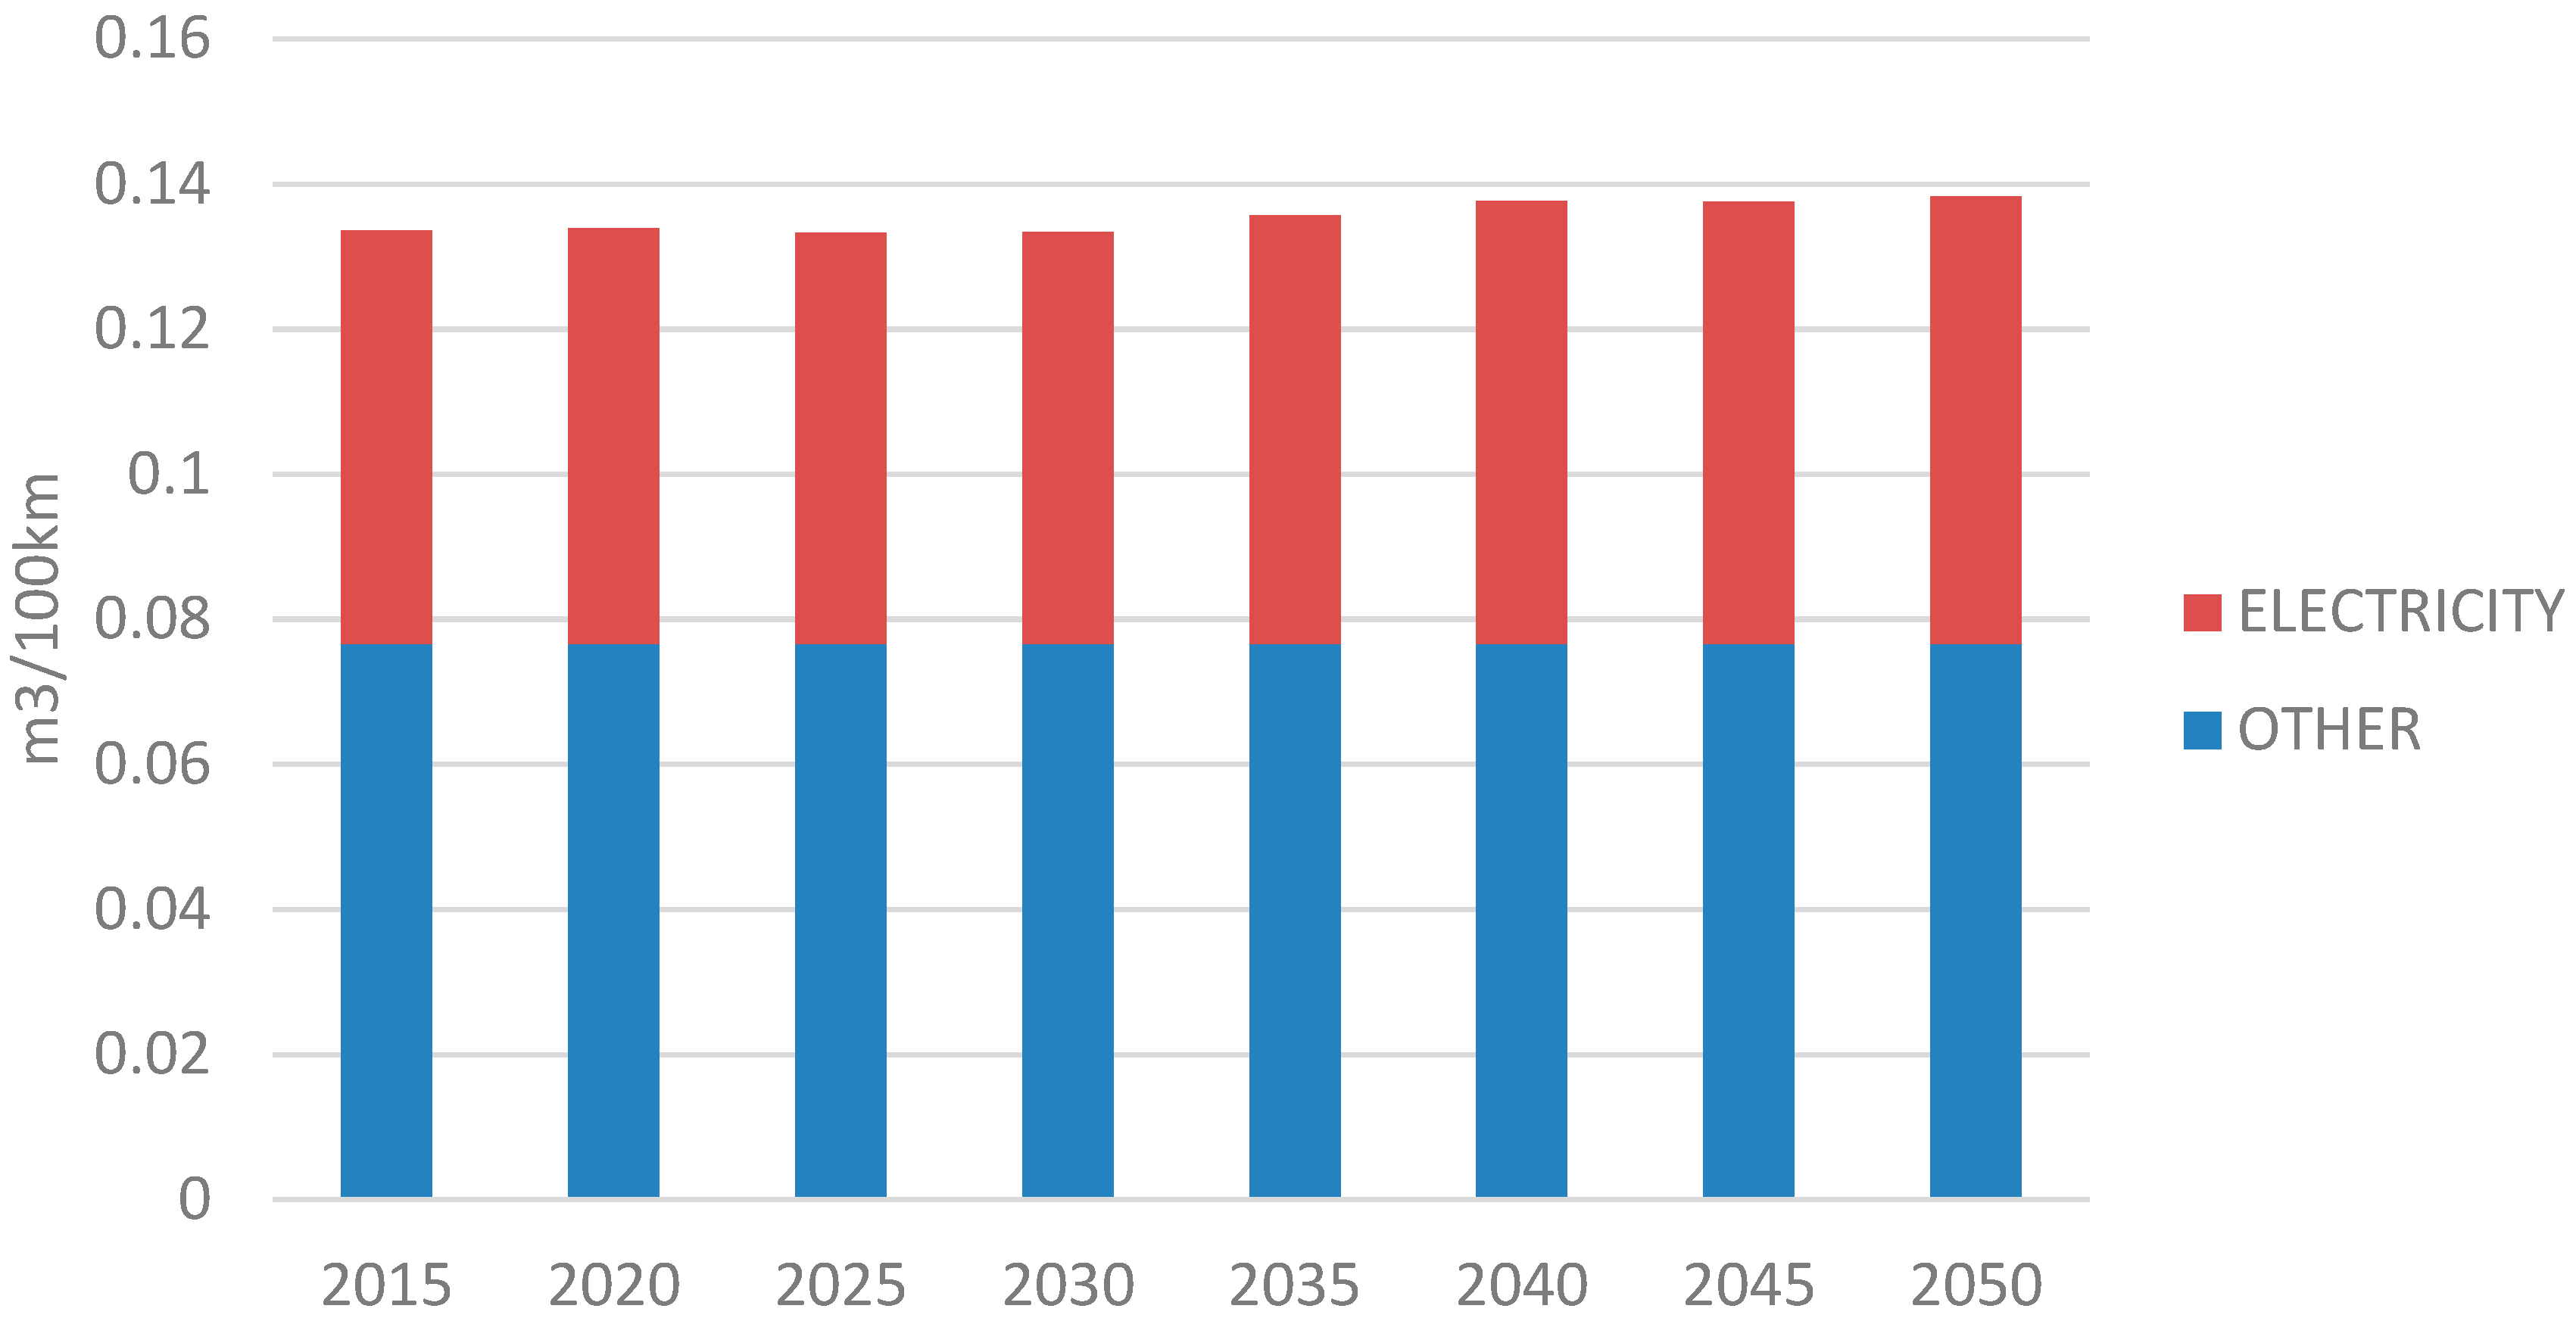
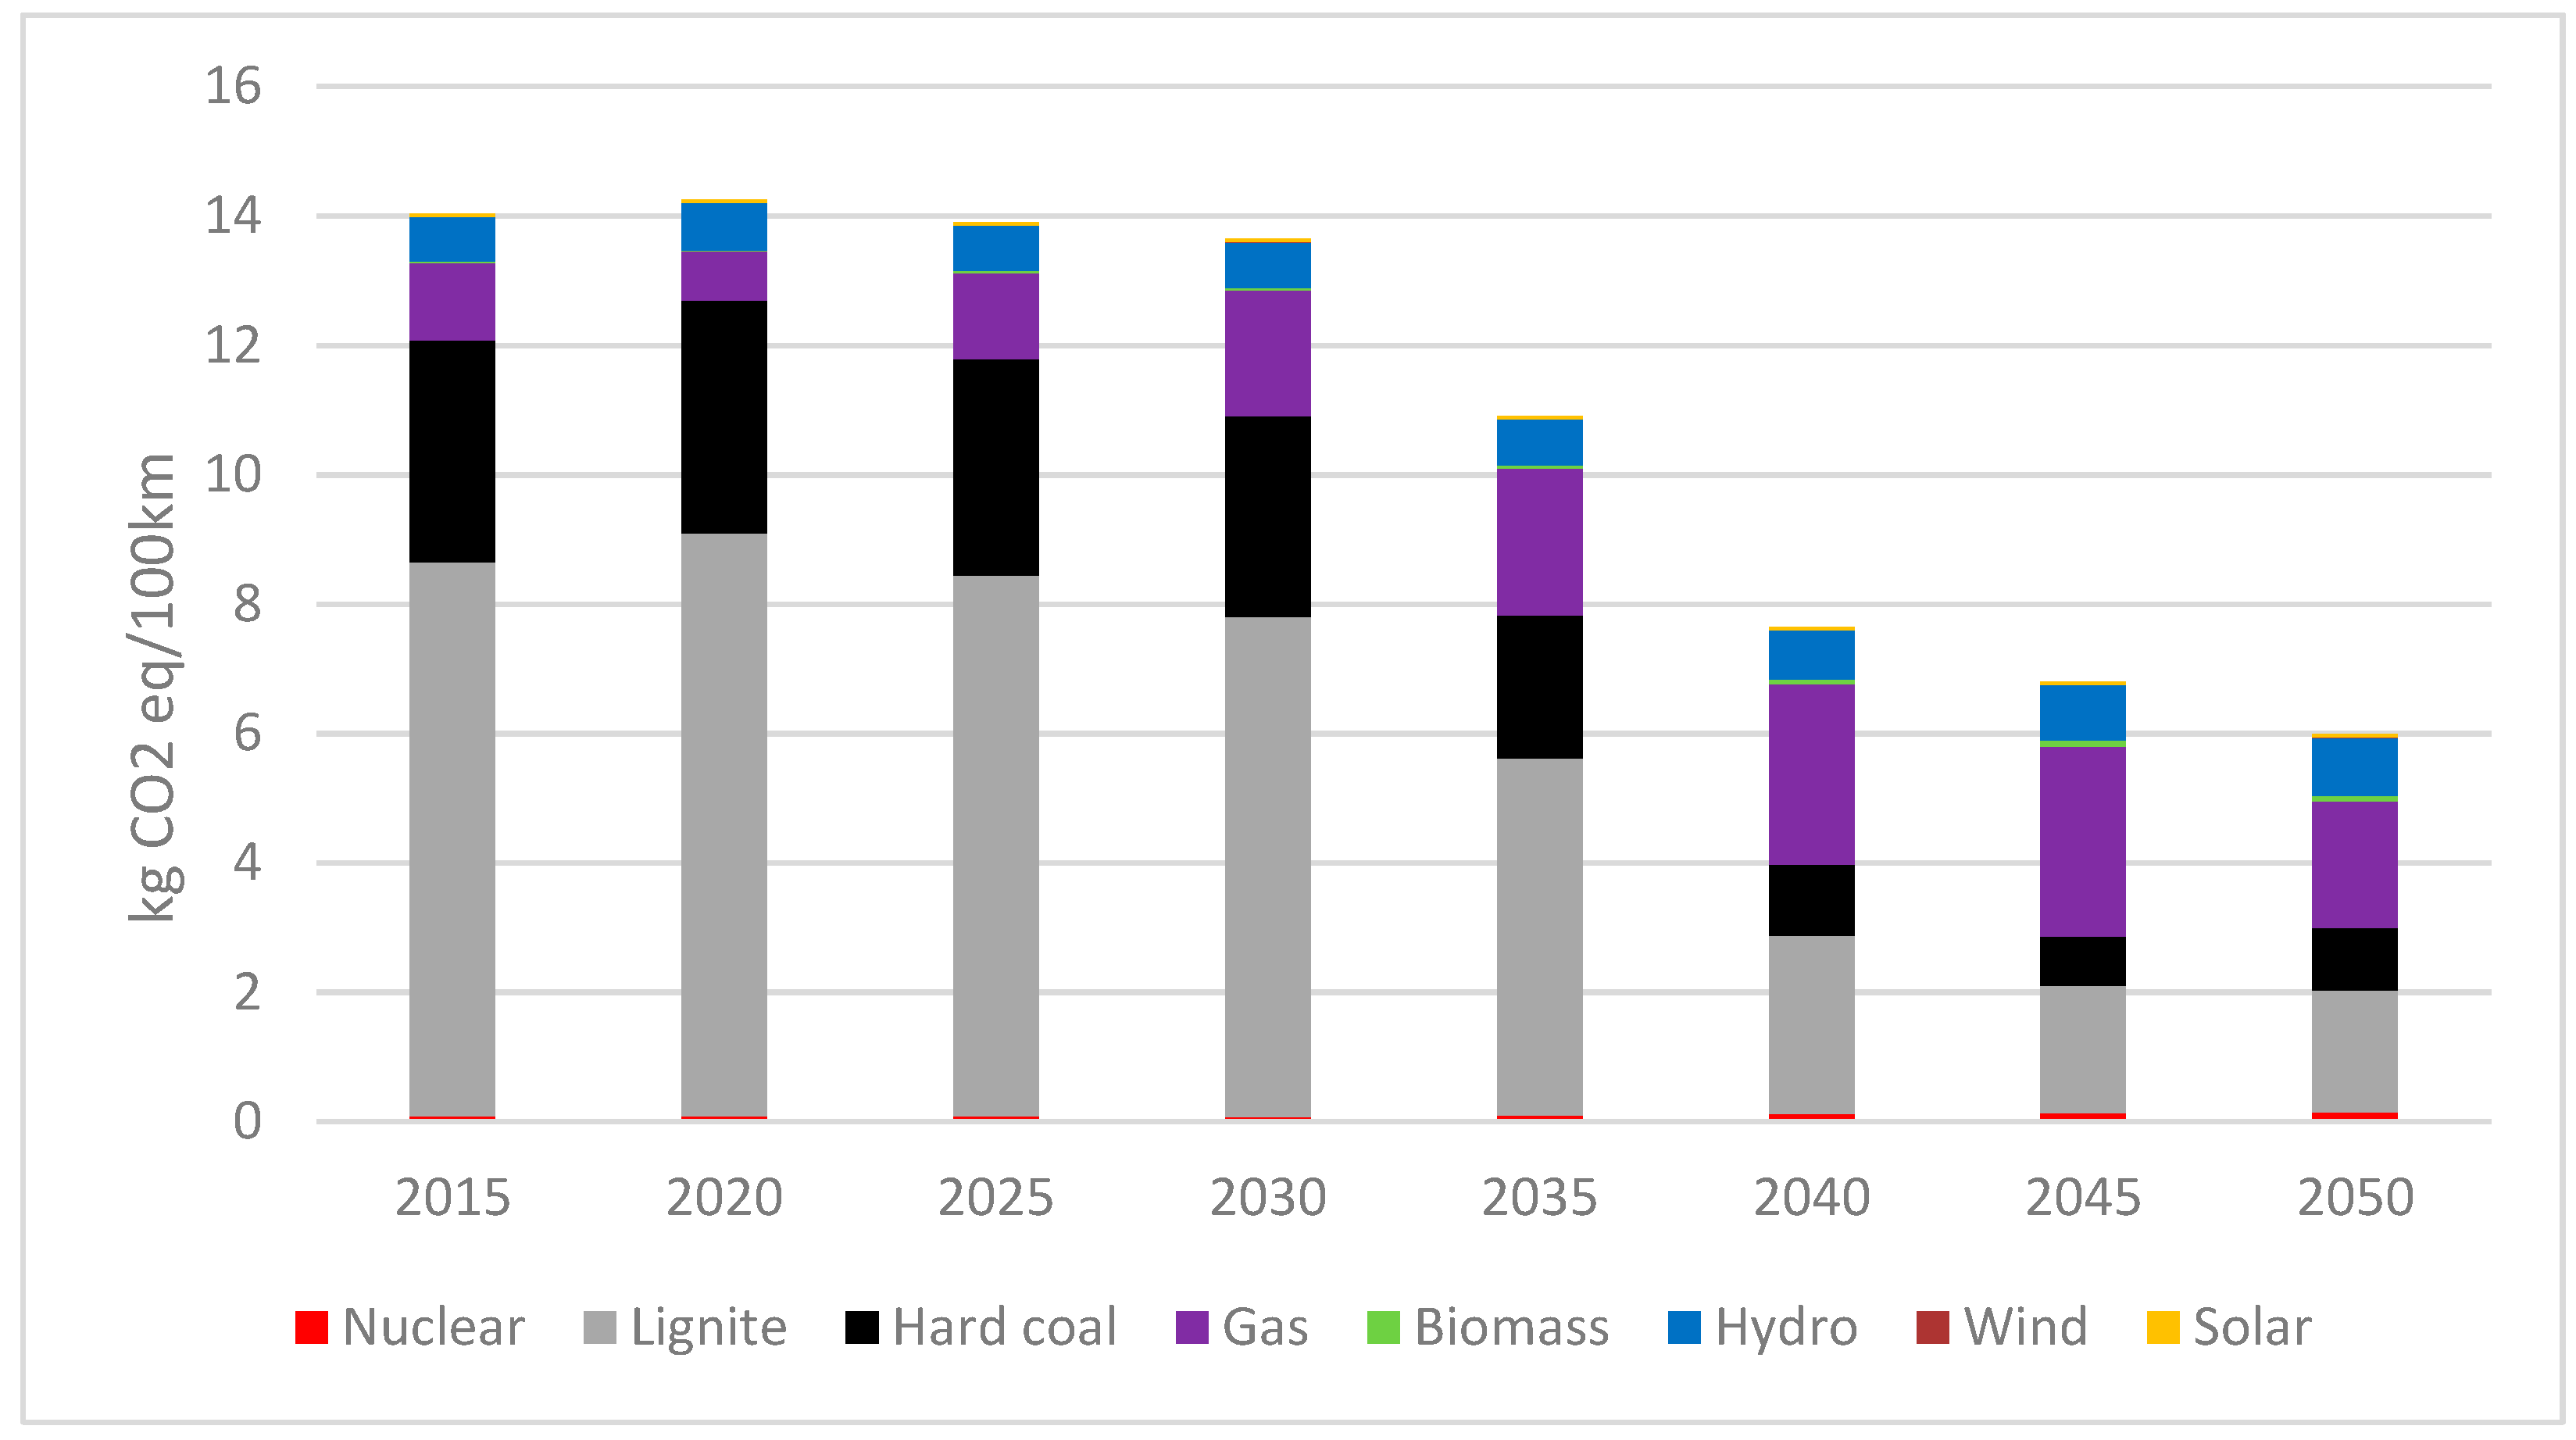
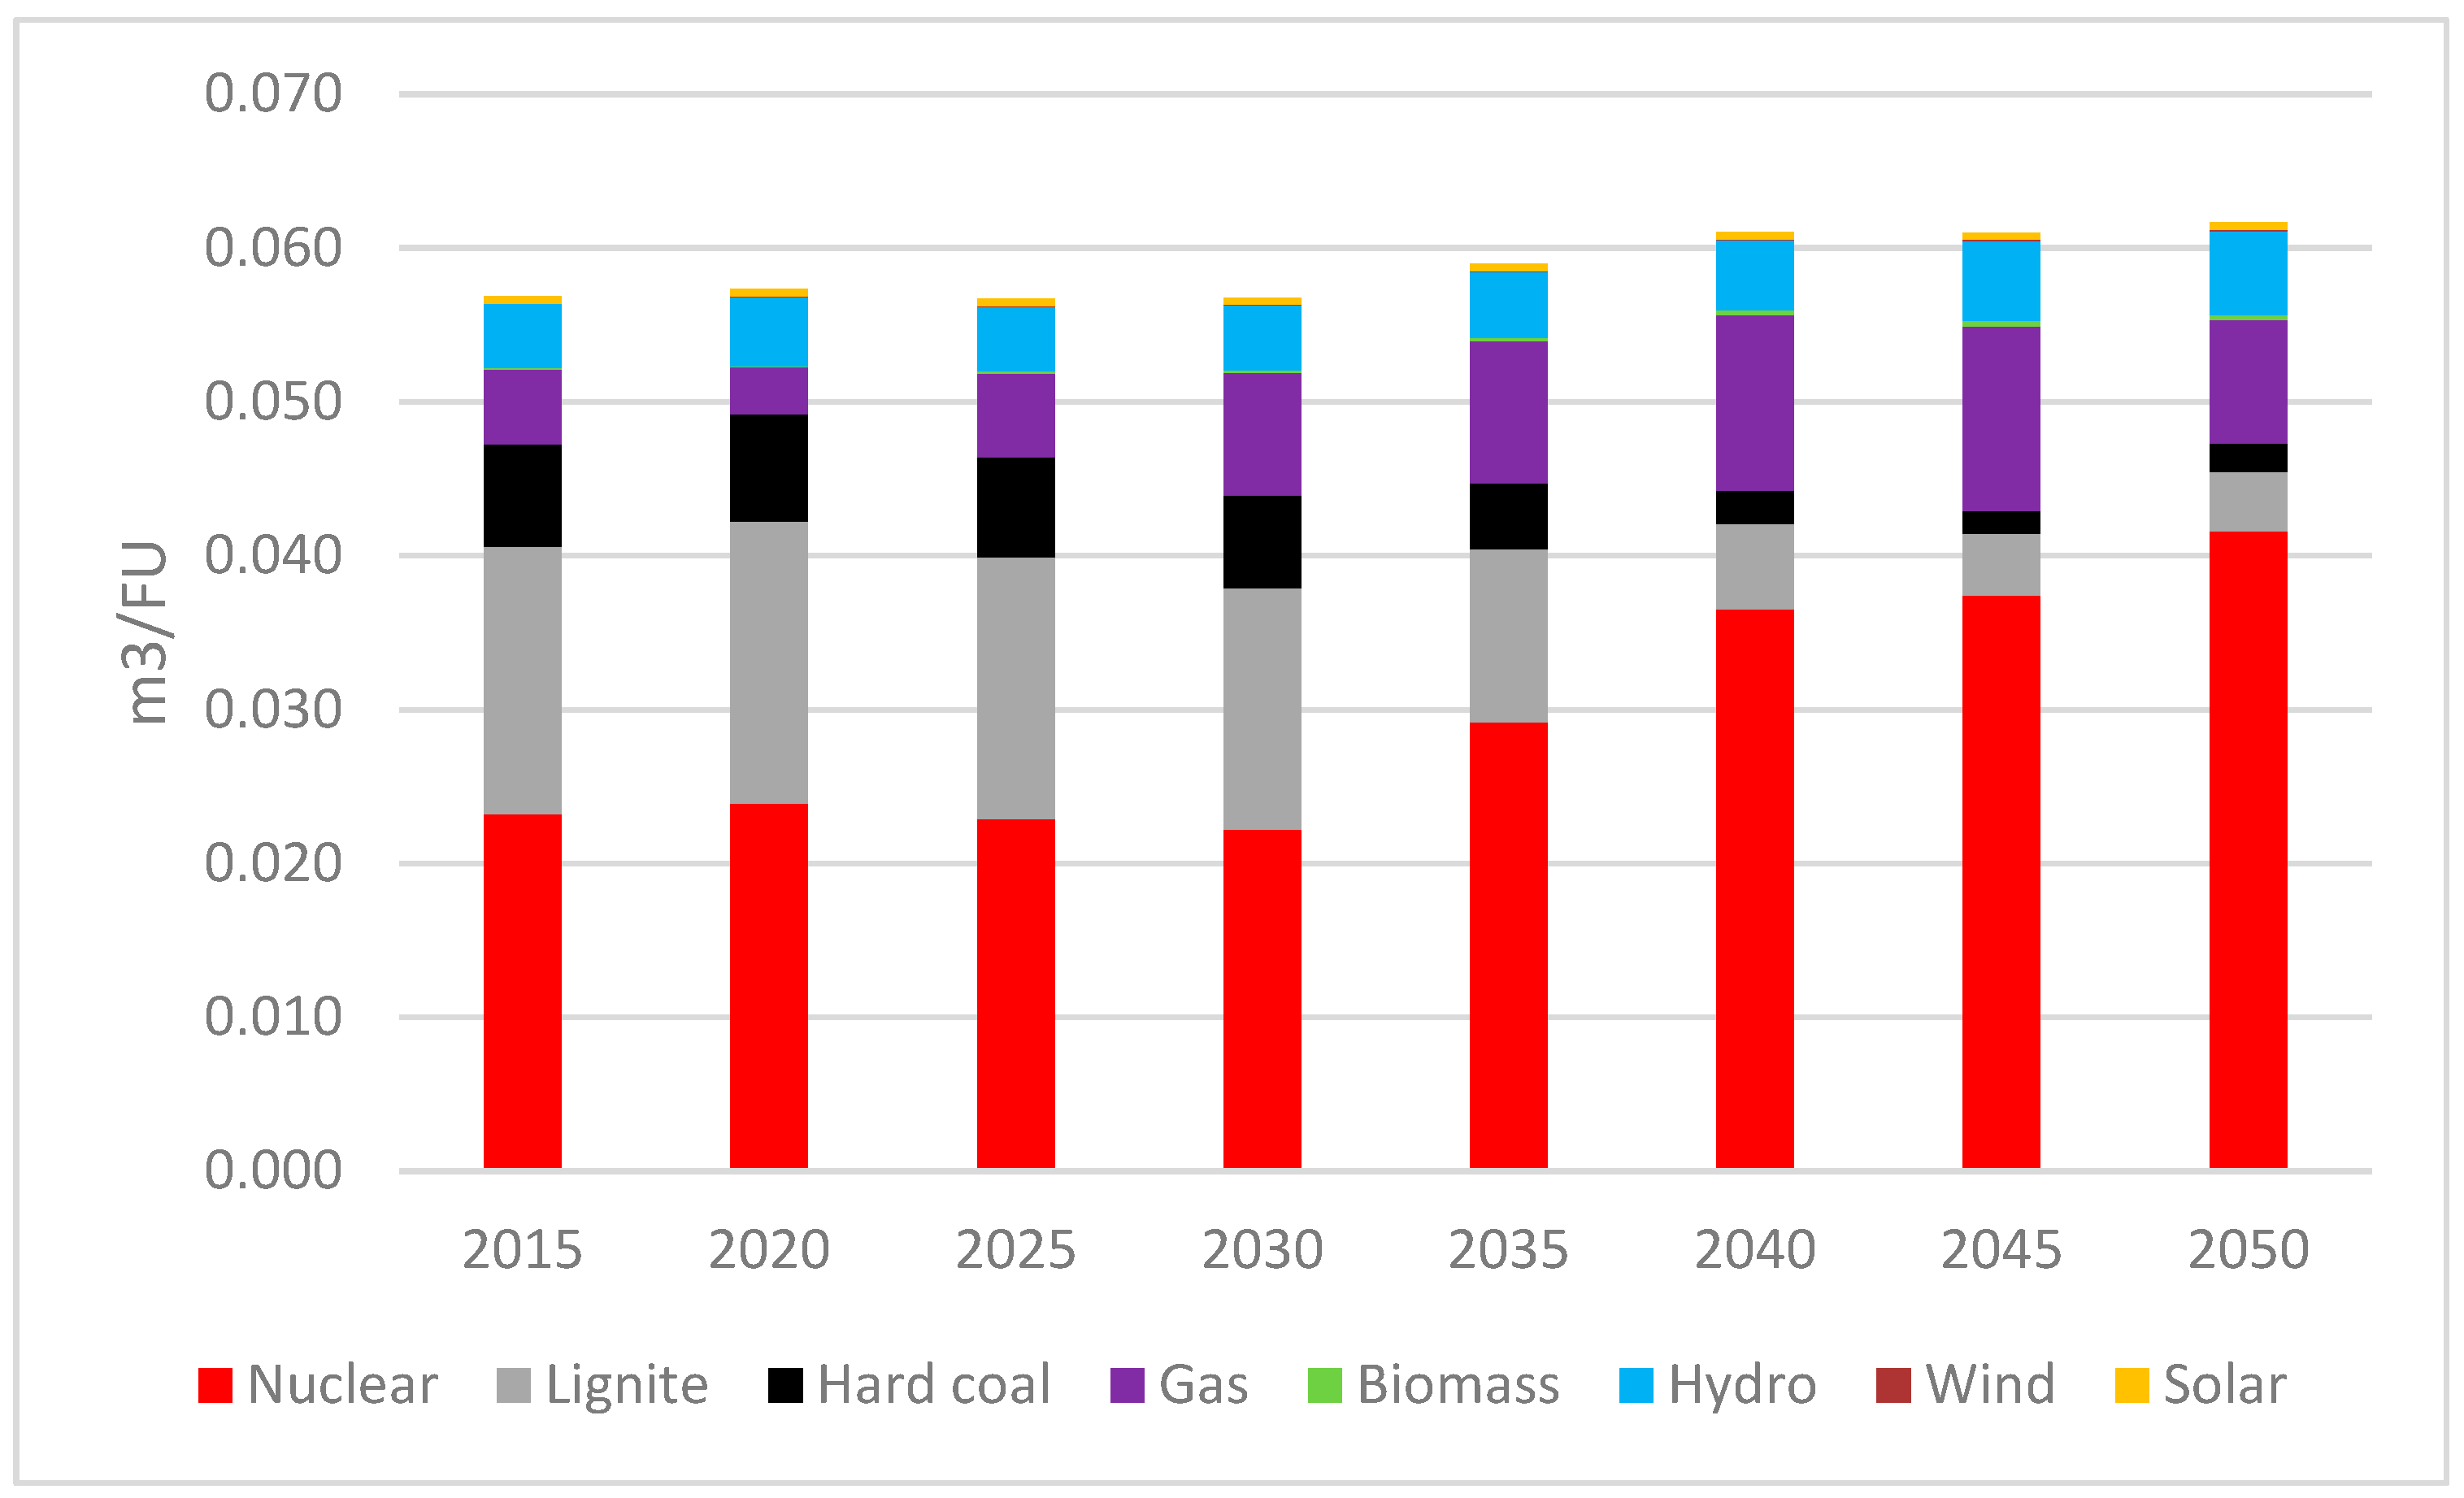
  • The value of carbon footprint of electric vehicles in the Czech Republic is expected to decrease between 2015 and 2050, while the value of water footprint is expected to increase.
  • The electricity used to recharge electric vehicle batteries is an important factor of the carbon and water footprints for electric vehicles in the Czech Republic.
  • Electric vehicle charging from the electricity mix sources in Czech Republic resulted in reductions in carbon footprint and increase in water footprint.
  • The main determinants of carbon footprints for the current to future electric vehicle charging are solids. A decrease in the values of carbon footprint indicators is caused by the reductions in the share of solids (lignite) as the source of electricity generation in the Czech Republic.
  • The main determinant of water footprints for the current to future electric vehicle charging is the nuclear power. An increase in the values of water footprint indicators is caused by an increase in the share of nuclear power as the source of electricity generation in the Czech Republic. The main source of the water footprint from nuclear energy is water lost through cooling systems.
  • The analyses carried out so far will be used for eco-efficiency assessment of electric vehicles in the Czech Republic.

Author Contributions

Investigation, S.J.; methodology, D.B.-K.; writing—original draft, S.J.; writing—review and editing, D.B.-K. and P.P.

Funding

The paper was conducted within the framework of the project LO1404 Sustainable development of ENET Centre and SP2019/160 supported by the project “Electromobility in Czech-Polish Cross-border Area”, reg. no. CZ.11.4.120/0.0/0.0/16_013/0001585 which is co-financed by the EU fund for regional development, programme Interreg V-A Czech Republic-Poland, Fund of microprojects 2014–2020.

Conflicts of Interest

The authors declare no conflict of interest.

References

  1. ACEA—European Automobile Manufacturers’ Association. Top 10: Car Producing Countries, Worldwide and EU. Available online: https://www.acea.be/statistics/article/top-10-car-producing-countries-worldwide-and-eu (accessed on 25 October 2018).
  2. ACEA—European Automobile Manufacturers’ Association. Available online: https://www.acea.be/statistics/tag/category/passenger-cars-production (accessed on 25 October 2018).
  3. White Paper on the Future of Europe: Reflections and Scenarios for the EU27 by 2025; European Commission: Brussels, Belgium, 2017.
  4. National Action Plan Clean Mobility; Ministry of Industry and Trade: Prague, Czech Republic, October 2015; p. 161. Available online: https://www.mpo.cz/assets/dokumenty/54377/64225/657999/priloha001.pdfPriloha001.Pdf (accessed on 24 September 2018).
  5. Ma, H.; Balthasar, F.; Tait, N.; Riera-Palou, X.; Harrison, A. A New Comparison between the Life Cycle Greenhouse Gas Emissions of Battery Electric Vehicles and Internal Combustion Vehicles. Energy Policy 2012, 44, 160–173. [Google Scholar] [CrossRef]
  6. Günther, H.O.; Kannegiesser, M.; Autenrieb, N. The Role of Electric Vehicles for Supply Chain Sustainability in the Automotive Industry. J. Clean. Prod. 2015, 90, 220–233. [Google Scholar] [CrossRef]
  7. EU Contemplates Introduction of Minimum Quotas for the Sales of Electric Vehicles. Available online: http://bellona.org/news/transport/electric-vehicles/2017-06-eu-contemplates-introduction-of-minimum-quotas-for-the-sales-of-electric-vehicles (accessed on 26 October 2018).
  8. Correlation between Electric Car Sales and the Availability of Charging Points, the European Automobile Manufacturers’ Association (ACEA). Available online: https://www.acea.be/statistics/article/interactive-map-correlation-between-electric-car-sales-and-the-availability (accessed on 5 December 2018).
  9. Folega, P.; Burchart-Korol, D. Environmental Assessment of Road Transport in a Passenger Car Using the Life Cycle Approach. Transp. Probl. 2017, 12, 147–153. [Google Scholar] [CrossRef]
  10. Bartolozzi, I.; Rizzi, F.; Frey, M. Comparison between Hydrogen and Electric Vehicles by Life Cycle Assessment: A Case Study in Tuscany, Italy. Appl. Energy 2013, 101, 103–111. [Google Scholar] [CrossRef]
  11. Paulino, F.; Pina, A.; Baptista, P. Evaluation of Alternatives for the Passenger Road Transport Sector in Europe: A Life-Cycle Assessment Approach. Environments 2018, 5, 21. [Google Scholar] [CrossRef]
  12. Rievaj, V.; Synák, F. Does electric car produce emissions? Sci. J. Silesian Univ. Technol. Ser. Transp. 2017, 94, 187–197. [Google Scholar] [CrossRef]
  13. Muha, R.; Perosa, A. Energy consumption and carbon footprint of an electric vehicle and a vehicle with an internal combustion engine. Transp. Probl. 2018, 13, 49–58. [Google Scholar] [CrossRef]
  14. Mierlo, J.; Messagie, M.; Rangaraju, S. Comparative Environmental Assessment of Alternative Fueled Vehicles Using a Life Cycle Assessment. In Proceedings of the 14th World Conference on Transport Research, Shanghai, China, 10–15 July 2016; Volume 25, pp. 3435–3445. [Google Scholar] [CrossRef]
  15. Vandepaer, L.; Cloutier, J.; Amor, B. Environmental impacts of Lithium Metal Polymer and Lithium-ion stationary batteries. Renew. Sustain. Energy Rev. 2017, 78, 46–60. [Google Scholar] [CrossRef]
  16. Mathew, M.; Janhunen, S.; Rashid, M.; Long, F.; Fowler, M. Comparative Analysis of Lithium-Ion Battery Resistance Estimation Techniques for Battery Management Systems. Energies 2018, 11, 1490. [Google Scholar] [CrossRef]
  17. Omar, N.; Monem, M.A.; Firouz, Y.; Salminen, J.; Smekens, J.; Hegazy, O.; Gaulous, H.; Mulder, G.; Van den Bossche, P.; et al. Lithium Iron Phosphate Based Battery—Assessment of the Aging Parameters and Development of Cycle Life Model. Appl. Energy 2014, 113, 1575–1785. [Google Scholar] [CrossRef]
  18. Weldon, P.; Morrissey, P.; O’Mahony, M. Long-Term Cost of Ownership Comparative Analysis between Electric Vehicles and Internal Combustion Engine Vehicles. Sustain. Cities Soc. 2018, 39, 578–591. [Google Scholar] [CrossRef]
  19. Zhao, Q. Electromobility Research in Germany and China: Structural Differences. Scientometrics 2018, 117, 473–493. [Google Scholar] [CrossRef]
  20. Eurostat. Energy, Transport and Environment Indicators; Eurostat Statistical Book; European Union: Brussels, Belgium, 2017; Available online: www.ec.europa.eu (accessed on 12 April 2018).
  21. Energy Policies of Czech Republic 2016 Review. Available online: www.iea.org (accessed on 10 December 2018).
  22. Jursova, S.; Burchart-Korol, D.; Pustějovská, P.; Korol, J.; Blaut, A. Greenhouse Gas Emission Assessment from Electricity Production in the Czech Republic. Environments 2018, 5, 17. [Google Scholar] [CrossRef]
  23. Intergovernmental Panel on Climate Change. IPCC Fifth Assessment Report. The Physical Science Basis. 2013. Available online: http://www.ipcc.ch/report/ar5/wg1/ (accessed on 8 January 2019).
  24. Hoekstra, A.Y.; Mekonnen, M.M.; Chapagain, A.K.; Mathews, R.E.; Richter, B.D. Global Monthly Water Scarcity: Blue Water Footprints versus Blue Water Availability. PLoS ONE 2012, 7, e32688. [Google Scholar] [CrossRef] [PubMed]
  25. Hoekstra, A.Y.; Chapagain, A.K. Sharing the Planet’s Freshwater Resources. In Globalization of Water; Blackwell Publishing: Oxford, UK, 2008. [Google Scholar]
  26. Hoekstra, A.Y.; Chapagain, A.K.; Aldaya, M.M.; Mekonnen, M.M. Setting the Global Standard. In The Water Footprint Assessment Manual; Earthscan: London, UK, 2011. [Google Scholar]
  27. Hoekstra, A.Y. Sustainable, efficient and equitable water use: the three pillars under wise freshwater allocation. WIREs Water 2014, 1, 31–40. [Google Scholar] [CrossRef]
  28. Swiss Centre for Life Cycle Inventories. Ecoinvent 2017—Ecoinvent Database v 3, 2017. Available online: www.ecoinvent.org (accessed on 29 December 2018).
  29. ISO (2006) ISO 14040:2006 Environmental Management—Life Cycle Assessment—Principles and Framework; International Organization for Standardization: Geneva, Switzerland, 2006.
  30. ISO (2006) ISO 14044:2006 Environmental Management—Life Cycle Assessment—Requirements and Guidelines; International Organization for Standardization: Geneva, Switzerland, 2006.
  31. Del Duce, A.; Gauch, M.; Althaus, H.J. Electric passenger car transport and passenger car life cycle inventories in ecoinvent version 3. Int. J. Life Cycle Assess. 2016, 21, 1314–1326. [Google Scholar] [CrossRef]
  32. Girardi, P.; Gargiulo, A.; Brambilla, P. A comparative LCA of an electric vehicle and an internal combustion engine vehicle using the appropriate power mix: the Italian case study. Int. J. Life Cycle Assess. 2015, 20, 1127–1142. [Google Scholar] [CrossRef]
Figure 1. European Union (EU) leading producers of passenger cars (according to [1]).
Environments 06 00038 g001
Figure 2. Production of passenger cars in the Czech Republic (CR) between 2006 and 2017 (according to [2]).
Environments 06 00038 g002
Figure 3. The carbon footprint of electric vehicles (EVs) in the Czech Republic in 2015.
Environments 06 00038 g003
Figure 4. The water footprint of EVs in the CR in 2015.
Environments 06 00038 g004
Figure 5. Results of the carbon footprint for electric vehicles in the CR (current and future).
Environments 06 00038 g005
Figure 6. Results of the water footprint for electric vehicles in the CR (current and future).
Environments 06 00038 g006
Figure 7. Results of the carbon footprint from electric vehicles batteries charging in the CR.
Environments 06 00038 g007
Figure 8. Results of the water footprint from electric vehicles batteries charging in the CR.
Environments 06 00038 g008
Table 1. Market share of sold Electrically-Chargeable Vehicles in the EU [8].
CountryShare [%]CountryShare [%]CountryShare [%]CountryShare [%]
Austria2Estonia0.2Italy0.2Portugal1.8
Belgium2.6Finland2.6Latvia0.3Romania0.2
Bulgaria0.3France1.7Lithuania0.2Slovakia0.2
CroatiaN/AGermany1.6LuxembourgN/ASlovenia0.6
CyprusN/AGreece0.2MaltaN/ASpain0.6
Czech Republic0.1Hungary1Netherlands2.7Sweden5.2
Denmark0.6Ireland0.7Poland0.2United Kingdom1.9
N/A: data not available.
Table 2. Outlook of electricity generation in the Czech Republic [20,21,22].
Electricity Generation by Source, GWhe20152020202520302035204020452050
Nuclear energy27,59627,59627,59627,59437,66847,74254,55654,467
Solids41,09541,99040,67238,73928,71614,5146,97217,948
Oil2310000000
Gas5,8533,5916,67710,04712,14315,18916,58311,840
Biomass-waste2,2141,0972,7813,6694,5336,6028,2517,608
Hydro2,4212,5412,4712,5612,7162,9413,4533,877
Wind5087598248789129911,6641,782
Solar2,1492,2142,2542,2762,3522,3952,4222,967
Total82,06979,78883,27685,76389,03990,37493,902100,489
GWhe: gigawatt hour electricity equivalent.
Table 3. Inventory of an electric vehicle [28].
EV100km
Inputs:
Battery, Li-ion production0.2620kg
Road0.0487my
Passenger car production0.6121kg
Maintenance0.0007p
Electricity for EV charging19.9000kWh
Outputs:
Brake wear emissions0.0001kg
Road wear emissions0.0012kg
Tire wear emissions0.0068kg
Table 4. A comparative analysis of carbon and water footprint of EVs and conventional gasoline cars.
IndicatorUnitConventional Gasoline CarsEVs in 2015EVs in 2050
CFkg CO2 eq/100 km34.2321.5313.42
WFm3/100 km0.1160.1340.138

