Abstract
The road passenger transport is responsible for a large share of energy consumption and pollutants emission in Europe. Efforts have been made in the definition of new policies to reduce the environmental impacts of this sector. However, an integrated and consistent assessment of the most promising policies is required, using specific European indicators. For that matter, a life-cycle analysis was applied to the road passenger transport, for the European Union with 27 countries (EU27) in 2010, following a basket-of-products methodology and considering three main stages: production, use, and end-of-life of vehicles. Simapro 8 software was used, along with Ecoinvent 3 database and the impact assessment method International Reference Life Cycle Data System (ILCD) 2011 Midpoint+. Changes in vehicle production processes, vehicle constitution, and energy sources for vehicle propulsion were analyzed. The policies resulting in a decrease in all impact categories are the use of smaller or lightweight vehicles by positively influencing use, production, and end-of-life of vehicles. The use of more recent vehicles technology or diesel vehicles show substantial reductions in, respectively, five and eight impact categories (out of 15), justifying their adoption in the European fleet. Generally, the most notorious policies compared to the actual transport paradigm, like compressed natural gas (CNG), biofuels, or electric vehicles use, show the greatest reduction in climate change (up to 46%) but also a very significant rise of impacts in the categories that in the conventional basket-of-products already resulted in the worst indicators after normalization.
1. Introduction
The transport sector is one of the main sectors of activity in Europe (EU28), having been responsible, in 2013, for 22% of the total emissions of greenhouse gases (GHGs) and for 32% of the final energy consumption []. About 82% of the estimated total of 6465 billion kilometers travelled in Europe is accountable to road transport [], namely passenger cars, motorcycles, and buses, which has been growing considerably []. Consequently, the contribution of the transport sector to climate change caused by GHGs cannot be disregarded. Also, according to the European Environment Agency (EEA), the contribution of the road transport for local pollutants emissions stood, in 2013, at 39% of nitrogen oxides (NOx), 22% of carbon monoxide (CO), and 12% of non-methane volatile organic compounds (NMVOCs) of the total emissions in the EU28 [].
To overturn these trends, diverse alternative pathways are envisaged for the transport sector [,]. Also, a number of EU directives have been developed for the transport sector. One example has been the increasingly restrictive limits for the exhaust emissions of NOx, particulate matter (PM), CO, and hydrocarbons (HCs), which have achieved significant results with the use of exhaust after-treatments like Selective Catalytic Reduction (SCR) and Diesel Particulate Filter (DPF) []. Additionally, the Renewable Energy Directive (RED) promotes a large array of measures which include 10% renewable energy in the transport sector by 2020 []. The growing need for a paradigm shift in the transport sector is at the origin of several other proposals for the promotion of sustainability in this sector, which include: the introduction of renewable energy in vehicle production factories []; the promotion of innovative mobility solutions, considering not only passenger transport (e.g., car-pooling) but also freight transport []; the fostering of public transportation []; and the promotion of soft transport modes use [].
In this context, in order to quantify the impacts of adopting such alternatives, several life-cycle analysis (LCA) studies focused on the transport sector and passenger cars in particular have been performed. These studies often focus on the vehicles’ propulsion system, where the most analyzed solutions include technologies such as petrol, diesel, natural gas, and electric vehicles and their fuel production chains [,,,]. One example regarding electric vehicles concludes that for a decreased share of coal power in European electricity generation in 2030, electric vehicles can reduce the carbon footprint by about 80%. However, the use of fossil-based fuels in the production of electricity can even lead to an increase in the GHG emissions accountable for electric vehicles []. The reality is that several questions still arise in the use of alternative technologies, ranging from their operational constraints to their environmental impacts (including the influence of electricity production on a full life cycle approach, of different battery technologies, and of user behavior) [,,].
Another widely discussed solution is the use of materials that lead to lighter and more sustainable vehicles [,,,]. Lighter vehicles can reduce energy consumption in their use stage, but can also change their end-of-life (EoL) performance, which must be assessed on a case-by-case basis. Also, these vehicles have a reduced impact on the current infrastructures of fuel production and vehicle maintenance in opposition to the vehicles that use alternative energy sources. Most studies replace steel and iron by aluminum and other composite materials leading to lower GHG emissions in the vehicles life-cycles []. An example of such application is a study by Hakamada (2007) [] which showed that Mg substitution has the potential to save more life cycle energy consumption compared to Al substitution, but would require Mg recycling for efficient life cycle CO2 reduction, since new ingot Mg production has higher impacts compared to those of steel and Al. A specific study for China demonstrates that replacing steel Mg, corresponding to a 5.7% weight reduction, would cut life cycle GHG emissions and energy usage by up to 0.8% and 1.3%, respectively []. Ultra-light and technologically advanced materials are already being used by some vehicle manufactures []. An example of such application is the use of natural jute fibers instead of glass fibers [].
Meanwhile, despite the great amount of research regarding the impact of mobility, there are a limited number of studies that analyze the transport sector with a comprehensive perspective. One approach considers a basket-of-products methodology that uses macro-statistics data for the characterization of the current transport sector using a representative fleet of products []. Current LCA research provides valuable information on the main transport topics and sometimes on their comparison, but an integrated comparison of several policies is required, instead of an individual evaluation of each solution. As a result, the main goal of this work was to quantify the impacts of several sustainability policies for the road passenger transport sector in Europe. This policy assessment approach may help vehicle manufacturers, consumers, and policy makers in making more informed decisions towards sustainability.
2. Materials and Methods
The software Simapro 8 (PRé Consultants) and the inventory datasets provided by the Ecoinvent 3 database were used to perform this study. The definition of road passenger transport, for the EU27 in 2010, was based on the basket-of-products methodology from Joint Research Center (JRC) []. The methodology for this work encompasses the definition of road mobility products (basket-of-products) and the definition of the processes for the selected transport policies. The impact assessment step was performed using ILCD 2011 Midpoint+ [], considering the following impact categories: Climate change, Ozone depletion, Human toxicity—cancer effects, Human toxicity—non-cancer effects, Particulate matter, Ionizing radiation, Photochemical ozone formation, Acidification, Terrestrial eutrophication, Freshwater eutrophication, Marine eutrophication, Freshwater ecotoxicity, Land use, Water resource depletion, and Mineral, fossil, and renewable resources depletion.
2.1. Definition of Road Mobility Products
The considered basket-of-products for the EU27 in the year of 2010 is composed of 22 sub-products. Table 1 presents these sub-products divided per vehicle class, number of vehicles, total kilometer travelled in EU27 (based on available statistics []), and their average energy consumption (based on own calculation using COPERT (Emisia, Kalamaria, Greece) []).

Table 1.
Road mobility sub-products modelled.
The road sector model includes the definition of the basket-of-products, by defining the fleet composition, including vehicle classes and their level of service (total kilometers travelled) in each country. Considering the level of service and the efficiency of each vehicle class, the energy consumption of the different fuels associated to this basket-of-products was calculated. The environmental impacts of fuel production and vehicle usage were, therefore, quantified based on the levels of services of the different vehicle classes and the associated fuel consumption. The environmental impacts of infrastructure and vehicle production, vehicles maintenance, and end-of-life were estimated based on the fleet composition regarding the vehicle classes considered. Consequently, the assessment of global impacts takes into account the basket-of-products and the average energy consumption as inputs in the life-cycle inventories related to the different life-cycle stages, as shown in Figure 1.
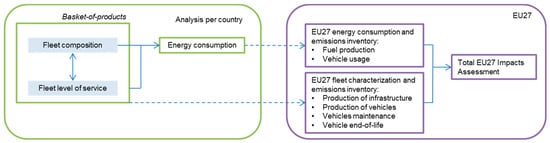
Figure 1.
Methodology summary for the life-cycle inventory.
The life cycle stages considered include vehicle usage (Tank-To-Wheel), fuel production pathway (Well-To-Tank), and materials/infrastructure, as presented in Figure 2. Vehicle usage combines combustion emissions (based on own calculation using COPERT []), exhaust emissions, and wear emissions of brake, tires, and road. As for materials/infrastructure, it encompasses road infrastructure (expenditures and interventions due to the provision of road, tunnel, and bridge infrastructures, the renewal of different road layers and eventual road disposal), vehicle maintenance (service of vehicle maintenance, representing the maintenance demands over the complete lifetime of a vehicle), vehicle production (production of a compact size vehicle, on a per kg basis—it is based on averages over passenger cars technologies spanning from 2000 to 2010), and EoL of vehicles (considering vehicle dismantling and treatment processes of reuse, recycling, recovery, and landfill using the recycling rates with a total of 87% reuse and recovery).
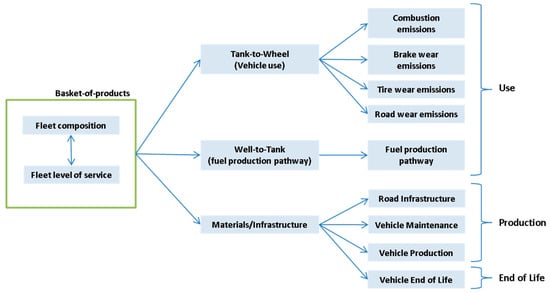
Figure 2.
Life cycle stages considered.
Regarding the vehicles’ EoL, it is considered that all vehicles go through a dismantling process that disaggregates them into their different components (aggregated in the material types presented in Table 2). The materials obtained from the dismantling can be reused, go through a recycling or recovery process, or be placed in a landfill, based on the Advanced Standards of End of Life Vehicles treatment scenario of a reference report [].
Table 2.
Waste scenario modelled in Simapro (percentage).
After weighting the waste scenario with the weight of the components in the vehicles, the total reuse, recycling, and recovery rates were obtained, corresponding to 5.5% for reuse, 77.9% for recycling, 3.5 for recovery, and 13.1% for landfill for passenger cars. The total reuse, recycling, recovery, and landfill rates obtained for passenger cars are in accordance with the Eurostat statistics for 2010 of 87.2% for recovery and reuse of cars, which is disaggregated into 83.3% reuse (including recycling) and 3.9% recovery []. These estimates validate the waste scenario considered. Furthermore, these values allow the fulfillment of the EU guideline of achieving 85% of recovery and reuse, in place since 2006 [].
2.2. Policy Definition
The policies assessed in this work address three main areas, which are described in detail next.
- Changes in the vehicle production processes;
- Changes in vehicle constitution; and
- Use of alternative energy sources for vehicle propulsion.
For each policy, the base Simapro models of each basket-of-products sub-product are modified according to the definitions presented in the next sections. For each policy, a 100% implementation scenario is considered for the defined modifications.
Regarding the assessment of changes in vehicle production processes, the following two options were accounted:
A1. Use of renewable energy sources in production of vehicles: Each sub-product includes the electricity requirements for vehicle production (for example, in cars the electricity need is of 3 megawatt hour (MWh) per vehicle). For this policy, an additional source of renewable energy for vehicle production was considered through the implementation of wind power generation in the production site (based on the Bayerische Motoren Werke AG (BMW) example []). The inventory for a 2 megawatt (MW) onshore wind turbine was used []. The renewable energy fraction considers the installation of 10 MW nominal power. This setup assumes a capacity factor of 25% [] resulting in an annual production of 22 gigawatt hour (GWh), which amounts to a generation of 15% of the total power requirements for vehicle production. The renewable energy share in production is the same for all sub-products.
A2. Changes in the location of vehicle production: For this policy, each sub-product uses two alternative scenarios for vehicle production location. The first uses a vehicle production completely domestic (European) and the second uses a vehicle production fully external (rest-of-world) through the consideration of country supply processes for energy and water in vehicle production. In the European production, the countries with the major electricity production shares are Germany with 16%, followed by France and the U.K. with 14% and 11%, respectively. The rest-of-world production considers the major electricity production shares by China with 19%, the U.S.A. with 17%, and Japan with 6% [].
For the assessment of changes in vehicle constitution, the following three alternatives were considered:
B1. Usage of smaller vehicles: The possibility of vehicle downsizing opens opportunities in terms of fuel economy [], mostly in markets with higher penetration of larger vehicles []. For the considered case study of EU27, the basket-of-products has three classes of vehicles: small (SP01–03, SP18), medium (SP04–06, SP10–12), and large (SP07–09, SP13–16, SP19) which provide essentially the same mobility service. This scenario assesses the impacts of having the smaller class of vehicles defined in the basket-of-products supplying the complete mobility service.
B2. Lightweight materials use: The combination of engine downsizing and light-weighting the vehicle, including its components, is seen as favorable to maximizing lifetime energy consumption [,,]. In this case, two scenarios of lightweight materials use were defined for this policy, one that uses aluminum as the lightweight material and another that uses magnesium alloy and carbon-fiber reinforced polymer (CFRP). For this policy, the defined weight reduction was applied to each car and bus sub-product. New models for vehicle production, vehicle usage, and EoL were considered. The fuel consumption reduction from introducing alternative materials for light weighting can be estimated based on vehicle weight reduction [,,,]. In this case, according to Kim 2013 [], the relation between fuel consumption and vehicle weight, aerodynamic resistance, and rolling resistance is expressed in Equation (1) [].
where Ci: Energy consumption before weight reduction, Cf: Energy consumption after weight reduction, Mi: vehicle weight before weight reduction, Mf: vehicle weight after weight reduction.
The EoL presented in Table 3 considered the treatment rates for non-ferrous metals and plastics for, respectively, magnesium alloy and CFRP, which were not part of the basket-of-products. The aluminum lightweight scenario resulted in a 85% reuse and recovery rate and the Mg + CFRP scenario in a 81% reuse and recovery rate.
Table 3.
Treatment scenario for new materials (percentage). CFRP: carbon-fiber reinforced polymer.
B3. Introduction of latest conventional vehicle technology: For this policy, the exhaust emissions were modelled considering the performance of Euro 6 and Euro VI vehicles. The considered basket-of-products includes conventional up to Euro 5 vehicles technology. Euro 5 petrol cars are in compliance with the standard, which means that only diesel vehicles had to be adapted. Euro 6 vehicles were modelled based on the EU regulation [] by considering a reduction in the emissions inventory of Euro 5 vehicles equal to the reduction observed in the regulation between the same norms. Euro VI buses were modeled using COPERT data for Euro VI and Euro III and applying the same relation to the basket-of-products sub-products. This policy considers the scenario where the full fleet level of service is supplied by the more recent technology vehicles defined, while keeping all the remaining characteristics of the different vehicle classes (e.g., same size and fuel).
In order to perform the assessment of the use of alternative energy sources for vehicle propulsion, the following four alternatives were evaluated:
C1. Dieselization of fleet: The basket-of-products considers vehicles using petrol (SP01–09, SP17–19), diesel (SP10–15, SP20–21), liquefied petroleum gas (LPG) (SP16), and compressed natural gas (CNG) (SP22). This policy considers the scenario where the full fleet level of service was supplied by the diesel vehicles defined, while keeping all the remaining characteristics of the different vehicle classes (e.g., same size and technology).
C2. Use of compressed natural gas: For this policy, the use of CNG is considered for cars and buses. CNG use is modelled with a single Euro 5 medium size (1.4 L–2.0 L) passenger car providing the full fleet level of service using the alternative fuel. For this vehicle, fuel consumption was derived from COPERT, resulting in 8.10 m3/100 km, considering a typical density of 0.717 kg/m3 []. The dataset for a medium sized CNG passenger car is from Ecoinvent [] and includes vehicle production, Well-To-Tank (WTT) and vehicle usage. The CNG car supplies the full fleet level of service. A CNG urban bus was used in the basket-of-products (SP22) and for this policy it provides the level of service for the diesel urban bus (SP20).
C3. Use of biofuels: In this policy three scenarios are considered, two low-level biofuel blend scenarios and one high-level biofuel blend scenario. This policy required modeling of vehicle usage and WTT. The low-level blend scenarios consider that, according to EU instructions [], the maximum admissible fraction by compression ignition vehicles powered by conventional diesel is 7% v/v of biodiesel and the maximum admissible fraction for commanded ignition vehicles powered by petrol is 22% v/v ethyl tert-butyl ether (ETBE). In ETBE, ethanol is mixed with isobutylene creating an additive more compatible with conventional petrol compared to plain ethanol. The second scenario considers the use of alternative vehicles powered by 100% v/v biodiesel (B100) or a mixture with high fraction of ethanol, 85% v/v (E85) corresponding to the conventional vehicle fuel being diesel or petrol, respectively.
Bio-ETBE 22% v/v and Biodiesel 7% v/v: An increase in fuel consumption is considered because of the smaller energy density of biofuels, using The Greenhouse Gases, Regulated Emissions, and Energy Use in Transportation Model (GREET) conversion factors []. The first scenario considers biodiesel production with rape seed oil feedstock and bioethanol production with sugar beet. The second scenario considers residue-based feedstock, with biodiesel production from waste cooking oil (WCO) and bioethanol production from lignocellulosic biomass from wood. The fuel production pathway considers Ecoinvent datasets []. The exhaust emissions of the Bio-ETBE mixture were adapted from a COPERT vehicle powered by E85 [] considering an admissible linear relation between the ethanol fraction and exhaust emissions []. The exhaust emissions from B7 vehicles use a known correlation from literature [].
E85 and B100: E85 car use is modelled with a single Euro 5 medium size (1.4 L–2.0 L) passenger car providing the level of service of gasoline and LPG cars. B100 car use is modelled with a single Euro 5 medium size (1.4 L–2.0 L) passenger car providing the level of service of diesel cars. This scenario only considers the more traditional feedstock of rape seed oil and sugar beet. Fuel consumption of 11.7 L/100 km and exhaust emissions for E85 emissions are adapted from COPERT []. The B100 car follows the same methodology of B7 car and has a fuel consumption of 6.5 L/100 km. B100 urban bus replaces diesel and CNG buses. The fuel consumption of 32.8 L/100 km and the emissions of a B100 urban bus were adapted from COPERT [].
C4. Battery electric vehicles use: This policy considers the substitution of cars for their size equivalent and the substitution of urban buses and mopeds for their electric equivalent. Table 4 shows the weight and electricity consumption for the modeled cars, taken from the Environmental Protection Agency (EPA) concerning renowned brands in the car market [].
Table 4.
Electric cars characteristics for size modeling (based on information from []).
The electric car and moped life-cycle inventories were based on Ecoinvent []. The electric bus glider was based on Ecoinvent conventional bus adapted according to the study by Karna [], resulting in the exclusion of the conventional propulsion system and corresponding production processes. The electric propulsion system and battery were adapted from the electric car dataset with a weight correction factor applied to account for the difference in electric motor power and battery use. The battery was considered to have a useful life time of 100,000 km, resulting in the use of 10 battery sets during the electric bus useful life, based on Cooney [].
Electricity requirements in this scenario were considered to be fulfilled using the average electricity mix for the EU27 in 2010, based on country shares in the European mix available at Eurostat. This mix considers 17% of renewables in production. The Ecoinvent dataset for each country was used [].
3. Results and Discussion
In order to comprehend the impact of the tested policies, the percent change compared to the Business-As-Usual (BAU) scenario in each impact category was assessed. Figure 3 displays these changes for the policies regarding changes in vehicle production processes (A1 to A2). The results show that the use of renewable energy sources in vehicle production leads to very small reduction in impact, with a 3% in water resource depletion being the highest reduction. The location change of vehicle production to Europe was found to provide slight improvements in several impact categories, due to the electricity supply chain being more renewable compared to the rest of the world. Nonetheless, a significant increase of Ionizing Radiation (9%) could be expected. Of all the policies tested, changes in the vehicle production stage were found to be the ones with the least relevant results.
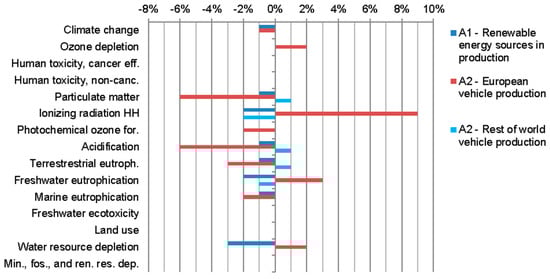
Figure 3.
Modification in impact categories by policies A1 to A2. Ionizing radiation human health (HH).
Figure 4 presents the results regarding changes in vehicle constitution (B1 to B3), which were found to generally lead to significant impact reductions. The use of smaller vehicles could lead to reductions between 6% and 11% in all impact categories, while the use of lighter materials would lead to similar reductions, between 3% and 15%. Nonetheless, the use of aluminum would result in a 47% increase in Mineral, fossil, and renewable resource depletion. The renewal of the fleet to the latest conventional vehicle technology was found to lead to the highest reductions of these sets of policies. In particular, the renewal would result in important reductions in the categories mostly associated with local pollutants.
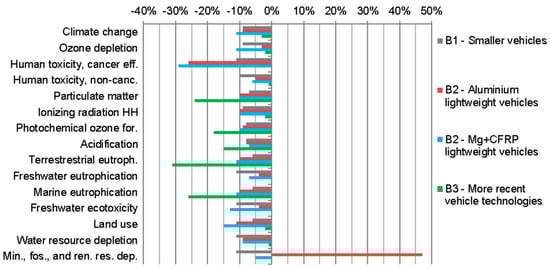
Figure 4.
Modification in impact categories by policies B1 to B3.
As for Figure 5, it portrays the changes in impact categories from the use of alternative energy sources for vehicle propulsion (C1 to C4). All policies were found to lead to reductions in climate change. The dieselization of the fleet or the shift to CNG would result in significant reductions in several impact categories. CNG, for example, would support a 22% reduction in ionizing radiation and 37% in photochemical ozone formation. Nonetheless, several impact categories would increase with these two policies, such as particulate matter for diesel and ozone depletion for natural gas.

Figure 5.
Modification in impact categories by policies C1 to C4.
The adoption of low level blends of biofuels in conventional vehicles achieves a 5% reduction in the climate change category. This reduction is significant but lower than the reductions obtained with other energy sources, smaller vehicles, or the use of lightweight materials in vehicles. On the other hand, the use of biofuels increases the impacts in several categories, namely with a 749% increase in impacts related to land use. Biofuels and electric vehicles both present this increasing trend of impacts, in spite of presenting the best results by lowering the impacts for the climate change and ozone depletion categories. In these two categories, biofuels allow a 46% and 39% reduction in the climate change and ozone depletion, while electric vehicles lead to 43% and 26% reductions, respectively.
In order to better assess the results of this work, the normalization factors of the Product Environmental Footprint [] were applied in order to display the results using a common reference impact. These normalization factors allow the environmental performance of a good or service to be assessed throughout its life cycle by considering supply chain activities (from extraction of raw materials, through production and use, to final waste management). Table 5 presents a summary and comparison of the impacts for each policy. The red color represents very relevant impacts; the orange represents relevant impacts; the grey slightly relevant impacts; and the remaining being of little relevance.
Table 5.
Normalized results for the considered policies.
The results of Table 5 show a total of 73 significant improvements considering the different policies and impact categories. Of these, 46 were obtained with the four policies centered in vehicle constitution (smaller vehicles, lightweight materials, and more recent vehicle technology). These policies result in less trade-offs and show significant impact reductions in the majority of categories. This is due to positive repercussions in the use, in the production, and the EoL of vehicles. However, it is not at all likely that a 100% implementation of smaller vehicles will occur, due to the variety of consumer needs and choices. Similarly, while the complete shift towards aluminum or Mg + CFRP should not be expected, a combination of the two (i.e., one or the other) may reach a high share of vehicles.
Another 25 improvements were obtained by the six policies regarding propulsion energy sources (dieselization, CNG, biofuels, and electric vehicles). These results are especially relevant in the reduction of climate change through the decreased or avoided use of fossil fuels in the vehicle usage stage. On the other hand, a significant increase in impacts is caused by the same propulsion energy source policies with 38 out of 40 adverse results. The adverse impacts in electric vehicles are related to metals such as copper and silver used in vehicle production and uranium and coal mining related to the electricity production chain. The adverse impacts in the use of biofuels are related to land use changes and fertilizers used in the soil. While electric vehicles are often identified as a key technology for the future of mobility, it expected that a portfolio of technologies will be responsible for providing mobility services. Therefore, the environmental impacts would lie somewhere between the results obtained for the individual scenarios. Furthermore, even if one technology is able to dominate the market in the future, the low rate of vehicle turnover and the expected changes in mobility services would result in very different environmental impacts due to significant changes in mobility needs.
The remaining 82 results showed very little changes in impacts. The overall results show that the least relevant measures are the ones targeting the vehicle production processes. This is particularly true for the energy used in their production, which is, coincidently, one of the few measures that could be fully implemented. Also with small influence is the incorporation of the maximum admissible biofuel blends for use in conventional vehicles, which result in increased impacts in several categories, while the objective of reducing climate change shows less reduction potential than, for example, dieselization or lightweight vehicles.
Analyzing the degree of change in impacts, the results rarely resulted in a drastic reduction of impacts, with the only exception in land use (with 0.003) and in electric vehicles and CNG vehicles (with 0.004). This is caused by the absence of biofuels use in these policies. Also, it is important to consider that a high-level blend of biofuels and electric vehicles almost results in half the indicator for climate change. This result is the main motivation behind these policies and their support from the EU. However, a high-level blend of biofuels use and electric vehicles more than doubles the impacts in eight categories, with biofuels increasing land use up to 8 times and electric vehicles increasing freshwater eutrophication up to 5 times. Regarding the categories considered very relevant (in red), for human toxicity cancer effects and freshwater ecotoxicity are accomplished with lightweight vehicles with a 0.773 reduction out of 2.701 and a 0.266 reduction out of 2.030, respectively.
In regards to water resource depletion and mineral, fossil, and renewable resource depletion, the greatest reduction is accomplished by the dieselization of the fleet, with a 0.944 reduction out of 8.042 and 0.173 reduction out of 1.330, respectively. Essentially, these policies result in decreased impacts for the production and EoL of vehicles caused by either a more sustainable materials choice or by the maximization of resources, considering that diesel vehicles usually show a longer useful lifetime.
4. Conclusions
An assessment and comparison of road passenger transport policies in the context of current European reality was performed through an integrated approach using the basket-of-products methodology and LCA. This resulted in a total of 156 modeling processes for the use stage and 22 for the production and EoL stage. Overall, the selected policies achieved good results, with almost a 2 to 1 ratio of positive versus adverse results.
The use of more recent vehicle technology shows a significant potential for reducing particulate matter, terrestrial eutrophication, and marine eutrophication, which are in line with the EU regulations regarding local pollutants. In any of those categories, only the CNG use shows better indicators. The use of CNG vehicles shows decreased impacts in eight other categories, including climate change, but an adverse impact in ozone depletion, which should be carefully addressed in light of the recent investment in this alternative energy source.
The promotion of diesel results in the third best result among all the policies for the climate change category because of the efficiency achieved in vehicle usage stage. Diesel vehicles also have a longer useful lifetime, which consequently results in fewer impacts in vehicle production. On the other hand, diesel vehicles have relevant increased impacts in terms of particulate matter effects. However, the association of diesel with recent vehicle technology and exhaust gas emission controls can help mitigate the adverse impacts.
A high-level blend of biofuels and electric vehicles both show very important adverse results in most categories, but the achieved reduction in climate change is the greatest among all policies. Generally, the more differentiated policies regarding the current road transport paradigm (CNG, biofuels, and electric vehicles use) are the ones resulting in the most evident reduction in GHG emissions, but also in the very significant rise for the categories that were already showing the worst results after normalization. This supports the need for careful planning regarding the large-scale implementation of those policies which are already supported by EU directives.
Considering the process contribution in the more relevant results, the highest impact increase is generally associated with the production or extraction of raw materials, as in venting and flaring operations in natural gas extraction, or the tailings of the mining industry of minerals, coal, or uranium, or, lastly, the feedstock production for biofuels. On the other hand, the most promising results for impact reductions are related to the use of exhaust treatment technologies, the parsimony in the use of mineral resources, and the avoided use of fossil fuels.
Overall, the impacts of several sustainability policies for the EU road passenger transport sector were quantified, providing vehicle manufacturers, consumers, and policy makers with very insightful knowledge regarding the deciding factors in the mobility value chain, for enabling more informed decision-making processes.
Acknowledgments
The authors acknowledge Fundação para a Ciência e Tecnologia for the Post-Doctoral financial support (SFRH/BPD/96459/2013), as well as project grants (SusCity Project, MITP-TB/C S/0026/2013). Thanks are due to the Fundação para a Ciência e Tecnologia through support from the IN+ Strategic Project UID/EEA/50009/2013.
Author Contributions
Filipe Paulino performed the life-cycle analysis of the different scenarios. André Pina conceived the life-cycle analysis model and worked on the paper. Patrícia Baptista coordinated the work, conceived the life-cycle analysis model and worked on the paper.
Conflicts of Interest
The authors declare no conflict of interest.
References
- EUROSTAT. Eurostat—Energy Data Navigation Tree. 2017. Available online: http://ec.europa.eu/eurostat (accessed on 15 November 2017).
- Eurostat. Energy, Transport and Environment Indicators; Eurostat: Luxembourg, 2015. [Google Scholar]
- European Environment Agency. European Union Emission Inventory Report 1990–2015 under the UNECE Convention on Long-Range Transboundary Air Pollution (LRTAP); No. 9; European Environment Agency: Copenhagen, Denmark, 2017. [Google Scholar]
- Del Pero, F.; Delogu, M.; Pierini, M. The effect of lightweighting in automotive LCA perspective: Estimation of mass-induced fuel consumption reduction for gasoline turbocharged vehicles. J. Clean. Prod. 2017, 154, 566–577. [Google Scholar] [CrossRef]
- Tian, X.; Geng, Y.; Zhong, S.; Wilson, J.; Gao, C.; Chen, W.; Yu, Z.; Hao, H. A bibliometric analysis on trends and characters of carbon emissions from transport sector. Transp. Res. Part D Transp. Environ. 2018, 59, 1–10. [Google Scholar] [CrossRef]
- EU. Regulation (EC) No. 715/2007 of the European Parliament and of the Council of 20 June 2007 on Type Approval of Motor Vehicles with Respect to Emissions from Light Passenger and Commercial Vehicles (Euro 5 and Euro 6) and on Access to Vehicle Repair and Mai; EU: Brussels, Belgium, 2007. [Google Scholar]
- European Parliament. Directives Directive 2009/28/EC of the European Parliament and of the Council of 23 April 2009 on the Promotion of the Use of Energy from Renewable Sources; No. 1; European Parliament: Brussels, Belgium, 2009. [Google Scholar]
- BMW. BMW Group Werk Leipzig. Available online: https://www.bmwgroup-werke.com/leipzig/de.html (accessed on 4 January 2018).
- Rai, H.B.; van Lier, T.; Meers, D. Improving urban freight transport sustainability: Policy assessment framework and case study. Res. Transp. Econ. 2017, 64, 26–35. [Google Scholar]
- Makarova, I.; Pashkevich, A.; Shubenkova, K. Ensuring sustainability of public transport system through rational management. Procedia Eng. 2017, 178, 137–146. [Google Scholar] [CrossRef]
- Yan, X.; Santos, G.; Carey, C.; Behrendt, H.; Holdway, A.; Maconi, L.; Owen, N.; Shirvani, T.; Teytelboym, A. Future of Mobility Roadmap Ways to Reduce Emissions While Keeping Mobile Executive Summary; University of Oxford: Oxford, UK, 2010. [Google Scholar]
- Bauer, C.; Hofer, J.; Althaus, H.-J.; Del Duce, A.; Simons, A. The environmental performance of current and future passenger vehicles: Life cycle assessment based on a novel scenario analysis framework. Appl. Energy 2015, 157, 871–883. [Google Scholar] [CrossRef]
- Van Mierlo, J.; Messagie, M.; Rangaraju, S. Comparative environmental assessment of alternative fueled vehicles using a life cycle assessment. Transp. Res. Procedia 2017, 25, 3435–3445. [Google Scholar] [CrossRef]
- Chłopek, J.; Lasocki, Z. Comparison of the environmental impact of an electric car and a car with an internal combustion engine in Polish conditions using life cycle assessment method. Combust. Engines 1922, 52, 192–201. [Google Scholar]
- Hawkins, T.R.; Singh, B.; Majeau-Bettez, G.; Strømman, A.H. Comparative environmental life cycle assessment of conventional and electric vehicles. J. Ind. Ecol. 2013, 17, 53–64. [Google Scholar] [CrossRef]
- Duarte, G.; Rolim, C.; Baptista, P. How battery electric vehicles can contribute to sustainable urban logistics: A real-world application in Lisbon, Portugal. Sustain. Energy Technol. Assess. 2016, 15, 71–78. [Google Scholar] [CrossRef]
- Rolim, C.C.; Baptista, P.C.; Farias, T.L.; Rodrigues, Ó. Electric vehicle adopters in Lisbon: Motivation, utilization patterns and environmental impacts. EJTIR Issue 2014, 14, 225–239. [Google Scholar]
- Helms, U.; Lambrecht, H.; Höpfner, U. Energy Savings by Light-Weighting—Final Report; Institute for Energy and Environmental Research: Heidelberg, Germany, 2003. [Google Scholar]
- Raugei, M.; Morrey, D.; Hutchinson, A.; Winfield, P. A coherent life cycle assessment of a range of lightweighting strategies for compact vehicles. J. Clean. Prod. 2015, 108, 1168–1176. [Google Scholar] [CrossRef]
- Kim, H.C.; Wallington, T.J. Life-Cycle Energy and Greenhouse Gas Emission Benefits of Lightweighting in Automobiles: Review and Harmonization. Environ. Sci. Technol. 2013, 47, 6089–6097. [Google Scholar] [CrossRef] [PubMed]
- Mayyas, A.T.; Qattawi, A.; Mayyas, A.R.; Omar, M.A. Life cycle assessment-based selection for a sustainable lightweight body-in-white design. Energy 2012, 39, 412–425. [Google Scholar] [CrossRef]
- Hakamada, M.; Furuta, T.; Chino, Y.; Chen, Y.; Kusuda, H.; Mabuchi, M. Life cycle inventory study on magnesium alloy substitution in vehicles. Energy 2007, 32, 1352–1360. [Google Scholar] [CrossRef]
- Du, J.; Han, W.; Peng, Y. Life cycle greenhouse gases, energy and cost assessment of automobiles using magnesium from Chinese Pidgeon process. J. Clean. Prod. 2010, 18, 112–119. [Google Scholar] [CrossRef]
- BMW. BMW I: The Future of Mobility. Available online: https://www.bmw.pt/pt/topics/fascination-bmw/bmw-i/concept.html (accessed on 4 January 2018).
- Alves, C.; Silva, A.J.; Reis, L.G.; Freitas, M.; Rodrigues, L.B.; Alves, D.E. Ecodesign of automotive components making use of natural jute fiber composites. J. Clean. Prod. 2010, 18, 313–327. [Google Scholar] [CrossRef]
- JRC. Life Cycle Indicators Basket-of-Products: Development of Life Cycle Based Macro-Level Monitoring Indicators for Resources, Products and Waste for the EU-27; JRC: Tokyo, Japan, 2012. [Google Scholar]
- JRC. ILCD Handbook: Recommendations for Life Cycle Impact Assessment in the European Context; JRC: Tokyo, Japan, 2011. [Google Scholar]
- Gkatzoflias, D.; Kouridis, C.; Ntziachristos, L.; Samaras, Z. COPERT 4, Computer Programme to Calculate Emissions from Road Transport; ETC/AEM; European Environment Agency: Copenhagen, Denmark, 2014. [Google Scholar]
- Dieselnet, Emission Standards. Europe: Cars and Light Trucks. Available online: https://www.dieselnet.com/standards/eu/ld.php#stds (accessed on 27 January 2018).
- Dieselnet. Emission Standards. Europe: Heavy-Duty Truck and Bus Engines. Available online: https://www.dieselnet.com/standards/eu/hd.php#stds (accessed on 27 January 2018).
- GHK. A Study to Examine the Benefits of the End of Life Vehicles Directive and the Costs and Benefits of a Revision of the 2015 Targets for Recycling, Re-Use and Recovery under the ELV Directive; GHK: Birmingham, UK, 2006. [Google Scholar]
- Eurostat. Eurostat—Waste Data Navigation Tree; Eurostat: Luxembourg, 2014. [Google Scholar]
- EU. Directive 2000/53/EC of the European Parliament and of the Council of 18 September 2000 on End-of Life Vehicles; EU: Brussels, Belgium, 2000. [Google Scholar]
- Ecoinvent v3. Documentation of Changes Implemented in Ecoinvent Database 3.0 (2013.09.04). Available online: http://www.ecoinvent.org/files/report_of_changes_ecoinvent_2.2_to_3.0_20130904.pdf (accessed on 4 September 2013).
- International Renewable Energy Agency. Renewable Energy Cost Analysis: Wind Power; International Renewable Energy Agency: Abu Dhabi, UAE, 2012. [Google Scholar]
- Cheah, L.W. Cars on a Diet: The Material and Energy Impacts of Passenger Vehicle Weight Reduction in the US; Massachusetts Institute of Technology: Cambridge, MA, USA, 2010. [Google Scholar]
- Du, J.D.; Han, W.J.; Peng, Y.H.; Gu, C.C. Potential for reducing GHG emissions and energy consumption from implementing the aluminum intensive vehicle fleet in China. Energy 2010, 35, 4671–4678. [Google Scholar] [CrossRef]
- Keoleian, G.A.; Sullivan, J.L. Materials challenges and opportunities for enhancing the sustainability of automobiles. MRS Bull. 2012, 37, 365–373. [Google Scholar] [CrossRef]
- Delogu, M.; Del Pero, F.; Pierini, M. Lightweight design solutions in the automotive field: Environmental modelling based on fuel reduction value applied to diesel turbocharged vehicles. Sustainability 2016, 8, 1167. [Google Scholar] [CrossRef]
- Koffler, C.; Rohde-Brandenburger, K. On the calculation of fuel savings through lightweight design in automotive life cycle assessments. Int. J. Life Cycle Assess. 2010, 15, 128–135. [Google Scholar] [CrossRef]
- Wright, L.; Boundy, S.C.D.B.; Diegel, S.W. Appendix A—Conversions, in Biomass Energy Data Book; Oak Ridge National Laboratory: Oak Ridge, TN, USA, 2011.
- Hsieh, W.-D.; Chen, R.-H.; Wu, T.-L.; Lin, T.-H. Engine performance and pollutant emission of an SI engine using ethanol–gasoline blended fuels. Atmos. Environ. 2002, 36, 403–410. [Google Scholar] [CrossRef]
- Knothe, G. The Biodiesel Handbook, 1st ed.; Taylor & Francis: Oxford, UK, 2005. [Google Scholar]
- Karna, P. Carbon Footprint of the Raw Materials of an Urban Transit Bus; Lahden Ammattikorkeakoulu: Lahti, Finland, 2012. [Google Scholar]
- Cooney, G.; Hawkins, T.R.; Marriott, J. Life cycle assessment of diesel and electric public transportation buses. J. Ind. Ecol. 2013, 17, 689–699. [Google Scholar] [CrossRef]
- EU. Product Environmental Footprint Pilot Guidance, Guidance for the Implementation of the EU Product Environmental Footprint (PEF) during the Environmental Footprint (EF) Pilot Phase—Version 4.0; EU: Brussels, Belgium, 2014. [Google Scholar]
© 2018 by the authors. Licensee MDPI, Basel, Switzerland. This article is an open access article distributed under the terms and conditions of the Creative Commons Attribution (CC BY) license (http://creativecommons.org/licenses/by/4.0/).