
Ceramic Materials Containing Volcanic Ash and Characterized by Photoluminescent Activity


1
Department of Mechanical, Energy and Management Engineering, University of Calabria, I-87036 Rende, Italy
2
Department of Environmental Engineering, University of Calabria, I-87036 Rende, Italy
*
Author to whom correspondence should be addressed.
Environments 2023, 10(10), 172; https://doi.org/10.3390/environments10100172
Submission received: 23 September 2023
/
Revised: 26 September 2023
/
Accepted: 27 September 2023
/
Published: 4 October 2023
Abstract
:The present work was aimed at investigating the possibility to produce bricks using volcanic ash from the Etna volcano and with photoluminescent properties. The volcanic ash was analyzed using X-ray diffractometry, scanning electron and energy dispersive X-ray microscopy. Mixtures with 0%, 10% and 30% of volcanic ash were prepared and fired at 950 °C for 14 h. Their mechanical properties, dynamic modulus of elasticity, drying linear retraction, capillary water absorption and water absorption were measured. The obtained results show that increasing the percentage of volcanic ash in the initial mixture results in a decrease in the measured dynamic modulus of elasticity, in a greater dimensional stability and in a lower weight loss upon firing. Mechanical properties are negatively affected by volcanic ash, with a compressive strength of 11 MPa obtained with mixtures with 30% of it. A decrease in the absorption of water was also observed upon increasing the amount of volcanic ash in the mixes. Brick surfaces with intense photoluminescent activity were obtained. The produced bricks meet the criteria required by the for bricks that can be used in normal weathering and absorption criteria for second-class brick.
1. Introduction
Volcanic ash is abundant in Italy due to the eruptions of the Etna volcano in Sicily, characterized by vigorous and frequent explosive activity. The fallout of volcanic ash causes air and vehicular traffic problems; the clogging of drainage systems; considerable damage to agriculture; and eye, skin and respiratory tract irritation [1,2,3,4]. Conventionally it is classified as waste (code 200303 or code 170504 of the European Waste Catalogue), and its disposal, which generally follows the open landfill route, is far from being an optimal recovery practice and requires a massive amount of money, around 120 EUR/ton [5].
Furthermore, its actual management collides with the increasingly stricter environmental legislation that highly discourages the landfill disposal and forces us toward recovery practices and the valorization of residues in the framework of the circular economy [6,7].
Volcanic ash forms during explosive volcanic activity because of nonmagmatic rock fragments from the walls of the magma conduit and solidified fragments of erupted magma thrown up into the atmosphere [8]. It is composed of fine-sized particles with mineralogy, morphology and chemical properties strictly depending on both the magma configuration and the eruption conditions [9]. It is characterized by a structure that ranges from nearly amorphous to fully crystalline [10], a color from black to red and a porous or vesicular microstructure [11]. Its composition is mainly dominated, in terms of oxides, by SiO2, CaO, Fe2O3, MgO, K2O and Na2O, with a wide spectrum of proportions [12].
Volcanic ash has been investigated as a potential starting material for several applications, depending on its mineralogy, chemical composition and particle size distribution. It has been proposed for environmental applications [11], as a partial replacement of cement [12], as an aggregate in lightweight concrete and cellular blocks [13], as a geopolymer [14] and as a lunar soil simulant [15].
In recent years, emphasis was put on manufacturing bricks with an improved environmental impact by identifying alternative preparation routes, such as hydrothermal and microwave treatments [16,17,18,19] and recycling of wastes [20,21,22]. However, a limited number of works in the literature have been found related to the use of volcanic ashes to produce bricks or tiles.
Serra et al. [10] found that the addition of volcanic ash acts as a melting material. Belfiore et al. [23] mixed trachybasaltic ashes from the Mount Etna volcano (20% vol.) and clay (80% vol.) and fired them at 960 °C for about 60 h to produce ceramic tiles. Their physical–mechanical properties resulted in being relatively comparable to those of the reference product. In a recent study, Cultrone [24] used clay and 10–20% (by weight) of volcanic ash from Etna, without sieving or crushing them, to produce brick fired at 800, 950 and 1100 °C for 3 h. He evidenced a reduction in the mechanical strength with respect to the reference with the increasing ash content, but always within the limits of acceptability. A partial or full melting at the higher firing temperatures, a good bonding of the ash particles within the matrix and a perceivable change in color in ash containing bricks were also observed.
In addition to the use of waste materials, another important frontier in the construction sector is that of the preparation of new multifunctional materials. This is the case for cement or ceramic with photocatalytic/piezoelectric properties [25,26,27,28]. In recent years, construction products with photoluminescent properties have also been produced using inactive Europium/Strontium aluminates, silicates and carbonates [29,30]. The luminescent photo materials, if subjected to solar or artificial light, charge and then light up in the dark, promoting new strategies for energy saving. They have been used to build roads, cycle paths, etc.
The present research offers a further contribution to the evaluation of the effect of partially replacing clay with volcanic ash to produce bricks, thus extending the actual limited literature. Furthermore, the goal of the research was to find the best experimental conditions for providing the prepared bricks with an effective and durable photoluminescent property. The final product, which combines an improved environmental impact with an innovative functionality, while providing adequate mechanical properties, opens up new markets and applications.
2. Materials and Methods
2.1. Materials
A commercial filtered and degassed clay, a volcanic ash, a photoluminescent powder and a ceramic glaze were used to produce bricks. Bricks were manufactured by Keramos, a local pottery in Rogliano, in the province of Cosenza.
- A commercial filtered and degassed clay, AFD-000055-Argilla Tornio, was purchased from the Colorobbia Italia S.P.A., Vinci, Italy. It is the clay commonly used by the potters for the manufacturing of their marketed products.
- Hydrochloric acid (ACS reagent 37%) and sodium hydroxide (reagent grade, ≥98%, pellets (anhydrous)) were purchased from Sigma Aldrich, Milano, Italy.
- The volcanic ash (VA) was collected from the slopes of the Etna volcano (Sicily, Italy) after the eruption in 2020.
- The commercial photoluminescent powder used in the present investigation (ZYYINI- MYX-RAG-JM04576-03-FBA) was purchased from ZYYINI, Shenzhen, China
- A ceramic glaze purchased from the Colorobbia Italia S.P.A group was used to fix the photoluminescent powder onto the surface of the specimens. Glaze generates, after firing, a transparent, colorless and waterproofing thin glass coating on the surface of the ceramic material.
2.2. Methods
Clay, volcanic ash and bricks were analyzed using a Rigaku MiniFlex 600 X-ray diffractometer (Rigaku Corporation, Tokyo, Japan) with CuKα radiation generated at 20 mA and 40 KV. Powdered samples were scanned at 0.02 2θ step, at a rate of 1°/min between 5°–20° and 50° 2θ. Profex, a free and open-source software, was used to identify mineral phases and implement the Rietveld refinement of the crystalline phases by matching to those in the included COD database [31].
A Vanderkamp VK200 hardness tester (Varian, Inc., Weston Parkway Cary, US) was used measure the crush strength of the volcanic ash, measured by testing 100 particles.
LOI550 and LOI950 were used to estimate the organic and inorganic carbon of clay [32]. A muffle furnace (model Hobevsal HD200) and a precision balance (model Mettler AC 100, 0.0001 g precision) were utilized in the campaign. LOI550 was measured by burning 4 samples of clay, 20 g each, after drying them at 105 °C to constant weight, at 550 °C for 4 h. It was calculated as follows:
where WS105 represents the dry weight of the sample after heating to 105 °C, and WS550 is the dry weight of the sample after heating to 550 °C (both in g).
In the second step, the carbon dioxide evolved from carbonate is calculated as follows:
where WS550 represents the dry weight of the sample after heating at 550 °C, and WS950 represents the dry weight of the sample after heating at 950 °C for 3 h (both in g).
The thermal decomposition of the clay was investigated up to 730 °C also by means of thermogravimetric (TG) and differential scanning calorimetry (DSC) analyses to evaluate the different contributions to the measured LOI550. A Netzsch STA 409, static air, a heating rate of at 10 °C/min from 35 °C up to 730 °C and around 15 mg of sample were used to carry out the analyses.
The particles size distribution, on a volume basis, was measured using a Mastersizer 2000 (Malvern Panalytical Ltd. Malvern, UK)
Morphological characterization was carried out through scanning electron microscopy (SEM) and energy dispersive X-ray (EDX), using a ZEISS crossbeam 350 instrument (ZEISS group, Jena, Germany). EDX data were analyzed using APEX software. A SEM analysis of bricks was carried out on polished cross-sections that were obtained by cutting pieces of bricks mounted on a cold curing resin. Samples were sputtered with a thin C conductive layer to reduce charging effects.
The amorphous content of VA was determined via the dissolution of volcanic ash in NaOH, followed by HCl solution, according to standard ASTM C289 [26] and French standard XP P18-594 [8,33,34]. VA firing following the same thermal treatment of the bricks was also analyzed using X-ray diffractometry (XRD).
Four different mix compositions (reported in Table 1) were investigated. Each batch had a total weight of 5 kg. The predetermined weights of air-dried clay, volcanic ash and water were mixed and then shaped into specimens of 16 cm × 4 cm × 4 cm and 10 cm × 5 cm × 2 cm to carry out compression and bending tests and a capillary water absorption test and produce photoluminescent tiles.
Once shaped, all the specimens were placed on supports and sundried in the open air for 4 days. They were repeatedly rotated to favor the most homogeneous drying process and to avoid any deformation and breakage. Drying was carried out before the firing stage to allow for the loss of most of the water content of mix, thus preventing the swelling or bloating of the samples caused by the expansion of entrapped water during the firing step [35]. After drying, specimens were fired using an oven produced by the company ITALFORNI Pesaro S.r.l. (Pesaro, Italy) for 24 h. The temperature was gradually increased in the first 10 h to reach 950 °C. The low heating rate of the firing process avoids the formation of an impermeable vitrified outer skin that hinders the release of produced gases, such as CO2, from the bulk of the brick [35]. The final temperature was held for 14 h. A slow cooling was then carried out up to 250 °C, followed by a final faster cooling step up to room temperature (≈25 °C)
The dimensional linear retraction (DLR) was calculated by Equation (3):
where Ls is the initial length of the ceramic specimens, while Lq is the length after firing [36].
The dynamic modulus of elasticity (Ed, in GPa) of the specimens was calculated using Equation (4):
where νd is the Poisson’s modulus (equal to 0.20), ρ is the specific mass at hardened state (kg/m3) and v the velocity pulse (in m/s) measured using an Ultrasonic Digital Indicator Tester [37].
The sorptivity of bricks (S) was calculated by collecting the weight gain by unit area (A) of four specimens for each mix at regular intervals of immersion (t) and plotting them according to the following equation [38,39]:
A = a0 + St0.5
The absorption of water expressed as a percentage of the weight of the dry brick (Aw) was calculated as follows [40,41]:
where m1 = the mass of the dry brick, and m2 = the mass of the wet brick after the immersion.
The flexural strength was measured by applying a three-point bending test to ten prismatic specimens with dimensions of 4 × 4 × 16 mm, according to UNI-EN 196-1 [37]. The compressive strength was then measured using the twenty prism-half specimens generated from the bending test, according to UNI-EN 196-1 [42]. The selected geometry is different from that proposed by the European standard EN 771-2, British Standard BS 3921:1985 and ASTM C62-13 for bricks [43,44,45].
The 10 cm × 5 cm × 2 cm fired specimens were used to test the photoluminescent properties.
To find the best experimental conditions for an effective photoluminescent surface activation, two different application methods were used.
Method (A): A 2 wt% aqueous photoluminescent suspension was brushed on the surface of the fired ceramic support (Figure 1a). The support was then soaked in the ceramic glaze mixture (60 wt% of water and 40 wt% of glaze) for a couple of seconds and then pulled up and left to drain to eliminate the excess of product (Figure 1b).
Method (B): The photoluminescent powders, in percentage of 2 wt%, were added to the ceramic glaze mixture. The fired ceramic supports were soaked in it for a couple of seconds and then pulled up and left to drain to eliminate the excess of product.
Finally, all the glazed specimens functionalized with photoluminescent agents using method (A) and (B), were fired again using an oven produced by the company ITALFORNI Pesaro S.r.l. for 24 h. The temperature was gradually increased in the first 10 h to reach 950 °C. The final temperature was held for 14 h. A slow cooling was then carried out up to 250 °C, followed by a final faster cooling step up to room temperature (≈25 °C).
3. Results and Discussion
Figure 2 shows an XRD analysis of clay with the identified main crystalline phases, and Table 2 reports their weight percentages as obtained by implementing the Rietveld method, using Profex software. Calcite, muscovite, halloysite and albite are the most abundant minerals in clay.
The measured LOI550 of clay was equal to 4.2 ± 0.2 wt%, whereas LOI950 resulted in being equal to 8.4 ± 0.3 wt%. The thermogravimetry (TG) and differential scanning calorimetry (DSC) analyses of the dried clay were used to evaluate the different contributions to the measured LOI550. The results are shown in Figure 3. The initial endothermic peaks up to 180 °C in the DSC curve are associated with the loss of free and chemically bonded water (mass loss is about 0.58 wt%). The endothermic peaks centered at about 505 °C and 590 °C are associated with the dehydroxylation of phyllosilicates (mass loss between 180 °C and 550 °C is about 3.2 wt%) [24]. The endothermic peak that starts at 700 °C is produced by the decomposition of the carbonates. No exothermic peaks associated with the combustion of organic matter were identified. It can be concluded that most of LOI550 arises from the water loss and dehydroxylation of clay components.
Figure 4 shows the particle size distribution of as-received volcanic ash. It ranges between 0.5 and 2.7 mm.
The morphology and surface chemical composition of the volcanic ash were analyzed by SEM-EDX (Figure 5 and Table 3). The high silicon and aluminum contents of VA are consistent with their use for ceramic application. VA’s high content of iron discourages its a priori use in the production of porcelain and white ceramics.
Volcanic ash is characterized by irregular and jagged particles containing cavities on the surface and inside. They are referred to as vesicles, and they are produced by the expansion of magmatic gas before the enclosing magma solidifies [9,46].
Before its use, the VA was crushed. Its new particles size distribution, on a volume basis, is reported in Figure 6
Crushed volcanic ash is characterized by a D(0.1) of 122.16 μm, a D(0.5) of 463.52 μm and a D(0.9) of 881.644 μm.
Figure 7 shows the XRD analysis of powdered VA with the identified main crystalline phases, and Table 4 reports their weight percentages, as obtained by implementing the Rietveld method, using Profex software. Albite, stishovite and augite are the most abundant minerals. The broad hump between 18° and 40° (2θ) is attributed to the reactive amorphous silica-rich phase [8].
The VA amorphous phase content, as determined according to the standard ASTM C289 [26] and French Standard XP P18-594 [8,33], was equal to 24 wt% ± 1. This is potentially significant, since the amorphous phase helps decrease the melting temperature of VA, which is usually around 1100–1200 °C [8,36,47].
The VA showed a poor and highly dispersed crush strength. It resulted in being equal to 15.5 N (Standard Deviation = 6.1 N).
To investigate the crystallization process that VA faces upon firing, 100 g of volcanic ash was fired in an oven, using the same heating/cooling procedure used for bricks. An X-ray diffractometric analysis was carried out on crushed and fired VA, and the results are reported in Figure 8. In the inset of Figure 8, images of VA as is and after crushing and firing are shown. The firing process promoted a change in color from black to brownish due to the oxidation of Fe-containing phases [48,49]. The results were analyzed by implementing the Rietveld method, using Profex software (Table 5). The main crystalline phases after the thermal treatment in the furnace are silica, augite and magnetite. The XRD plot of the fired sample showed an increase in the intensity and number of peaks that is related to the complexity of minerals formed during the thermal treatment through recrystallisation and sintering, as also reported by Leonelli et al. [50].
The commercial photoluminescent powder used in the present investigation (ZYYINI- MYX-RAG-JM04576-03-FBA) is a white powder under the sunlight (Figure 9A). After charging by exposure to a light source (sunlight, electric or UV light), it lights up in the darkness (Figure 9B), without limit in recharges. The powder is made up of inactive Europium/Strontium aluminates, silicates and carbonates, as confirmed by elements detected by SEM-EDX analysis (Table 6).
The mixtures with 0%, 10% and 30% of volcanic ash after the addition of water were molded, as represented in Figure 10a–c. The mix with 50 wt% of volcanic ash failed to provide a workable and moldable mixture. Thus, it was excluded from the following experimental campaign (Figure 10d). The behavior can be explained by the fact that volcanic ash does not possess intrinsic plasticity, and in the fresh state, it mainly plays the role of a nonplastic material or a temper providing support for the body [38]. The maximum percentage of clay replacement is in accordance with the previously reported literature [10,23,24]. Furthermore, the produced bricks show a texture that becomes coarser with the increase in volcanic ash content.
After firing, the weight loss and dimensional changes of all the prepared specimens were measured. Figure 11 shows the average length changes of the specimens after firing.
The data show that increasing the percentage of volcanic ash in the initial mixture results in greater dimensional stability after firing. Samples with 0%, 10% and 30% of volcanic ash showed a dimensional percentage variation (DLR) equal to 5.9%, 4.1% and 2.9%, respectively, all in the range of the measured values in bricks [30,39]. Student’s t-test was carried out to verify whether differences shown in the dimensional changes of specimens at different VA contents are significant with respect to bricks produced using only clay. The level of significance (α) was set to 0.05. The addition of VA showed a significant statistical effect (p = 0.04) only when 30 wt% of VA was used. In general, for solely clay bricks, the linear shrinkage is associated with the amount of glassy phase produced during firing, because it enters and fills the porosity in the microstructure of the ceramic; dehydroxylation of a few clay minerals (mainly 1:1 ones); decomposition of carbonates; and collapse of the crystal structure of clay minerals [51]. Therefore, a densification occurs that determines the matrix shrinkage and improves the mechanical and absorption properties of brick [52]. The decrease in the DLR with the increasing amount of VA can be explained in terms of its lower contribution to the densification process; with respect to clay, VA densification is the result of the recrystallisation, during the sintering, of its low-melting-temperature glassy components. The weight loss of bricks after firing was also measured, and the results are reported in Figure 12.
The bricks produced without volcanic ash showed a weight loss around 16 wt%, a value that lies in the range of those reported in the scientific literature [35]. Moreover, Figure 11 shows that the weight loss after firing decreased with the increasing the percentage of clay replacement with volcanic ash in the mixes. Student’s t-test was carried out to verify whether differences shown in the weight loss of specimens at different VA contents are significant with respect to bricks produced using only clay. The level of significance (α) was set to 0.05. The replacement of clay with 10 wt% and 30 wt% of VA showed a highly significant statistical effect (p < 0.001 in both the cases). Such a trend confirms that the measured weight loss of bricks is mainly associated with the inorganic and carbonaceous substances in clay being burnt off during the firing process and dehydroxylation reaction in clay [53].
Figure 13 shows the flexural and compressive strength values of the produced specimens.
The addition of volcanic ash even in a low percentage determines a degradation of mechanical properties. This is most likely linked to the existence of inconsistent points due to the presence of volcanic ash fragments only partially melted and weakly joined to the clay matrix. The addition of 10 wt% of volcanic ash reduced the compressive and flexural strength by 57% and 59%, respectively. The addition of 30 wt% of VA led to a further decline in mechanical properties, with a decrease of around 66% for both the compressive and compressive strength. Student’s t-test was carried out to verify whether differences shown in the weight loss of specimens at different VA contents are significant with respect to bricks produced using only clay. The level of significance (α) was set to 0.05. The replacement of clay with 10 wt% and 30 wt% of VA showed a highly significant statistical effect on mechanical properties (p < 0.001 in both cases) However, the obtained values of compressive strength are higher than those required by the European Standard EN 771-2 [43] and the British Standard BS 3921:1985 [44], i.e., 5 MPa and 5.2 MPa, respectively. Furthermore, all the tested mixes succeed in providing compressive strengths higher than the minimum value required by ASTM C62-13 [45] for bricks used in normal weathering, equal to 10.34 MPa. The prepared bricks with VA failed to exceed the limit value of 17.23 MPa required by ASTM C62-13 [45] for their use in moderate weathering.
Our findings are also slightly lower than those obtained by Cultrone [24] at 950 °C, with compressive strength values around 21.35 MPa with 10 wt% of VA. The texture, mineralogy and dynamic modulus of elasticity of bricks were thus analyzed to explain the obtained results.
In Figure 14, the SEM-EDX analyses of the cross-section of the B sample are reported. As can be observed, sample B shows a dense microstructure. Isolated pores can be identified. Minerals such as alkali feldspars (Figure 14A and Table 7), quartz (Figure 14B and Table 7) and mica/illite (Figure 15C and Table 7) were identified.
The XRD pattern of the powdered B specimens, the main crystalline phases and their weight percentages as obtained by implementing the Rietveld method, using Profex software, are reported in Figure 15 and Table 8. Augite, anorthoclase, quartz and hematite are the most abundant minerals in B bricks, thus confirming the EDX findings. Anorthoclase belongs to the group of alkali feldspars. Bearing in mind the mineralogical composition of the used clay, it is likely that it was produced by the reaction of clinochlore with illite/mica, calcite and quartz upon firing up to 950 °C [54].
In Figure 16, the SEM-EDX analyses of the cross-section of the powdered BVA30 sample are reported. VA can be clearly identified, thus meaning that they only marginally melted. Furthermore, the cutting and polishing processes highlighted the poor bond between the clay matrix and VA particles as a clean cracking occurred at the edge of VA. Several cracks and voids are also visible in the VA. The present outcome differs from that of Cultrone et al. [24], who found that, at the same firing temperature, most of VA partially melted and bonded to the clay matrix. The cross-section of VA particles is characterized by several crystals embedded in the amorphous region. Figure 16A and Table 9 provides a local composition of the amorphous region, mainly consisting of the Si/Al/Fe domain. The compositions that were obtained by EDX analysis of the crystals analyzed in Figure 16B,C and reported in Table 9 are congruent with those of clinopyroxene and plagioclase groups, respectively. The findings are supported by the results of XRD analysis carried out on fired VA.
The XRD pattern of the powdered BVA30 specimens, the main crystalline phases and their weight percentages, as obtained by implementing the Rietveld method, using Profex 5.2 software, are reported in Figure 17 and Table 10. Augite, albite high_k_33 and stishovite are the most abundant minerals in BVA30 bricks. Interestingly, muscovite and calcite are still present, meaning that decomposition/reaction of those phases is slowed by VA. Similar behavior was found by Cultrone et al. [24]. A reasonable explanation is that VA, which was found to melt only marginally in the tested operative condition, is an obstacle to the diffusion of CO2. As a consequence, its partial pression increases and prevents the further decomposition of CaCO3 particles [55].
Figure 18 report the results obtained on the absorption of water as a function of time tested on B, BVA10 and BVA30 samples.
Three samples were tested for each system, and the results obtained represent an average of the values obtained.
Table 11 summarizes sorptivity as obtained by experimental data fitted using Equation (1) and water absorption values.
Interestingly, as shown in Figure 17 and reported in Table 11, the addition of volcanic ash lowers the sorptivity values and hinders the absorption of water. Similar findings were reported by Cultrone [24], and they were related to the fact that volcanic ash altered the pore size distribution toward larger dimensions, thus not favoring the capillary absorption of water, and lowered the degree of interconnection between the pores. However, sorptivity and water absorption are greater in BVA30 than in BVA10. In this case, the abovementioned effect can be partially hindered by the further deterioration of the mechanical properties of the bricks. The percentage of absorbed water in the produced bricks with VA meets the second-class brick water absorption criteria (<20%) according to ASTM C20-00 [56]. As expected, a strong correlation is observed between the compressive strength and the dynamic elastic modulus values (Table 12), with the measured dynamic modulus of elasticity decreasing by 24% and 39% with the addition of 10 wt% and 30 wt% of VA, respectively.
The apparent density of the bricks (Table 12) slightly decreases with the addition of volcanic ash, but all the values are in the range established for good-quality brick [57].
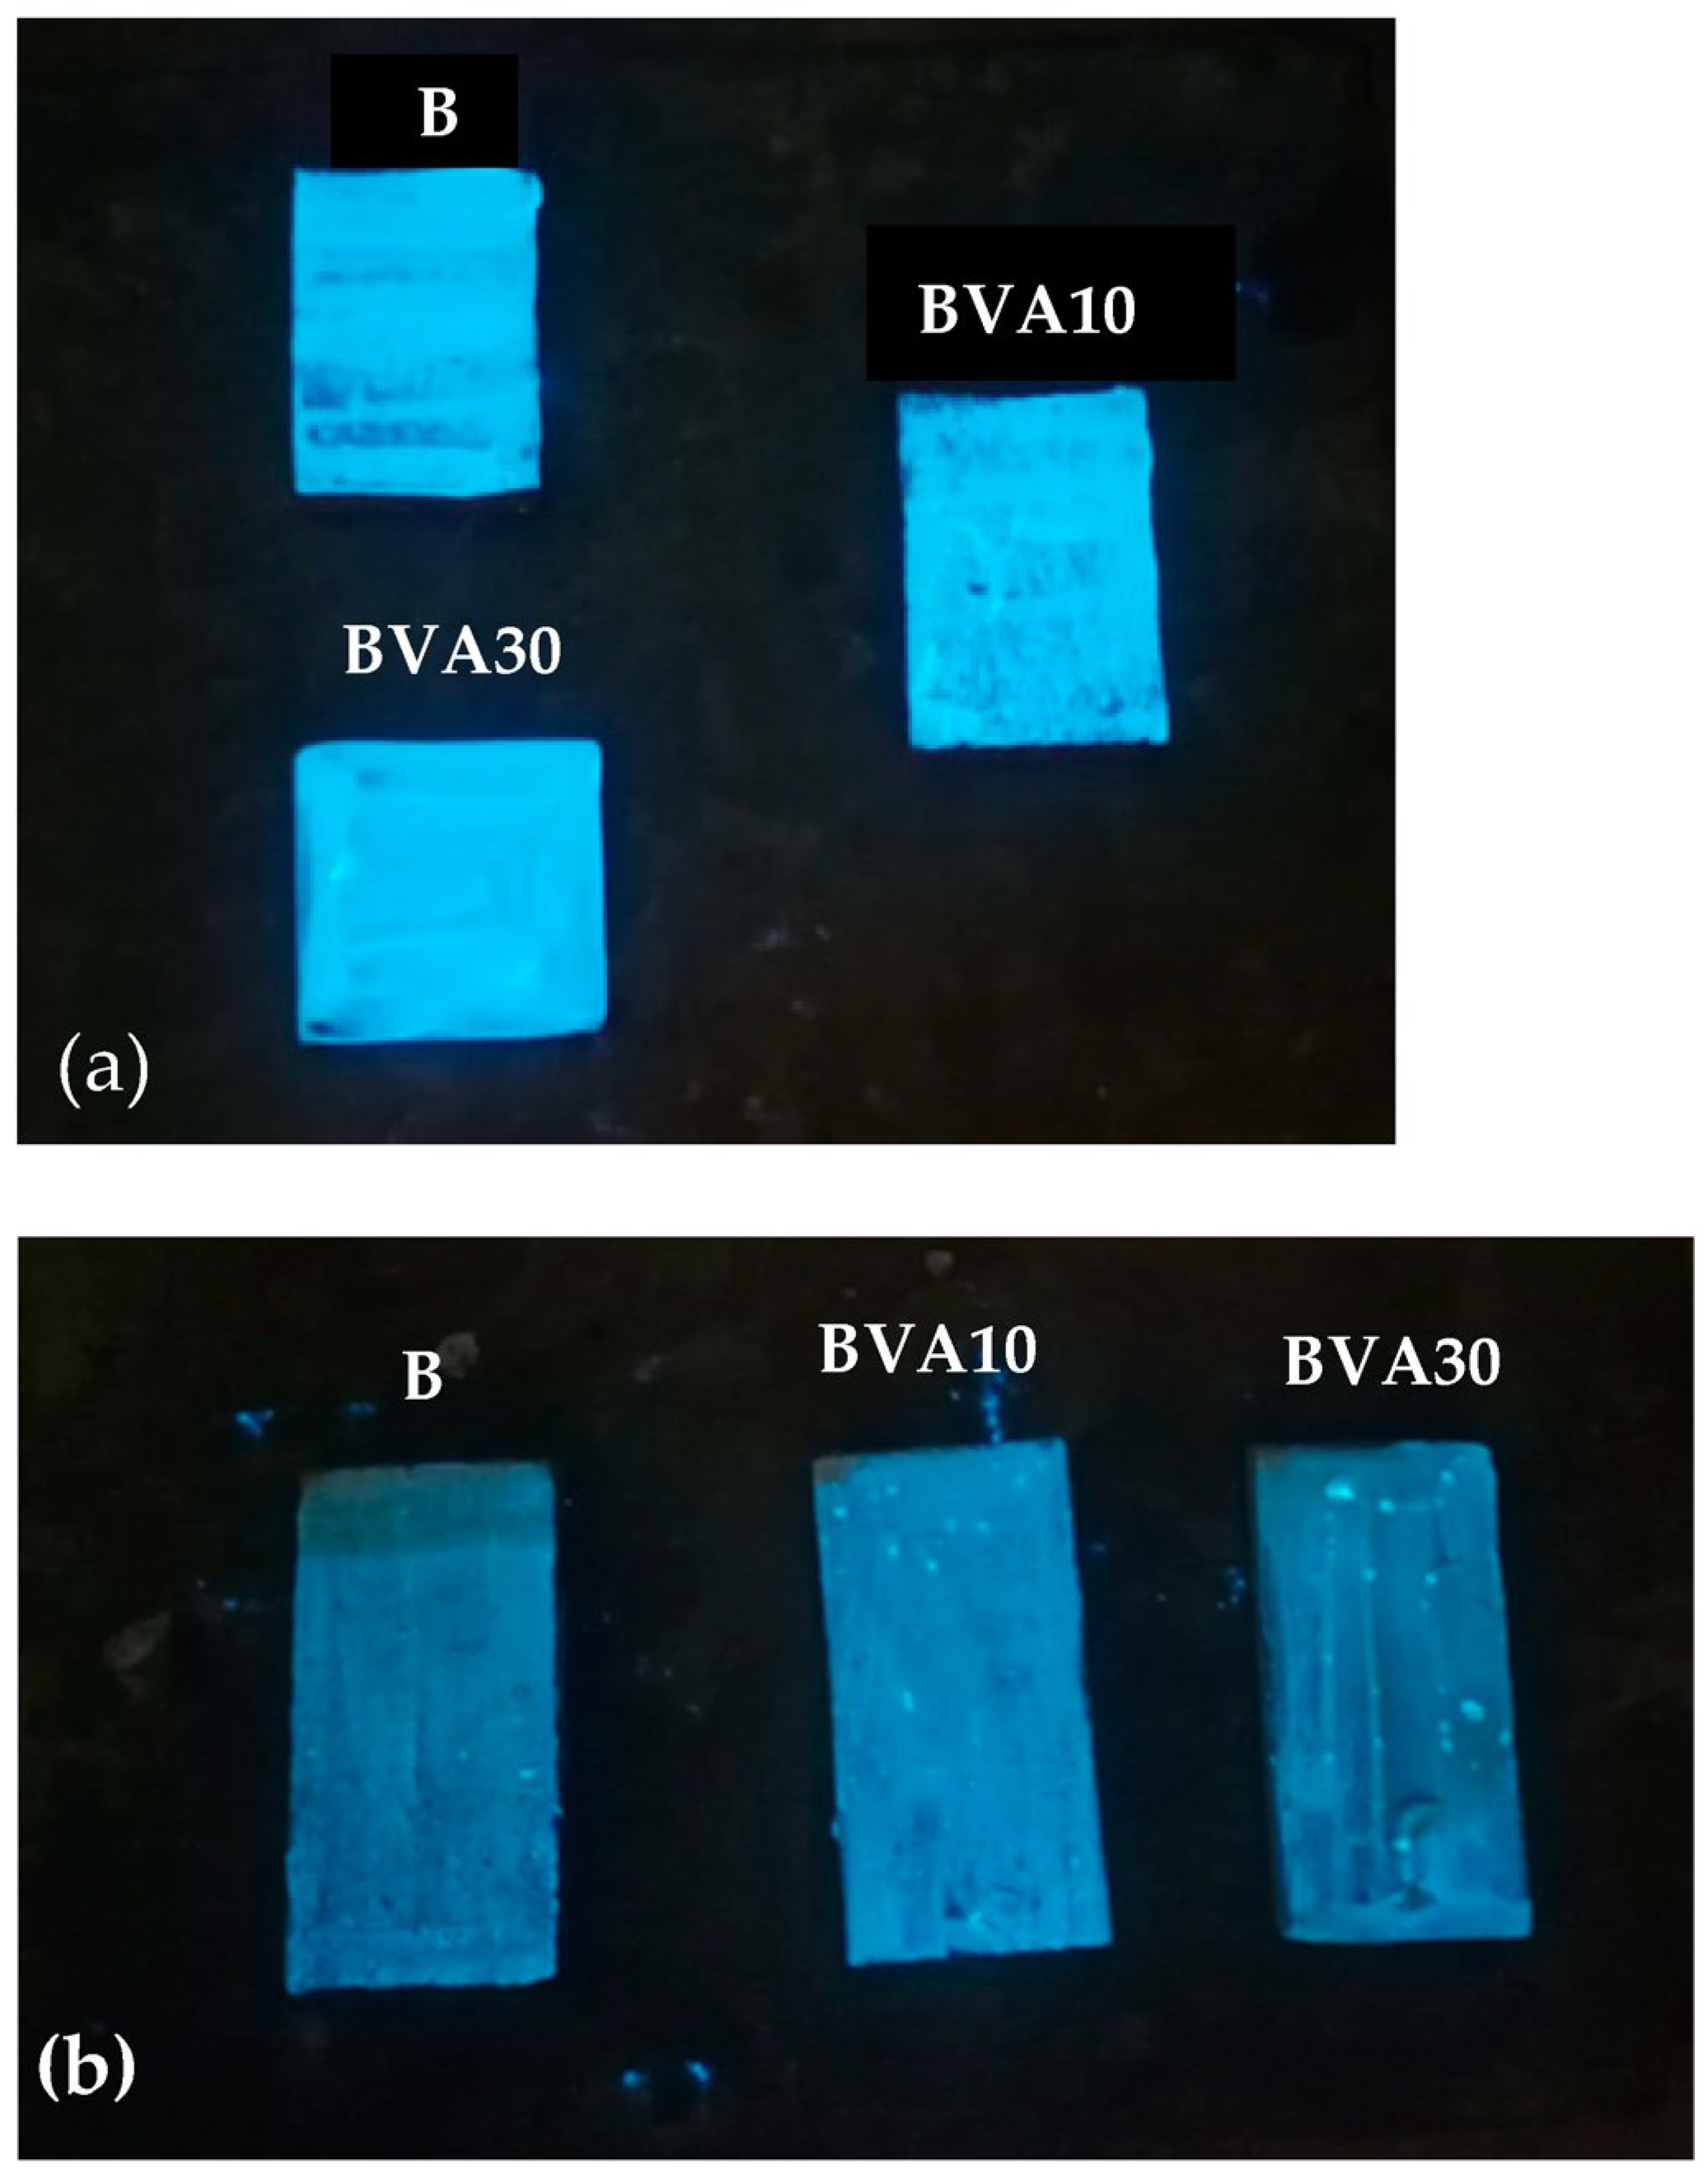
Two protocols that were described in the methods’ section were then carried out on some of the prepared bricks for each composition, with the aim of providing them with photoluminescent activity, thus increasing their suitability as decorative elements. Figure 19 shows the images of the fired specimens containing different percentages of volcanic ash and subjected to photoluminescent surface activation.
The two methods, although possessing different levels of efficiency, both proved to be appropriate for conferring photoluminescent activity on ceramic supports. In fact, despite having reached very high temperatures during firing, they maintain their photoluminescence properties.
Method (a) is more effective in providing the photoluminescent effect, as it creates a more intense and uniform brightness. It allows the water-dispersed photoluminescent powder to better impregnate the surface of the bricks, thus producing thicker and more adherend layers that are not affected by successive dip-coating in glaze. In contrast, the ceramic glaze mixture does not favor the dispersion of photoluminescent powder, as several spots are clearly visible on the bricks in the dark after exposure to sunlight. The presence of bright lines also suggests that photoluminescent powders are prone to be drained with the excess of glaze. It is well known that luminescent photo materials are inclined to hydrolyze and deteriorate [58]. Thus, it is crucial to enhance water resistance. The glaze used to fix the photoluminescent powder onto the surface of the specimens generates, after firing, a transparent, colorless and waterproof thin glass coating on the surface of the ceramic material, thus increasing the durability of the photoluminescent materials.
4. Conclusions
The main findings of the experimental campaign can be summarized as follows:
- The Etna volcanic ash contains inorganic glasses, albite, stishovite, augite–albite, and anorthite. The high content of iron excludes their use in the production of porcelain Upon firing at 950 °C, an increase in the intensity and number of peaks of the crystalline phases was observed and ascribed to minerals formed during the thermal treatment through recrystallisation and sintering.
- Workable and moldable mixtures were prepared by adding up to 30 wt% of VA. The mix with 50 wt% of volcanic ash failed to provide satisfactory fresh properties.
- Weight loss after firing decreases with the increasing of the percentage of clay replacement with volcanic ash, whereas dimensional stability increases. Embedded volcanic ash particles are clearly visible in the microstructure of bricks. It can be assumed that, at the used firing temperature, VA mainly plays the role of nonplastics or temper, providing support for the body.
- Increasing the percentage of VA results in a significant decrease in the mechanical properties up to 66% at the highest replacement percentage. This is due to the presence of volcanic ash particles only partially melted and not firmly joined to the clay matrix, as also confirmed by values of the dynamic elastic modulus and SEM analysis. However, measured the values are higher than those required by the European standard EN 771-2 [43], British Standard BS 3921:1985 [44] and ASTM C62-13 [45] for bricks that can be used in normal weathering.
- The addition of volcanic ash lowers the sorptivity values by up to 10 wt% and hinders the absorption of water of bricks. The produced bricks with VA meet the second-class brick water absorption criteria according to ASTM C20-00 [56].
- A procedure to provide surface of bricks with intense photoluminescent properties, ensuring uniform brightness, was identified.
Based on the present results, the authors suggest that an increase in the mechanical properties of bricks with VA can be achieved by firing them at higher temperatures, thus promoting a more extensive melting and sintering of VA particles.
Author Contributions
Conceptualization, S.C. and P.D.L.; methodology, S.C. and P.D.L.; validation, S.C. and P.G.; formal analysis, F.C.; investigation, P.G; data curation, S.C.; writing—review and editing, S.C. and P.D.L.; supervision, P.D.L., S.C., and F.C. All authors have read and agreed to the published version of the manuscript.
Funding
This research received no external funding.
Institutional Review Board Statement
Not applicable.
Informed Consent Statement
Not applicable.
Data Availability Statement
The data are contained within the article.
Conflicts of Interest
The authors declare no conflict of interest.
References
- Barone, G.; De Giudici, G.; Gimeno, D.; Lanzafame, G.; Podda, F.; Cannas, C.; Giuffrida, A.; Barchitta, M.; Agodi, A.; Mazzoleni, P. Surface reactivity of Etna volcanic ash and evaluation of health risks. Sci. Total Environ. 2021, 761, 143248. [Google Scholar] [CrossRef] [PubMed]
- Tesone, A.I.; Lasagni Vitar, R.M.; Tau, J.; Maglione, G.A.; Llesuy, S.; Tasat, D.R.; Berra, A. Volcanic ash from Puyehue-Cord on Caulle volcanic complex and Calbuco promote a differential response of pro-inflammatory and oxidative stress mediator son human conjunctival epithelial cells. Environ. Res. 2018, 167, 87–97. [Google Scholar] [CrossRef] [PubMed]
- Barsotti, S.; Andronico, D.; Neri, A.; Del Carlo, P.; Baxter, P.J.; Aspinall, W.P.; Hincks, T. Quantitative assessment of volcanic ash hazards for heath and infrastructure at Mt. Etna (Italy) by numerical simulation. J. Volcanol. Geoth. Res. 2010, 192, 85–96. [Google Scholar] [CrossRef]
- Horwell, C.J.; Baxter, P.J. The respiratory health hazards of volcanic ash: A review for volcanic risk mitigation. Bull. Volcanol. 2006, 69, 1–24. [Google Scholar] [CrossRef]
- Gagliano, E.; Sgroi, M.; Falciglia, P.P.; Belviso, C.; Cavalcante, F.; Lettino, A.; Vagliasindi, F.G.A.; Roccaro, P. Removal of ammonium from wastewater by zeolite synthetized from volcanic ash: Batch and column tests. J. Environ. Chem. Eng. 2022, 10, 107539. [Google Scholar] [CrossRef]
- Milios, L. Advancing to a Circular Economy: Three essential ingredients for a comprehensive policy mix. Sustain. Sci. 2017, 13, 861–878. [Google Scholar] [CrossRef] [PubMed]
- Candamano, S.; Tassone, F.; Iacobini, I.; Crea, F.; De Fazio, P. The Properties and Durability of Self-Leveling and Thixotropic Mortars with Recycled Sand. Appl. Sci. 2022, 12, 2732. [Google Scholar] [CrossRef]
- Djon Li Ndjock, B.I.; Baenla, J.; Mbah, J.B.B.; Elimbi, A.; Cyr, M. Amorphous phase of volcanic ash and microstructure of cement product obtained from phosphoric acid activation. SN Appl. Sci. 2020, 2, 1–10. [Google Scholar] [CrossRef]
- Latif, D.O.; Rifa’i, A.; Suryolelono, K.B. Chemical characteristics of volcanic ash in Indonesia for soil stabilization: Morphology and mineral content. GEOMATE J. 2016, 11, 2606–2610. [Google Scholar] [CrossRef]
- Serra, M.F.; Conconi, M.S.; Suarez, G.; Aglietti, E.F.; Rendtorff, N.M. Volcanic ash as flux in clay based triaxial ceramic materials, effect of the firing temperature in phases and mechanical properties. Ceram. Int. 2015, 41, 6169–6177. [Google Scholar] [CrossRef]
- Alemayehu, E.; Lennartz, B. Virgin volcanic rocks: Kinetics and equilibrium studies for the adsorption of cadmium from water. J. Hazard. Mater. 2009, 169, 395–401. [Google Scholar] [CrossRef] [PubMed]
- Siddique, R. Effect of volcanic ash on the properties of cement paste and mortar. Resources. Conserv. Recycl. 2011, 56, 66–70. [Google Scholar] [CrossRef]
- Lemougna, P.N.; Wang, K.; Tang, Q.; Nzeukou, A.N.; Billong, N.; Melo, U.C.; Cui, X. Review on the use of volcanic ashes for engineering applications. Res. Conserv. Recy. 2018, 137, 177–190. [Google Scholar] [CrossRef]
- Djon Li Ndjock, B.I.; Elimbi, A.; Cyr, M. Rational utilization of volcanic ashes based on factors affecting their alkaline activation. J. Non-Cryst. Solids 2017, 463, 31–39. [Google Scholar] [CrossRef]
- Liu, Y.; Taylor, L.A. Characterization of lunar dust and a synopsis of available lunar simulants. Planet. Space Sci. 2011, 59, 1769–1783. [Google Scholar] [CrossRef]
- Shichalin, O.O.; Papynov, E.K.; Nepomnyushchaya, V.A.; Ivanets, A.I.; Belov, A.A.; Dran’kov, A.N.; Yarusova, S.B.; Buravlev, I.Y.; Tarabanova, A.E.; Fedorets, A.N.; et al. Hydrothermal synthesis and spark plasma sintering of NaY zeolite as solid-state matrices for cesium-137 immobilization. J. Eur. Ceram. Soc. 2022, 42, 3004–3014. [Google Scholar] [CrossRef]
- Yarusova, S.B.; Shichalin, O.O.; Belov, A.A.; Azon, S.A.; Buravlev, I.Y.; Golub, A.V.; Mayorov, V.Y.; Gerasimenko, A.V.; Papynov, E.K.; Ivanets, A.I.; et al. Synthesis of amorphous KAlSi3O8 for cesium radionuclide immobilization into solid matrices using spark plasma sintering technique. Ceram. Int. 2022, 48, 3808–3817. [Google Scholar] [CrossRef]
- Průša, D.; Šuhajda, K.; Žajdlík, T.; Svobodová, K.; Šťastník, S.; Hobzova, K.; Venkrbec, V. Effect of Microwave Radiation on the Compressive Strength of Solid Ceramic Brick. Buildings 2023, 13, 1018. [Google Scholar] [CrossRef]
- Stepien, A.; Kostrzewa, P. The impact of basalt components on the structure of bricks formed as a result of hydrothermal treatment. Buildings 2019, 9, 192. [Google Scholar] [CrossRef]
- Panasenko, A.E.; Shichalin, O.O.; Yarusova, S.B.; Ivanets, A.I.; Belov, A.A.; Dran’kov, A.N.; Azon, S.A.; Fedorets, A.N.; Buravlev, I.Y.; Shlyk, D.K.; et al. A novel approach for rice straw agricultural waste utilization: Synthesis of solid aluminosilicate matrices for cesium immobilization. Nucl. Eng. Technol. 2022, 54, 3250–3259. [Google Scholar] [CrossRef]
- Guo, C.; Kong, J.; Wang, Z.; Meng, X.; Zhao, Y.; Wu, W.; Quan, H. Study on Preparation and Properties of Sintered Brick from Multi-Source Solid Waste. Appl. Sci. 2022, 12, 10181. [Google Scholar] [CrossRef]
- Stepien, A.; Potrzeszcz-Sut, B.; Prentice, D.P.; Oey, T.J.; Balonis, M. The role of glass compounds in autoclaved bricks. Buildings 2020, 10, 41. [Google Scholar] [CrossRef]
- Belfiore, C.M.; Amato, C.; Pezzino, A.; Viccaro, M. An end of waste alternative for volcanic ash: A resource in the manufacture of ceramic tiles. Constr. Build. Mater. 2020, 263, 120118. [Google Scholar] [CrossRef]
- Cultrone, G. The use of Mount Etna volcanic ash in the production of bricks with good physical-mechanical performance: Converting a problematic waste product into a resource for the construction industry. Ceram. Int. 2022, 48, 5724–5736. [Google Scholar] [CrossRef]
- De Luca, P.; De Luca, P.; Candamano, S.; Crea, F.; Nagy, J.B. Preparation and characterization of plasters with photodegradative action. Buildings 2018, 8, 122. [Google Scholar] [CrossRef]
- Danfá, S.; Martins, R.C.; Quina, M.J.; Gomes, J. Supported TiO2 in Ceramic Materials for the Photocatalytic Degradation of Contaminants of Emerging Concern in Liquid Effluents: A Review. Molecules 2021, 26, 5363. [Google Scholar] [CrossRef]
- Candamano, S.; Sgambitterra, E.; Lamuta, C.; Pagnotta, L.; Chakraborty, S.; Crea, F. Graphene nanoplatelets in geopolymeric systems: A new dimension of nanocomposites. Mater. Lett. 2019, 236, 550–553. [Google Scholar] [CrossRef]
- Lamuta, C.; Bruno, L.; Candamano, S.; Pagnotta, L. Piezoresistive characterization of graphene/metakaolin based geopolymeric mortar composites. MRS Adv. 2017, 2, 3773–3779. [Google Scholar] [CrossRef]
- Zhang, H.; Zhang, H.; Pan, A.; Yang, B.; He, L.; Wu, Y. Rare Earth-Free Luminescent Materials for WLEDs: Re-cent Progress and Perspectives. Adv. Mater. Technol. 2021, 6, 1–26. [Google Scholar] [CrossRef]
- Gao, Y.; Shen, H.; Li, D.; Yang, D. Efficient sensitized photoluminescence of Er silicate in silicon oxide films embedded with amorphous silicon clusters, part I: Fabrication. Opt. Mater. Express 2019, 9, 4329–4338. [Google Scholar] [CrossRef]
- Döbelin, N.; Kleeberg, R. Profex: A graphical user interface for the Rietveld refinement program BGMN. J. Appl. Crystallogr. 2015, 48, 1573–1580. [Google Scholar] [CrossRef]
- Žibret, L.; Wisniewski, W.; Horvat, B.; Božič, M.; Gregorc, B.; Ducman, V. Clay rich river sediments calcined into precursors for alkali activated materials. Appl. Clay Sci. 2023, 234, 106848. [Google Scholar] [CrossRef]
- AFNOR XP P18-594; Granulats–Méthodes D’essai de Réactivité aux Alcalis (Aggregates–Test Methods on Reactivity to Alkalis). Association Française de Normalisation: Paris, France, 2004.
- Gao, X.X.; Cyr, M.; Multon, S.; Sellier, A. A comparison of methods for chemical assessment of reactive silica in concrete aggregates by selective dissolution. Cem. Concr. Compos. 2013, 37, 82–94. [Google Scholar] [CrossRef]
- Karaman, S.; Ersahin, S.; Gunal, H. Firing temperature and firing time influence on mechanical and physical properties of clay bricks. J. Sci. Ind. Res. 2006, 65, 153–159. [Google Scholar]
- Kuzmickas, L.; Andrade, F.R.D.D.; Szabó, G.A.J.; Motta, J.F.M.; Cabral, M., Jr. Influence of diopside: Feldspar ratio in ceramic reactions assessed by quantitative phase analysis (X-ray diffraction-Rietveld method). Cerâmica 2013, 59, 345–350. [Google Scholar] [CrossRef]
- Coppola, L.; Coffetti, D.; Crotti, E.; Candamano, S.; Crea, F.; Gazzaniga, G.; Pastore, T. The combined use of admixtures for shrinkage reduction in one-part alkali activated slag-based mortars and pastes. Constr. Build. Mater. 2020, 248, 118682. [Google Scholar] [CrossRef]
- UNI EN 1015-18:2002; Methods of Test for Mortar for Masonry Determination of Water Absorption Coefficient Due to Capillary Action of Hardened Mortar. UNI: Milan, Italy, 2002.
- Candamano, S.; Crea, F.; Iorfida, A. Mechanical characterization of basalt fabric-reinforced alkali-activated matrix composite: A preliminary investigation. Appl. Sci. 2020, 10, 2865. [Google Scholar] [CrossRef]
- ASTM C67/C67M-21; Standard Test Methods for Sampling and Testing Brick and Structural Clay Tile. ASTM International: West Conshohocken, PA, USA, 2023.
- Shahreza, S.K.; Niklewski, J.; Molnár, M. Experimental investigation of water absorption and penetration in clay brick masonry under simulated uniform water spray exposure. J. Build. Eng. 2021, 43, 102583. [Google Scholar] [CrossRef]
- UNI-EN 196–1; Methods of Testing Cement-Part 1: Determination of Strength. UNI: Milan, Italy, 2016.
- UNI EN 771-2; Specification for Masonry Units–Part 2: Calcium Silicate Masonry Units. UNI: Milan, Italy, 2015.
- BS3921: 1985; Specifications for Clay Brick, United Kingdom. British Standards Institution: London, UK, 1985.
- ASTM C62-13a; Standard Specification for Building Brick (Solid Masonry Units Made from Clay or Shale. ASTM International: West Conshohocken, PA, USA, 2013.
- Wilson, T.; Stewart, C. Volcanic Ash. In Encyclopedia of Natural Hazards; Encyclopedia of Earth Sciences Series; Bobrowsky, P.T., Ed.; Springer: Dordrecht, The Netherlands, 2013. [Google Scholar] [CrossRef]
- Song, W.; Lavallee, Y.; Wadsworth, F.B.; Hess, K.U.; Dingwell, D.B. Wetting and spreading of molten volcanic ash in jet engines. J. Phys. Chem. Lett. 2017, 8, 1878–1884. [Google Scholar] [CrossRef]
- Melamud, S.G.; Yur’ev, B.P. Oxidation of iron ore at moderate and high temperatures. Steel Transl. 2016, 46, 384–389. [Google Scholar] [CrossRef]
- Clifford, J.F. High Temperature Reactions and Colour Development in Brick Clays. Ph.D. Dissertation, University of Surrey, Surrey, UK, 1984. [Google Scholar]
- Leonelli, C.; Kamseu, E.; Boccaccini, D.N.; Melo, U.C.; Rizzuti, A.; Billong, N.; Miselli, P. Volcanic ash as alternative raw materials for traditional vitrified ceramic products. Adv. Appl. Ceram. 2007, 106, 135–141. [Google Scholar] [CrossRef]
- Wang, S.; Gainey, L.; Mackinnon, I.D.R.; Allen, C.; Gu, Y.T.; Xi, Y.F. Thermal behaviors of clay minerals as key components and additives for fired brick properties: A review. J. Build. Eng. 2023, 66, 105802. [Google Scholar] [CrossRef]
- Labaied, I.; Douzane, O.; Lajili, M.; Promis, G. Bricks Using Clay Mixed with Powder and Ashes from Lignocellulosic Biomass: A Review. Appl. Sci. 2022, 12, 10669. [Google Scholar] [CrossRef]
- Wang, S.; Gainey, L.; Marinelli, J.; Deer, B.; Wang, X.D.; Mackinnon, I.D.R.; Xi, Y. Effects of vermiculite on in-situ thermal behaviour, microstructure, physical and mechanical properties of fired clay bricks. Constr. Build. Mater. 2022, 316, 125828. [Google Scholar] [CrossRef]
- Cultrone, G.; Carrillo-Rosúa, J. Growth of metastable phases during brick firing: Mineralogical and microtextural changes induced by the composition of the raw material and the presence of additives. Appl. Clay Sci. 2020, 185, 105419. [Google Scholar] [CrossRef]
- De Bonis, A.; Cultrone, G.; Grifa, C.; Langella, A.; Morra, V. Clays from the bay of Naples (Italy): New insight on ancient and traditional ceramics. J. Eur. Ceram. Soc. 2014, 34, 3229–3244. [Google Scholar] [CrossRef]
- ASTM C20-00; Standard Test Methods for Apparent Porosity, Water Absorption, Apparent Specific Gravity, and Bulk Density of Burned Refractory Brick and Shapes by Boiling Water. ASTM International: West Conshohocken, PA, USA, 2022.
- Leiva, C.; Arenas, C.; Alonso-Fariñas, B.; Vilches, L.F.; Peceño, B.; Rodriguez-Galán, M.; Baena, F. Characteristics of fired bricks with co-combustion fly ashes. J. Build. Eng. 2016, 5, 114–118. [Google Scholar] [CrossRef]
- Wang, L.; Shang, Z.; Shi, M.; Cao, P.; Yang, B.; Zou, J. Preparing and testing the reliability of long-afterglow SrAl2O4:Eu2+, Dy3+ phosphor flexible films for temperature sensing. RSC Adv. 2020, 10, 11418–11425. [Google Scholar] [CrossRef] [PubMed]
Figure 1.
(a) Application of the photoluminescent suspension. (b) Immersion in the crystalline of the support with surface treated with a photoluminescent suspension.
Figure 1.
(a) Application of the photoluminescent suspension. (b) Immersion in the crystalline of the support with surface treated with a photoluminescent suspension.

Figure 2.
XRD pattern of clay with identified crystalline phases.
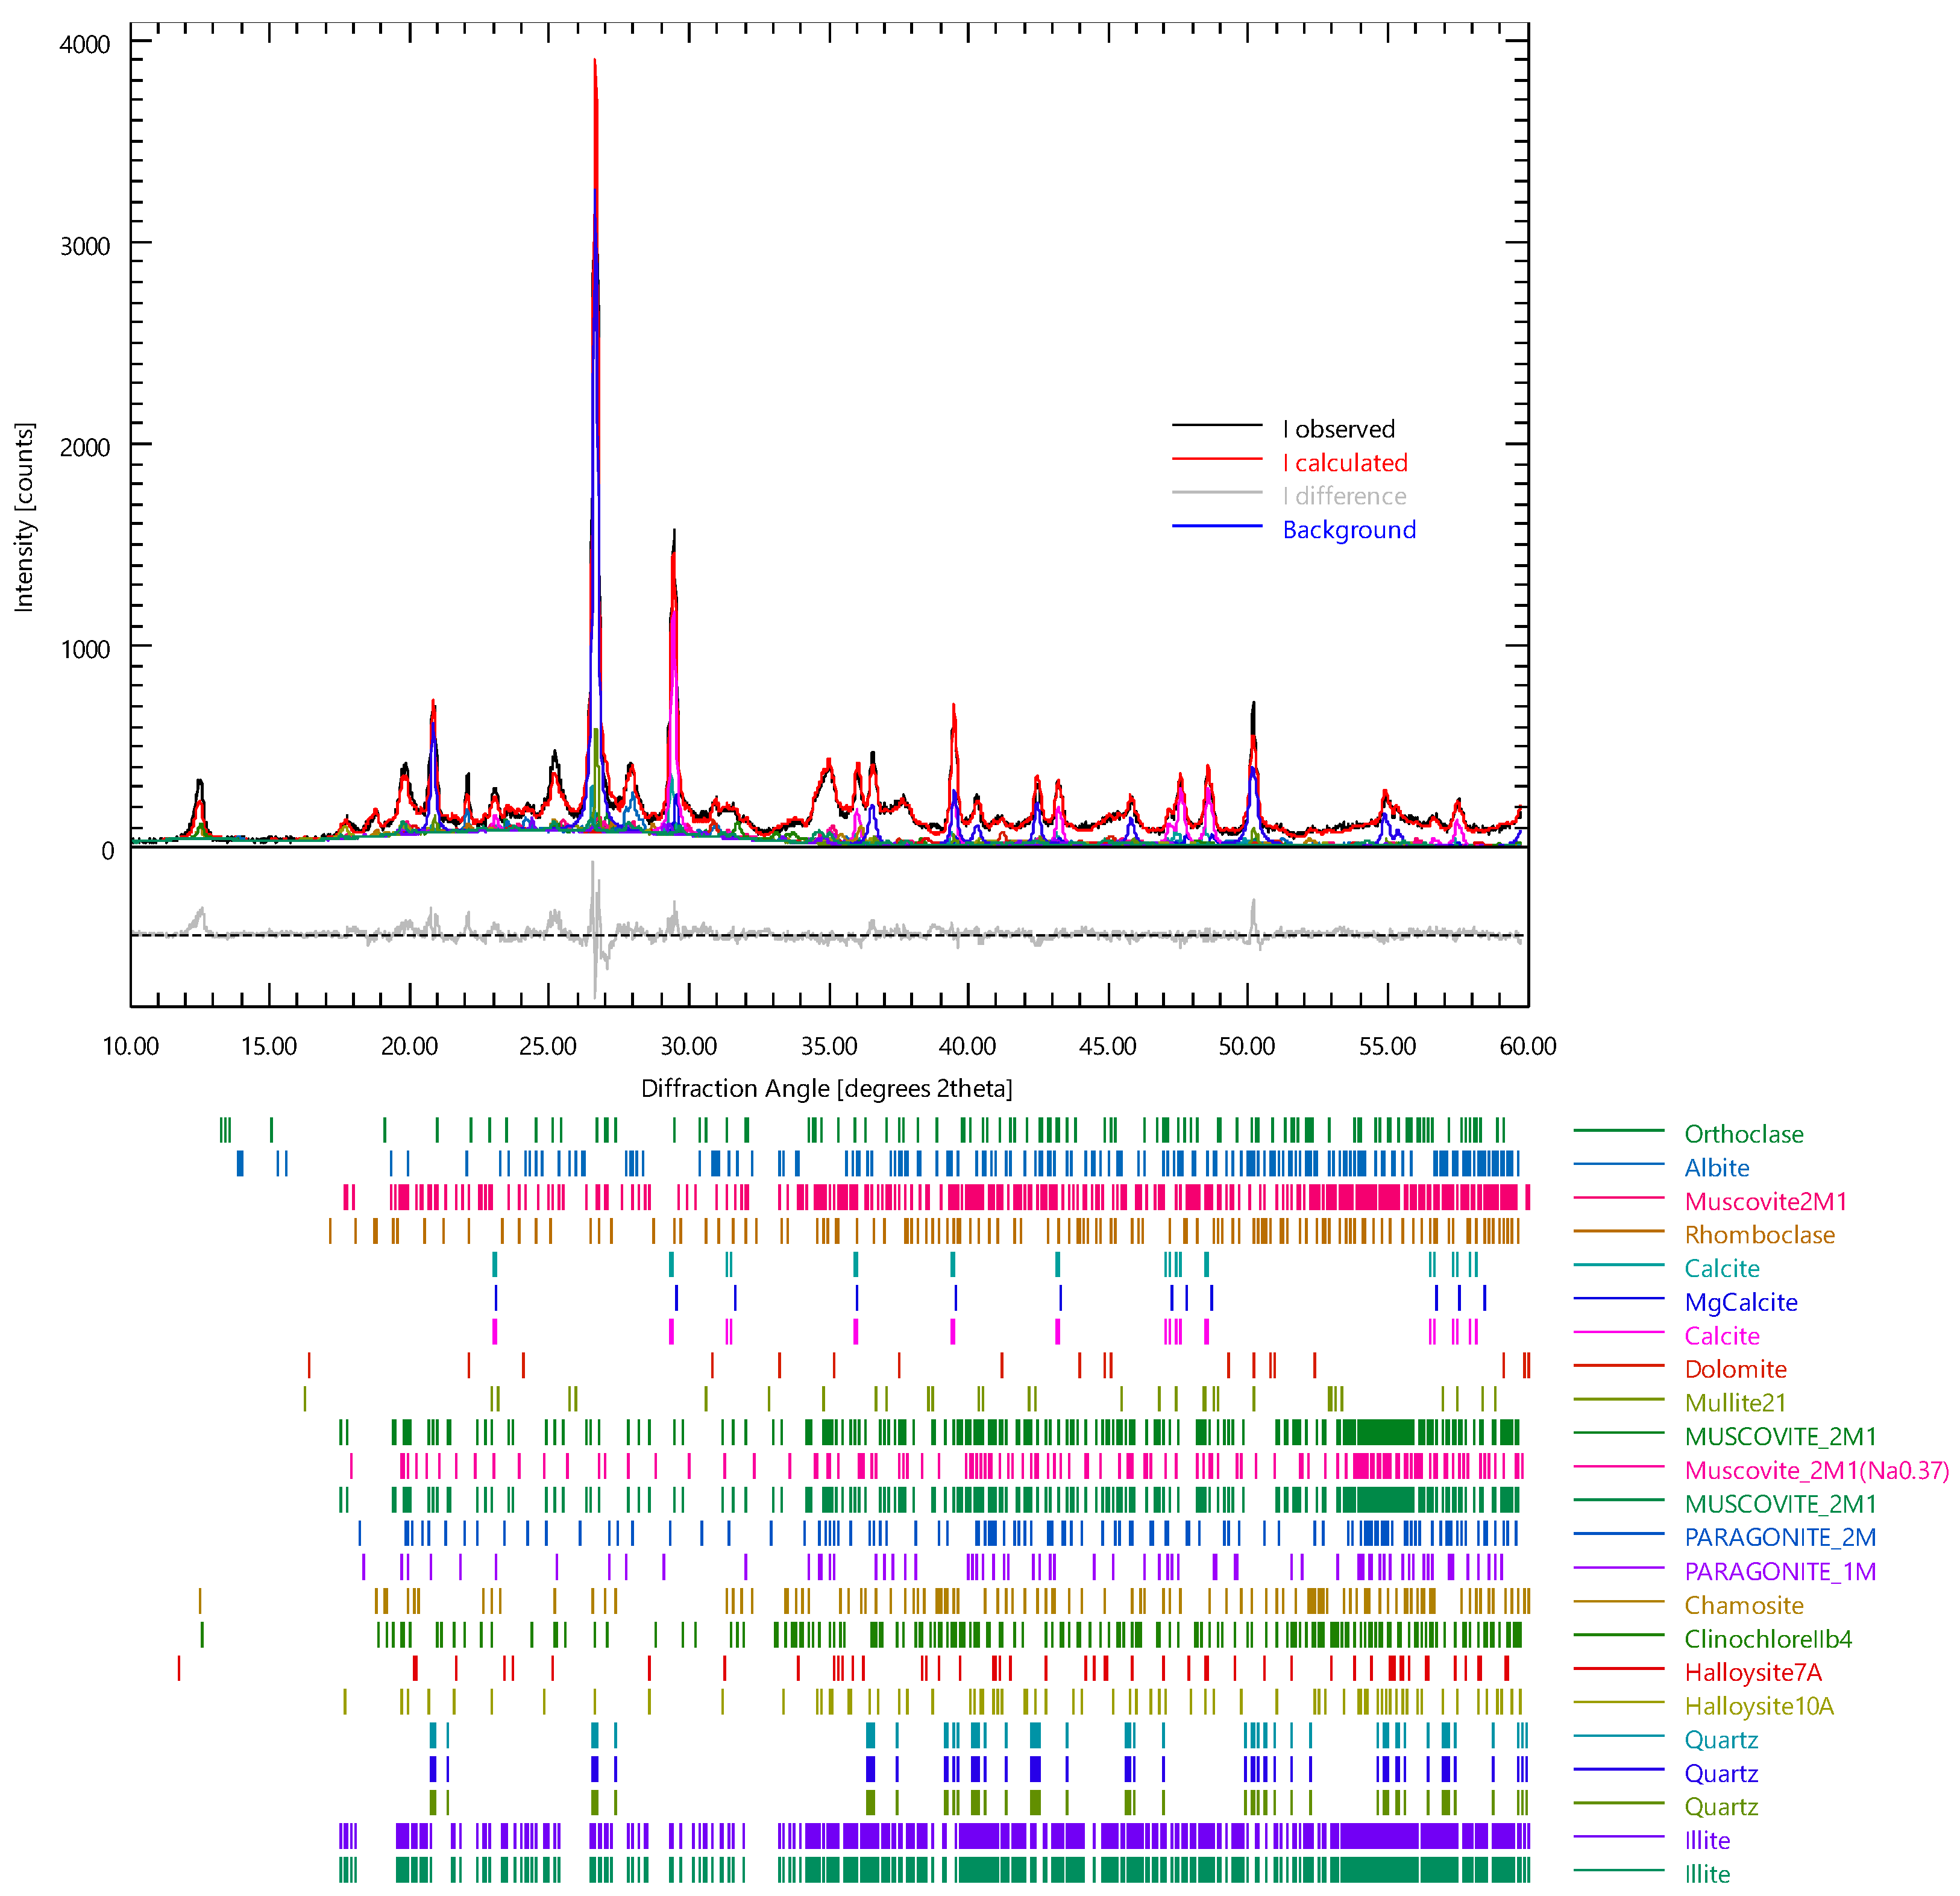
Figure 3.
TG (gray line) and DSC (red line) curves of clay.
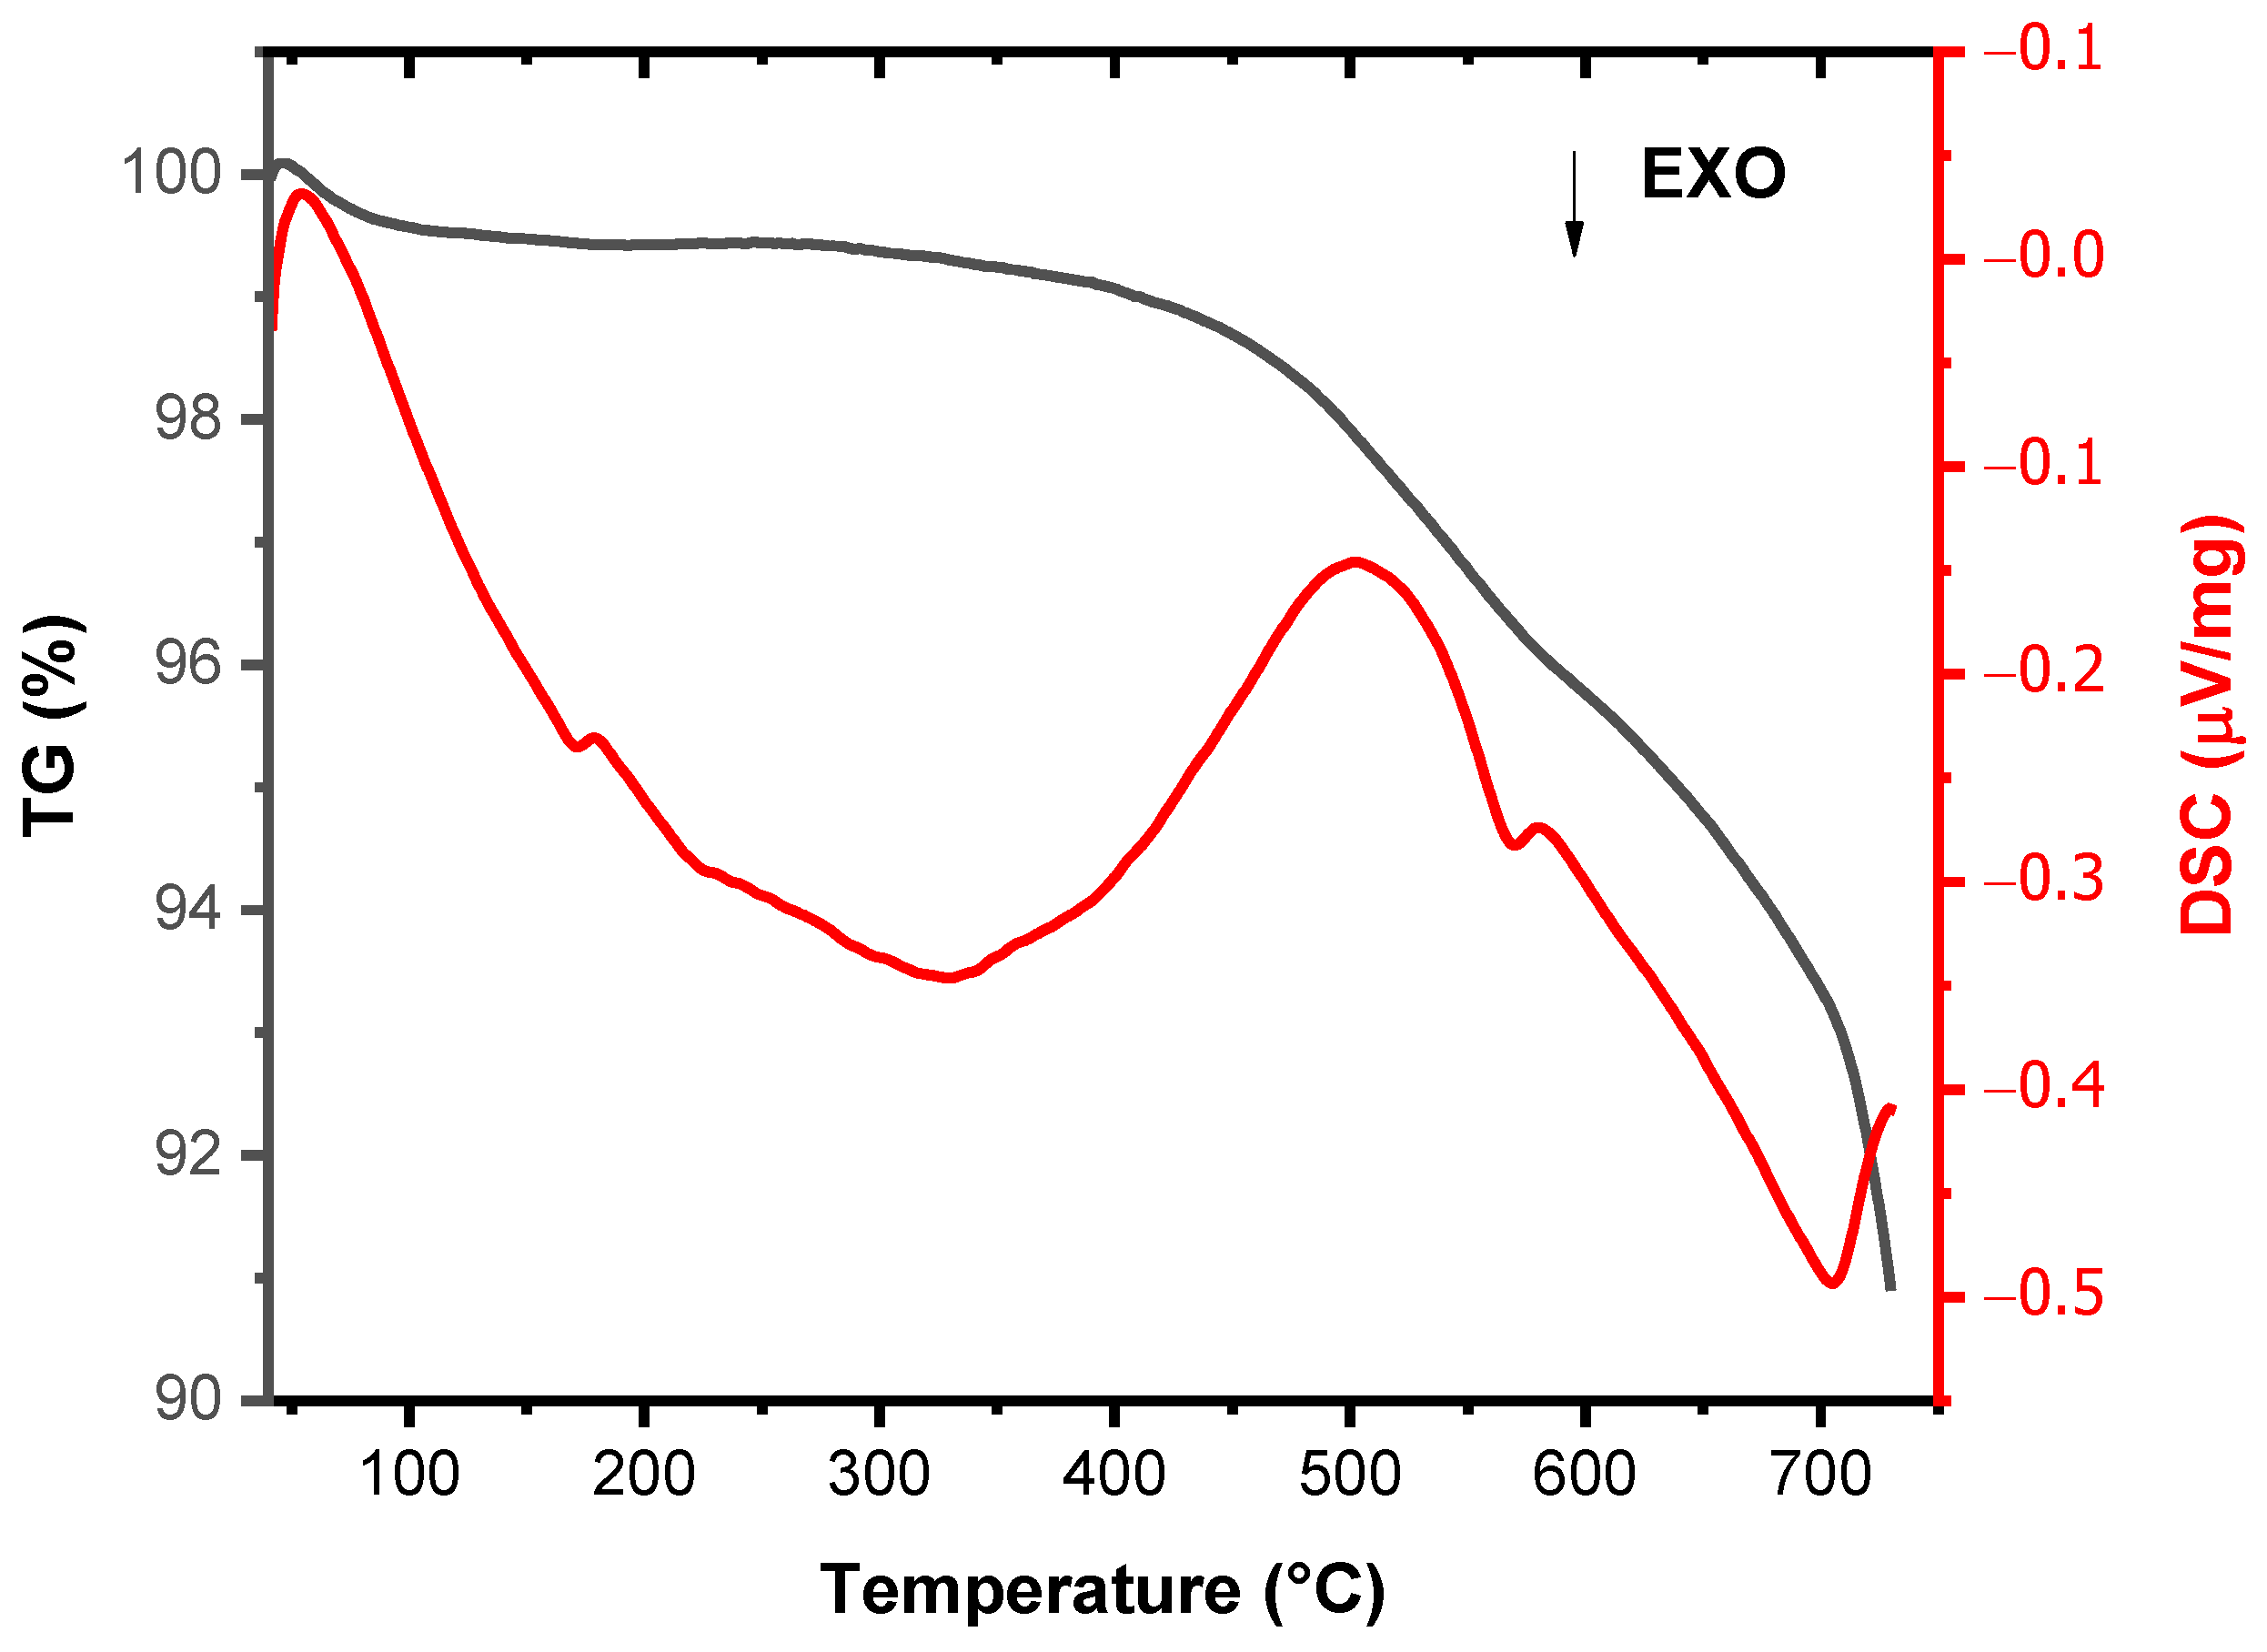
Figure 4.
Granulometric curve of the as-received volcanic ash.
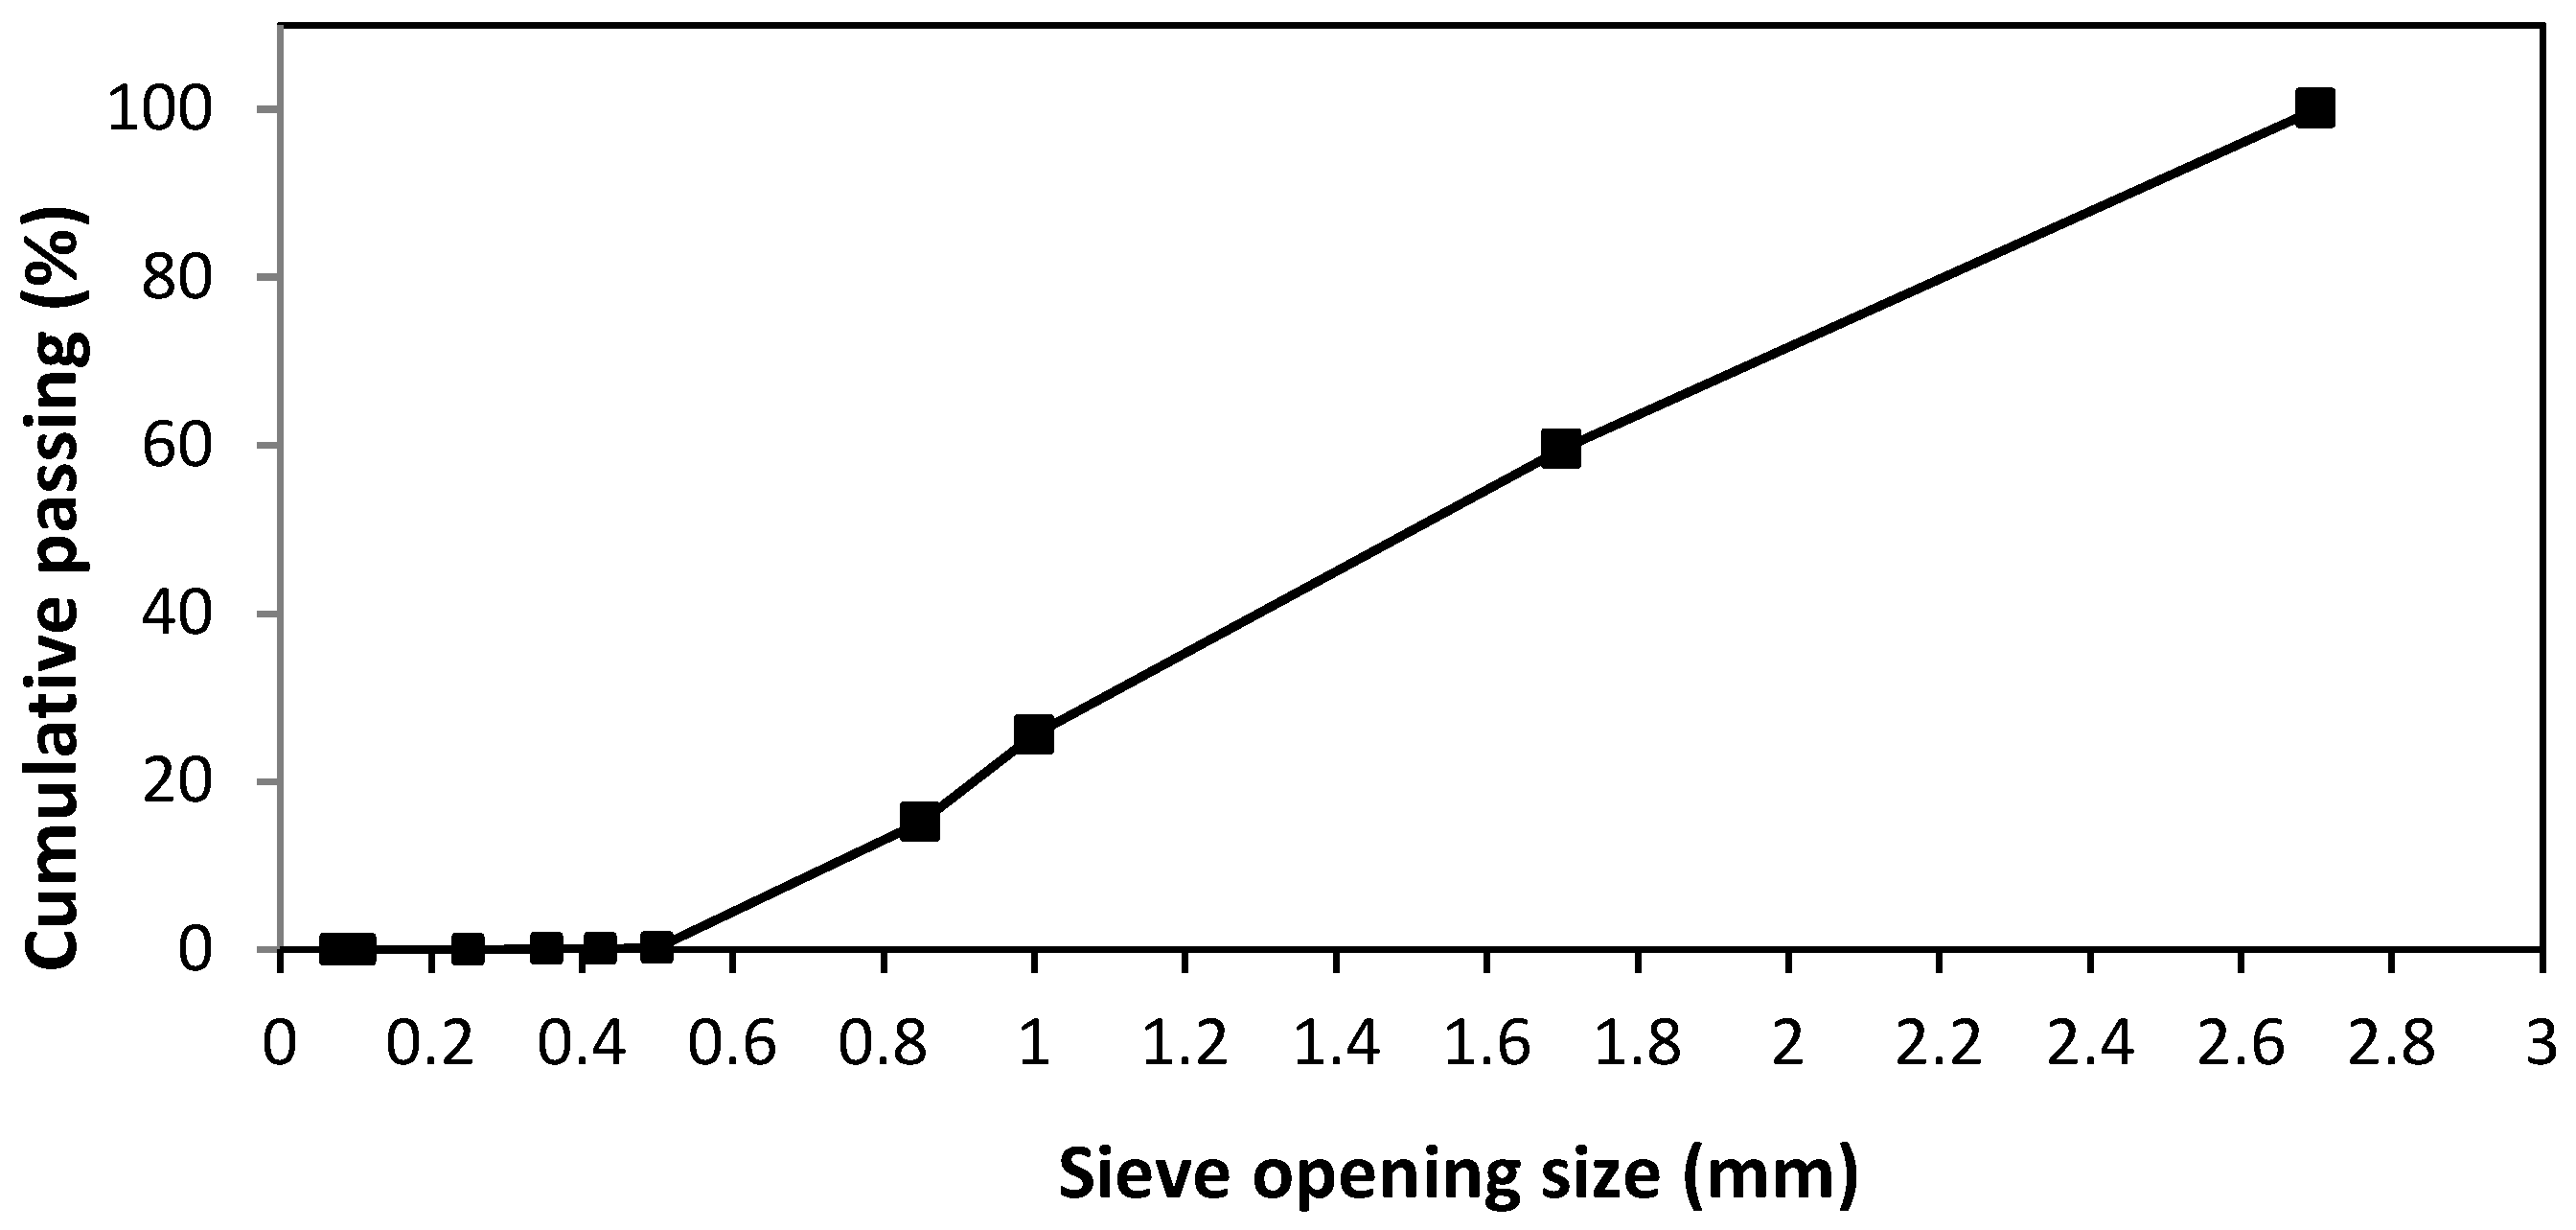
Figure 5.
(A,B) SEM images and EDX analyses of two selected particles of volcanic ash. EDX spectra (red measured, blue calculated) have been obtained by analyzing the area in the red squared spots.
Figure 5.
(A,B) SEM images and EDX analyses of two selected particles of volcanic ash. EDX spectra (red measured, blue calculated) have been obtained by analyzing the area in the red squared spots.

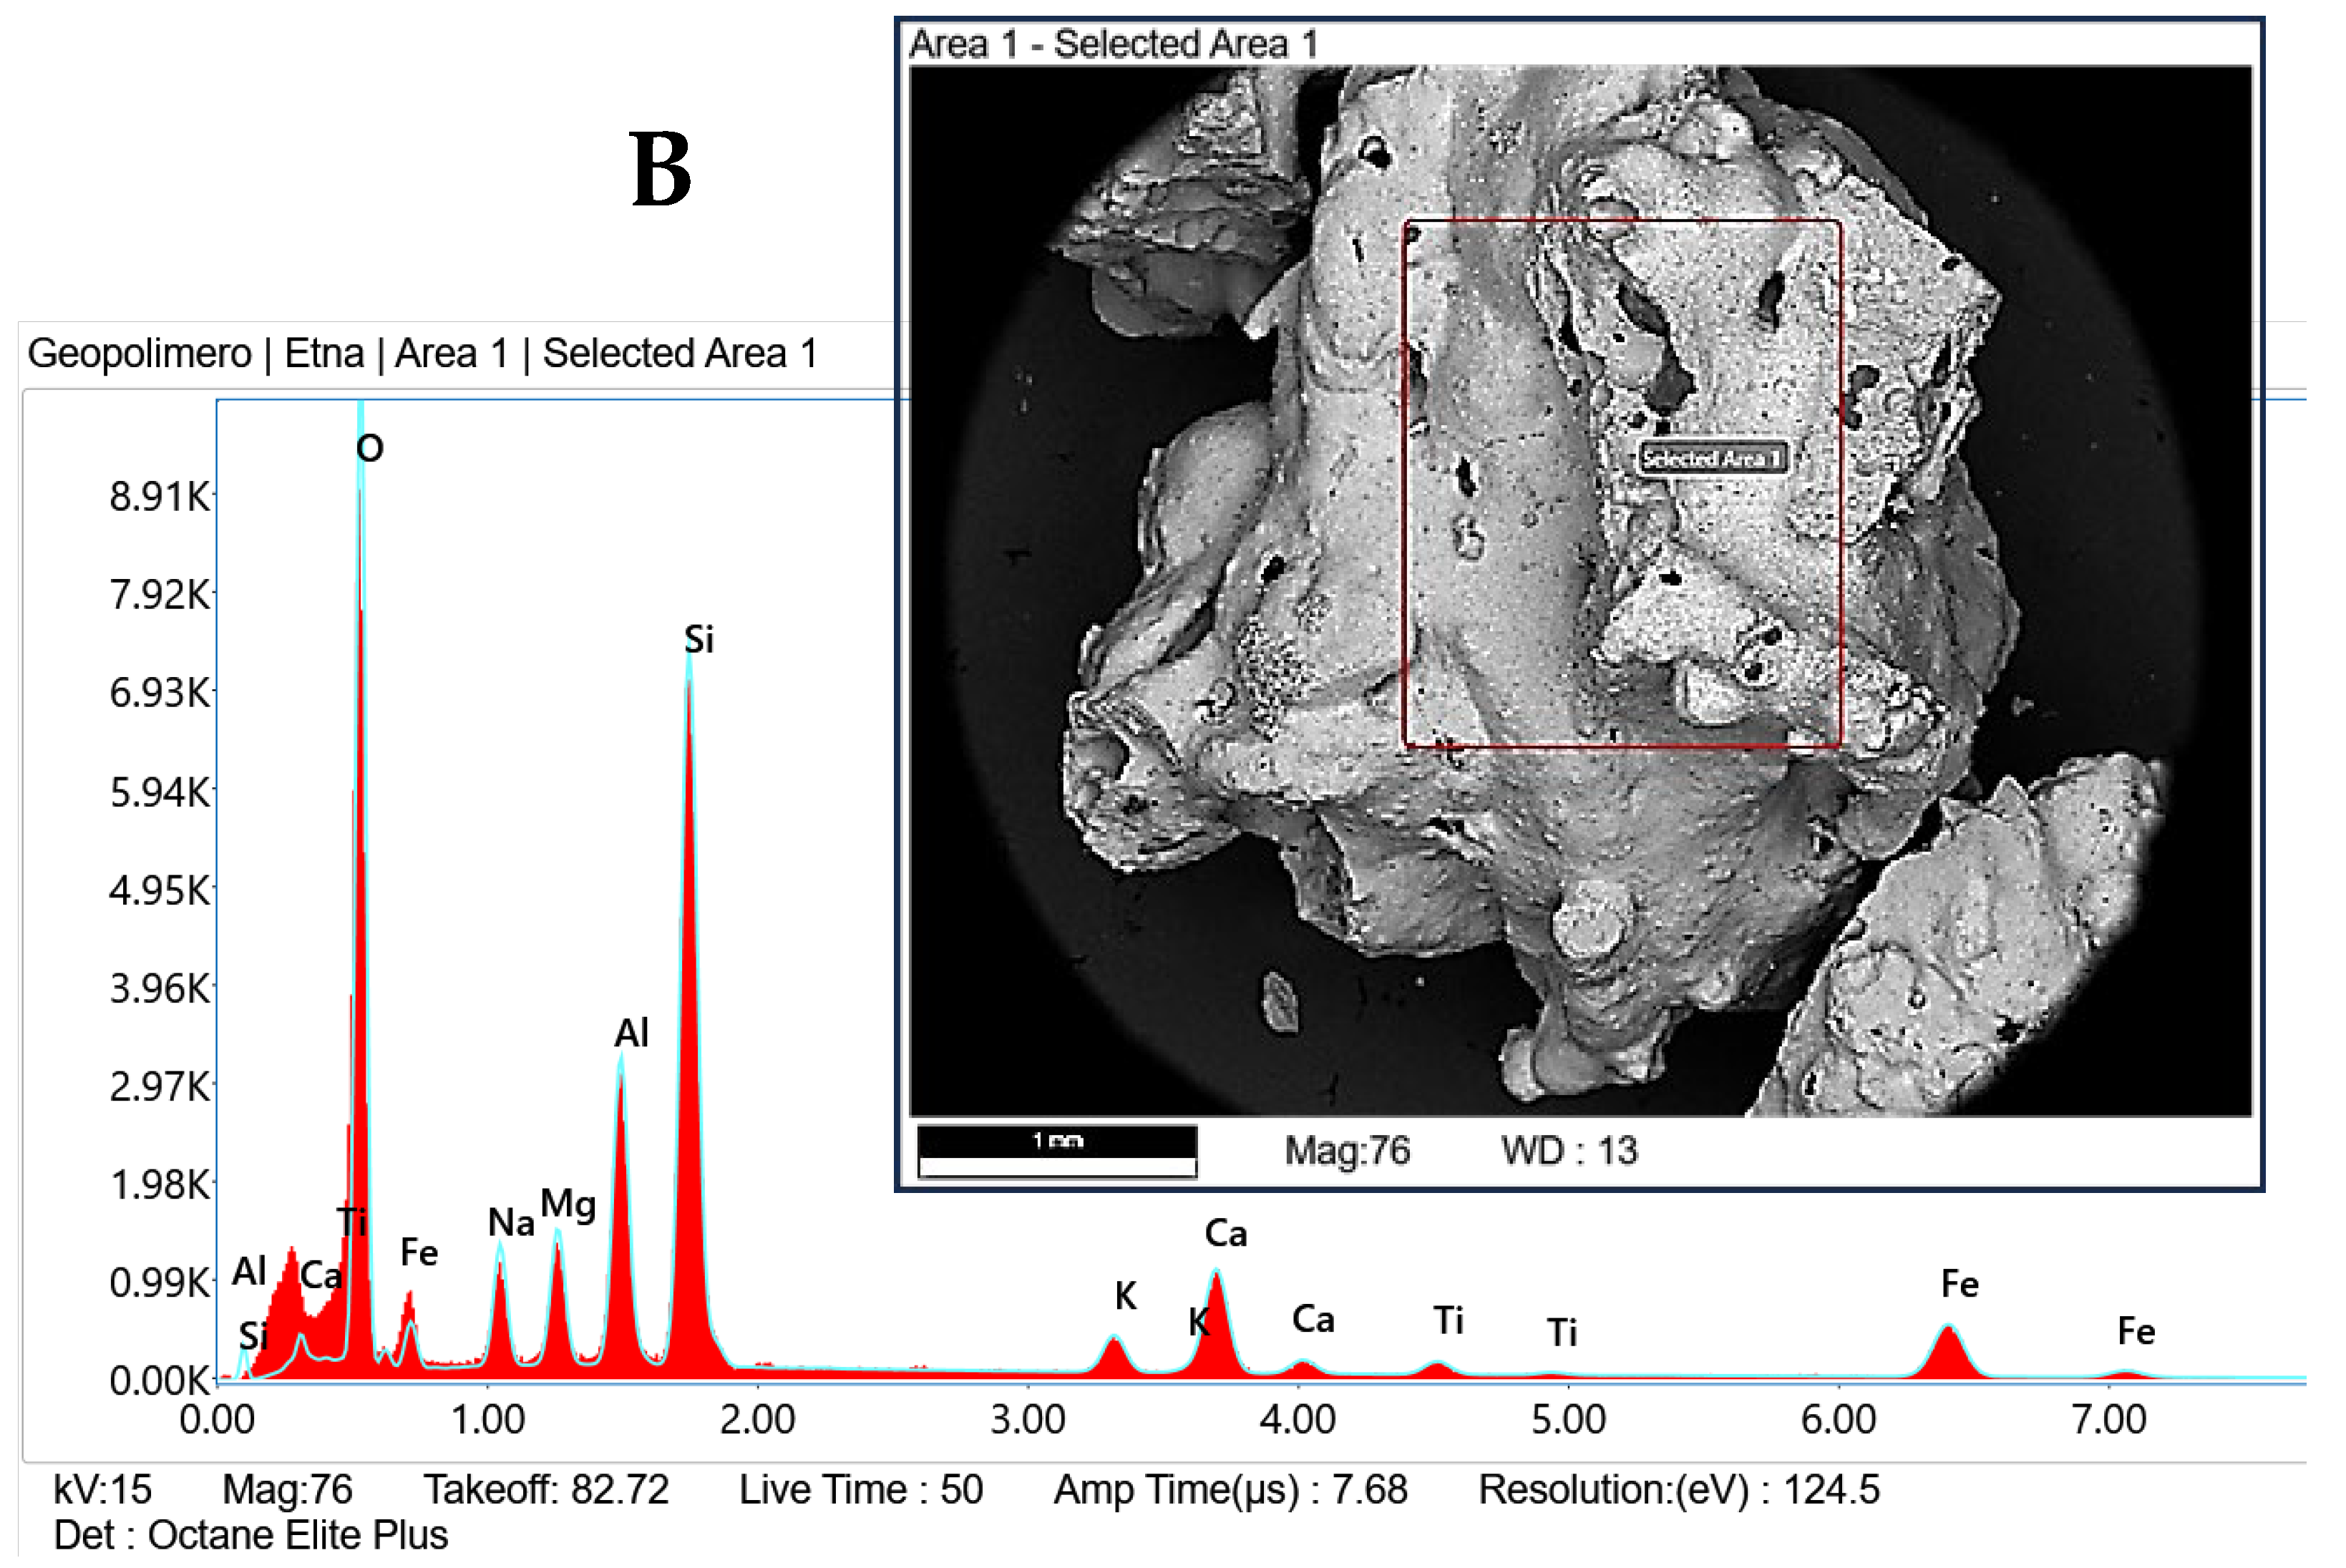
Figure 6.
Granulometric curve of the crushed volcanic ash.
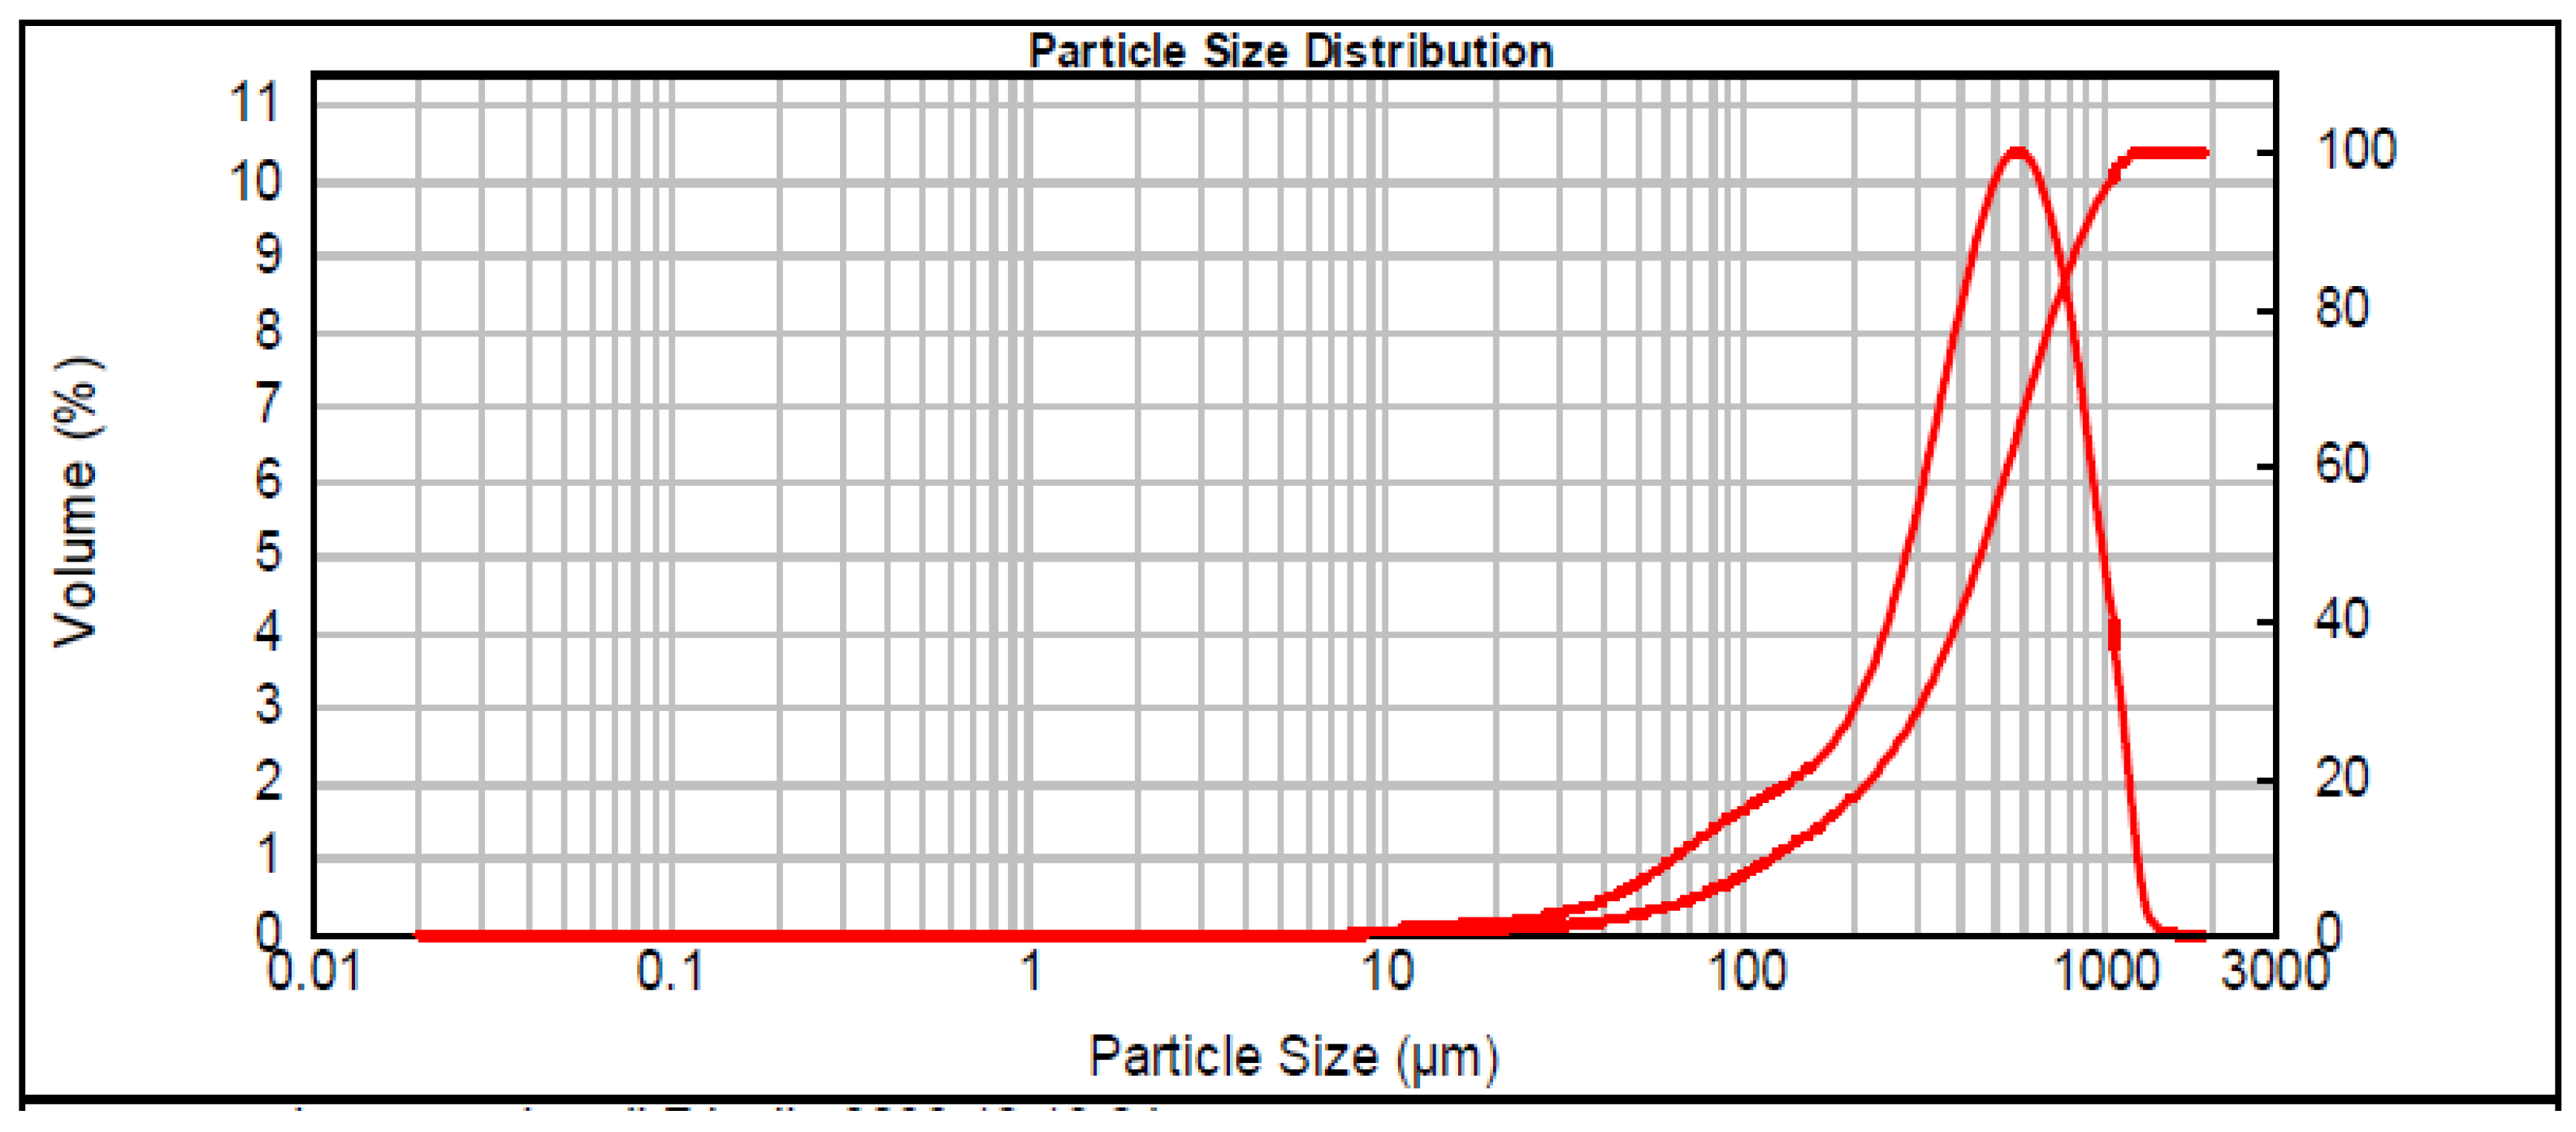
Figure 7.
XRD pattern of Etna ash with identified crystalline phases.
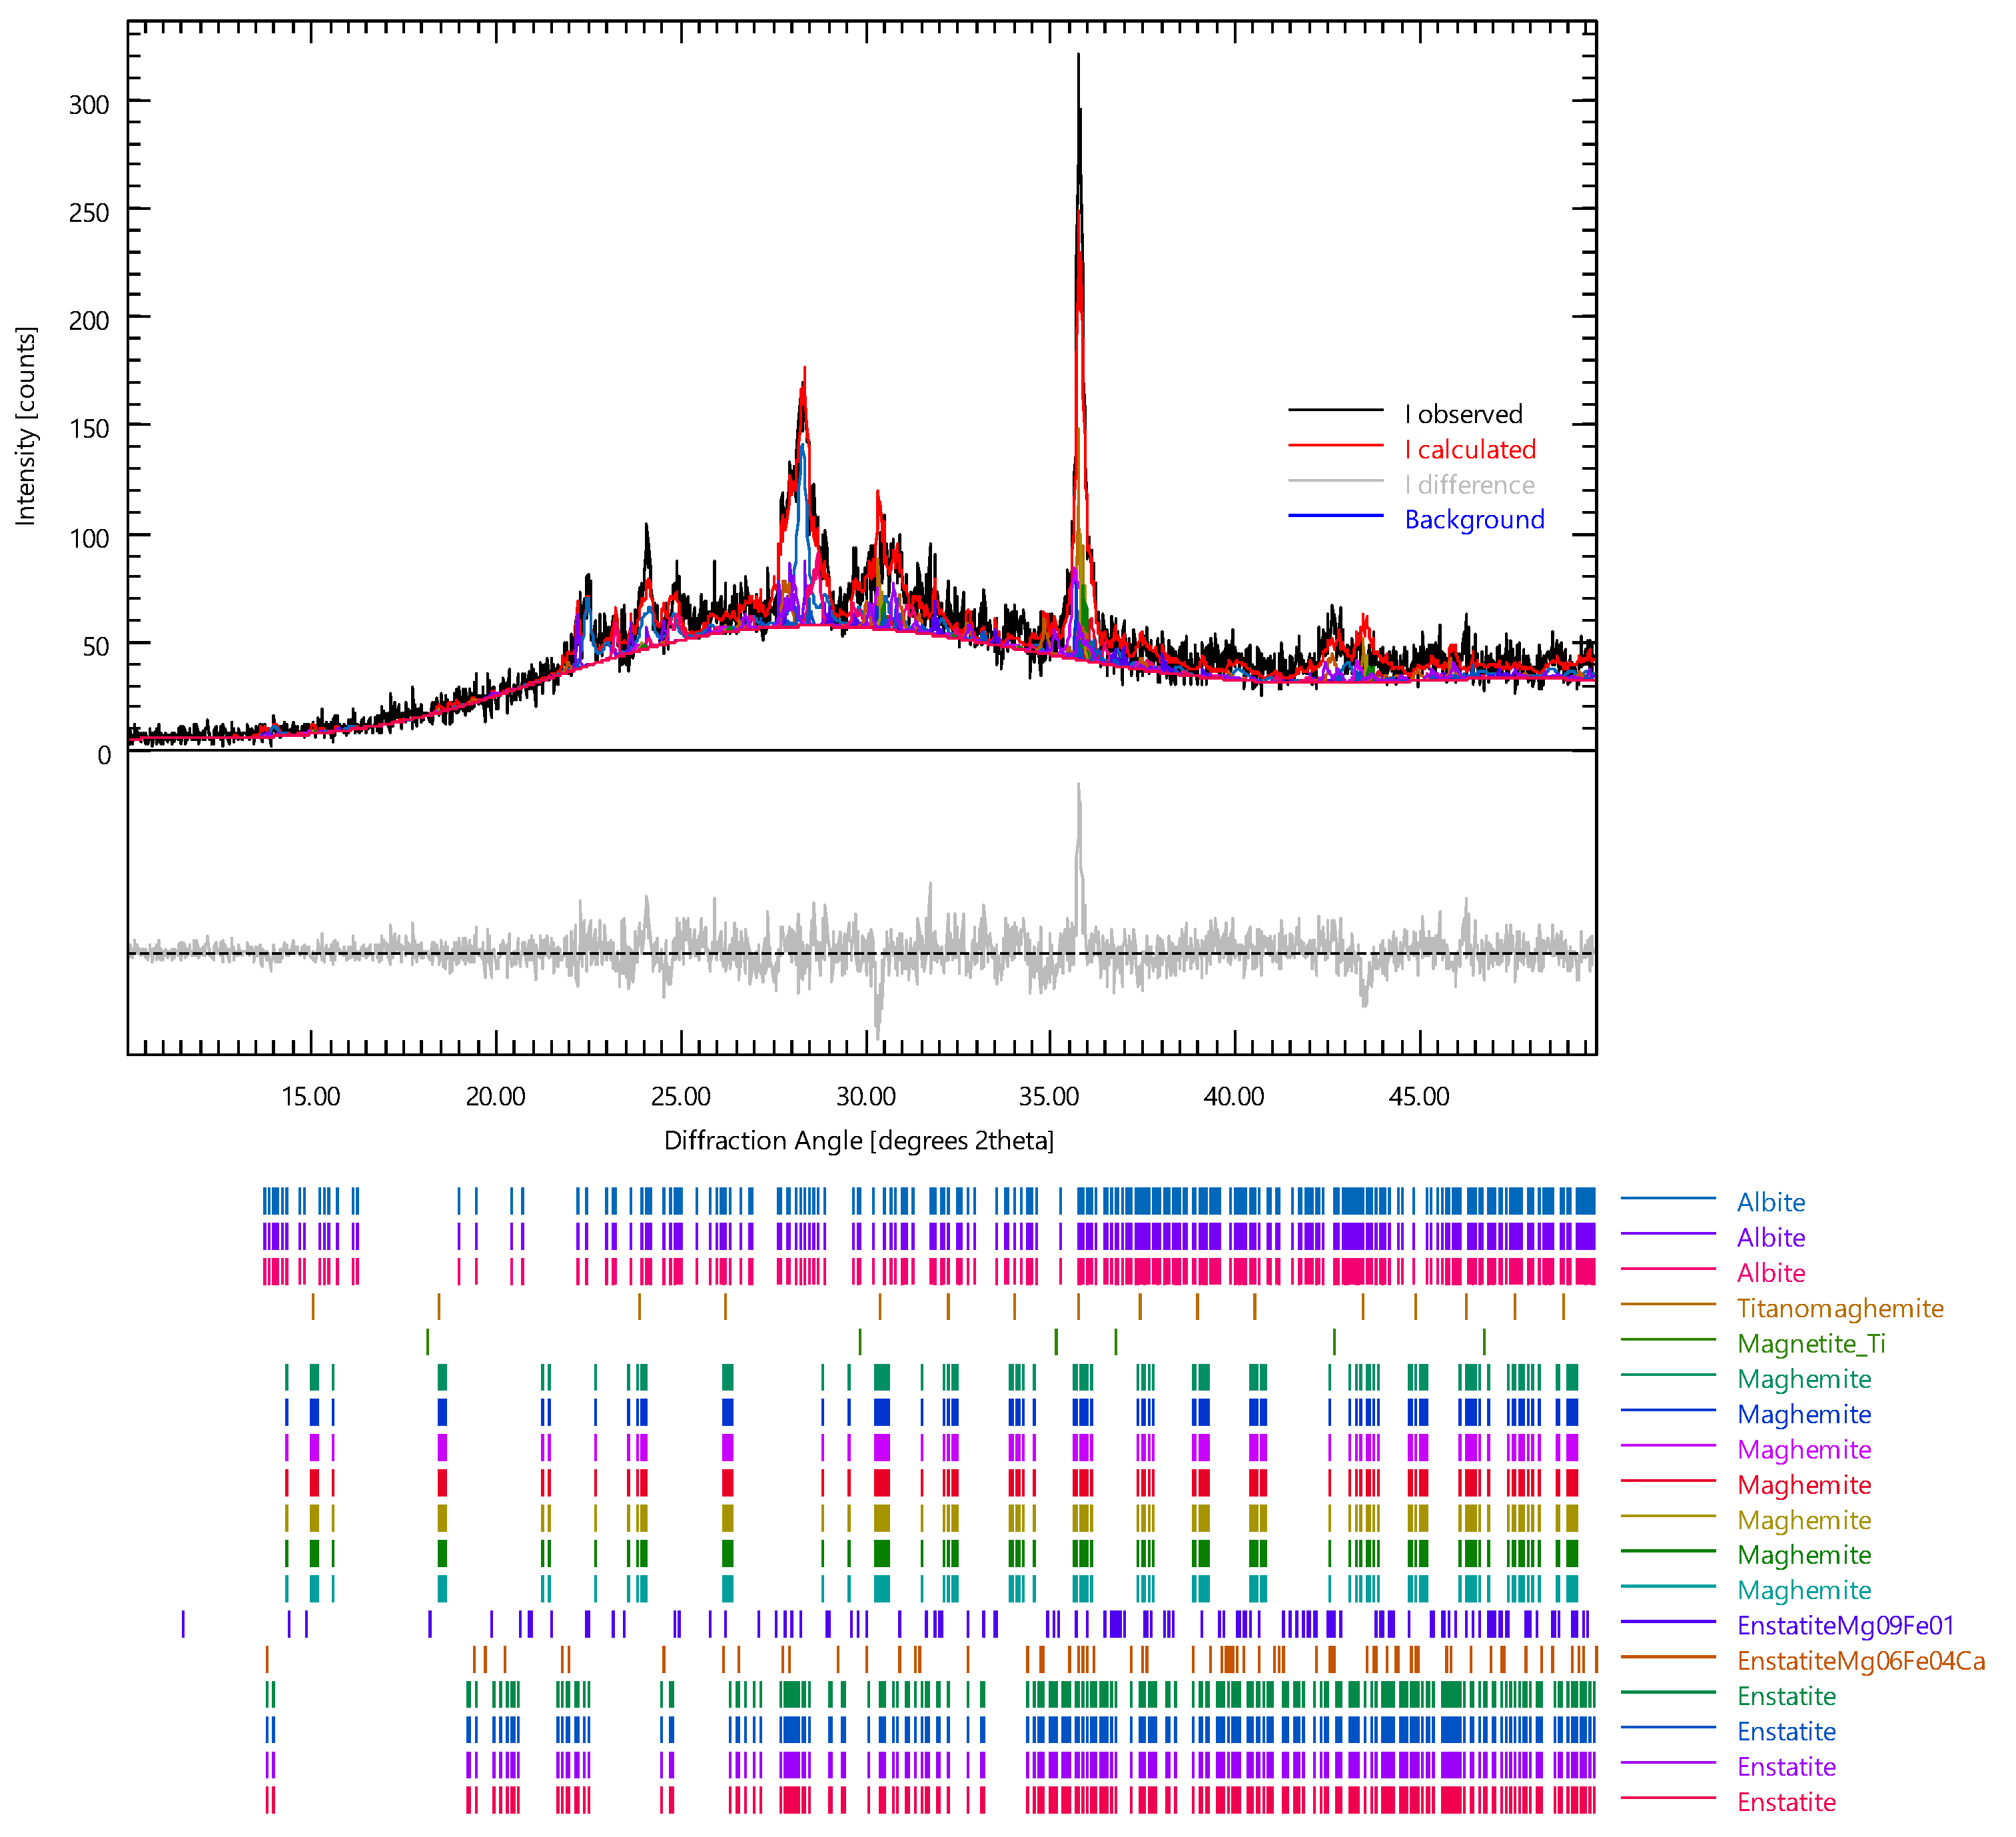
Figure 8.
XRD and fired volcanic ash. Insert: as is volcanic ash (A) and crushed and fired volcanic ash (B).
Figure 8.
XRD and fired volcanic ash. Insert: as is volcanic ash (A) and crushed and fired volcanic ash (B).
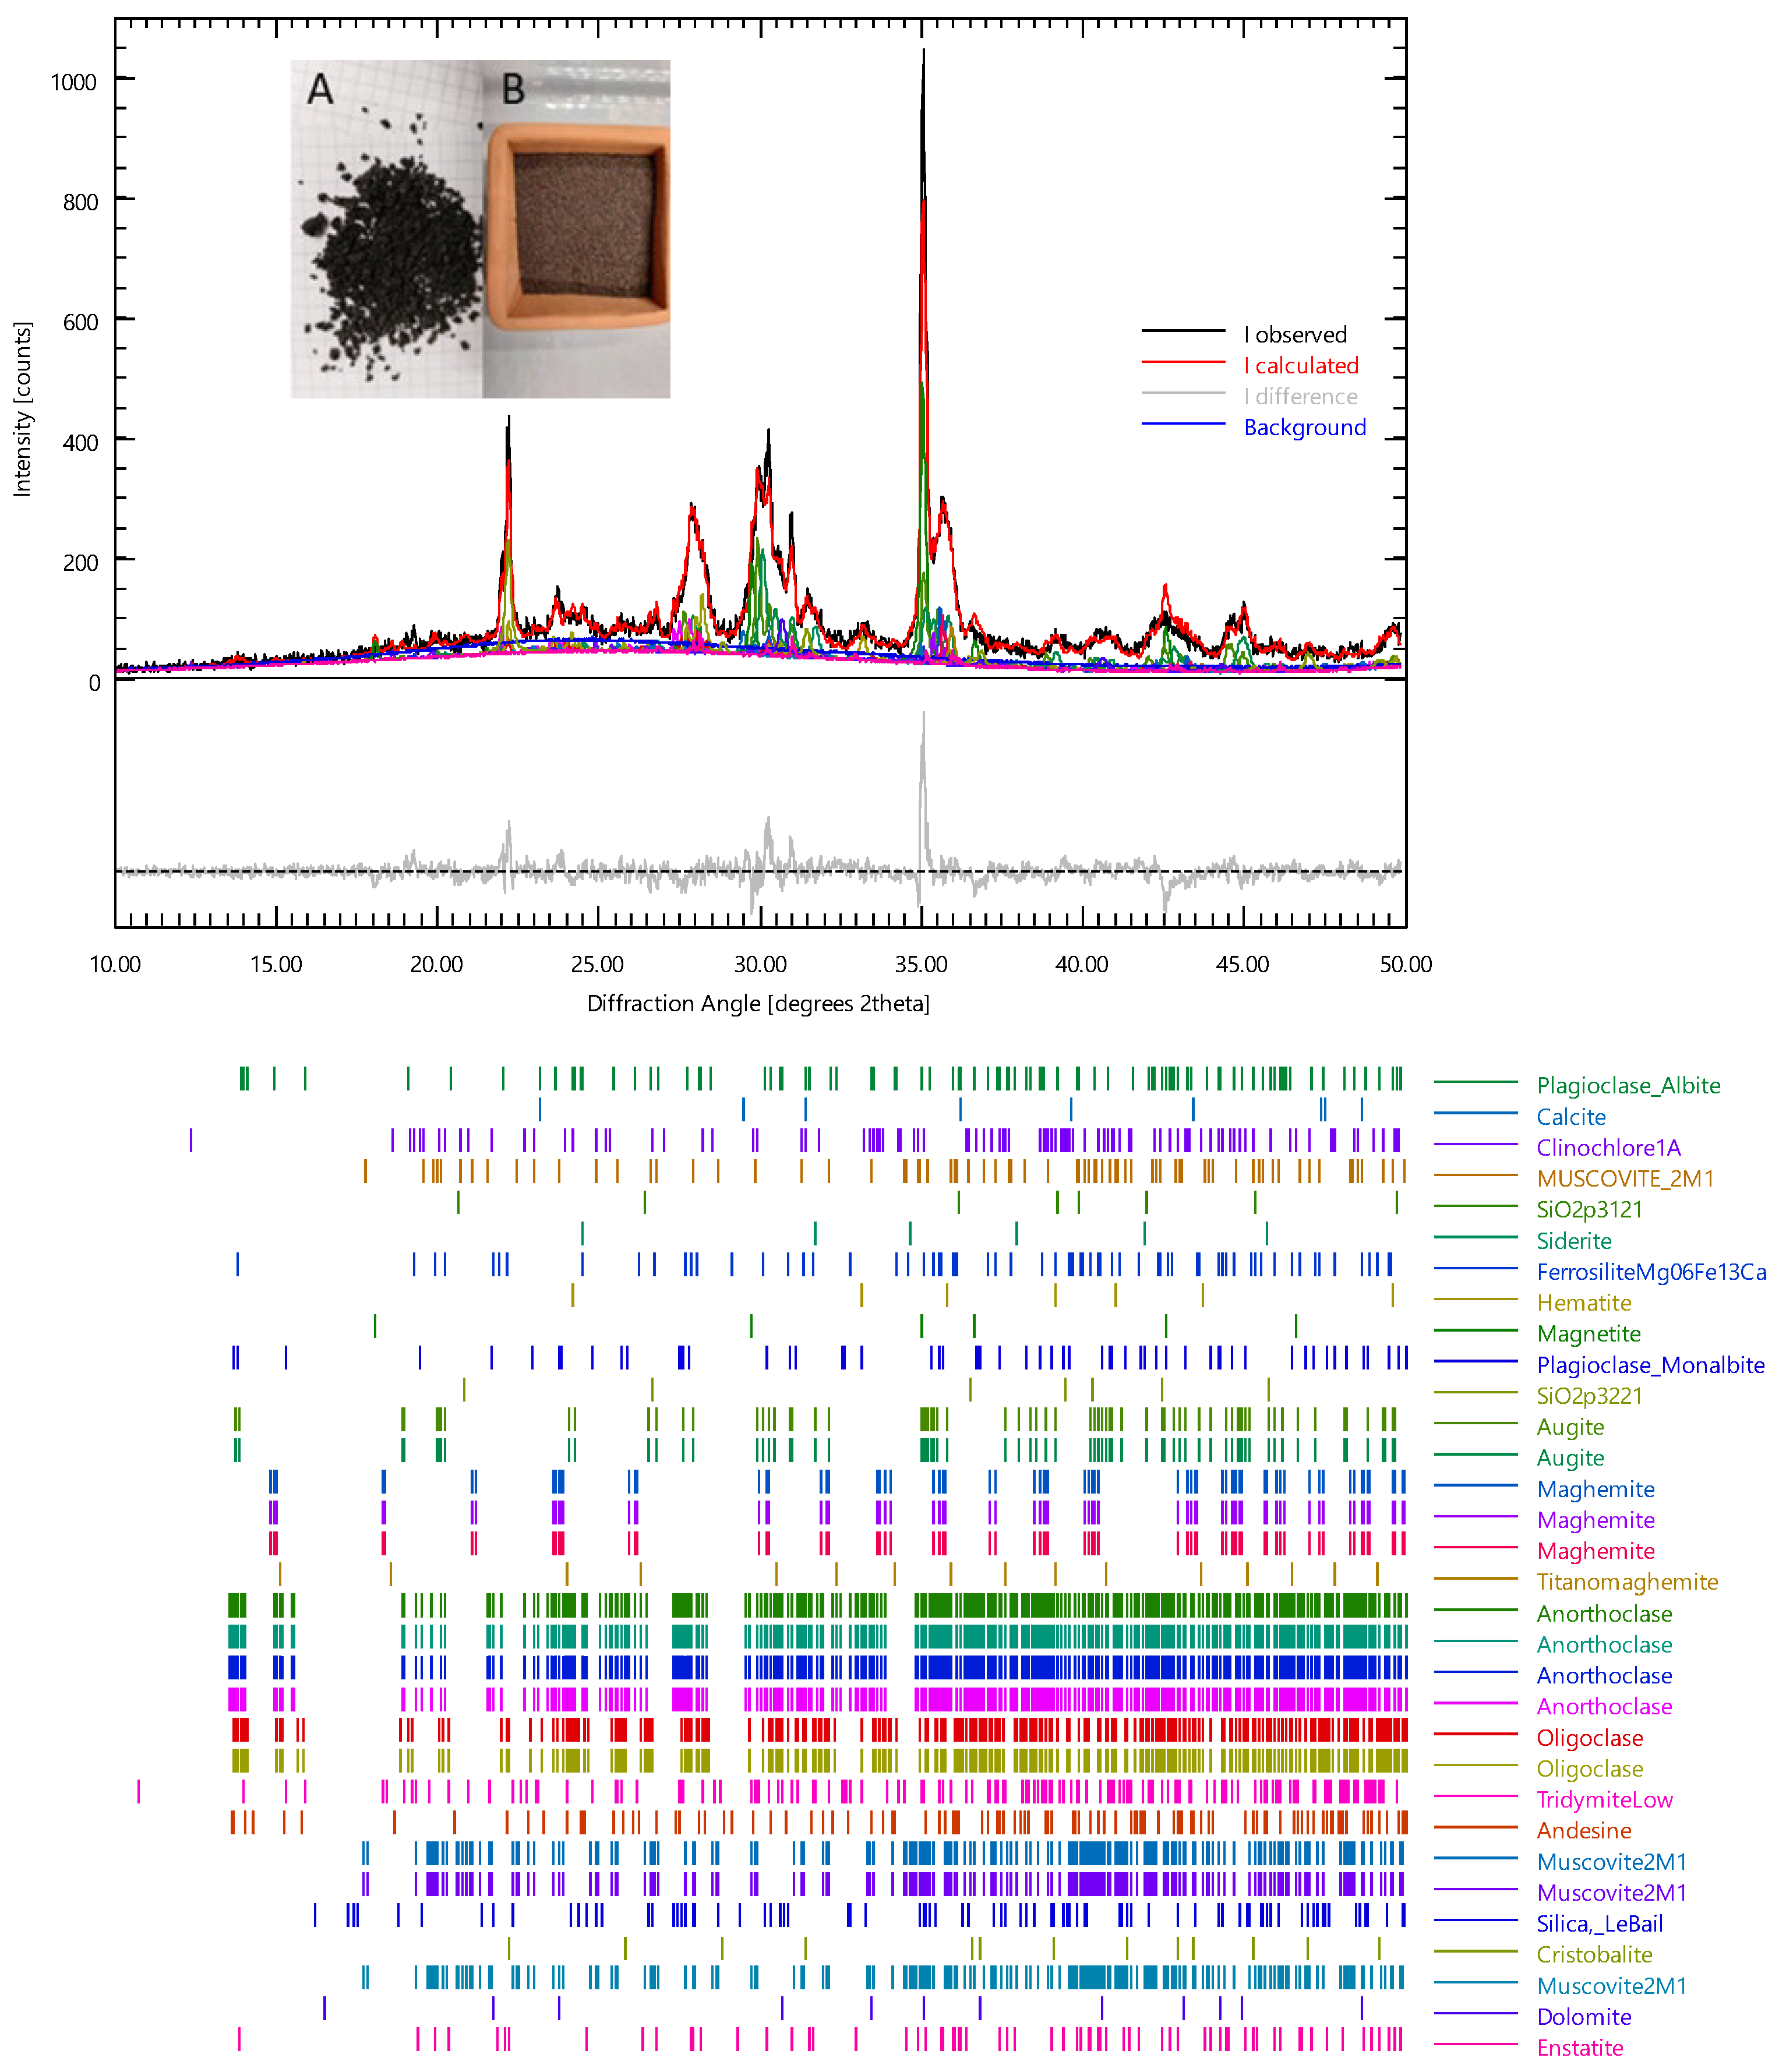
Figure 9.
(A) photoluminescent powders, (B) photoluminescent powders after exposure to light and.

Figure 10.
Unfired specimens with percentage of volcanic ash: (a) B, (b) BVA10, (c) BVA30 and (d) unbendable mixture with volcanic ash at 50% by weight.
Figure 10.
Unfired specimens with percentage of volcanic ash: (a) B, (b) BVA10, (c) BVA30 and (d) unbendable mixture with volcanic ash at 50% by weight.

Figure 11.
Length of the unbaked specimens (red line) and of fired ones at different percentages of volcanic ash. The bars display standard errors (SEs).
Figure 11.
Length of the unbaked specimens (red line) and of fired ones at different percentages of volcanic ash. The bars display standard errors (SEs).
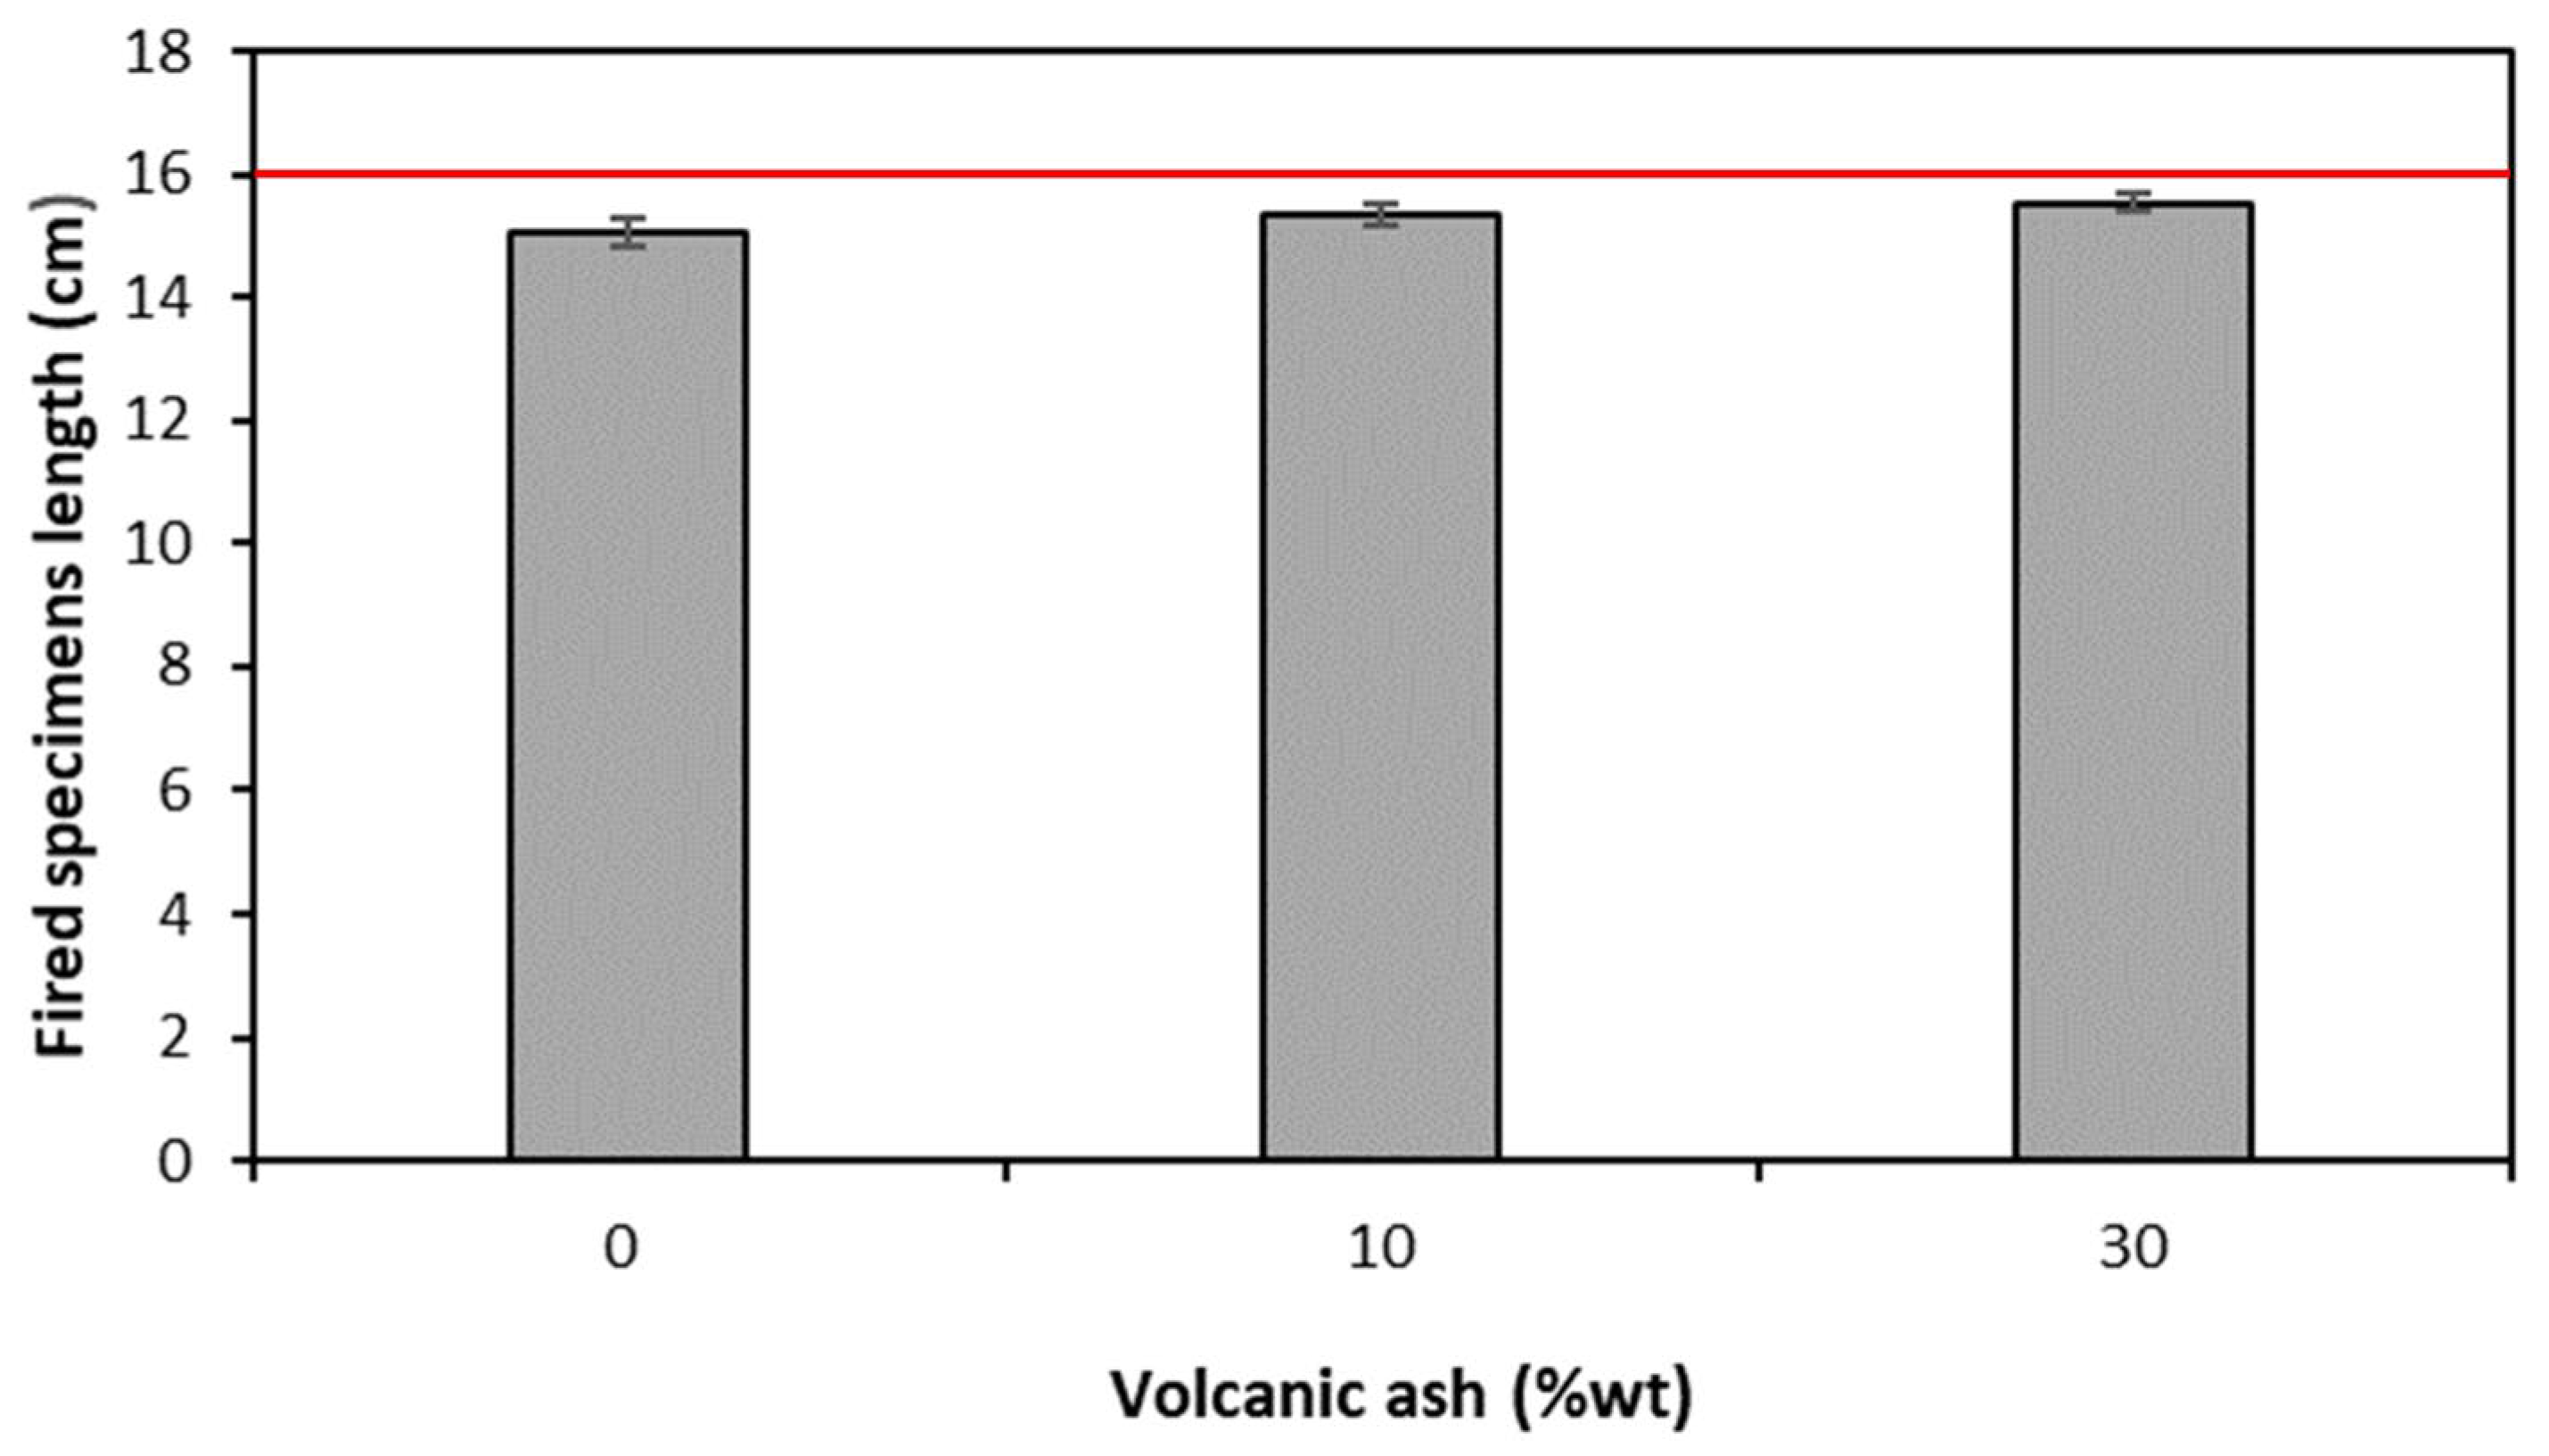
Figure 12.
Weight loss (%) after firing specimens with different volcanic ash contents. The bars display standard errors (SEs).
Figure 12.
Weight loss (%) after firing specimens with different volcanic ash contents. The bars display standard errors (SEs).

Figure 13.
Compressive and flexural strengths as a function of the percentage of volcanic ash. The bars display standard errors (SEs).
Figure 13.
Compressive and flexural strengths as a function of the percentage of volcanic ash. The bars display standard errors (SEs).
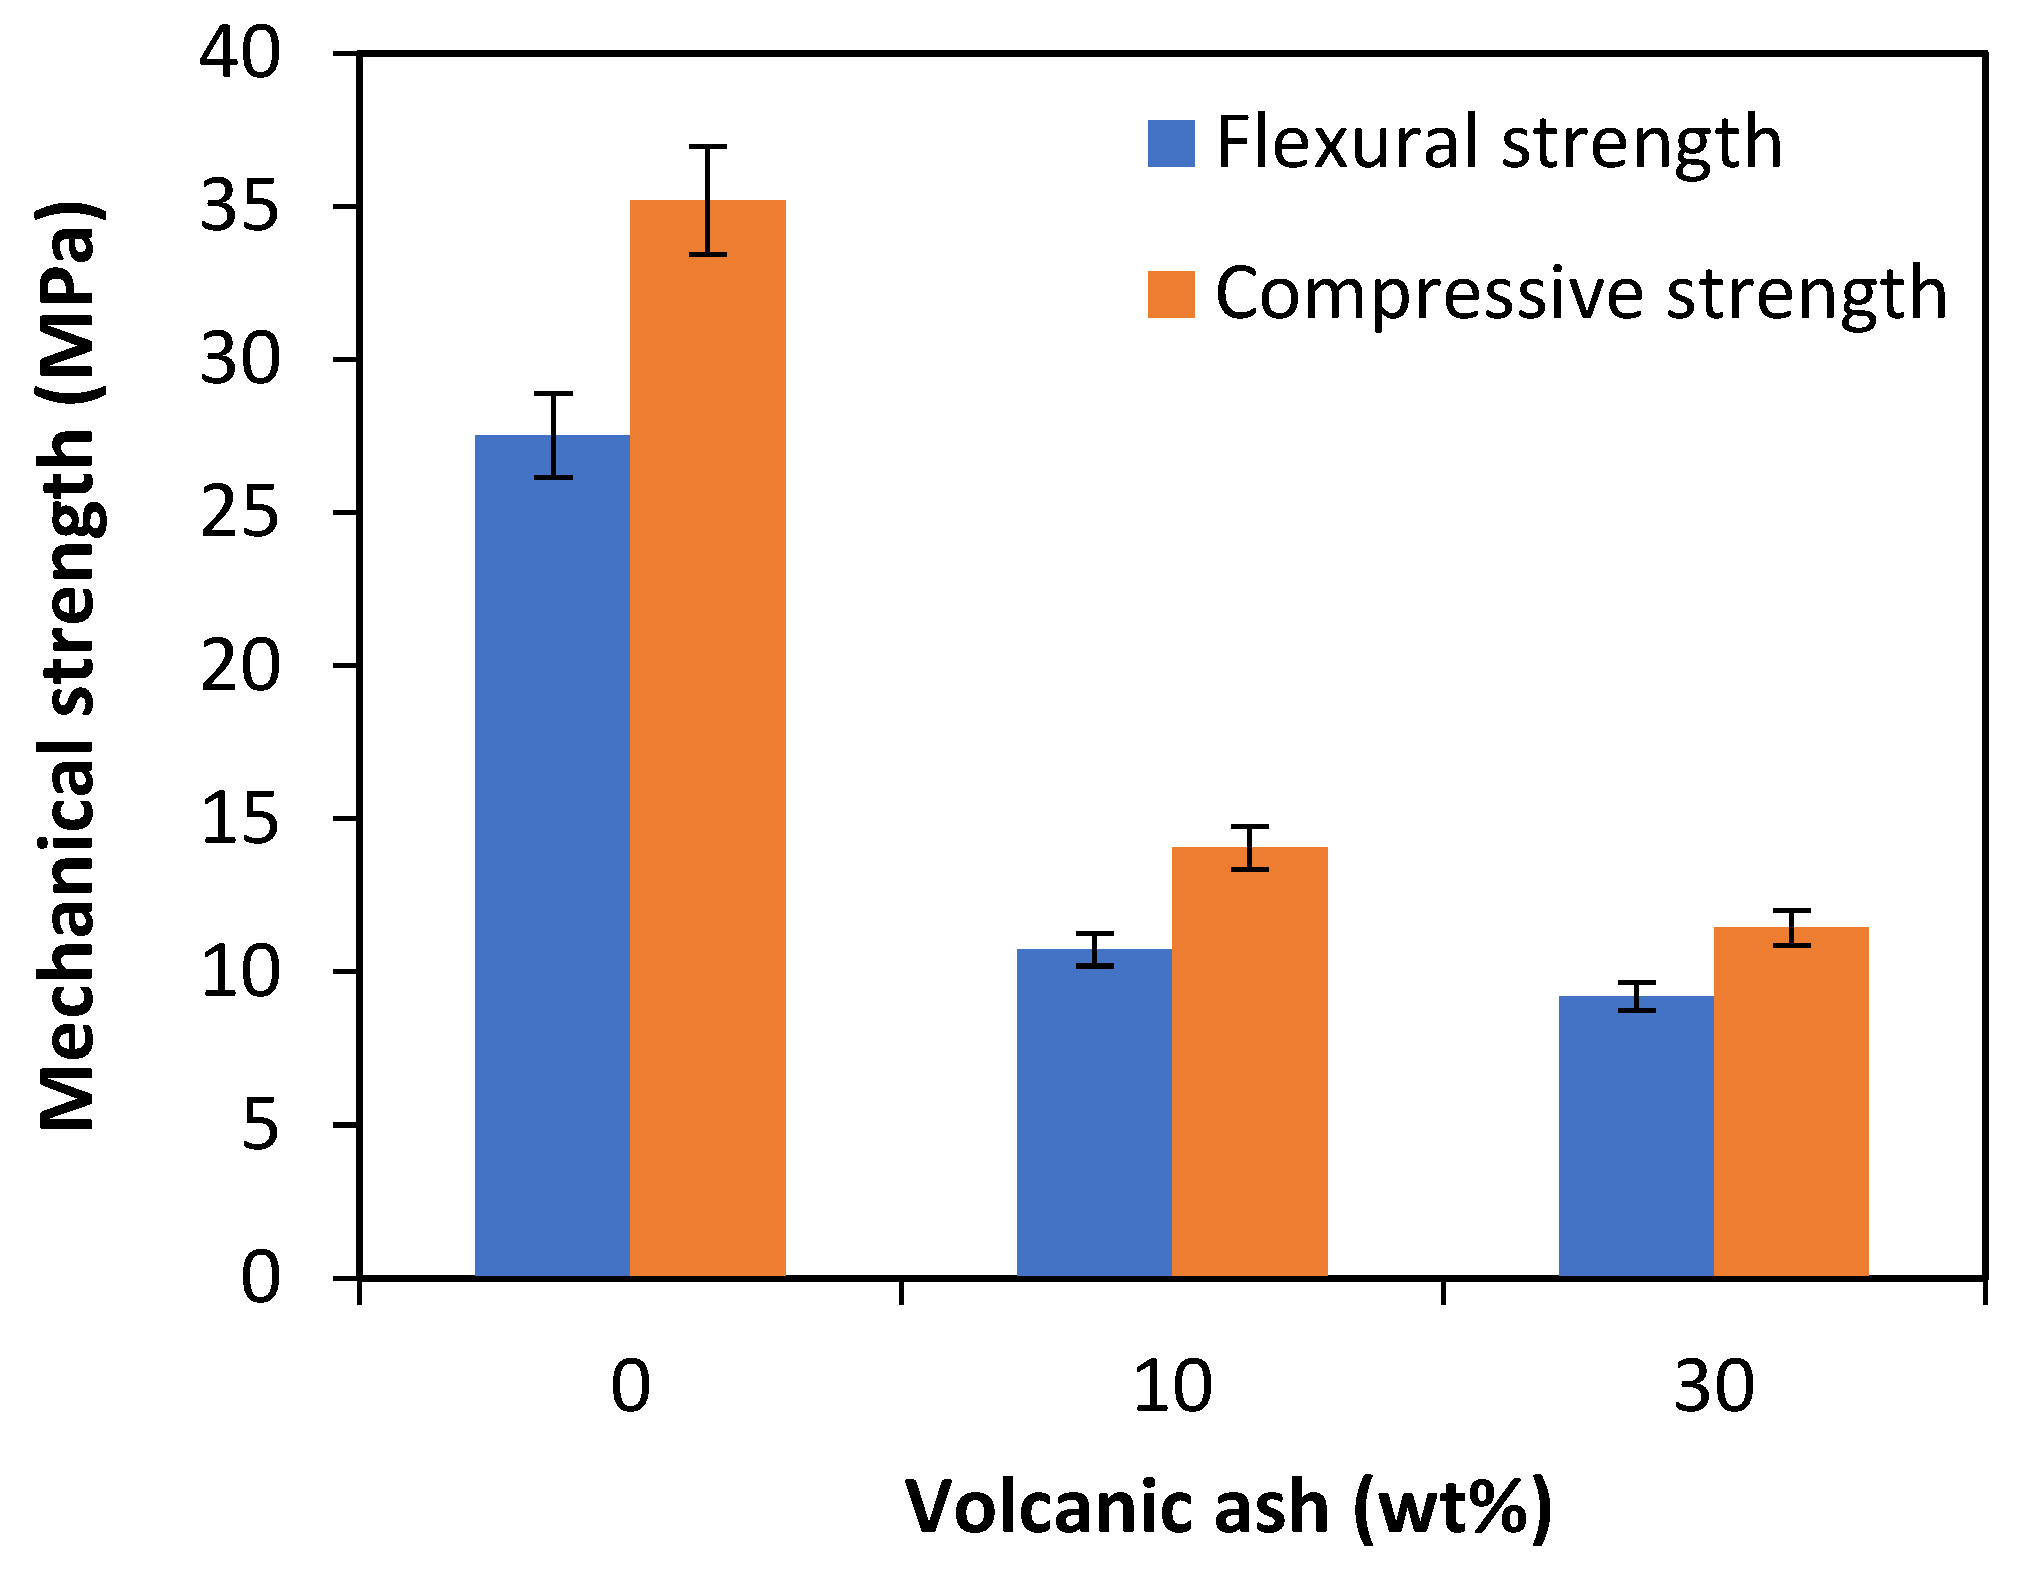
Figure 14.
(A–C) SEM and EDX analyses of B sample. EDX spectra (red measured, blue calculated) have been obtained by analyzing the area in the red circled spots.
Figure 14.
(A–C) SEM and EDX analyses of B sample. EDX spectra (red measured, blue calculated) have been obtained by analyzing the area in the red circled spots.


Figure 15.
XRD pattern of powdered B sample after firing.
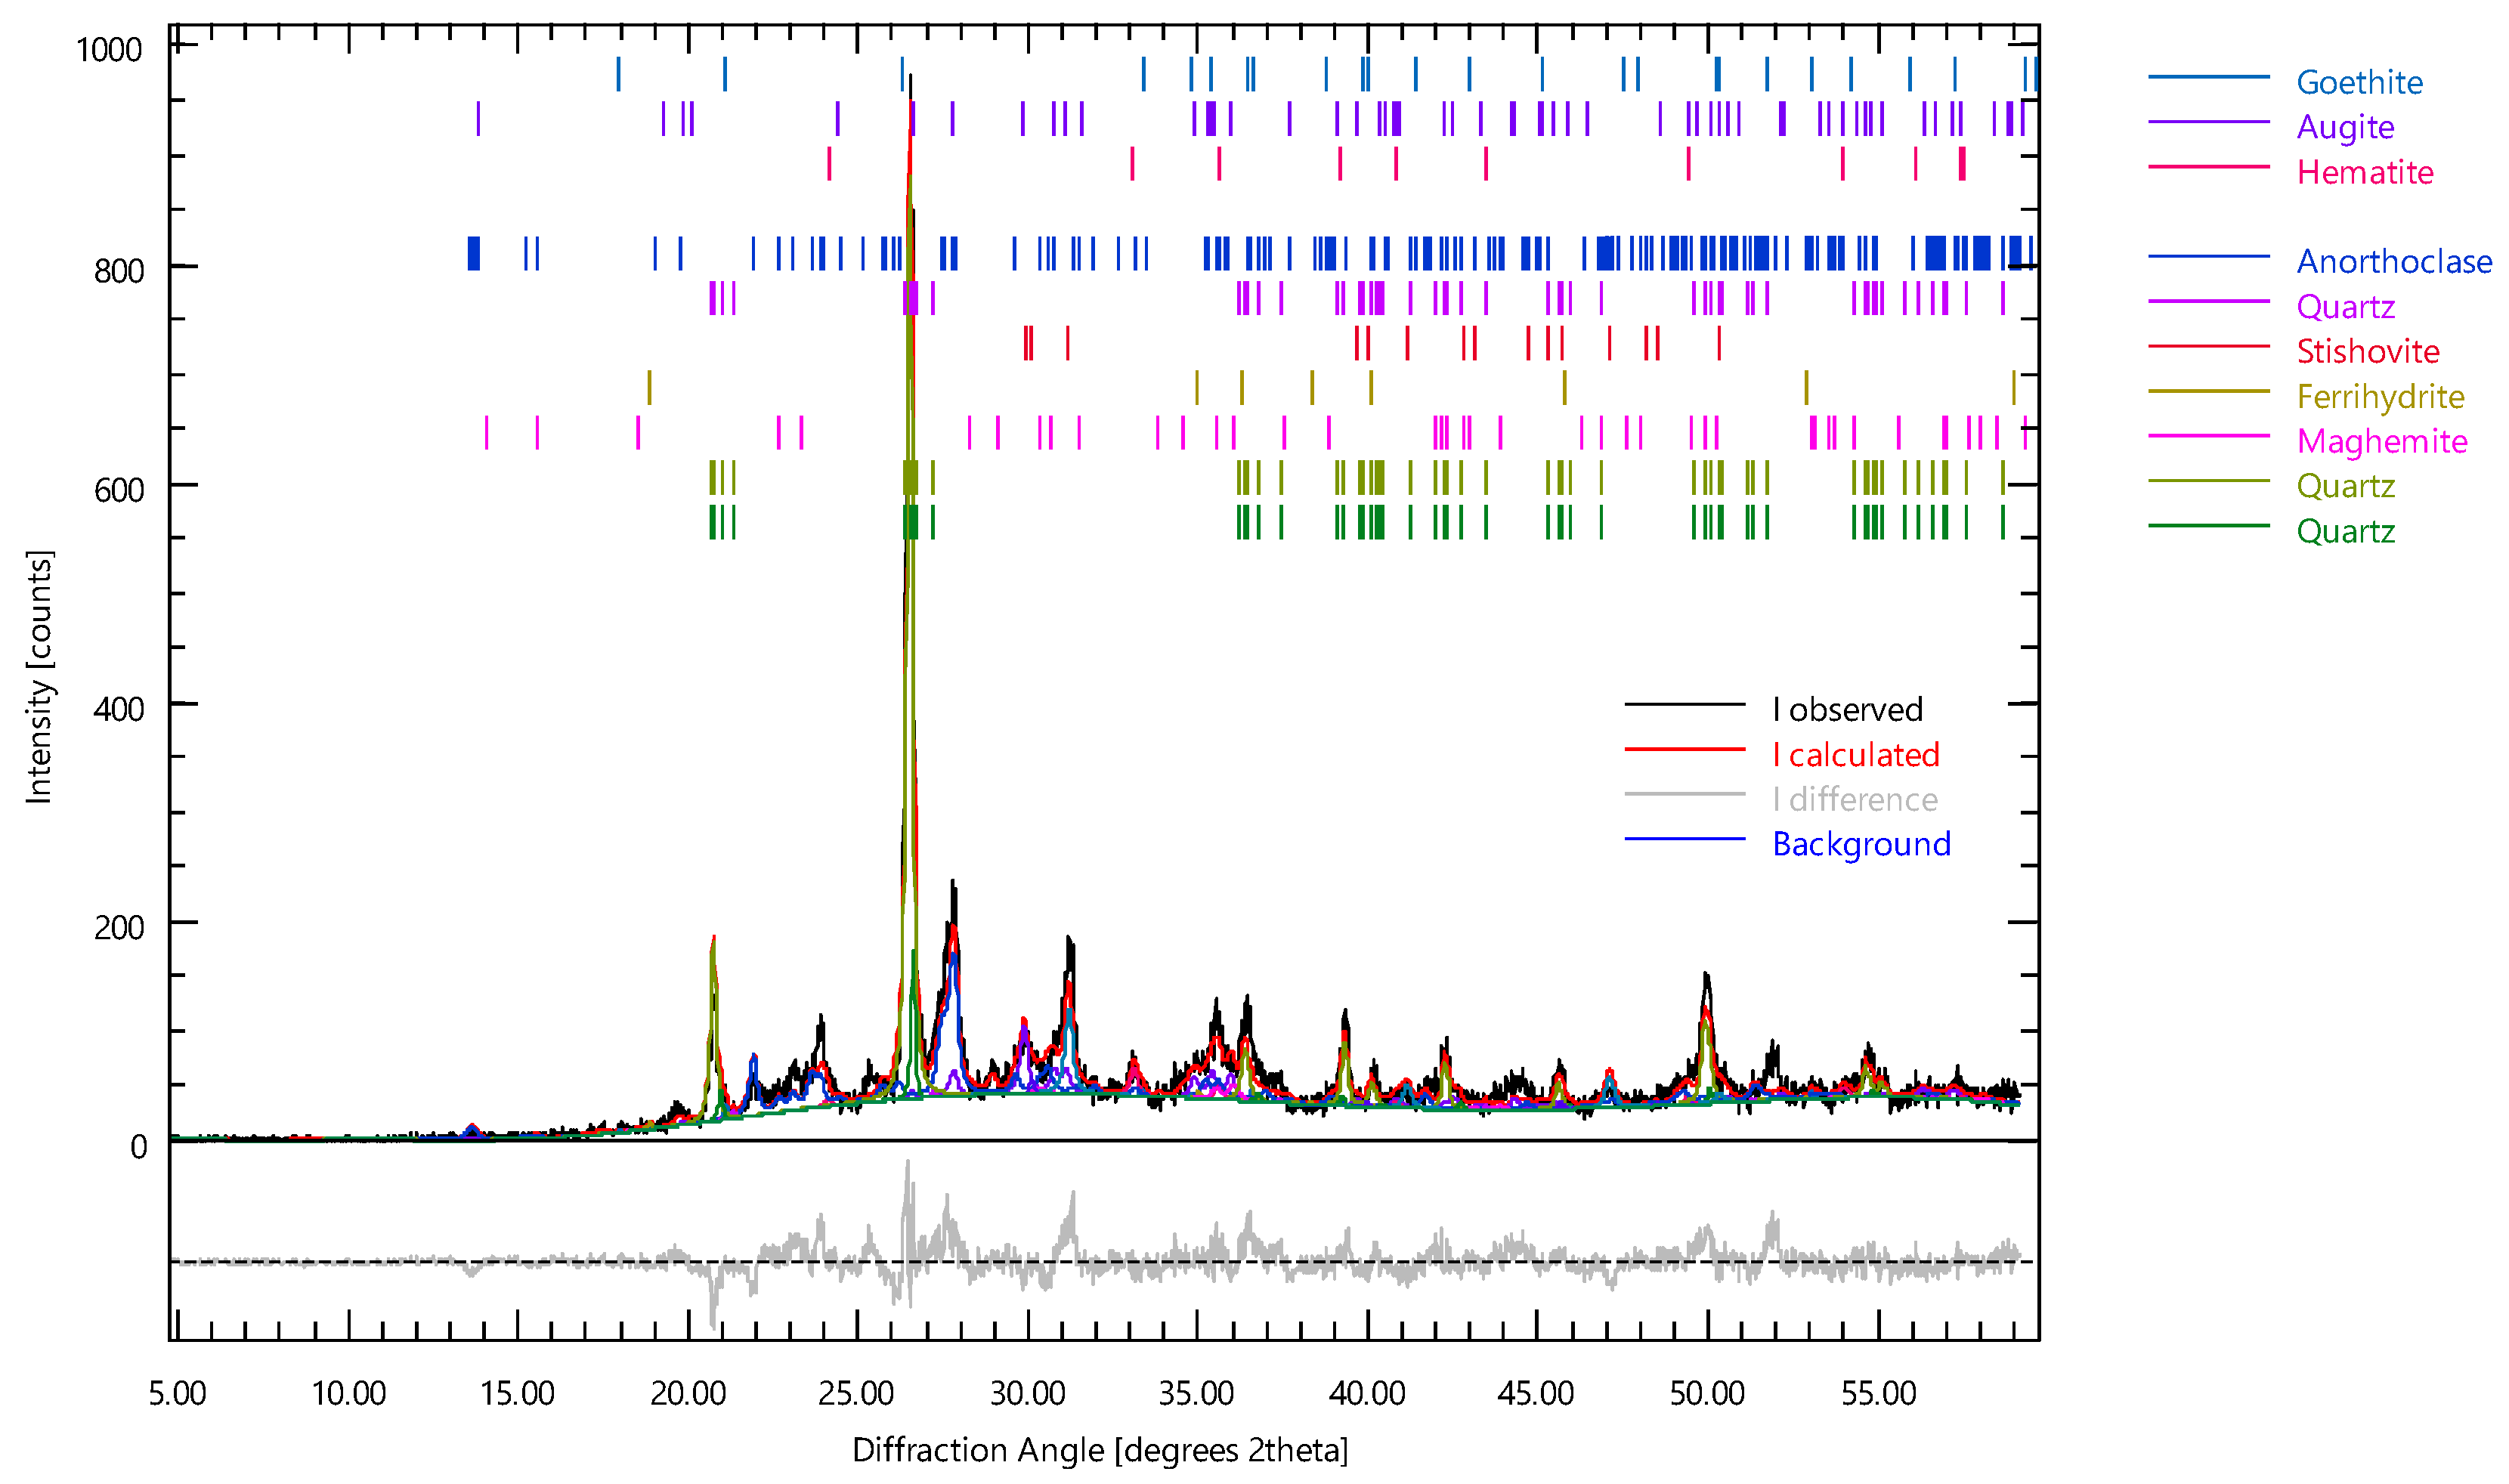
Figure 16.
(A–C) SEM and EDX analyses of BVA30 sample. EDX spectra (red measured, blue calculated) have been obtained by analyzing the area in the red circled spots.
Figure 16.
(A–C) SEM and EDX analyses of BVA30 sample. EDX spectra (red measured, blue calculated) have been obtained by analyzing the area in the red circled spots.
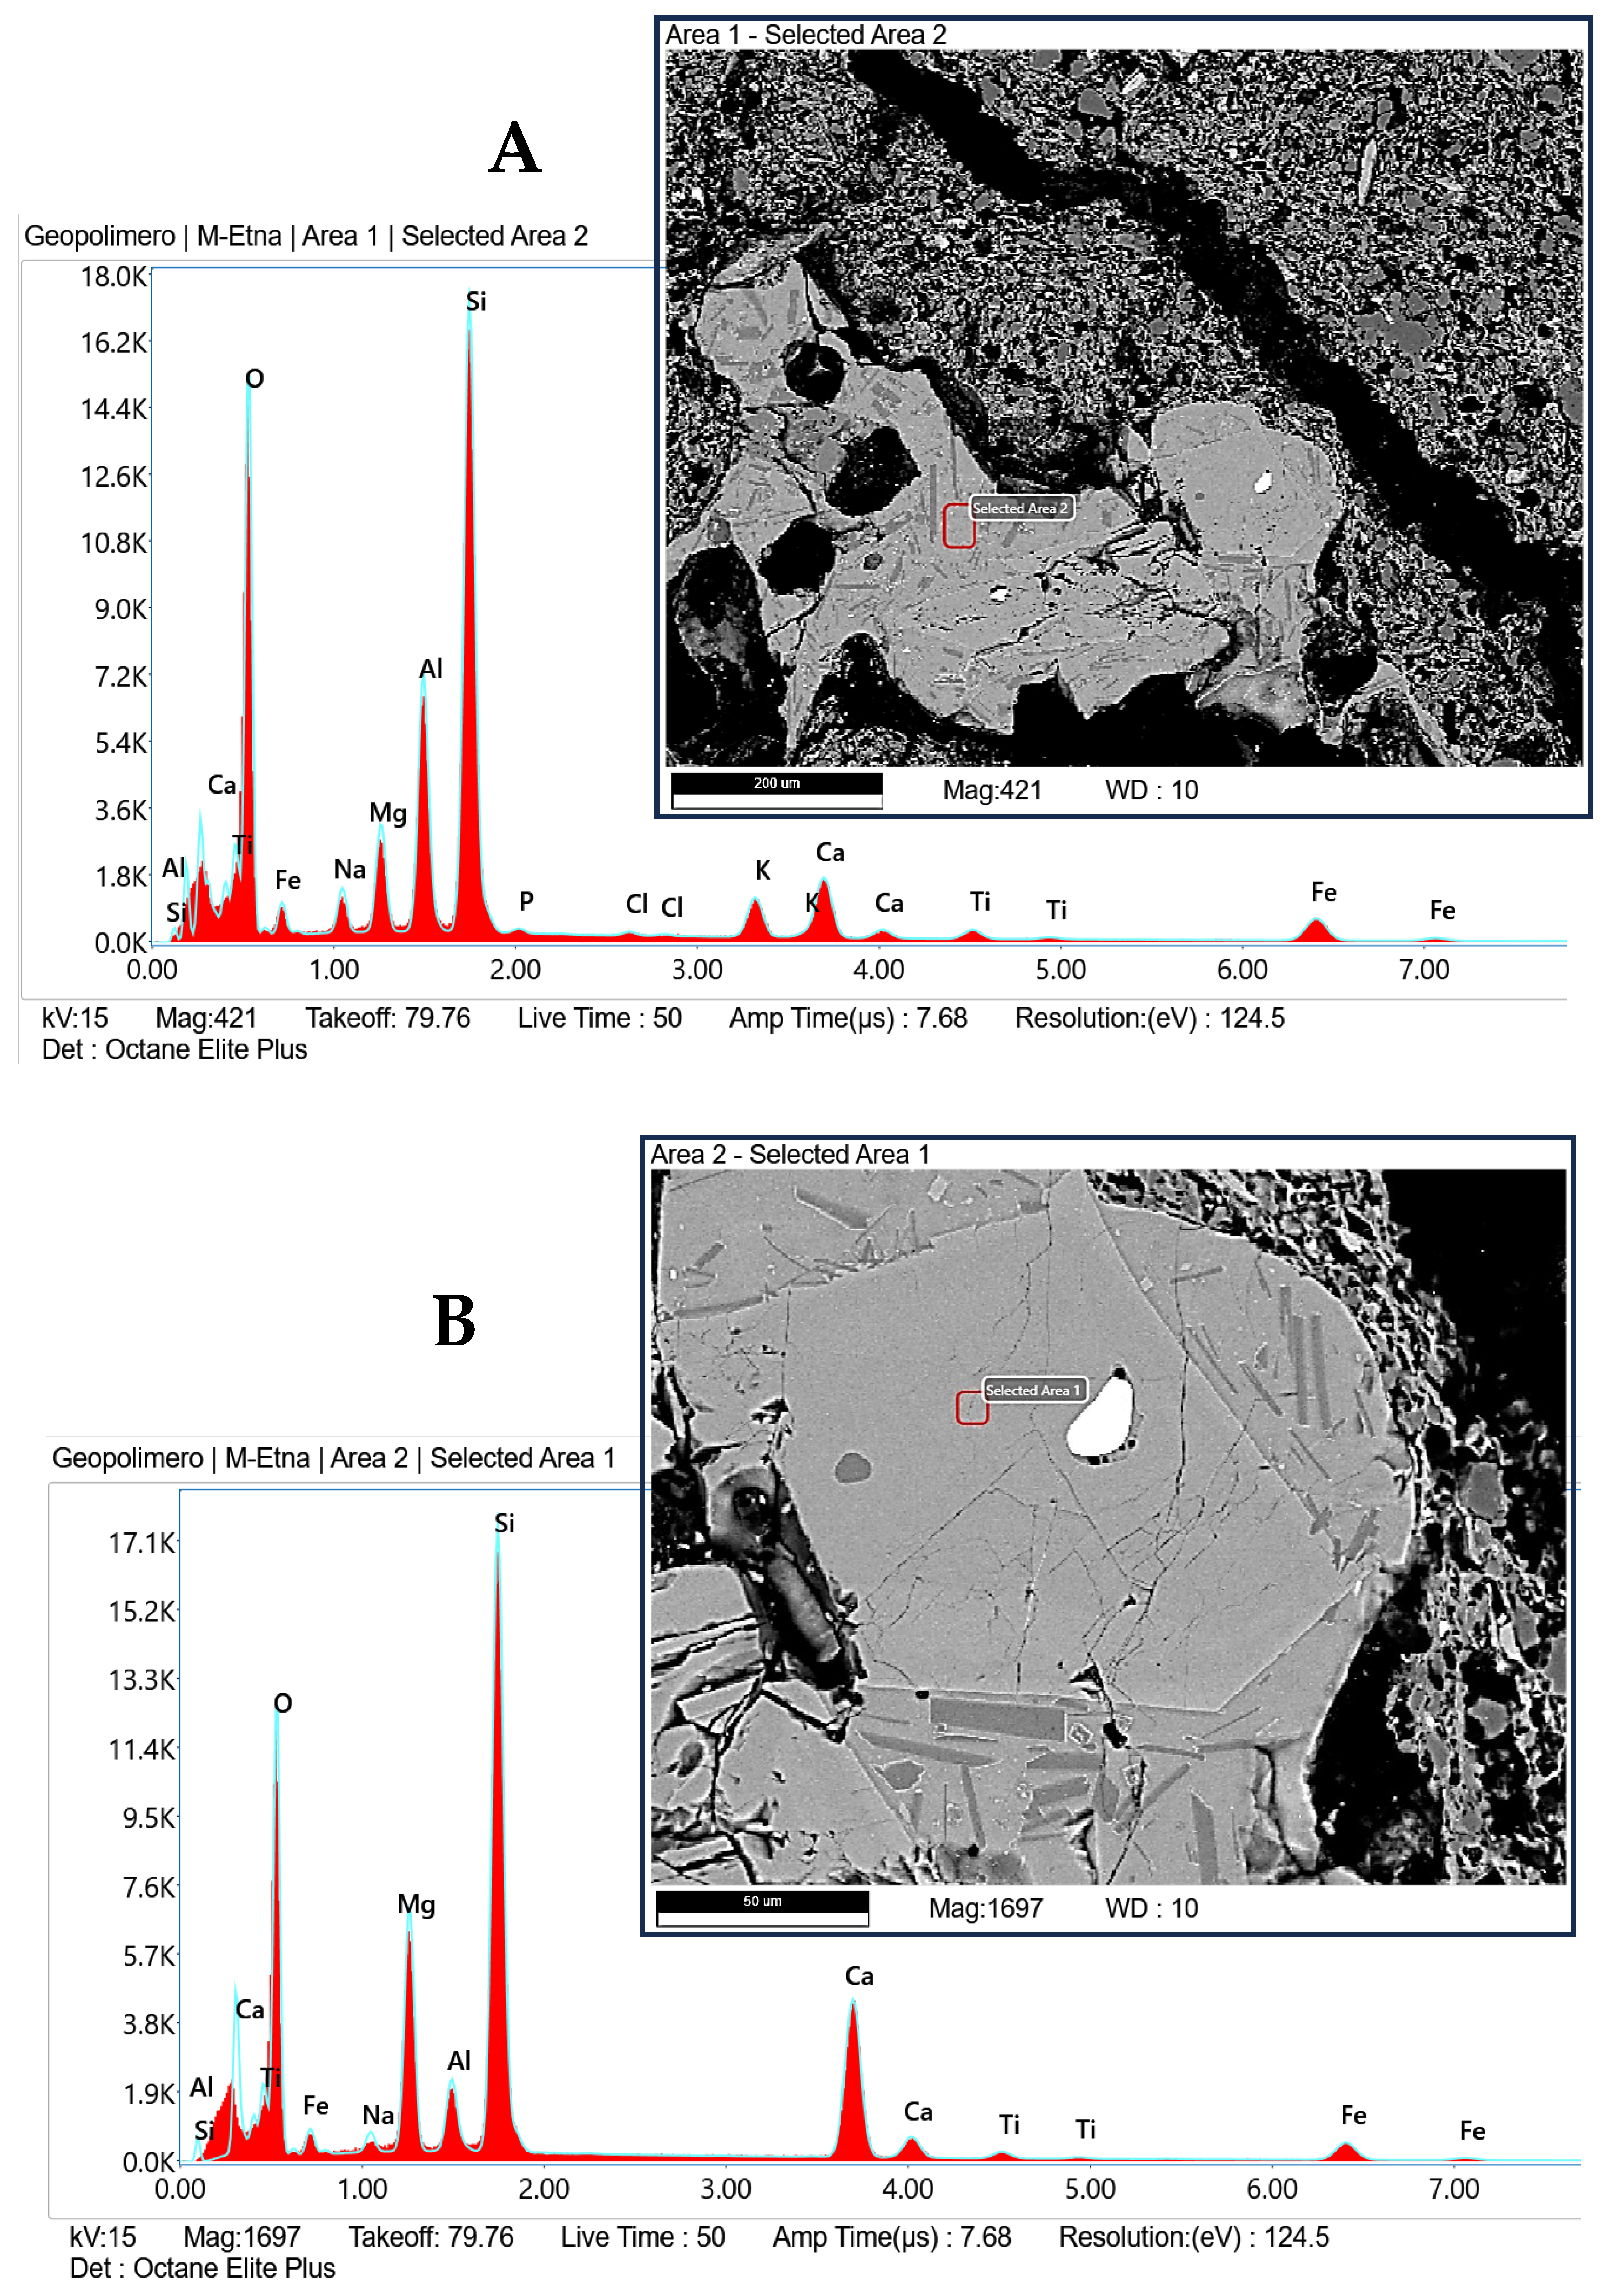
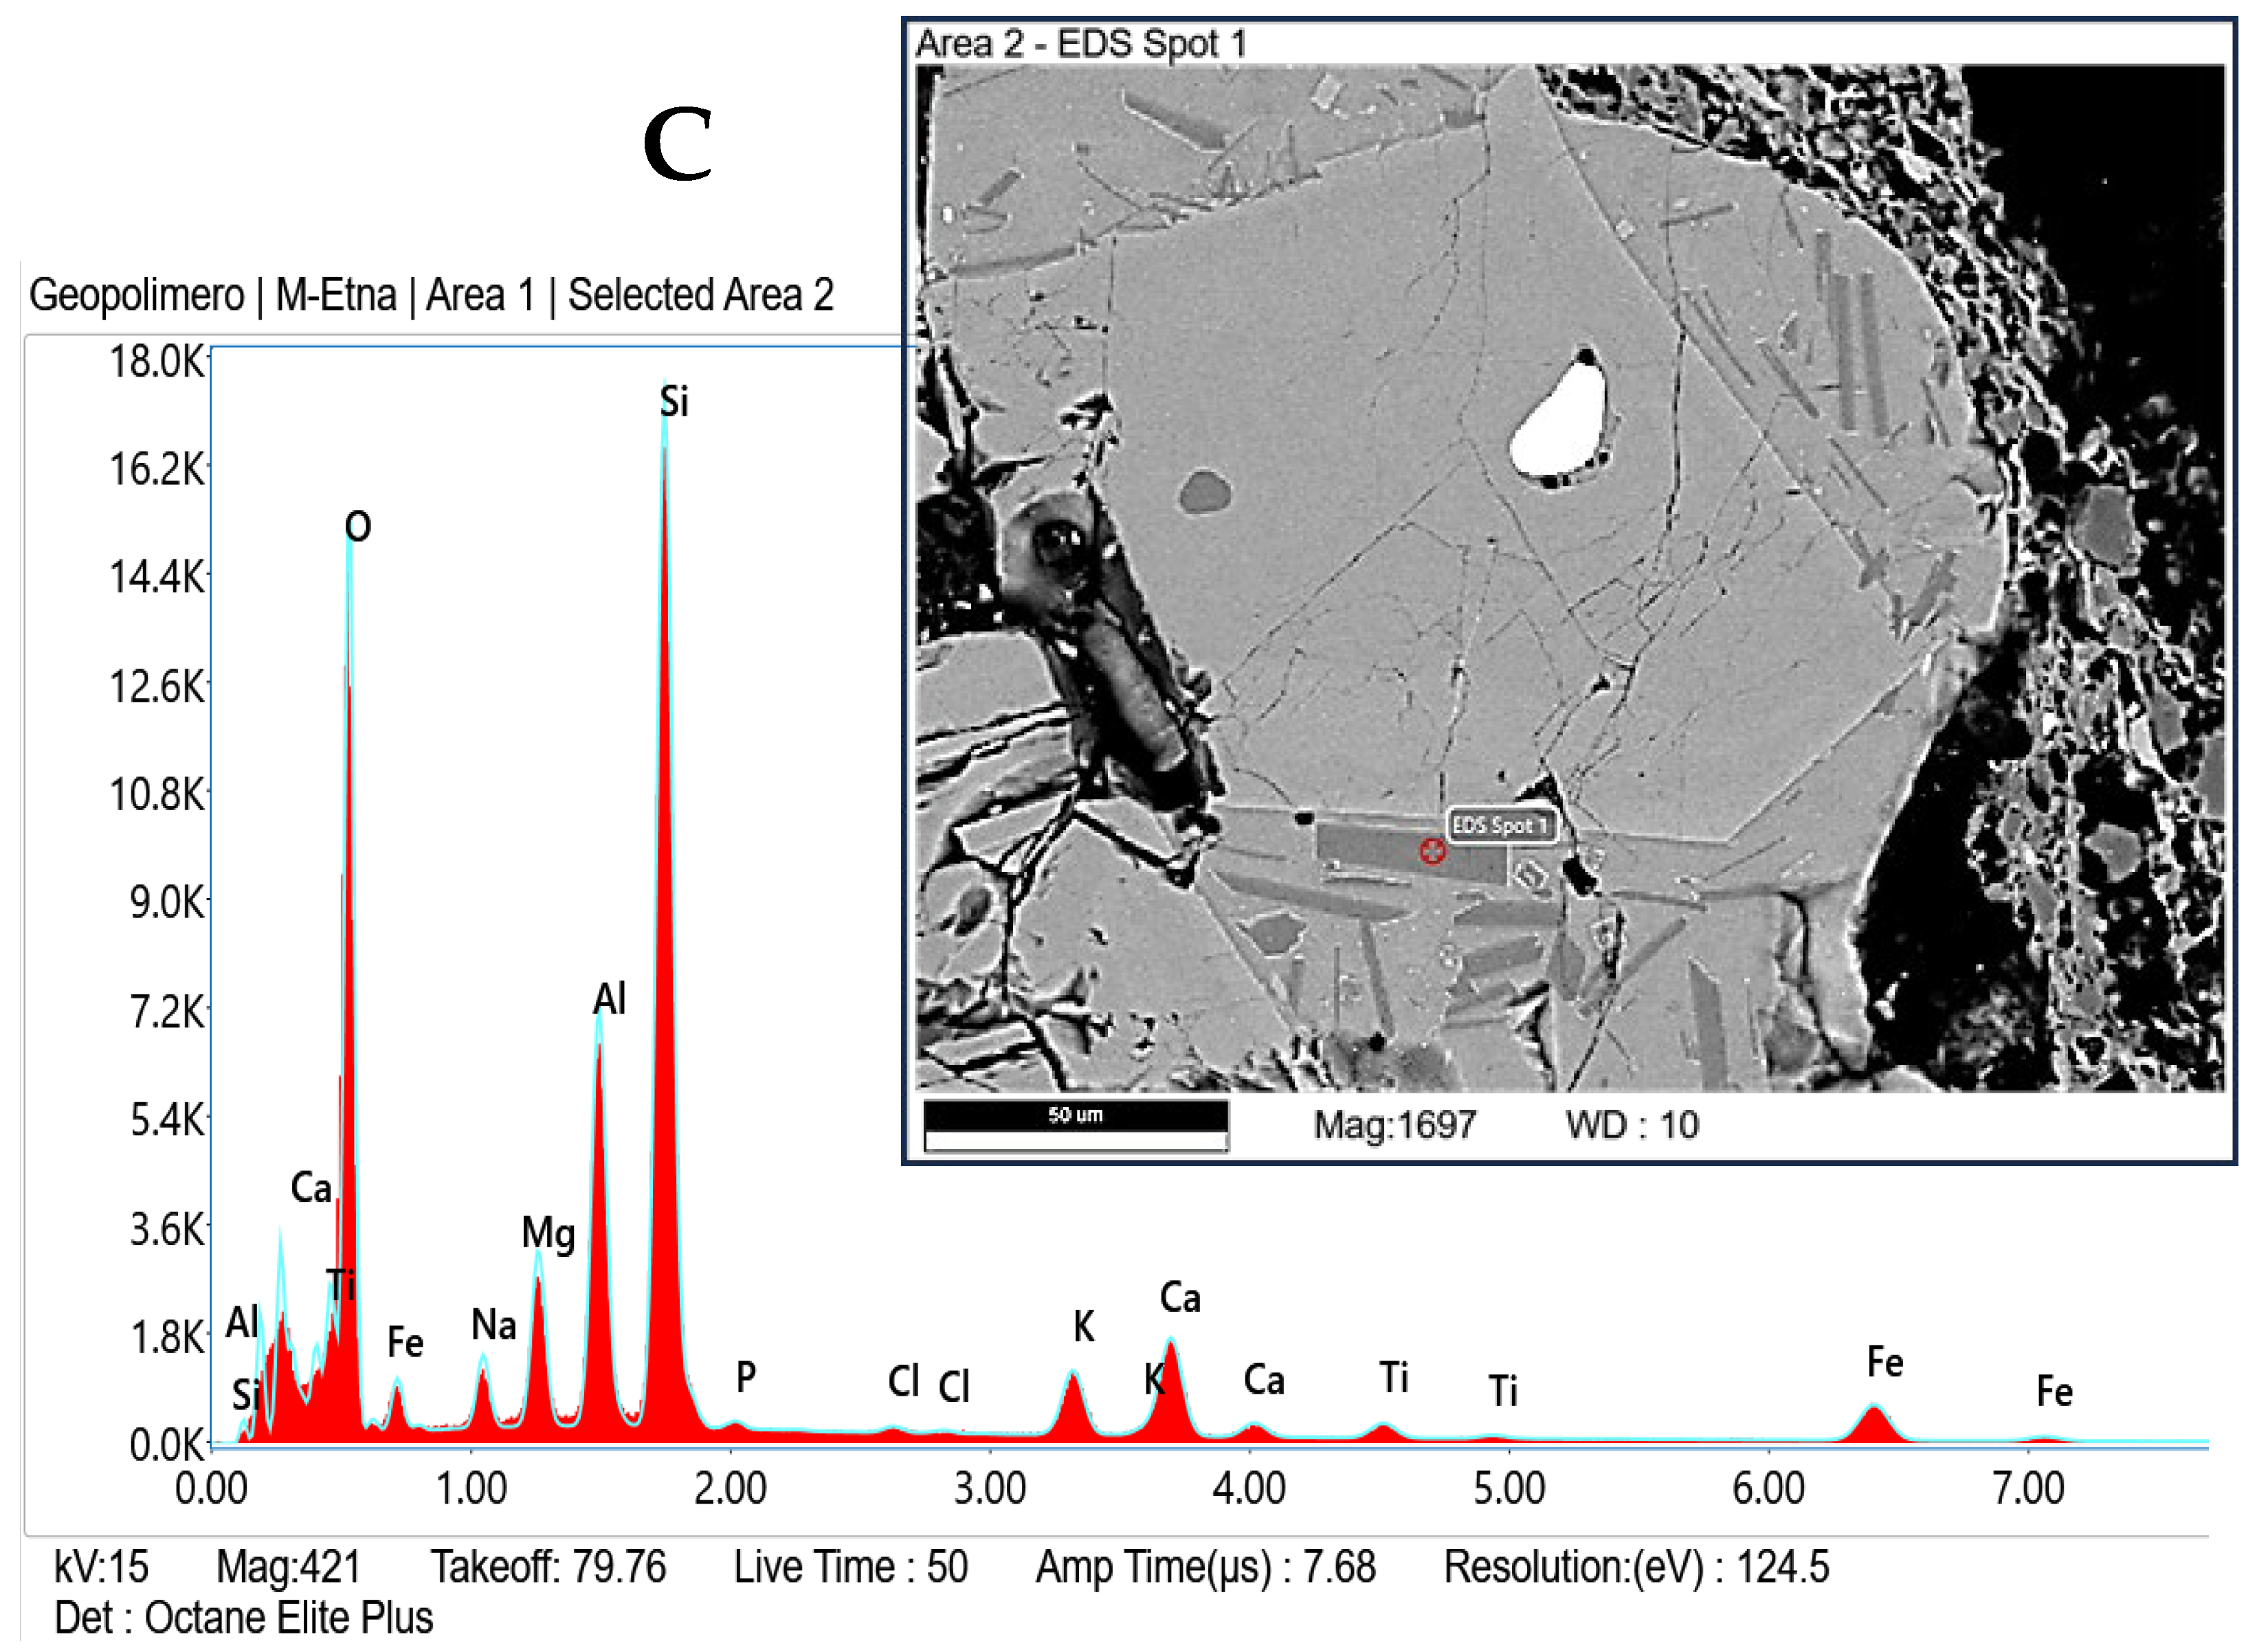
Figure 17.
XRD pattern for powdered BVA30 sample after firing.
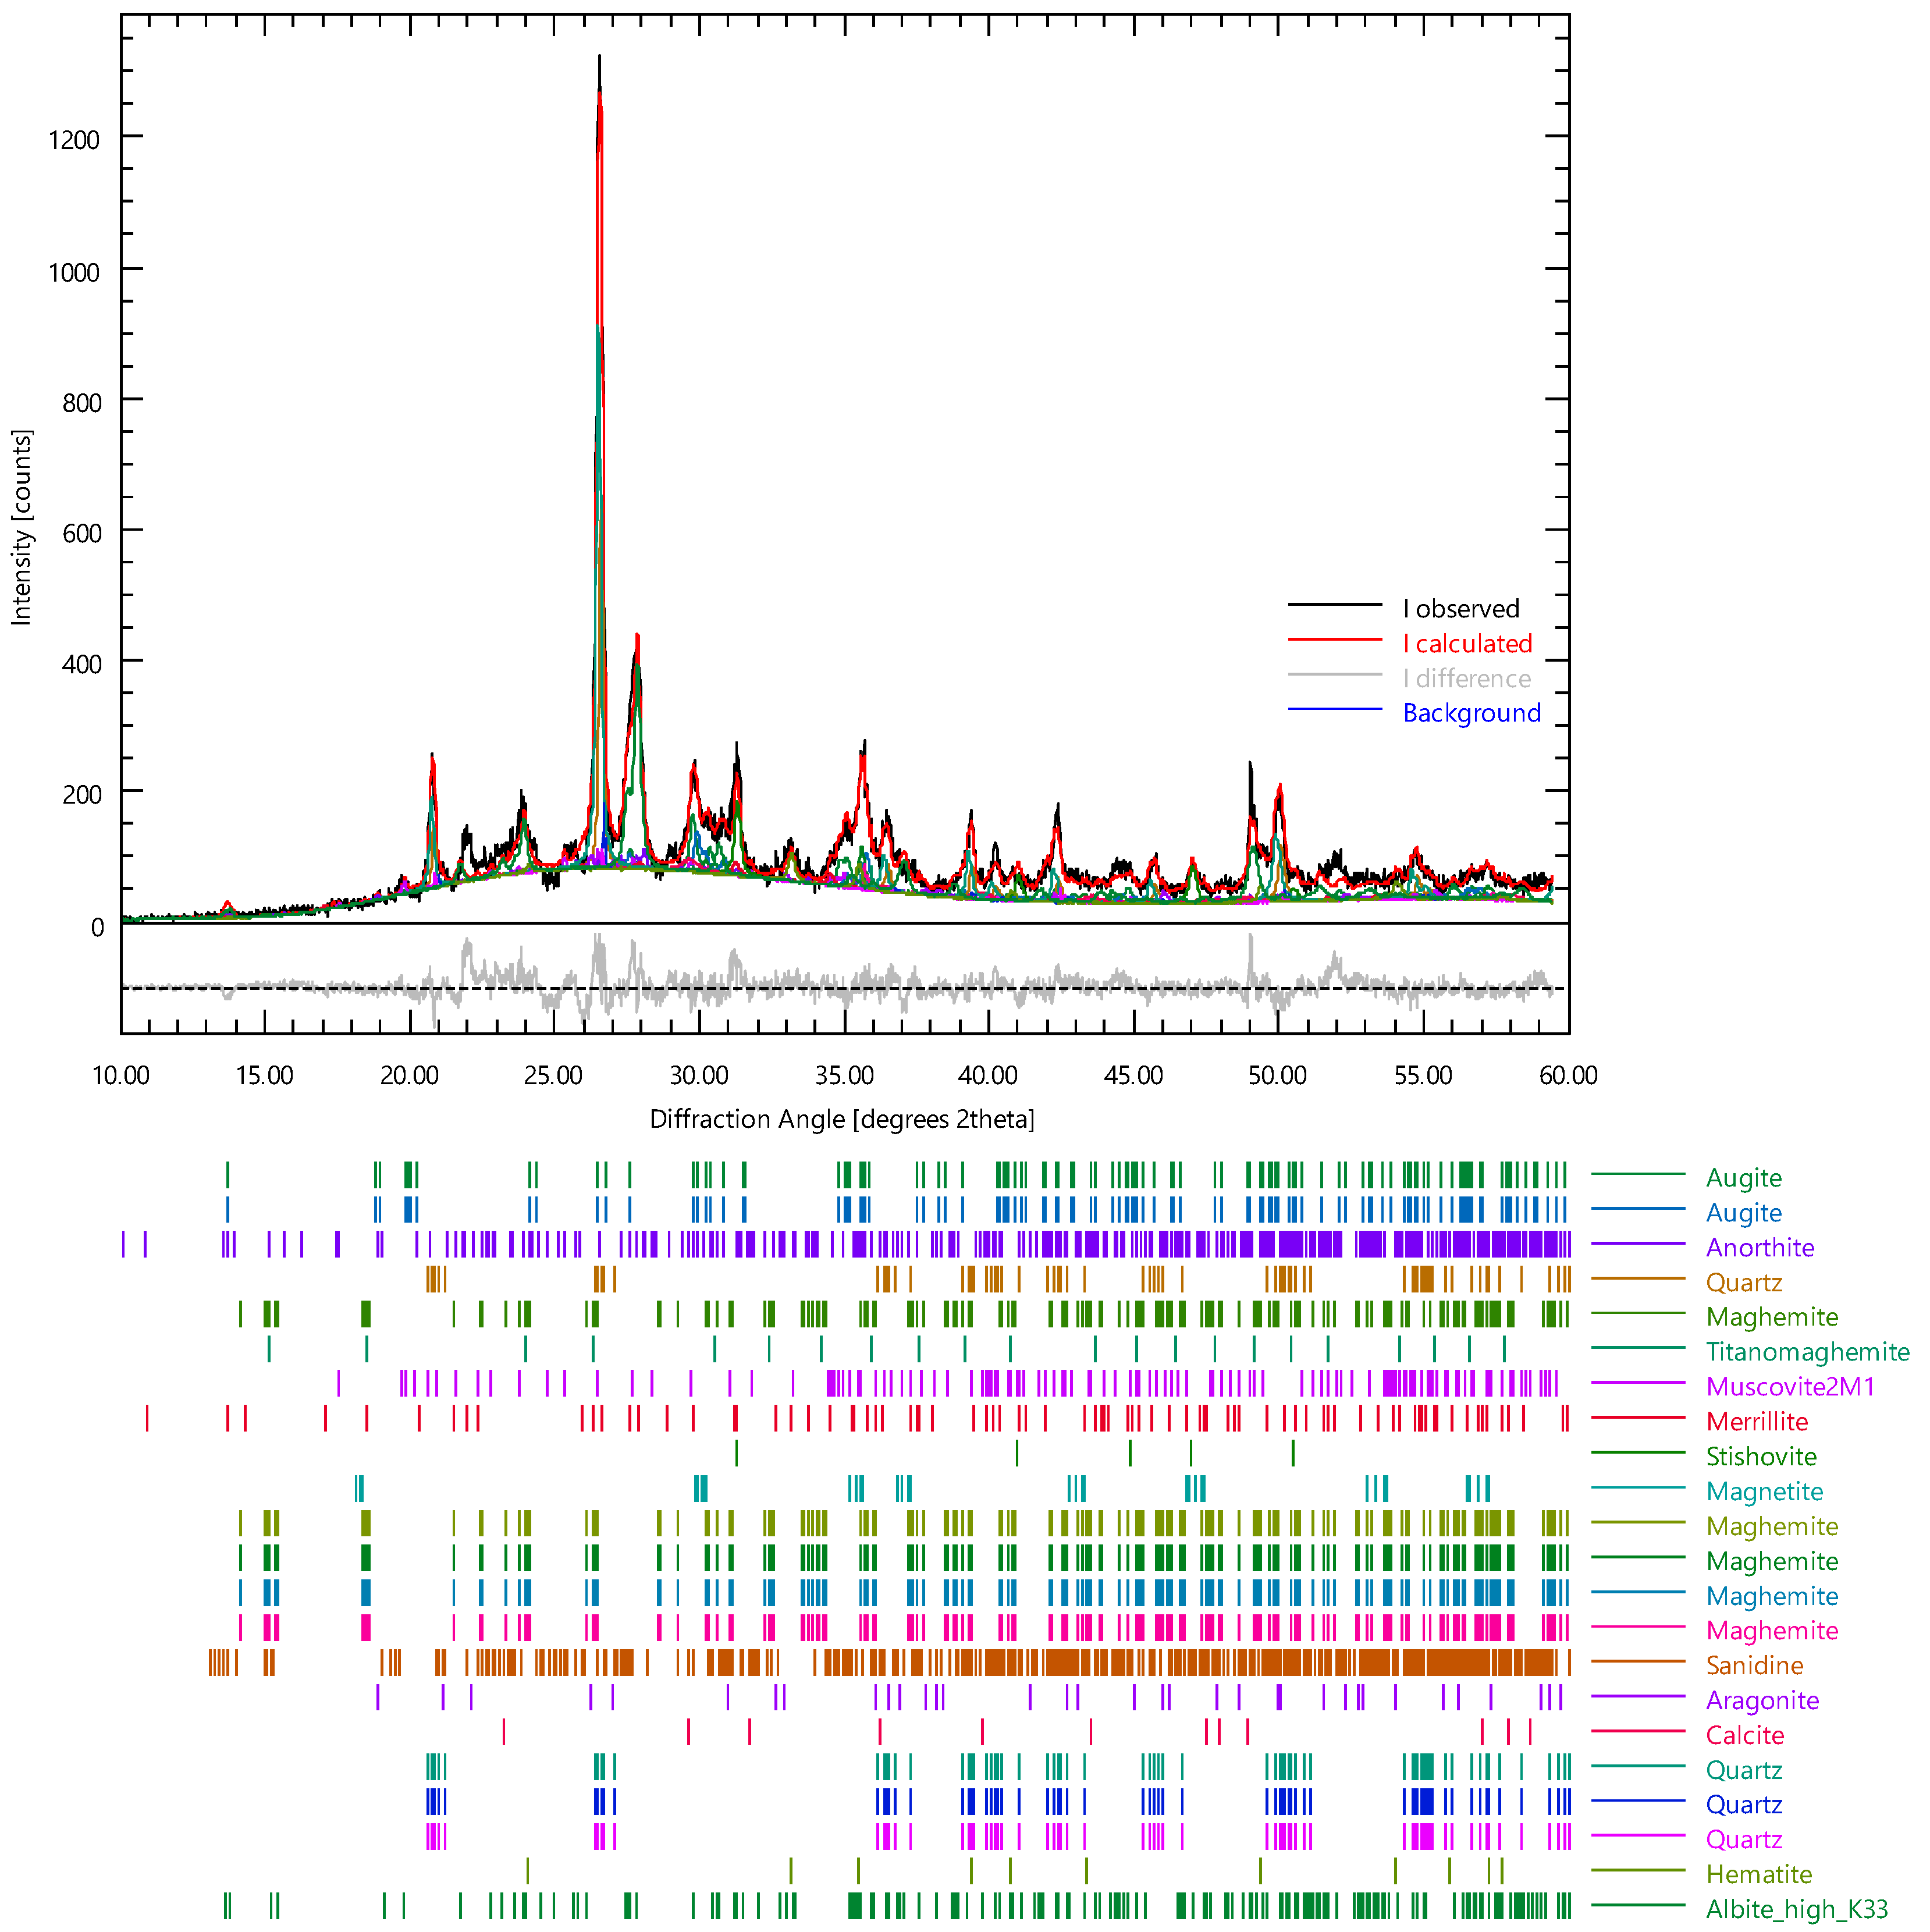
Figure 18.
Water absorption versus time for samples obtained from systems containing (a) B, (b) BVA10 and (c) BVA30. The bars display standard errors (SE).
Figure 18.
Water absorption versus time for samples obtained from systems containing (a) B, (b) BVA10 and (c) BVA30. The bars display standard errors (SE).

Figure 19.
Samples upon exposure to sunlight for 3 min after photoluminescent activation with methods (a,b).
Figure 19.
Samples upon exposure to sunlight for 3 min after photoluminescent activation with methods (a,b).

Table 1.
Composition of the mix.
| Samples | Dried Clay (kg) | Volcanic Ash (kg) | Volcanic Ash (wt%) * | Water (wt%) * |
|---|---|---|---|---|
| B | 5 | 0.0 | 0.0 | 27 |
| BVA10 | 4.5 | 0.5 | 10 | 24 |
| BVA30 | 3.5 | 1.5 | 30 | 19 |
| BVA50 | 2.5 | 2.5 | 50 | - |
* Refers to the total weight of the mixture (dry clay and volcanic ash).
Table 2.
Weight percentages of the mineral phases contained in clay.
| Mineral | wt% | ESD |
|---|---|---|
| Orthoclase | 3.83 | 0.38 |
| Albite | 11.29 | 0.59 |
| Rhomboclase | 4.29 | 0.52 |
| Calcite | 23.97 | 1.29 |
| MgCalcite | 3.18 | 0.59 |
| Dolomite | 4.92 | 0.29 |
| Mullite21 | 3.55 | 0.41 |
| Musc2m1 | 3.21 | 0.61 |
| Muscovite2M1 | 1.64 | 0.39 |
| Muscovitena037 | 5.52 | 0.92 |
| Parago2m | 1.88 | 0.38 |
| Parago1m | 4.42 | 0.59 |
| Chamosite | 5.35 | 0.30 |
| ClinochloreIIb4 | 2.50 | 0.14 |
| Halloysite7A | 5.71 | 0.36 |
| Halloysite10A | 7.24 | 0.48 |
| Quartz | 4.50 | 1.12 |
| Illite | 2.99 | 0.65 |
| Rwp | 12.79 | |
| Rexp | 7.21 | |
| Chi2 | 3.1468 | |
| GOF | 1.7739 |
Table 3.
Composition in terms of oxides of spots as obtained by EDX analysis in Figure 5.
Table 3.
Composition in terms of oxides of spots as obtained by EDX analysis in Figure 5.
| Oxide | Spot A (wt%) | Spot B (wt%) |
|---|---|---|
| Na2O | 7.7 | 6.0 |
| MgO | 4.9 | 5.8 |
| Al2O3 | 16.6 | 14.7 |
| SiO2 | 43.1 | 40.4 |
| K2O | 2.8 | 2.7 |
| CaO | 10.2 | 11.2 |
| Fe O | 12.3 | 16.8 |
| TiO2 | 2.1 | 2.3 |
Table 4.
Mineral composition of VA.
| Phase | wt% | ESD |
|---|---|---|
| Augite | 13.27 | 0.87 |
| Anorthite | 4.99 | 0.79 |
| Maghemite | 0.64 | 0.24 |
| Titanomaghemite | 0.33 | 0.12 |
| Muscovite2M1 | 7.16 | 0.91 |
| Merrillite | 4.91 | 0.90 |
| Stishovite | 13.57 | 0.59 |
| Magnetite | 0.03 | 0.07 |
| Maghemite | 0.64 | 0.24 |
| Sanidine | 0.16 | 0.33 |
| Aragonite | 3.33 | 0.50 |
| Calcite | 6.77 | 1.23 |
| Quartz | 1.00 | 0.41 |
| Hematite | 3.60 | 0.29 |
| Anortk33 (Albite high_k_33) | 39.43 | 1.57 |
| Rwp | 15.67 | |
| Rexp | 10.39 | |
| Chi2 | 2.27 | |
| GOF | 1.51 |
Table 5.
Mineral composition of fired VA.
| Phase | wt% | ESD |
|---|---|---|
| Albite | 1.916885 | 0.33499 |
| Calcite | 1.284127 | 0.204716 |
| Clinochlore1A | 1.600506 | 0.3536 |
| Musc2m1 | 0.986358 | 0.279158 |
| Siderite | 2.140212 | 0.186105 |
| FerrosiliteMg06Fe13Ca | 1.637727 | 0.409432 |
| Hematite | 1.833138 | 0.178661 |
| Magnetite | 9.677479 | 0.725811 |
| Augite | 21.73711 | 1.712169 |
| Maghemite | 1.098022 | 0.428042 |
| Titanomaghemite | 1.507454 | 0.279158 |
| Anorthoclase | 5.601772 | 0.7072 |
| Oligoclase | 8.746953 | 0.949137 |
| Silica | 26.79917 | 4.466529 |
| Cristobalite | 6.885899 | 0.595537 |
| Dolomite | 3.666276 | 0.372211 |
| Enstatite | 2.493812 | 0.558316 |
| Rwp | 14.93 | |
| Rexp | 9.96 | |
| Chi2 | 2.247 | |
| GOF | 1.499 |
Table 6.
Elemental composition of photoluminescent powders as obtained by EDX analysis.
| Element | (wt%) |
|---|---|
| O | 68.5 |
| Mg | 1.1 |
| Al | 7.8 |
| Si | 14.5 |
| Sr | 4.0 |
| Ca | 0.7 |
| Na | 2.5 |
| Fe | 1.0 |
Table 7.
Composition in terms of oxides of spots as obtained by EDX analysis in Figure 14.
Table 7.
Composition in terms of oxides of spots as obtained by EDX analysis in Figure 14.
| Oxide | Spot A (wt%) | Spot B (wt%) | Spot C (wt%) |
|---|---|---|---|
| Na2O | 1.08 | - | 6.8 |
| MgO | 27.85 | - | - |
| Al2O3 | 3.60 | - | 19.8 |
| SiO2 | 0.09 | 1.9 | 64.1 |
| K2O | 51.78 | 98.1 | 9.3 |
| CaO | 1.47 | - | - |
| Fe O | 1.64 | - |
Table 8.
Mineral composition of B bricks.
| Phase | wt% | ESD |
|---|---|---|
| Goethite | 1.08 | 0.23 |
| Augite | 27.85 | 1.89 |
| Hematite | 3.60 | 0.53 |
| Calcite | 0.09 | 0.22 |
| Anorthoclase | 51.78 | 3.11 |
| Stishovite | 1.47 | 0.39 |
| Ferrihydrite | 1.64 | 0.39 |
| Maghemite | 3.00 | 0.50 |
| Quartz | 8.00 | 1.07 |
| Stishovite | 1.47 | 0.39 |
| Rwp | 20.62 | |
| Rexp | 14.58 | |
| Chi2 | 2.0001 | |
| GOF | 1.4143 |
Table 9.
Composition in terms of oxides of spots as obtained by EDX analysis in Figure 16.
Table 9.
Composition in terms of oxides of spots as obtained by EDX analysis in Figure 16.
| Oxide | Spot A (wt%) | Spot B (wt%) | Spot C (wt%) |
|---|---|---|---|
| Na2O | 3.0 | 1.3 | 5.6 |
| MgO | 6.1 | 13.8 | - |
| Al2O3 | 16.5 | 4.8 | 29.8 |
| SiO2 | 48.8 | 47.3 | 49.9 |
| P2O5 | 0.5 | - | 9.3 |
| Cl | 0.2 | - | - |
| K2O | 4.0 | - | 0.5 |
| CaO | 9.1 | 23.6 | 13.2 |
| TiO2 | 2.2 | 1.7 | - |
| FeO | 9.6 | 7.5 | 1.0 |
Table 10.
Mineral composition of BVA30 bricks.
| Phase | wt% | ESD |
|---|---|---|
| Augite | 13.27 | 0.87 |
| Anorthite | 4.99 | 0.79 |
| Maghemite | 0.64 | 0.24 |
| Titanomaghemite | 0.33 | 0.12 |
| Muscovite2M1 | 7.16 | 0.91 |
| Merrillite | 4.91 | 0.90 |
| Stishovite | 13.57 | 0.59 |
| Magnetite | 0.03 | 0.07 |
| Maghemite | 0.64 | 0.24 |
| Sanidine | 0.16 | 0.33 |
| Aragonite | 3.33 | 0.50 |
| Calcite | 6.77 | 1.23 |
| Quartz | 1.00 | 0.41 |
| Hematite | 3.60 | 0.29 |
| anortk33 (Albite high_k_33) | 39.43 | 1.57 |
| Rwp | 15.67 | |
| Rexp | 10.39 | |
| Chi2 | 2.27 | |
| GOF | 1.51 |
Table 11.
Sorptivity and water absorption of samples obtained with different amounts of volcanic ash.
Table 11.
Sorptivity and water absorption of samples obtained with different amounts of volcanic ash.
| Sample | S (kg/m2min0.5) | a0 (kg/m2) | Average 24-h Water Absorption (%) |
|---|---|---|---|
| B | 1.87 | −0.612 | 16.05 |
| BVA10 | 1.28 | −0.95 | 13.52 |
| BVA30 | 1.82 | −0.67535 | 14.86 |
Table 12.
Apparent density and dynamic modulus of elasticity of bricks.
| Sample | Density (g/cm3) | Dynamic Modulus of Elasticity (GPa) |
|---|---|---|
| B | 1.89 | 25.9 |
| BVA10 | 1.85 | 19.6 |
| BVA30 | 1.80 | 15.85 |
Disclaimer/Publisher’s Note: The statements, opinions and data contained in all publications are solely those of the individual author(s) and contributor(s) and not of MDPI and/or the editor(s). MDPI and/or the editor(s) disclaim responsibility for any injury to people or property resulting from any ideas, methods, instructions or products referred to in the content. |
© 2023 by the authors. Licensee MDPI, Basel, Switzerland. This article is an open access article distributed under the terms and conditions of the Creative Commons Attribution (CC BY) license (https://creativecommons.org/licenses/by/4.0/).
Share and Cite
MDPI and ACS Style
Candamano, S.; De Luca, P.; Garofalo, P.; Crea, F. Ceramic Materials Containing Volcanic Ash and Characterized by Photoluminescent Activity. Environments 2023, 10, 172. https://doi.org/10.3390/environments10100172
AMA Style
Candamano S, De Luca P, Garofalo P, Crea F. Ceramic Materials Containing Volcanic Ash and Characterized by Photoluminescent Activity. Environments. 2023; 10(10):172. https://doi.org/10.3390/environments10100172
Chicago/Turabian StyleCandamano, Sebastiano, Pierantonio De Luca, Pietro Garofalo, and Fortunato Crea. 2023. "Ceramic Materials Containing Volcanic Ash and Characterized by Photoluminescent Activity" Environments 10, no. 10: 172. https://doi.org/10.3390/environments10100172
Note that from the first issue of 2016, this journal uses article numbers instead of page numbers. See further details here.