Reductions of PAH and Soot by Center Air Injection

Department of Mechanical Science and Engineering, Faculty of Engineering, Nagoya University, Furo-cho, Chikusa-ku, Nagoya-shi, Aichi 464-8603, Japan
*
Author to whom correspondence should be addressed.
Environments 2014, 1(1), 42-53; https://doi.org/10.3390/environments1010042
Submission received: 16 May 2014
/
Revised: 1 July 2014
/
Accepted: 8 July 2014
/
Published: 15 July 2014
Abstract
:In this study, to reduce the amount of pollutant PAH and soot in the flame, we examined the burner system equipped with a center air injection. For this purpose, by using PAH-LIF and soot LII, we evaluated relative PAH and soot amounts in both the triple port burner and the conventional co-axial burner (double port burner) to discuss effects of center air injection on the formation of PAH and soot. The fuel was propane. In the triple port burner, two different blue flames are observed near the burner rim, followed by bright luminous flames with soot. The flame length is longer when the fuel flow velocity is increased. On the other hand, the flame length is shorter with an increase in internal air flow velocity. As for PAH and soot, these amounts of the triple port burner are much smaller than those of the double port burner. For the triple port burner, due to the center air injection, the fuel consumption occurs in both inner and outer flames. On the other hand, for the double port burner, the oxygen is supplied from one side air, and as a result, the fuel consumption rate is relatively lower. Hence, by the center air injection, the fuel consumption is largely accelerated, resulting in the reduction of PAH and soot.
1. Introduction
In recent years, the worsening of environmental problems such as global warming and atmospheric pollution has been reported. One of the substances that cause atmospheric pollution is particulate matter including soot widely emitted from diesel vehicles, combustion furnaces, and other applications [1]. Especially, nanoparticles are thought to cause asthma and lung cancer, which makes it further desirable to reduce emission amounts. The precursor substances known as polycyclic aromatic hydrocarbons (PAHs) are profoundly related to soot formation [2]. Recently, a fully coupled simulation of PAH and soot growth has been conducted [3]. Similar to soot, PAH contains many carcinogens, making it necessary to reduce the emission of PAH as well. To control their emissions, it is necessary to measure PAH and soot, coupled with the study of the formation of these substances [4].
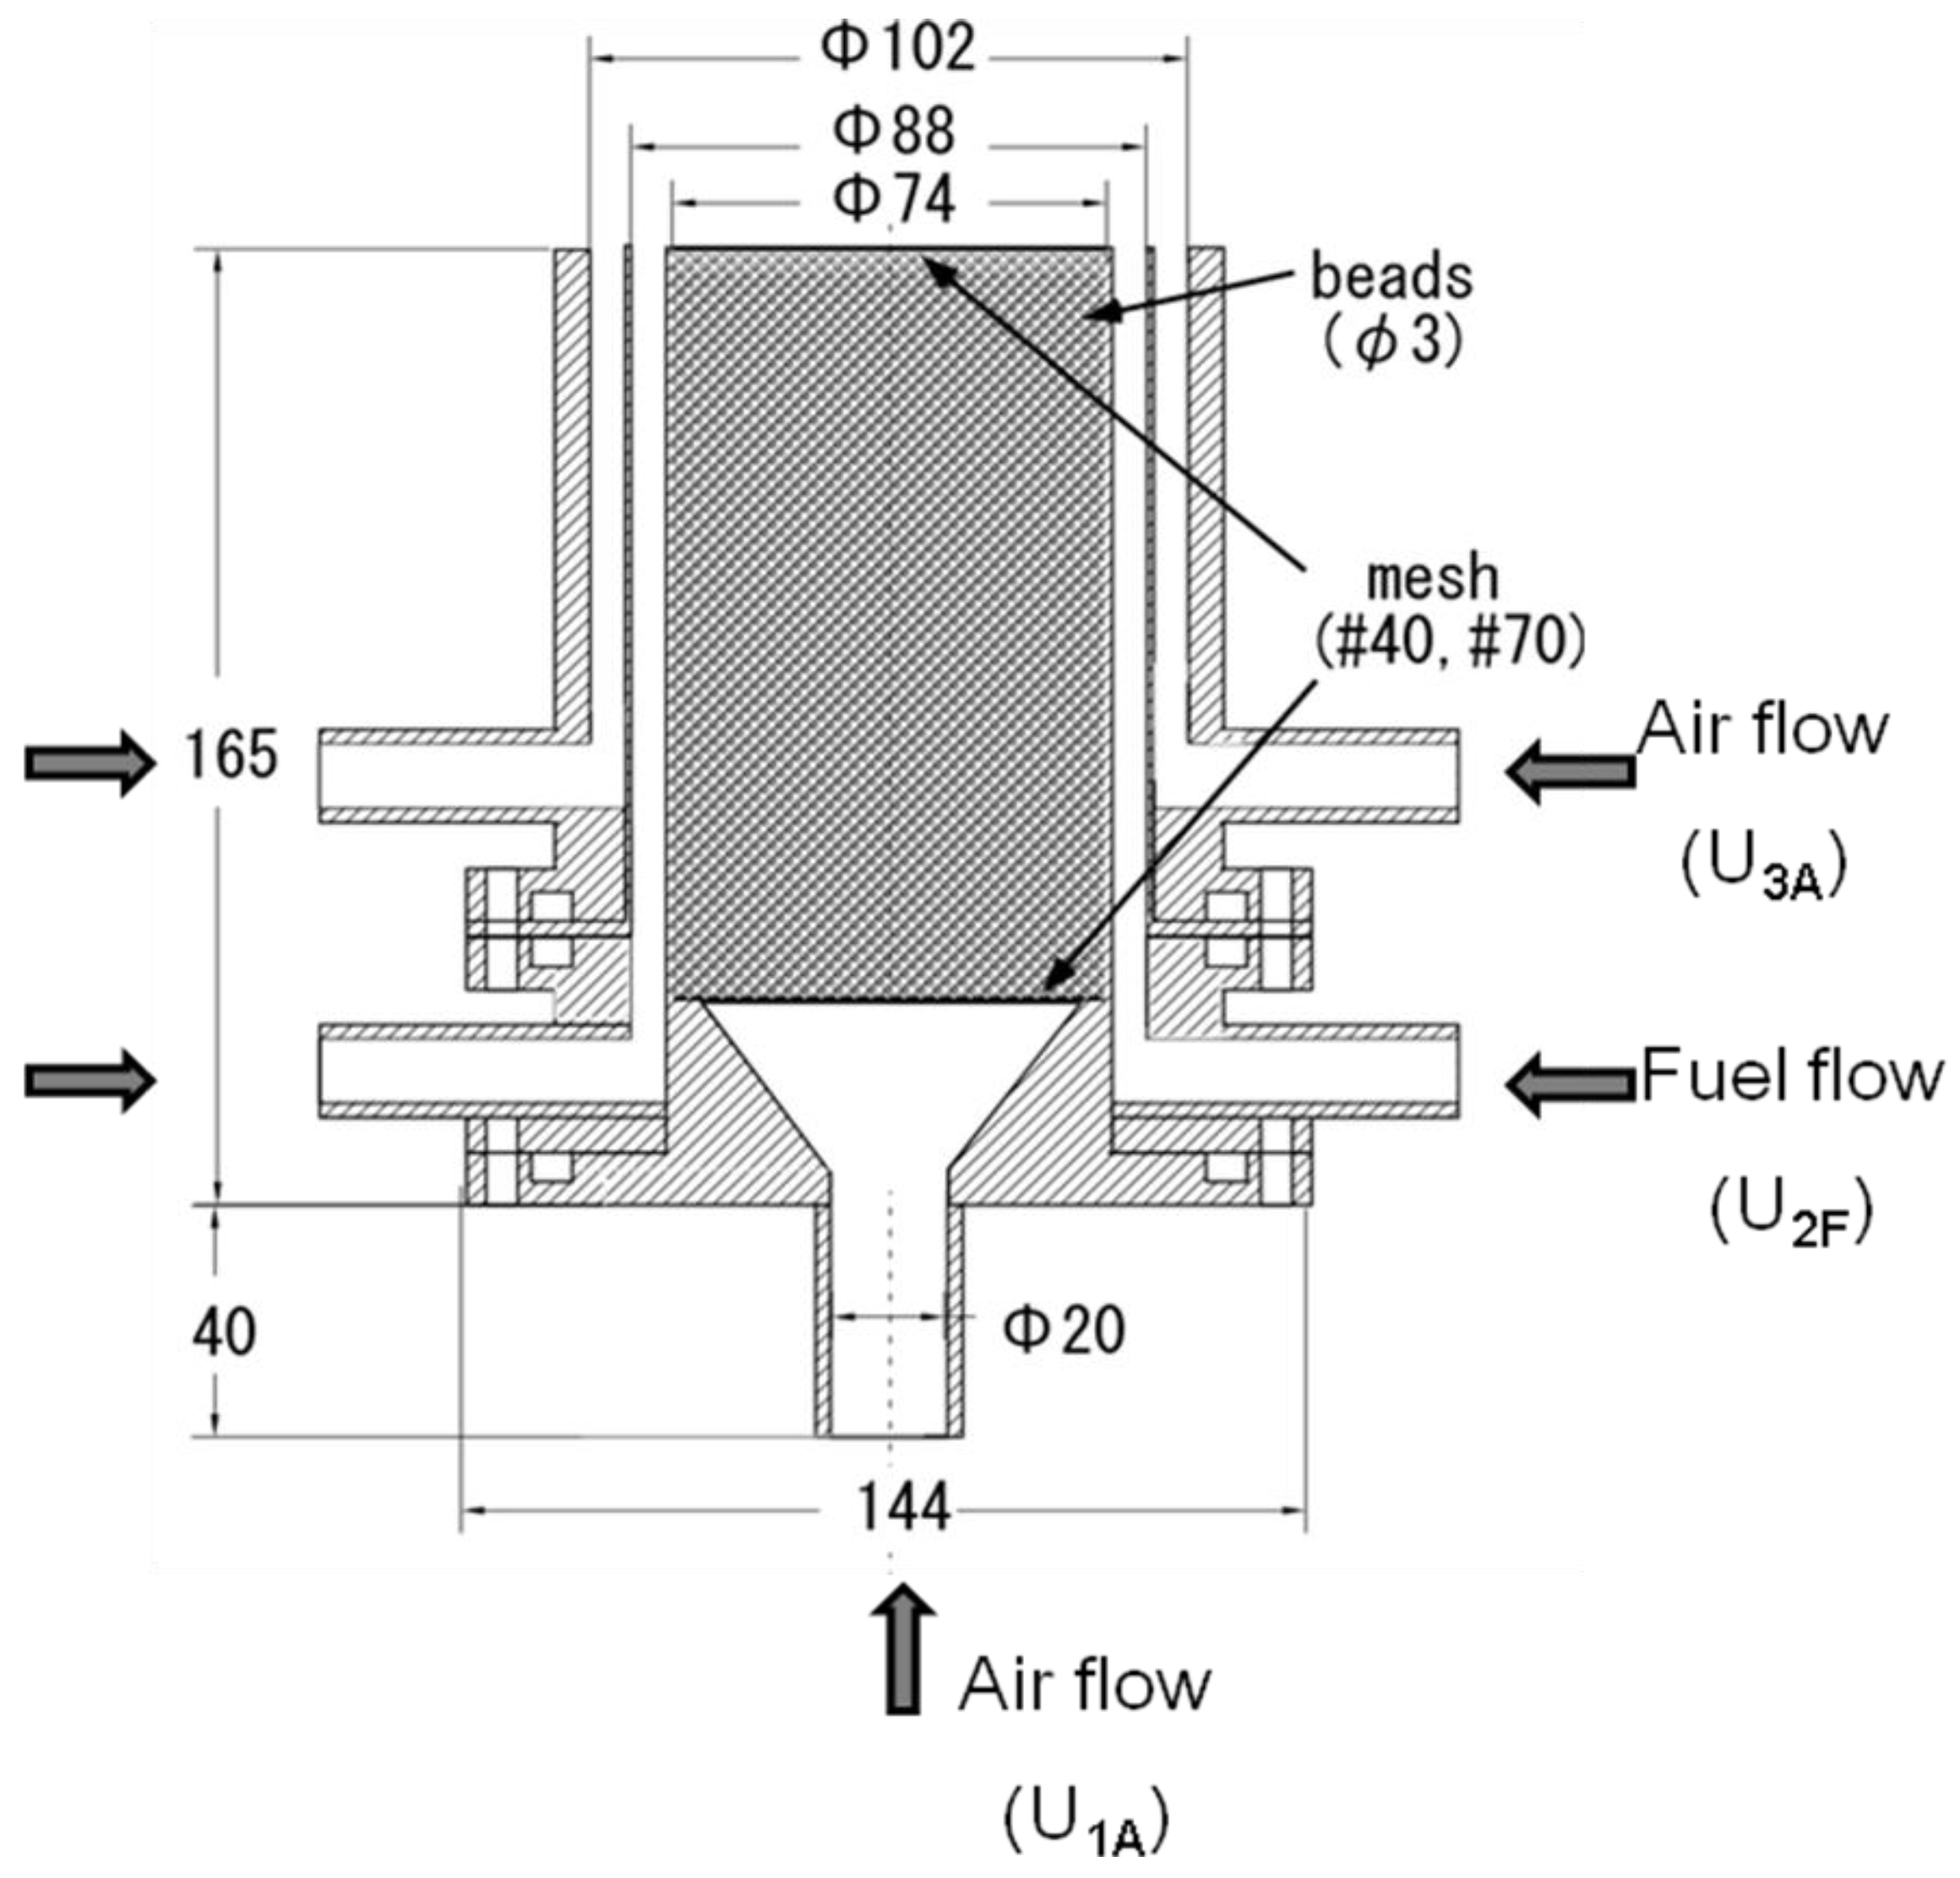
Here, we have focused on a triple port burner [5]. It is a small laboratory burner, and its burner configuration is quite similar to a coannular burner for inverse diffusion flames [6,7]. It has three concentric tubes, where air flows in both inner (center) and outer tubes and fuel flows in the annulus between air tubes (see Figure 1). Physically, the center air jet is introduced, and the fuel flow is surrounded by two air flows.
Figure 1.
A schematic of triple port burner is shown. The burner has three concentric tubes, where air flows in both inner (center) and outer tubes and fuel flows in the annulus between air tubes.
Figure 1.
A schematic of triple port burner is shown. The burner has three concentric tubes, where air flows in both inner (center) and outer tubes and fuel flows in the annulus between air tubes.
So far, we have examined the flame structure and emission characteristics of soot and NOx in the triple port burner [5]. Compared with a so-called co-axial burner, the contact area between fuel and air is larger due to the center air injection, which enables the promotion of both substances’ admixture and reaction [8,9]. In the triple port burner, there are two flames, inner and outer flames, which could reduce PAH and soot formations largely.
In this study, both PAH and soot are measured in the triple port burner. In order to visualize the PAH and soot regions with high resolution of time and space, a laser-induced fluorescence (LIF) technique was used to measure PAH, while a laser-induced incandescence (LII) technique was used to measure soot [4,6,9,10,11,12]. We vary the flow rate of supplied fuel and air, thus investigating PAH and soot at different flow conditions. For comparative purposes, we use a conventional co-axial burner (in this paper, simply referred to the “double port burner”).
2. Experimental Section
2.1. Triple Port Burner
In Figure 1, a schematic of the triple port burner is shown. The internal air flow nozzle has an inner diameter of 74 mm (rim thickness of 1 mm), the fuel flow nozzle has an inner diameter of 88 mm, the external air flow nozzle has an inner diameter of 102 mm, and wire mesh filters, along with glass beads having diameters of 3 mm, are used to regulate the flow. Propane was used as fuel. The flow velocity of the center air jet (internal air flow velocity, U1A) and the fuel flow velocity of U2F were varied. However, the external air flow velocity (U3A) was fixed at 18.4 cm/s. Here, we focused on attached flames. When the air flow velocity is largely increased, the flame is lifted at certain conditions [5]. Once the lifted flame appears, the soot formation is drastically changed due to the premixing effect, which is not treated in this paper. As for the coordinate system, r and z represent the radial and axial distances from the center of the burner exit.
For comparison, we examined the combustion characteristics of the double port burner. The fuel nozzle has an inner diameter of 44 mm (rim thickness of 1 mm), while the air flow nozzle has an inner diameter of 70 mm. In this case, the fuel nozzle has almost the same cross-sectional area as that of the triple port burner. As the fuel volumetric flow rate being identical for both burners, it is possible to compare results at the same fuel flow rate and the flow velocity. For the double port burner, the fuel flow velocity (UF) was varied, whereas the air flow velocity (UA) was constant at 18.4 cm/s, which was the same value of the external air flow velocity in the triple port burner. If the internal air flow velocity (U3A) is set to be zero, the flow condition of the triple port burner roughly corresponds to that of the double port burner. Thus, by comparing results of both burners, it is possible to reveal effects of the center air injection on the combustion field.
2.2. Measurement System
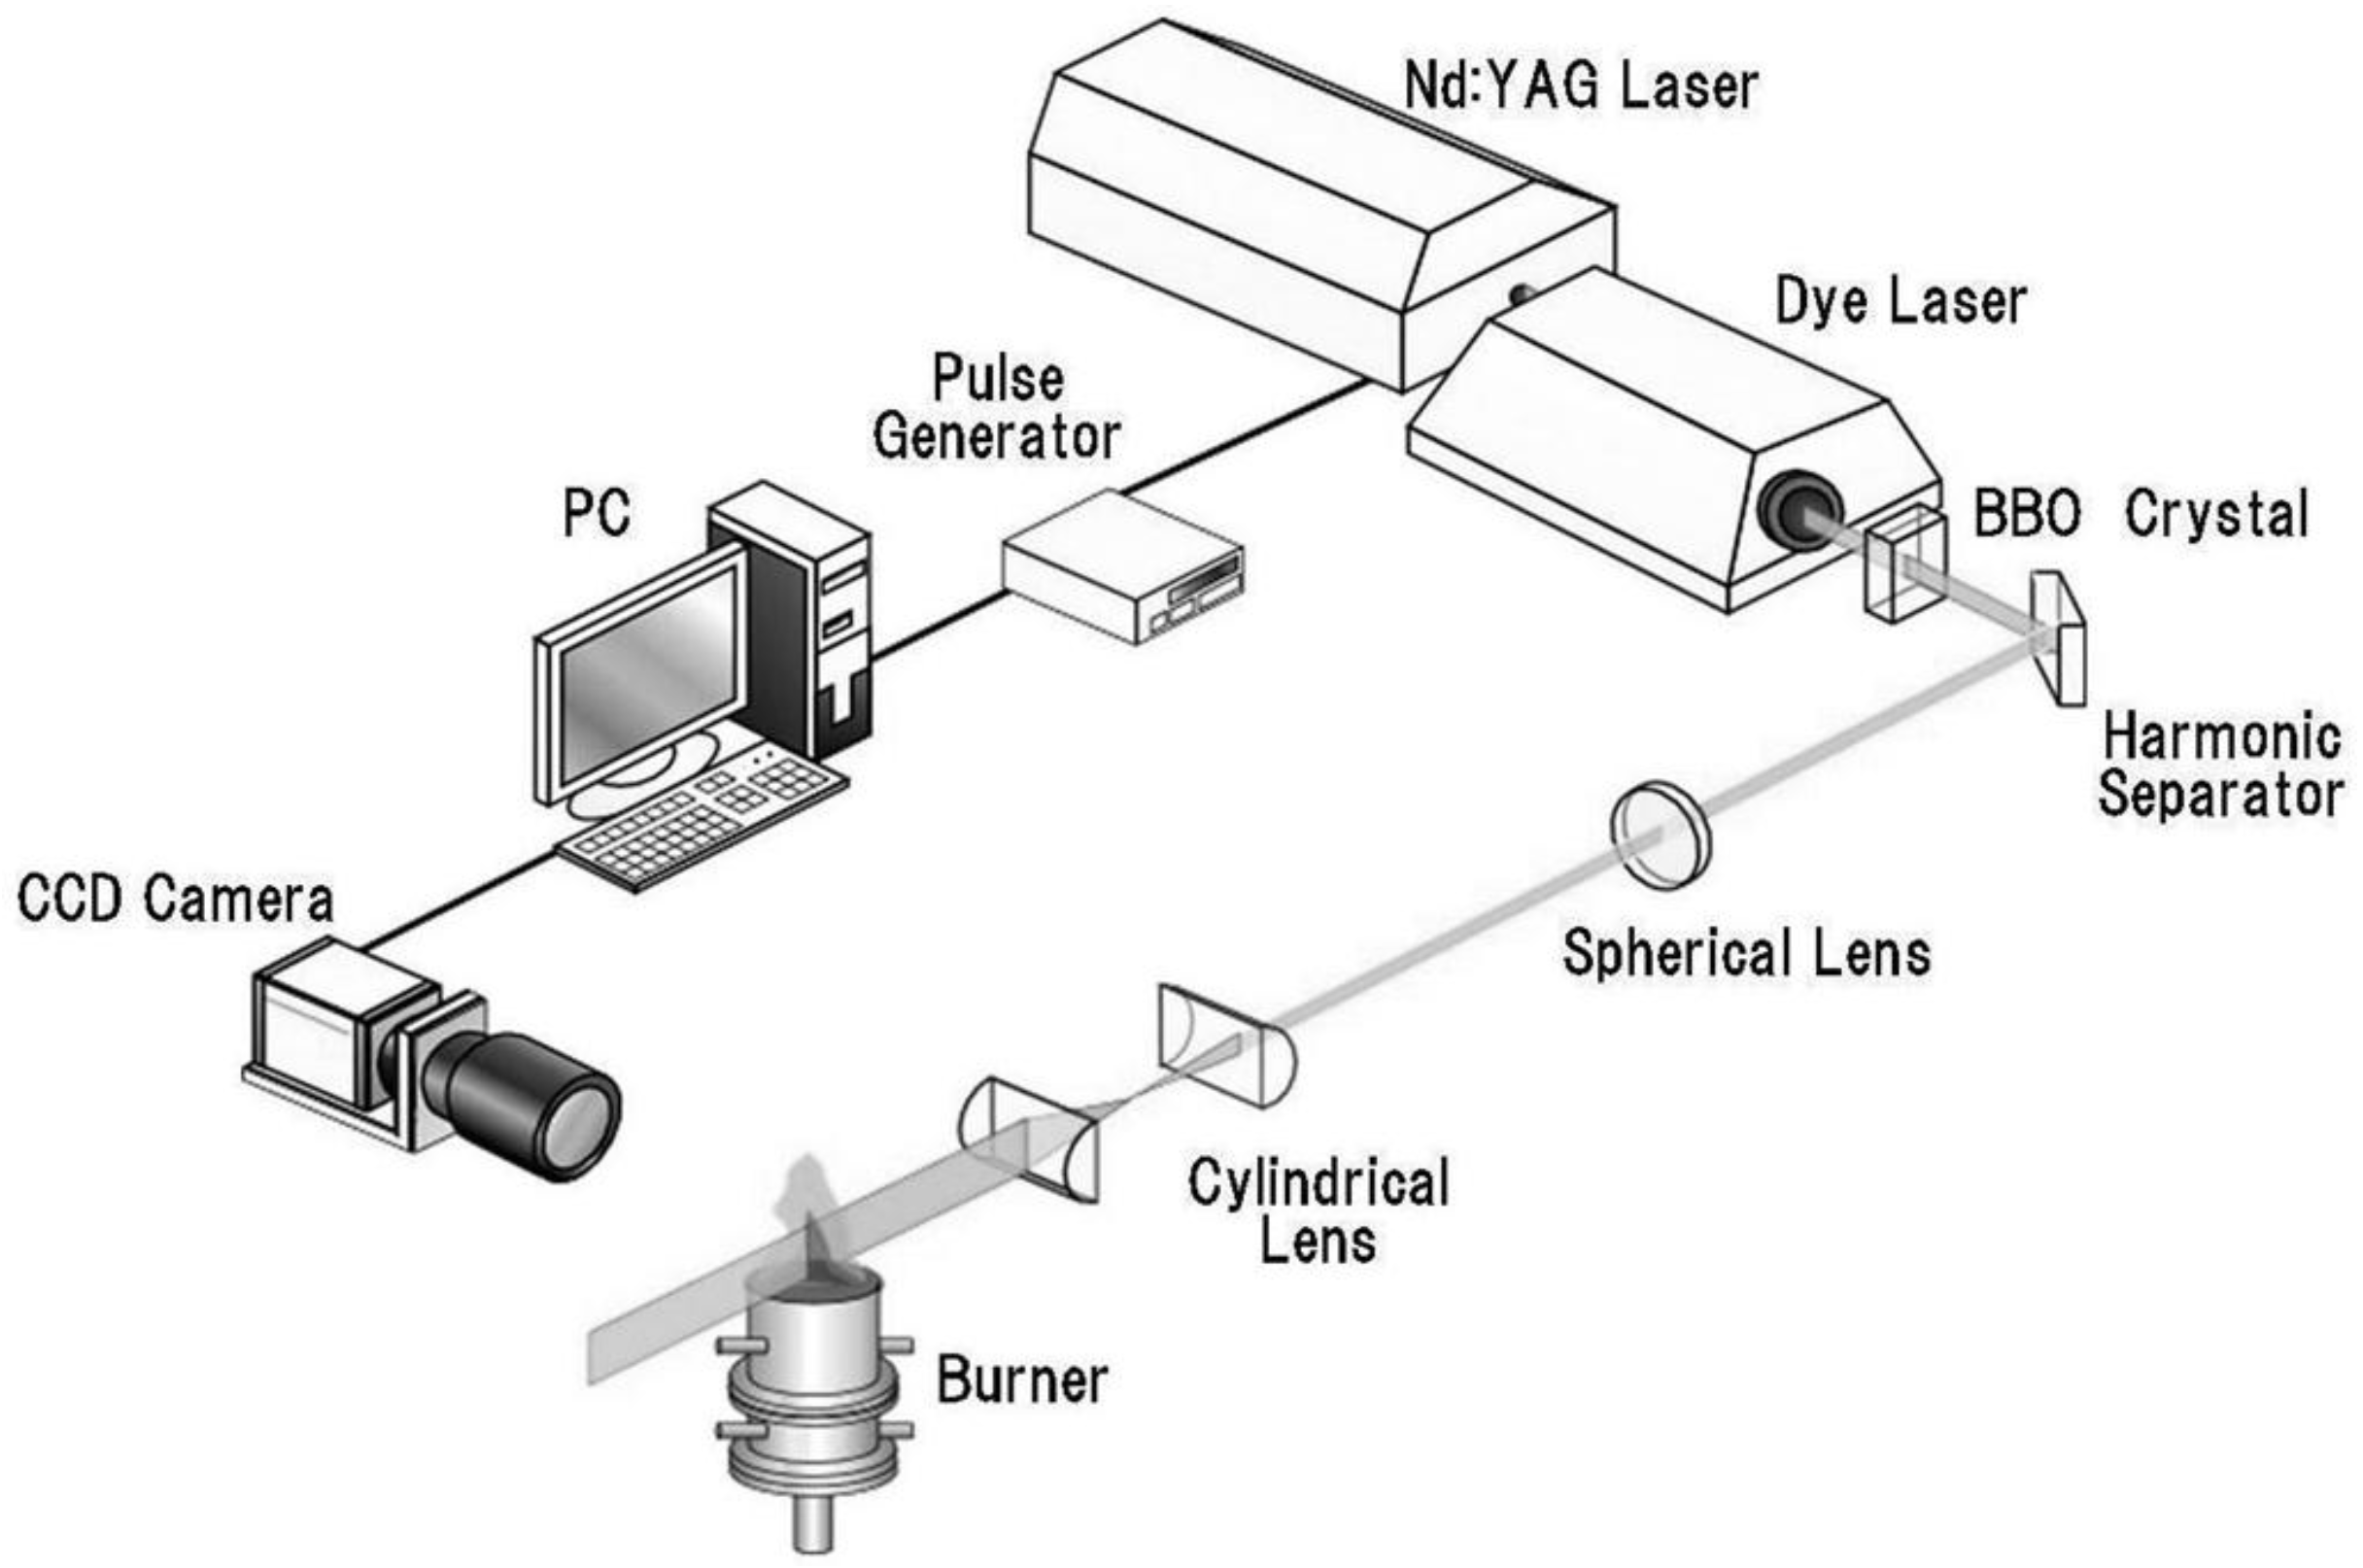
To detect PAH region, we used a laser-induced fluorescence (LIF) method. An experimental setup is shown in Figure 2, which is similar to our previous OH-PLIF measurements [13,14]. A pulsed laser was used to form a thin laser sheet for 2D imaging. A Nd:YAG-pumped dye laser was frequency doubled to 283 nm to excite PAH [6,10]. The laser energy was about 10 mJ/pulse. The fluorescence signal from PAH is generally detectable for only tens of nanoseconds after laser excitation whereas LII signal from soot is detectable for hundreds of nanoseconds. The different temporal decay of the light emission process, coupled with interference filters, allows us to distinguish between PAH-LIF and soot LII signals [4,11], although these measurements were not simultaneous. The fluorescence from PAH was measured with a gated image-intensified CCD camera (Hamamatsu Photonics C8484), with a resolution of 1024 × 1024 pixels. In this measurement, the laser sheet thickness was about 400 µm, and the spatial resolution of the CCD camera was 23 µm. The camera lens was equipped with a narrow band-pass filter (FWHM = 10 nm) with the central wavelength at 450 nm [10]. The camera gate width was set to be 50 ns. The data deviation in PAH-LIF measurement as well as soot LII was within 10%.
For the light source of LII, the second harmonic (wavelength of λ = 532 nm) of a Nd:YAG laser (PRO-R10, manufactured by Spectra Physics) was used [10,11,12]. A laser sheet was passed through the flame to heat soot particles up to incandescence temperature [15]. A band-pass filter (FWHM = 10 nm) with the central wavelength at 400 nm was installed in front of ICCD camera [4,10]. An appropriate delay time in the LII measurement was chosen to allow PAH signal to sufficiency decay. The image intensifier gate width was 50 ns in order to eliminate light emitted from the flame and background. Although the LII signal is proportional to soot volume fraction [6,12,15,16], we discussed the PAH and soot amounts based on raw signals.
Figure 2.
A setup for PAH-LIF system is shown. A Nd:YAG-pumped dye laser was used to form a thin laser sheet for 2D imaging.
Figure 2.
A setup for PAH-LIF system is shown. A Nd:YAG-pumped dye laser was used to form a thin laser sheet for 2D imaging.

3. Results
3.1. Appearance of Flame
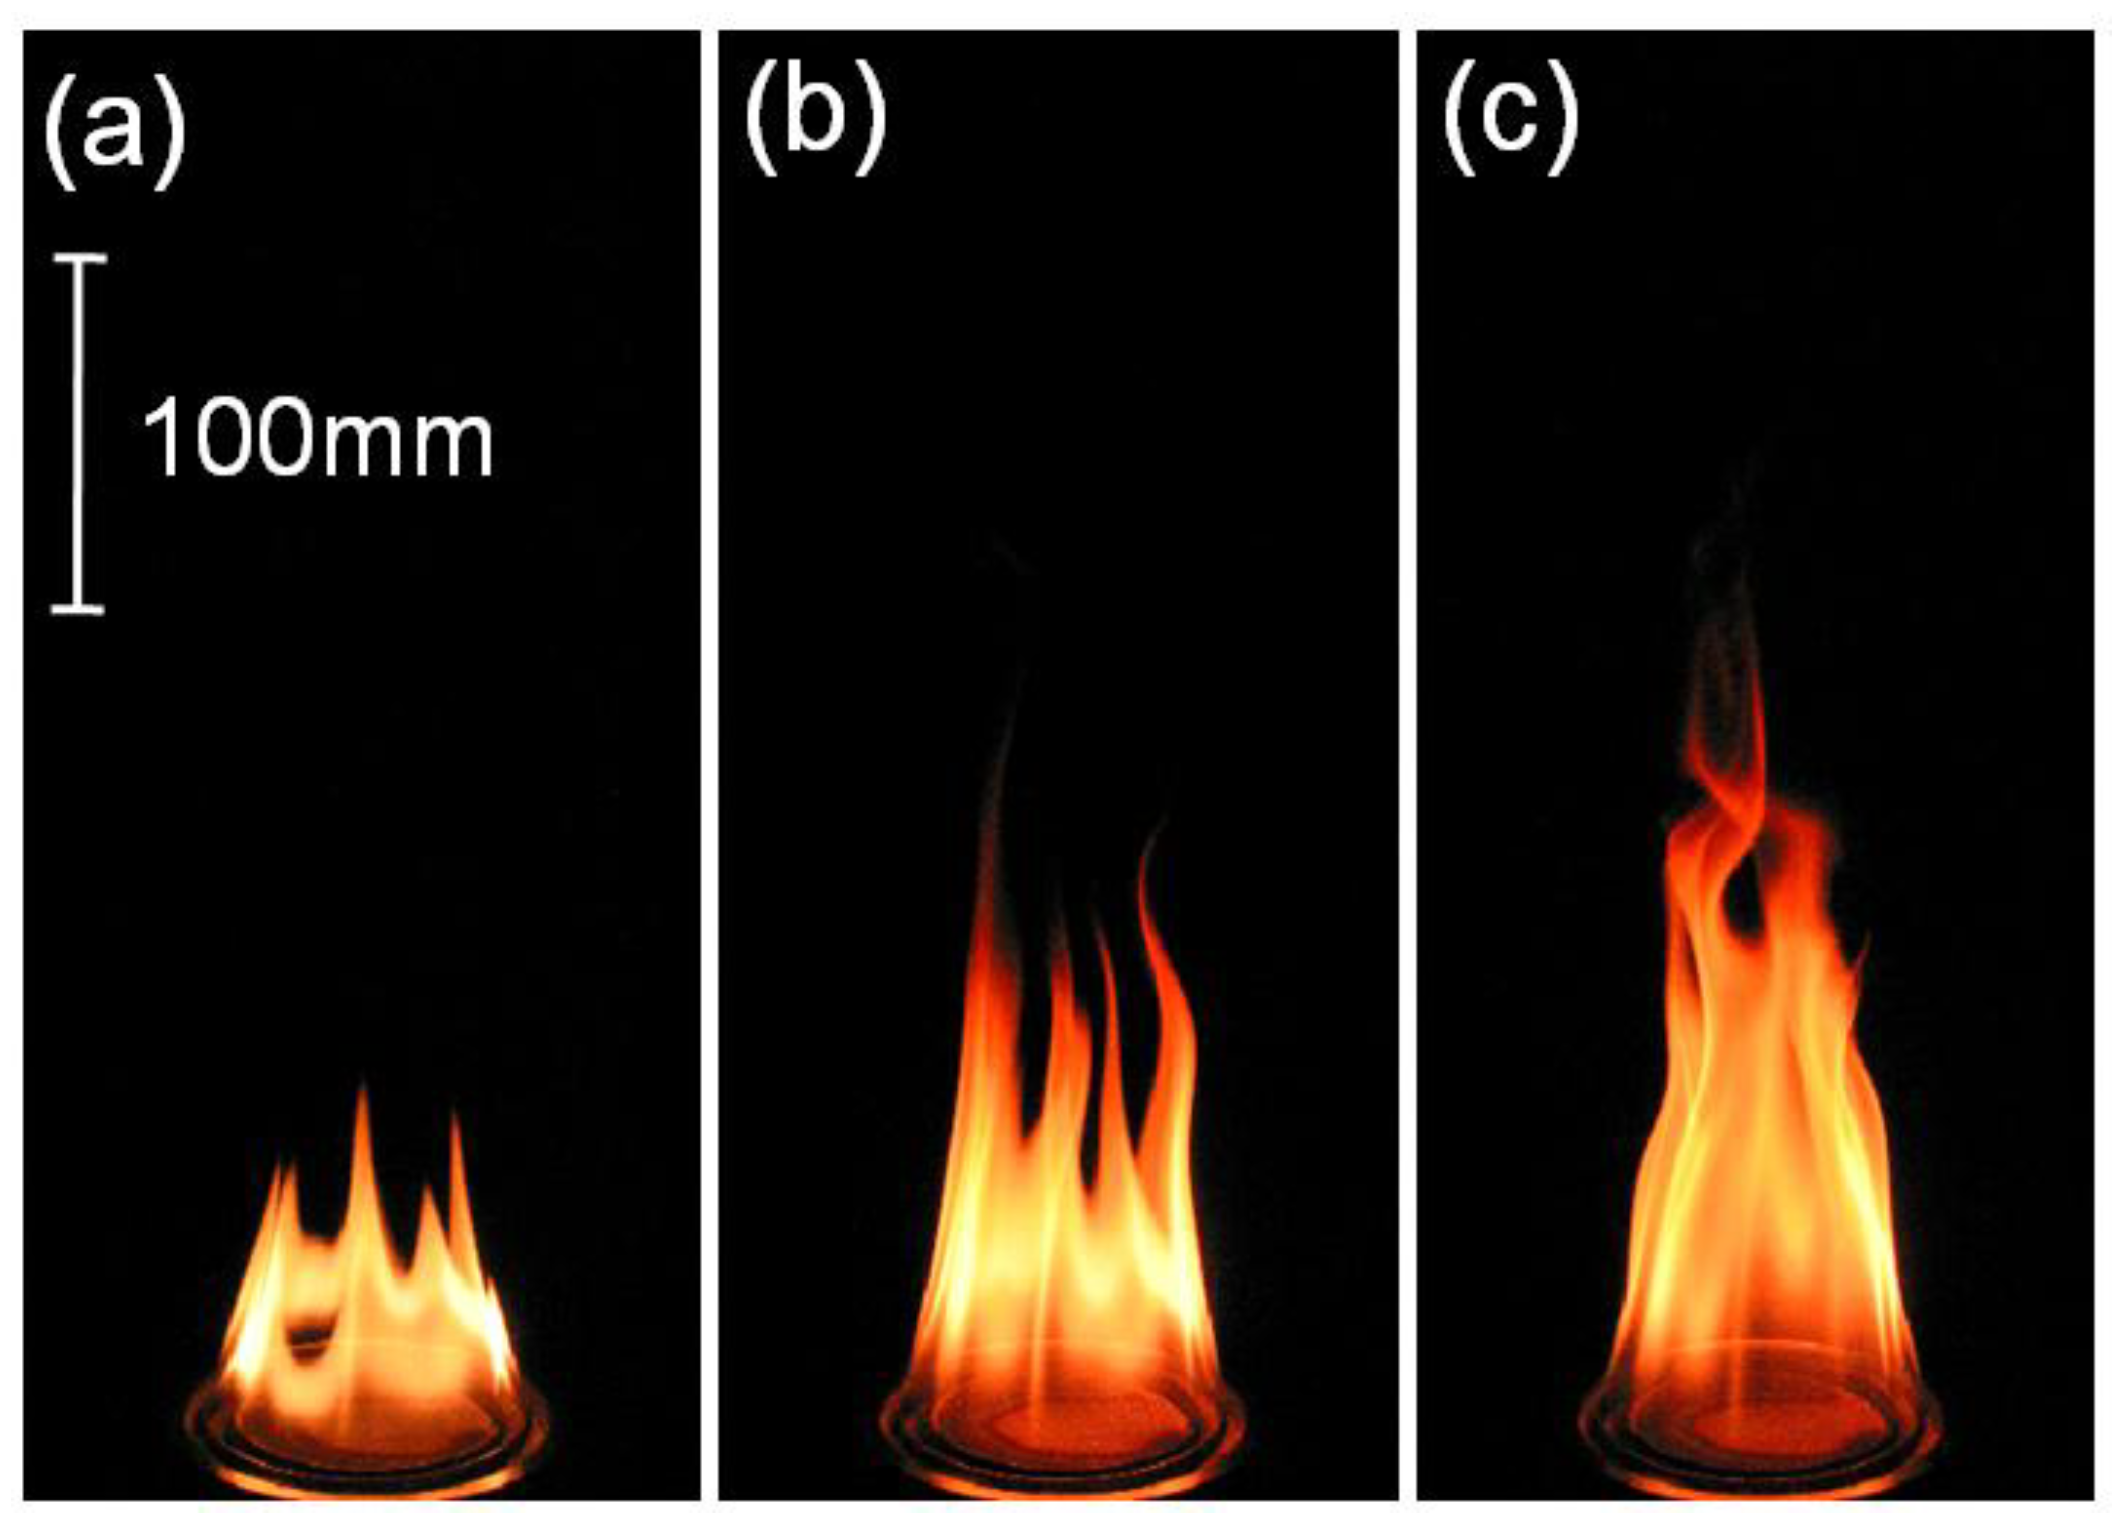
Figure 3 shows direct photographs of flames formed in the triple port burner. In this case, the internal and external air flow velocities were fixed at U1A = 19.4 cm/s and U3A = 18.4 cm/s, while the fuel flow velocity was varied for U2F = 1.2, 2.0, and 2.8 cm/s. Exposure time was 1/500 s and the diaphragm was F2.8. For all cases, the flickering flames are formed due to buoyancy effects [6], and very bright luminous flames are observed. The flame length is expectedly longer when the fuel flow velocity is increased. Two blue flames are recognized near the burner rims between fuel and air nozzles, which are not clear in these photographs. Later, the slice image across the luminous flame zone obtained by PAH-LIF and soot LII will be shown.
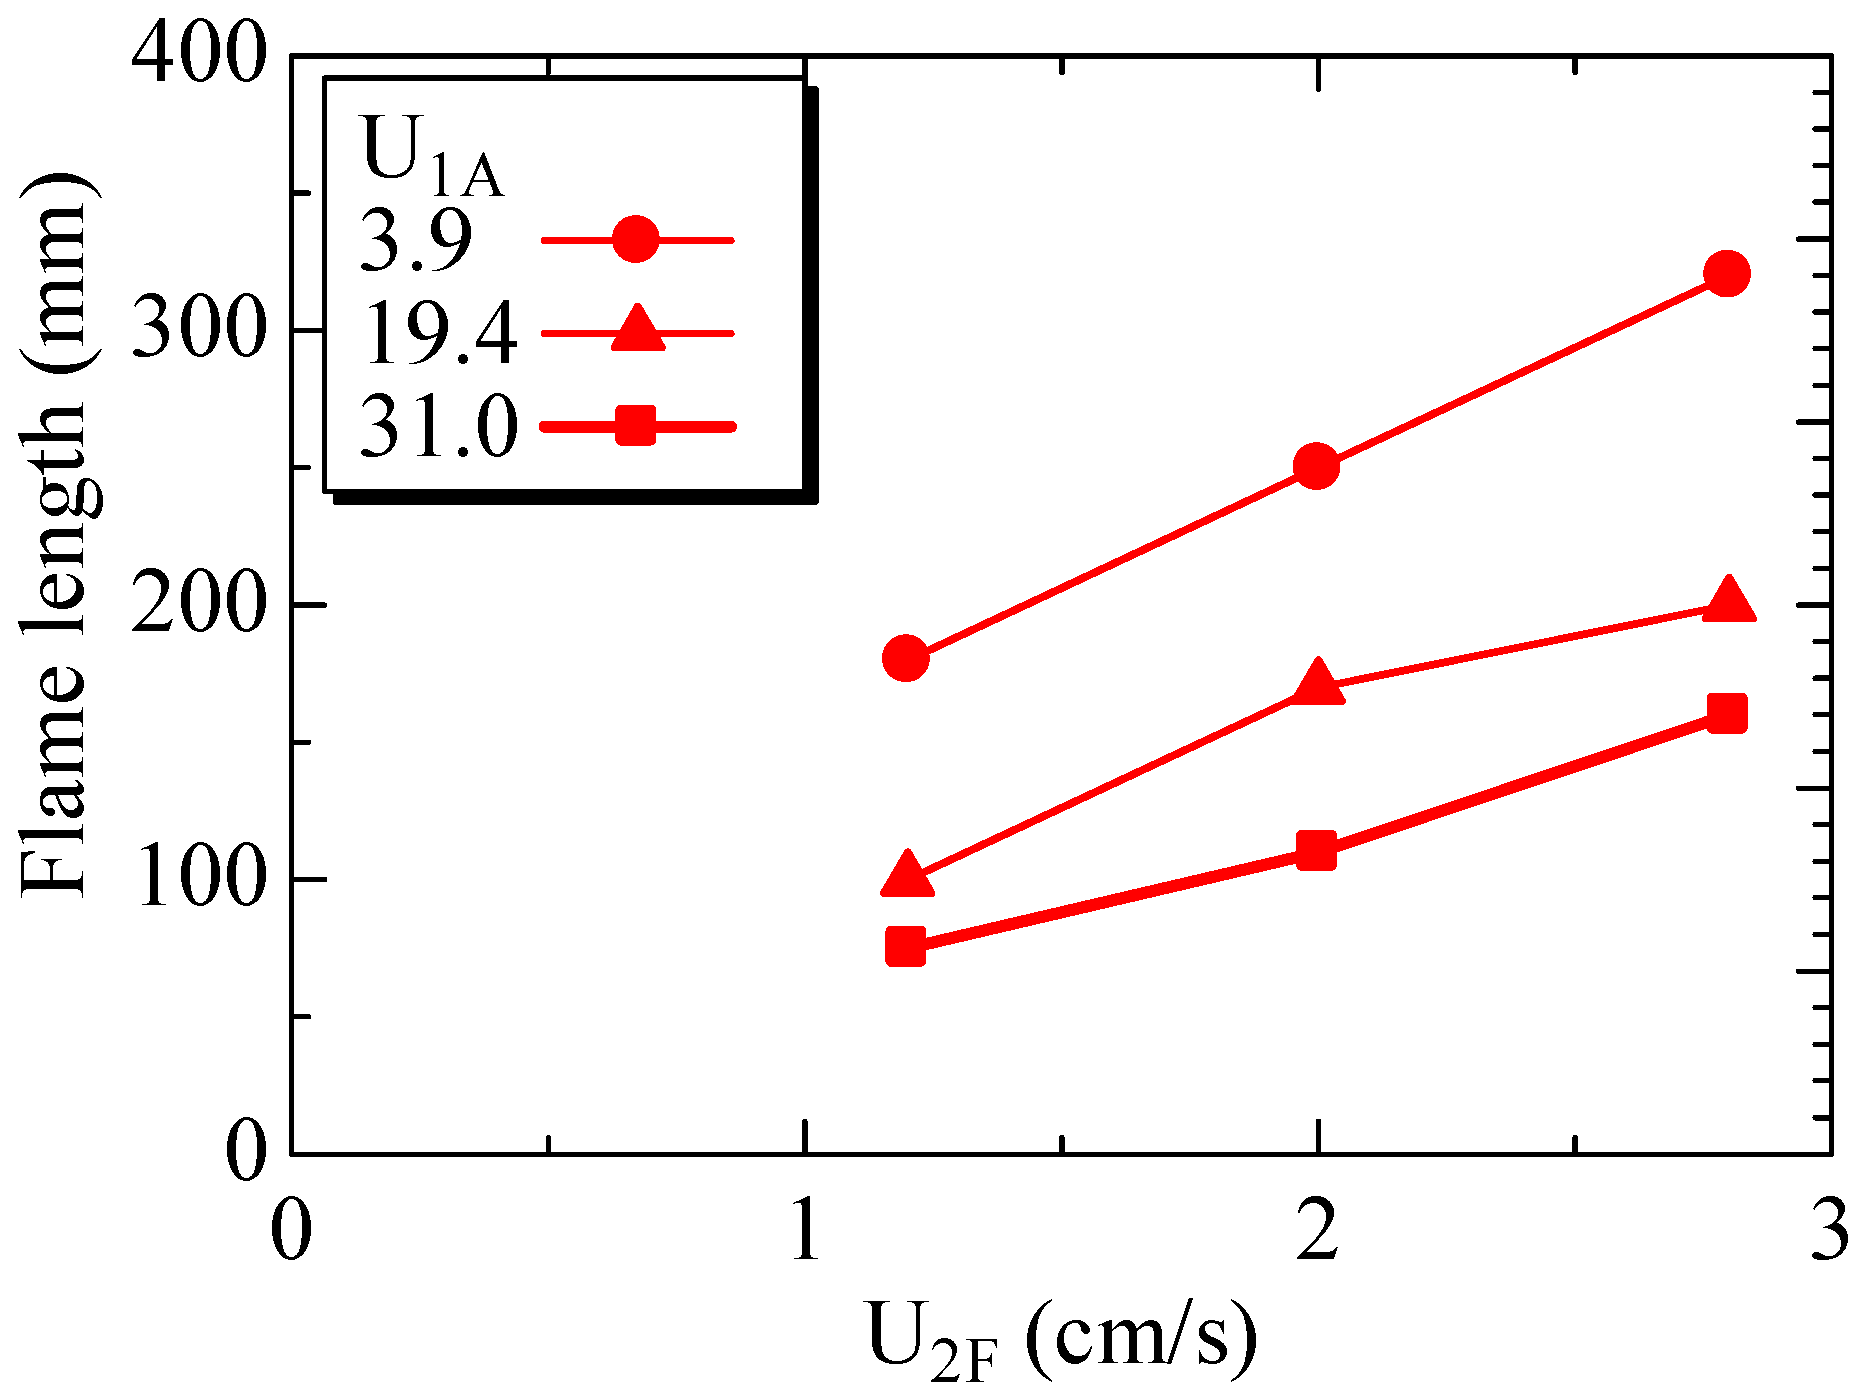
Here, the flame length was examined. It corresponds to the luminous flame height, defined as the distance on the center-axis from the burner exit to the point where the flame luminosity is no longer visible to the eye [17]. The averaged values using 5 direct photographs are shown in Figure 4. The internal air flow and fuel flow velocities are changed, while the external air flow velocity was fixed at U3A = 18.4 cm/s. As seen in Figure 3, as the fuel flow velocity is increased, the flame is longer. On the other hand, as the internal air flow velocity is increased, the flame length is shortened. This tendency well corresponds to our previous numerical simulation [8].
Figure 3.
Photographs of flames in the triple port burner for U1A = 19.4 cm/s and U3A = 18.4 cm/s; (a) U2F = 1.2 cm/s; (b) U2F = 2.0 cm/s; and (c) U2F = 2.8 cm/s.
Figure 3.
Photographs of flames in the triple port burner for U1A = 19.4 cm/s and U3A = 18.4 cm/s; (a) U2F = 1.2 cm/s; (b) U2F = 2.0 cm/s; and (c) U2F = 2.8 cm/s.

Figure 4.
Flame length in triple port burner obtained by experiment.
3.2. PAH and Soot Profiles
Figure 5a shows a PAH-LIF image using the triple port burner, which is a single-shot fluorescence image. The flow velocities were U1A = 19.4 cm/s, U2F = 2.8 cm/s, and U3A = 18.4 cm/s. For comparison, the LII image at the same condition is shown in Figure 5b. These image areas are in the range of 28 mm ≤ r ≤ 52 mm and 8 mm ≤ z ≤ 32 mm, where the fuel port is located at 38 mm ≤ r ≤ 44 mm at z = 0 mm. It is seen that the PAH region is of approximately 3 mm thickness. There are two separate PAH regions in the upper stream, but they are merged downstream. Outside the PAH region, two separate soot regions are observed. By comparing PAH and soot images, it is further found that PAH only exists along the fuel side of the soot region.
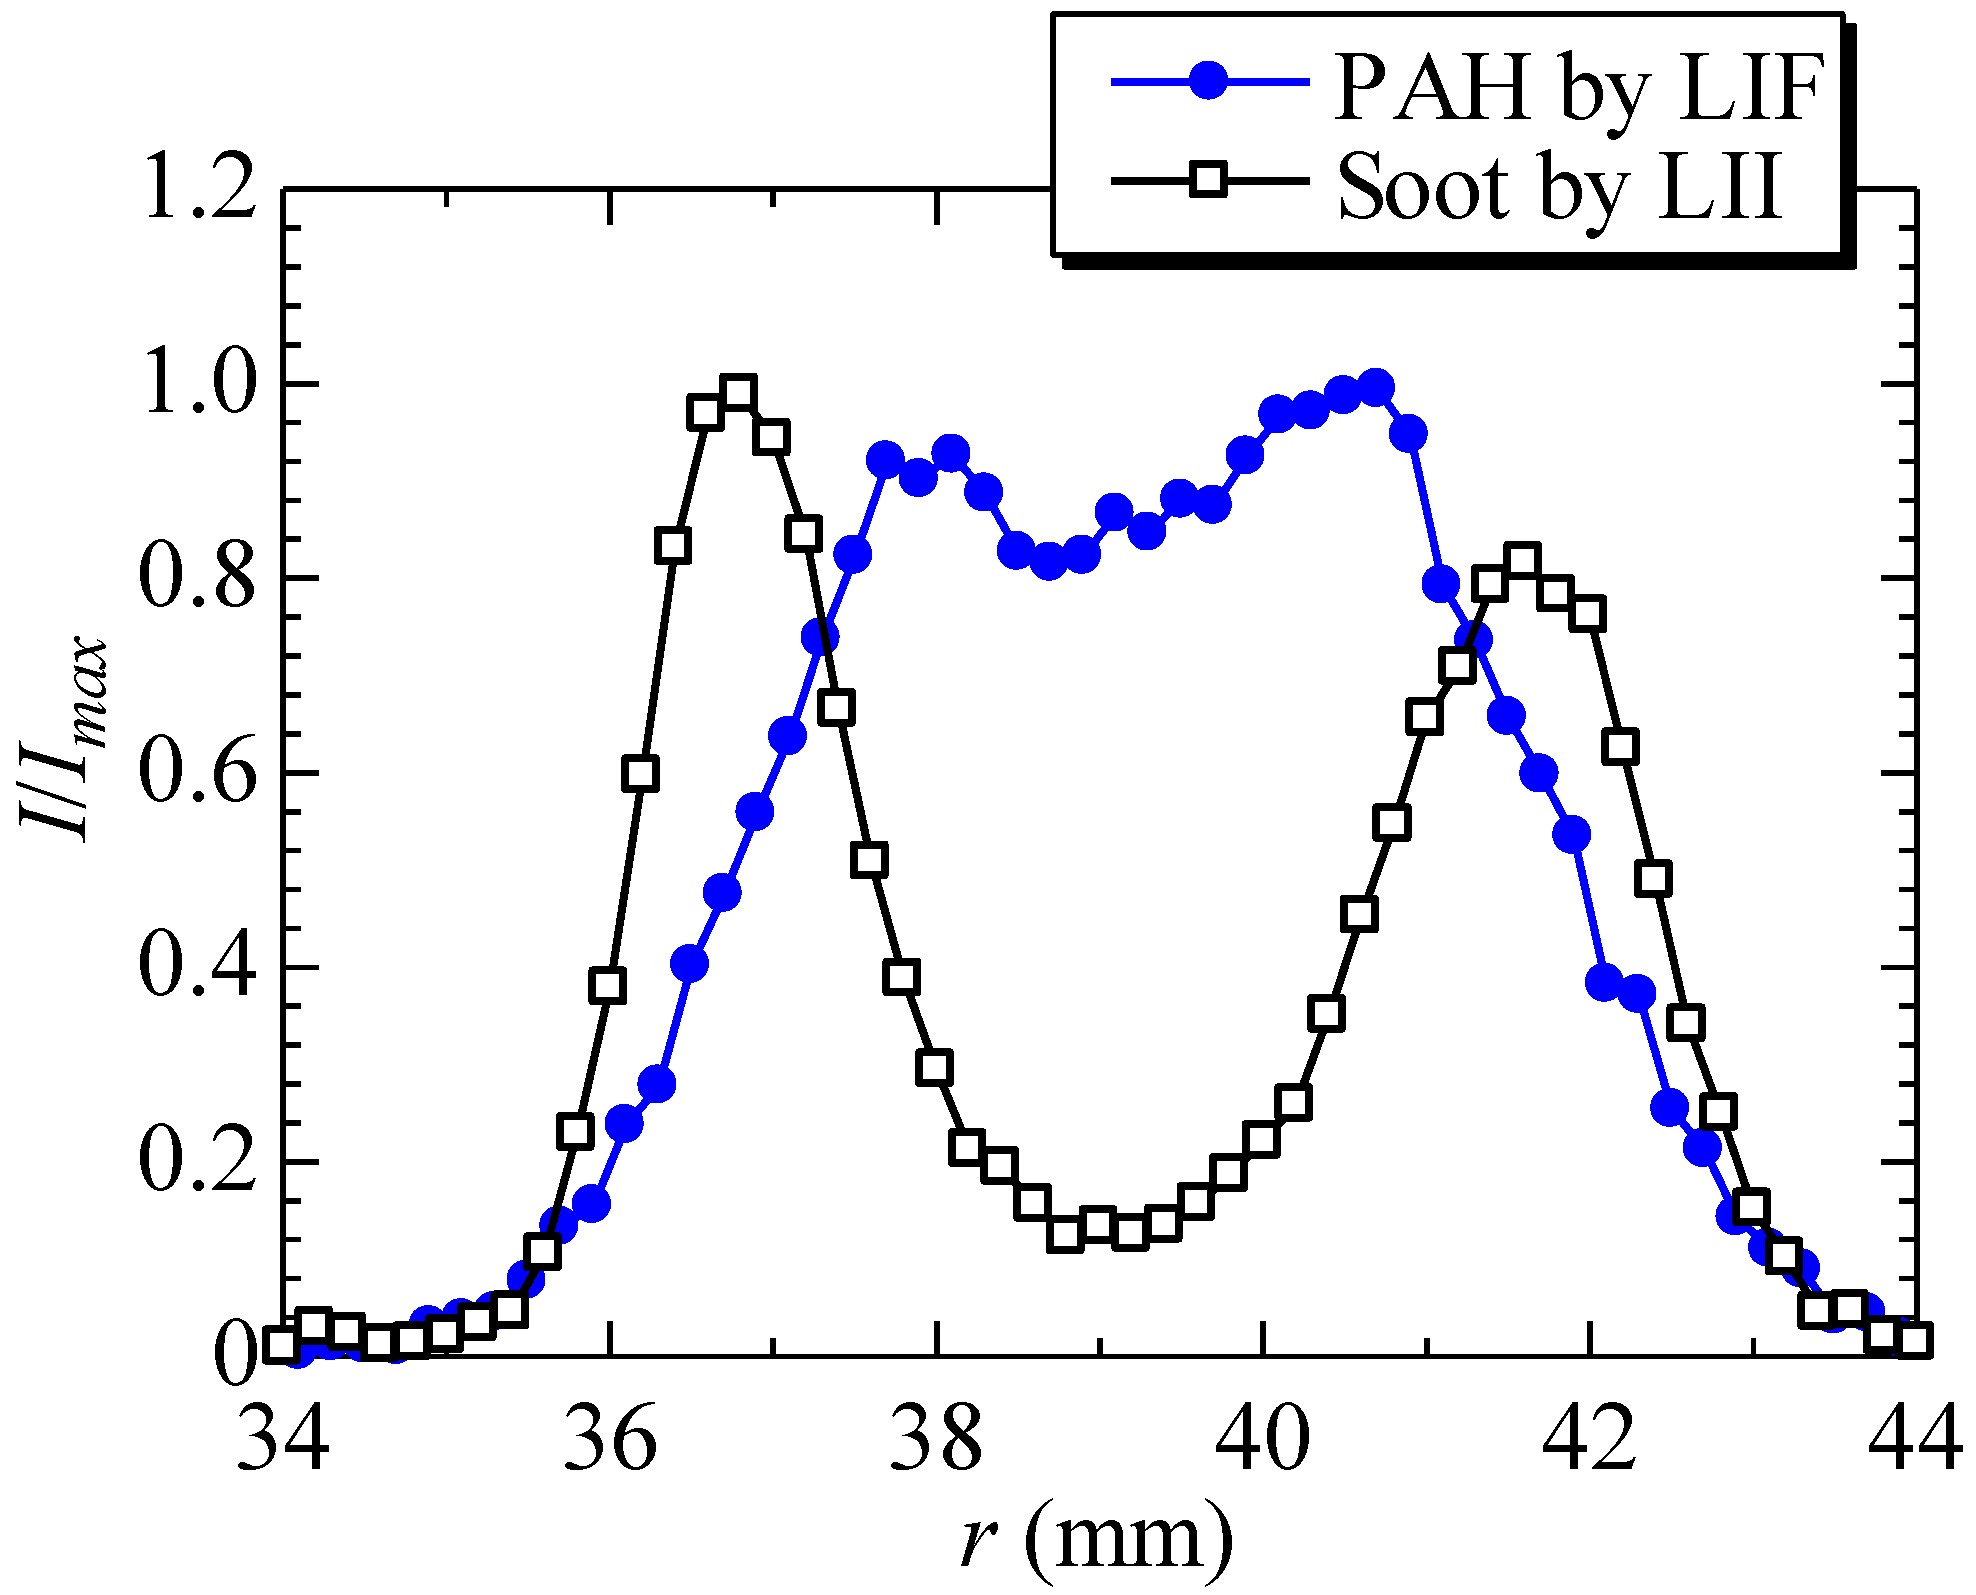
To discuss PAH and soot profiles, these radial distributions are compared. Since the flame fluctuates, the averaged profiles are obtained using 100 images. Figure 6 shows the radial distributions of PAH-LIF and soot LII signals at z = 20 mm. In Figure 5, the axial position in Figure 6 is shown by a dotted line. These profiles are normalized by each maximum signal. It is found that PAH region is mainly observed within two soot peaks of the LII signal. This could be explained by the fact that PAH is a precursor substance of soot, with PAH forming at an earlier stage than soot particle growth. Indeed, PAH was detected near the fuel port in Figure 5, whereas soot was not observed in this region.
Figure 5.
Images of (a) PAH-LIF and (b) soot LII for U1A = 19.4 cm/s, U2F =2.8 cm/s, and U3A =18.4 cm/s. Image area is in the range of 28 mm ≤ r ≤ 52 mm and 8 mm ≤ z ≤ 32 mm.
Figure 5.
Images of (a) PAH-LIF and (b) soot LII for U1A = 19.4 cm/s, U2F =2.8 cm/s, and U3A =18.4 cm/s. Image area is in the range of 28 mm ≤ r ≤ 52 mm and 8 mm ≤ z ≤ 32 mm.
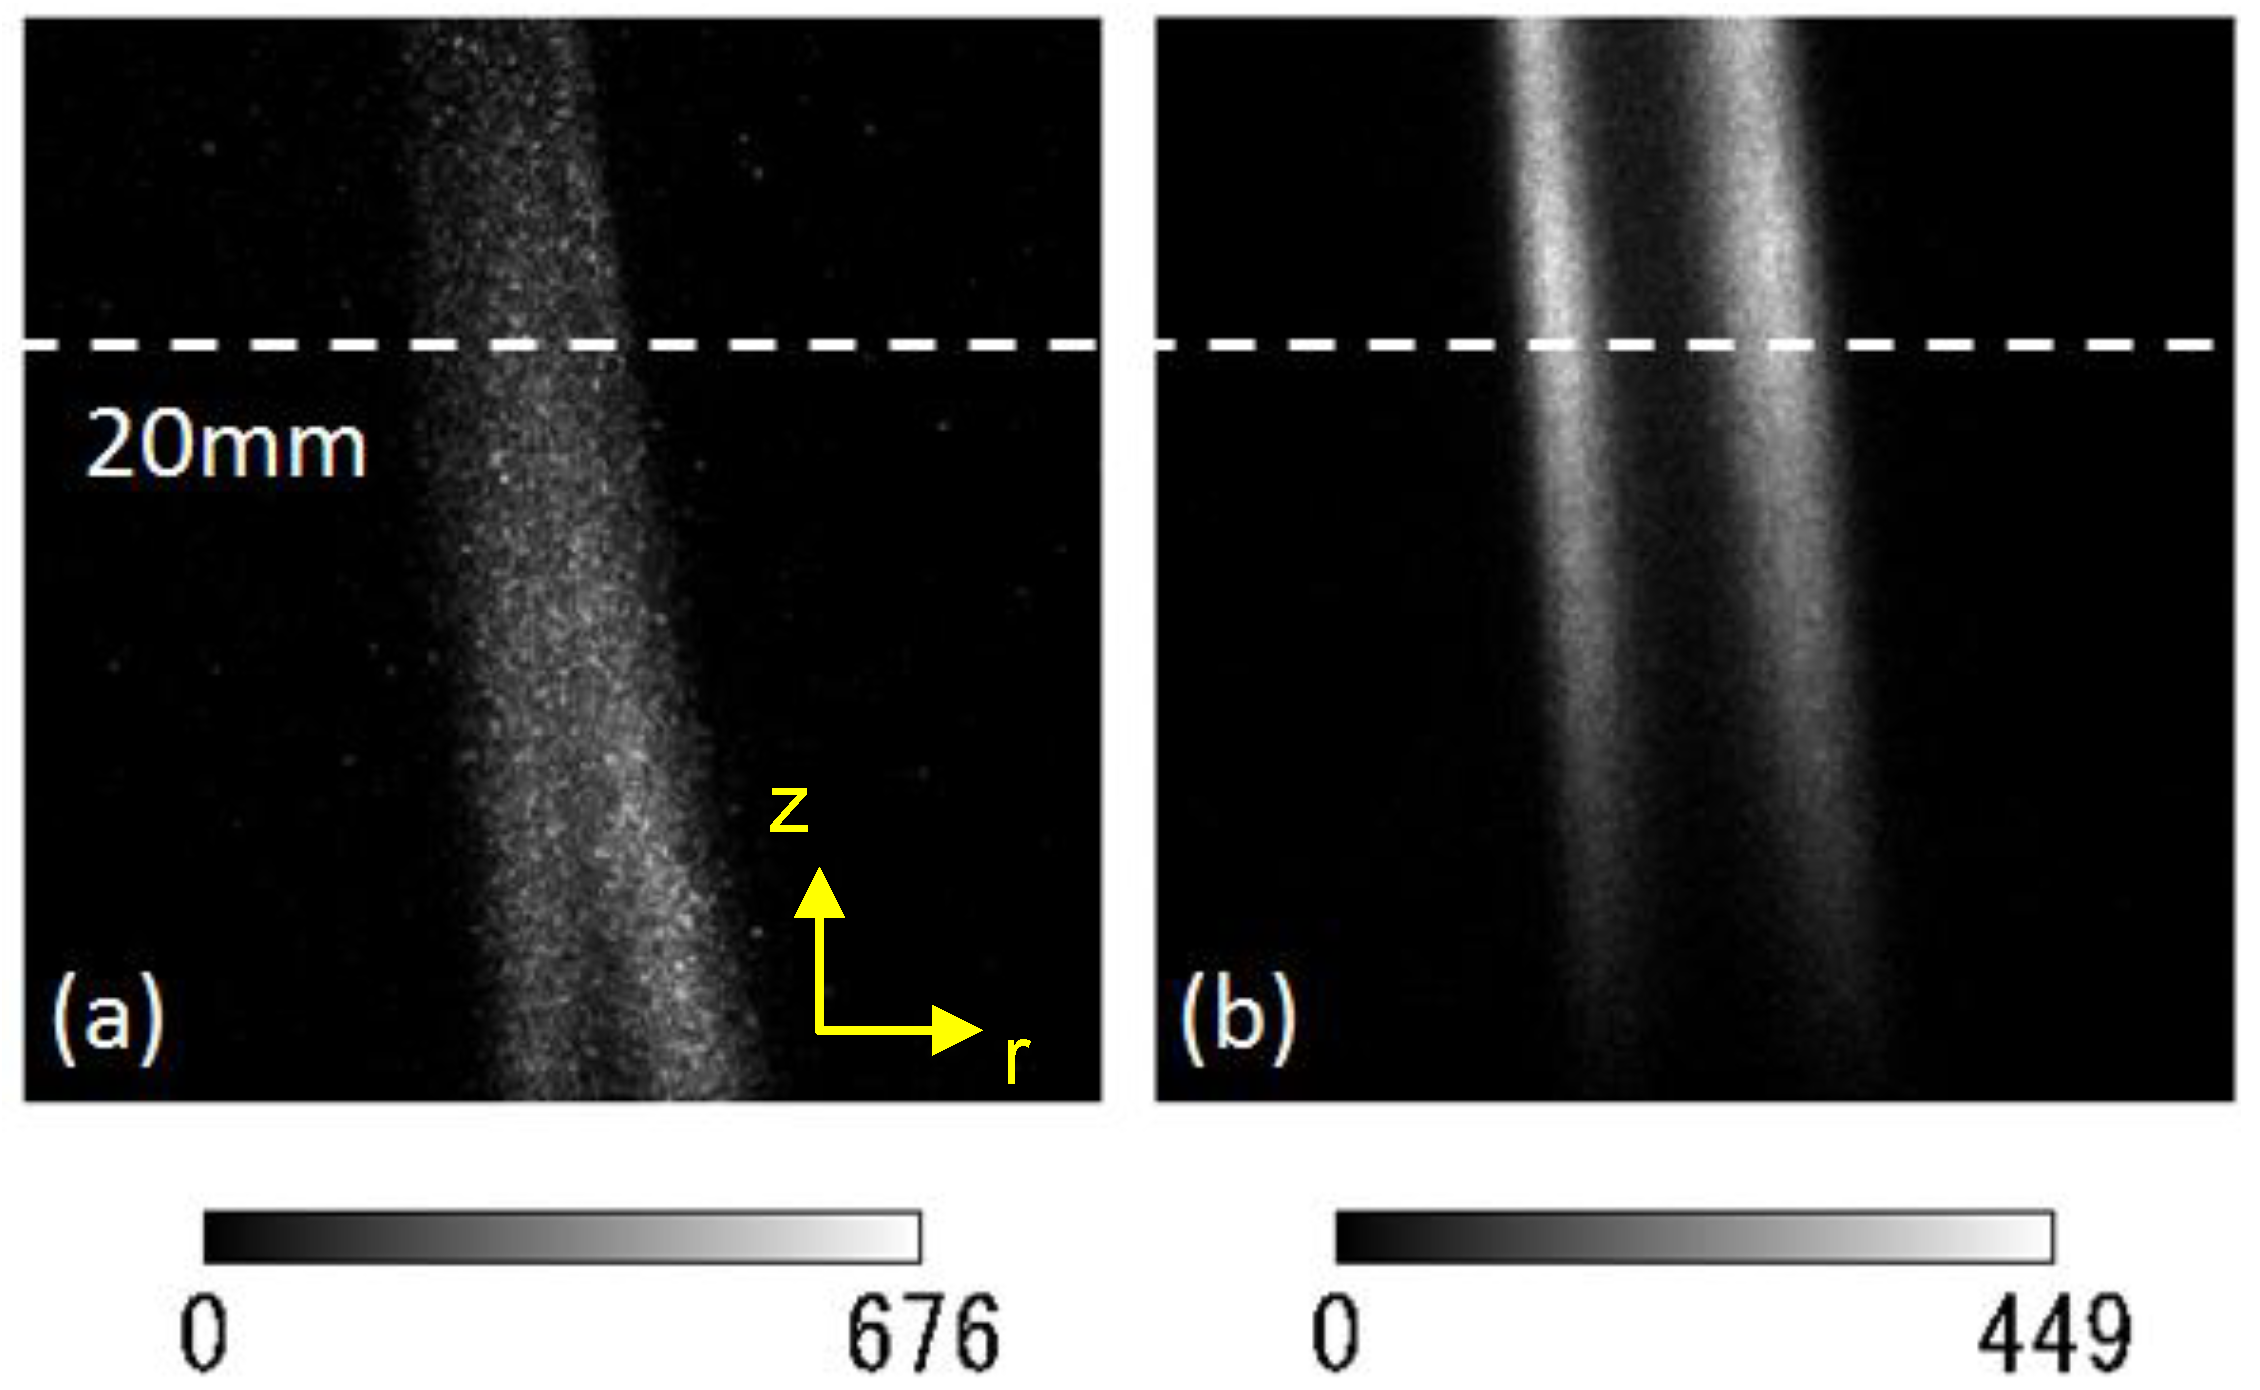
Figure 6.
Profiles of PAH-LIF and LII signals in the triple port burner at z = 20mm.

3.3. PAH and Soot Amounts
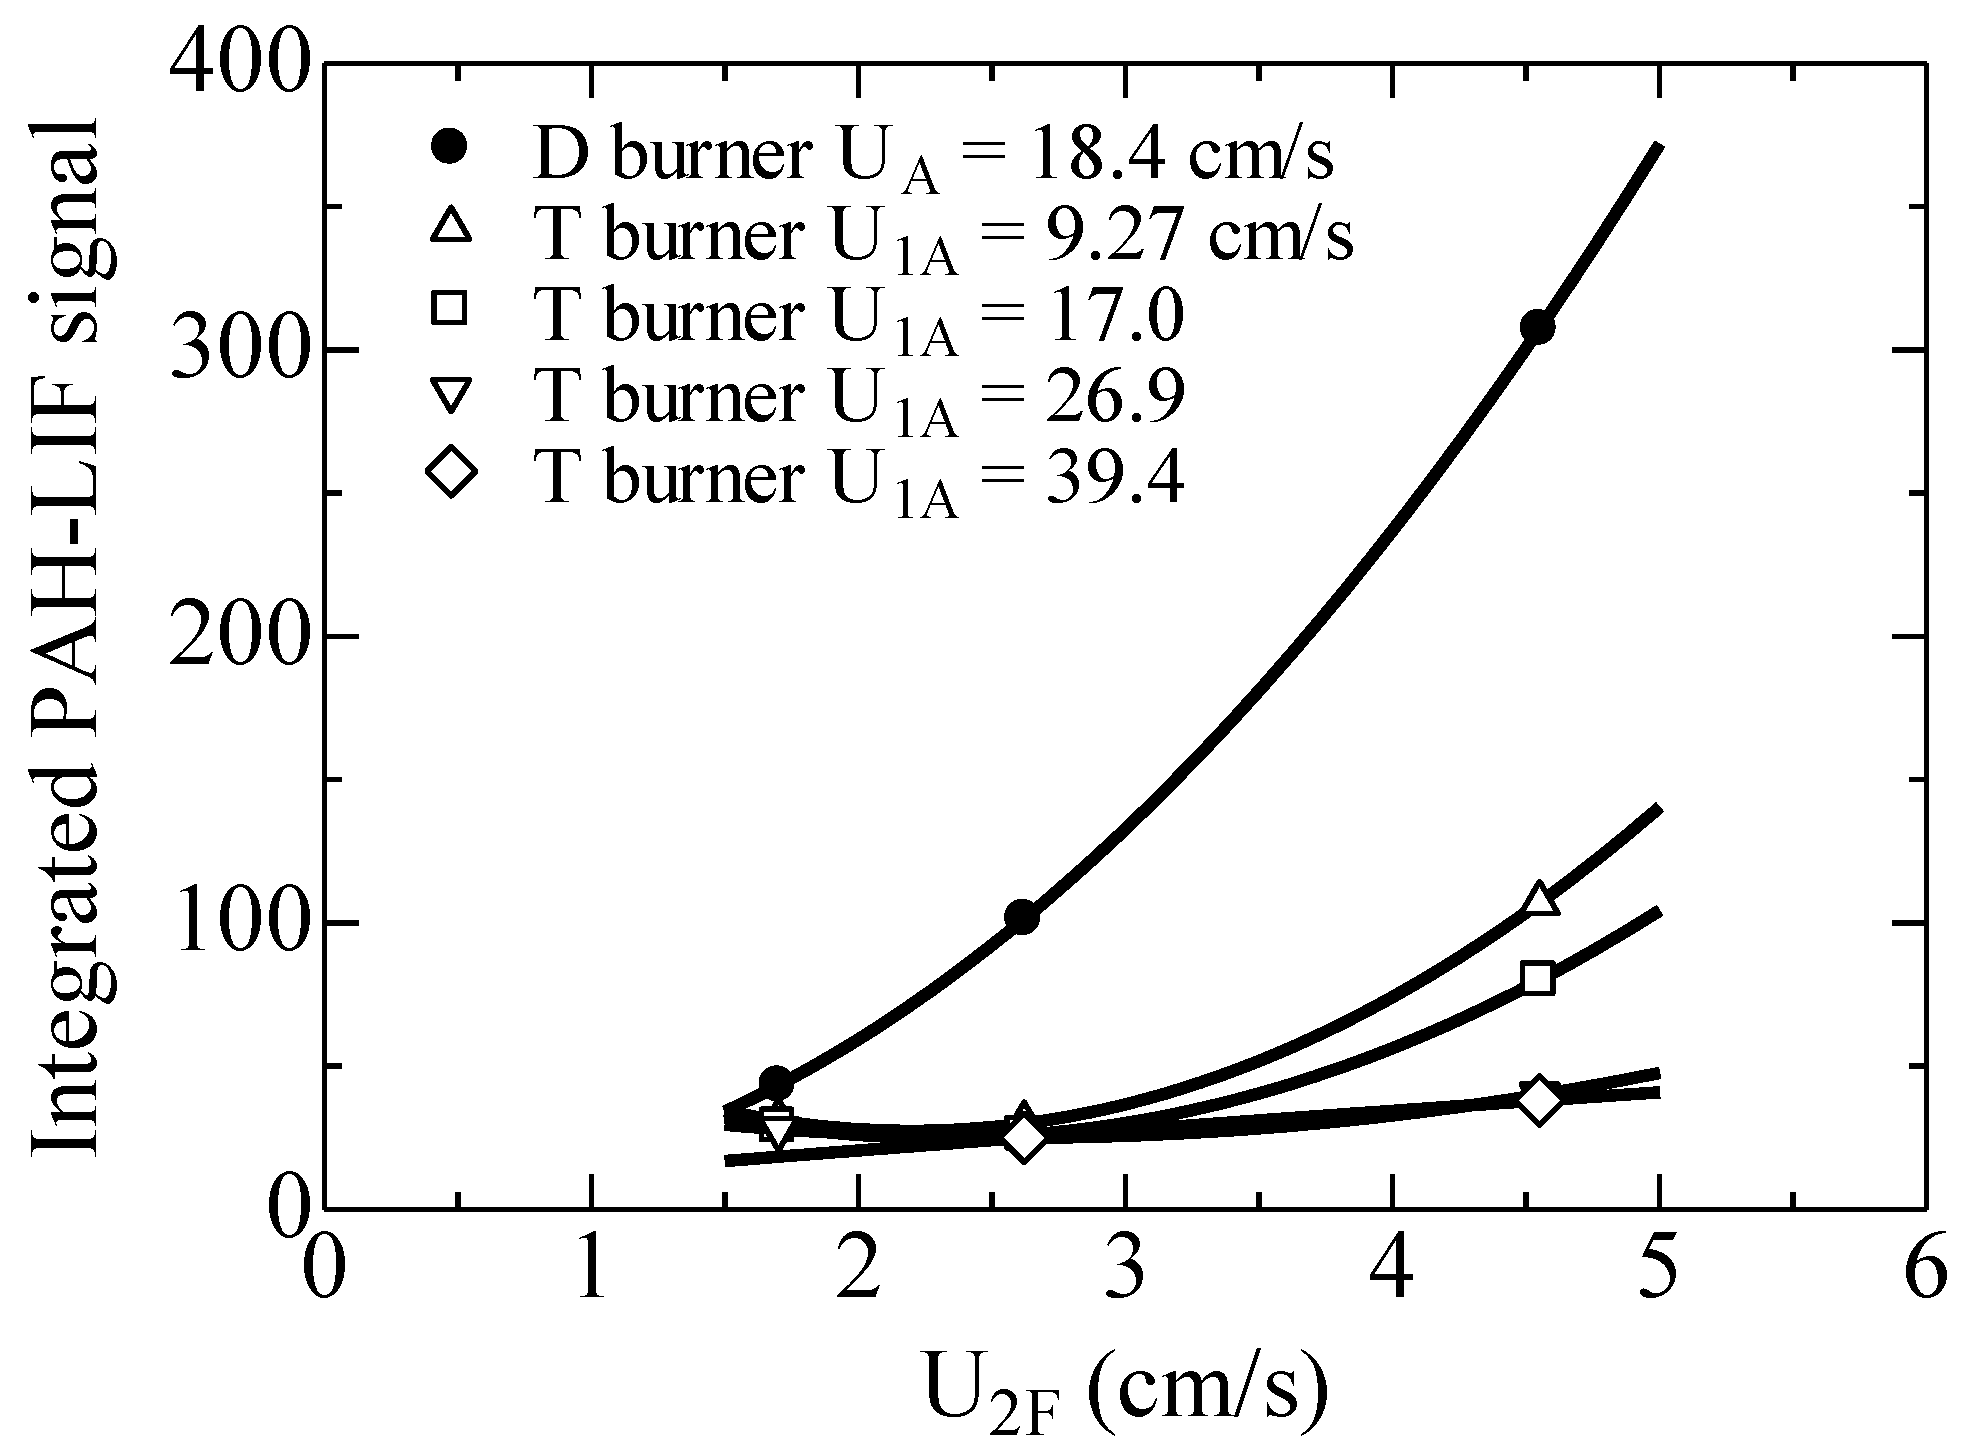
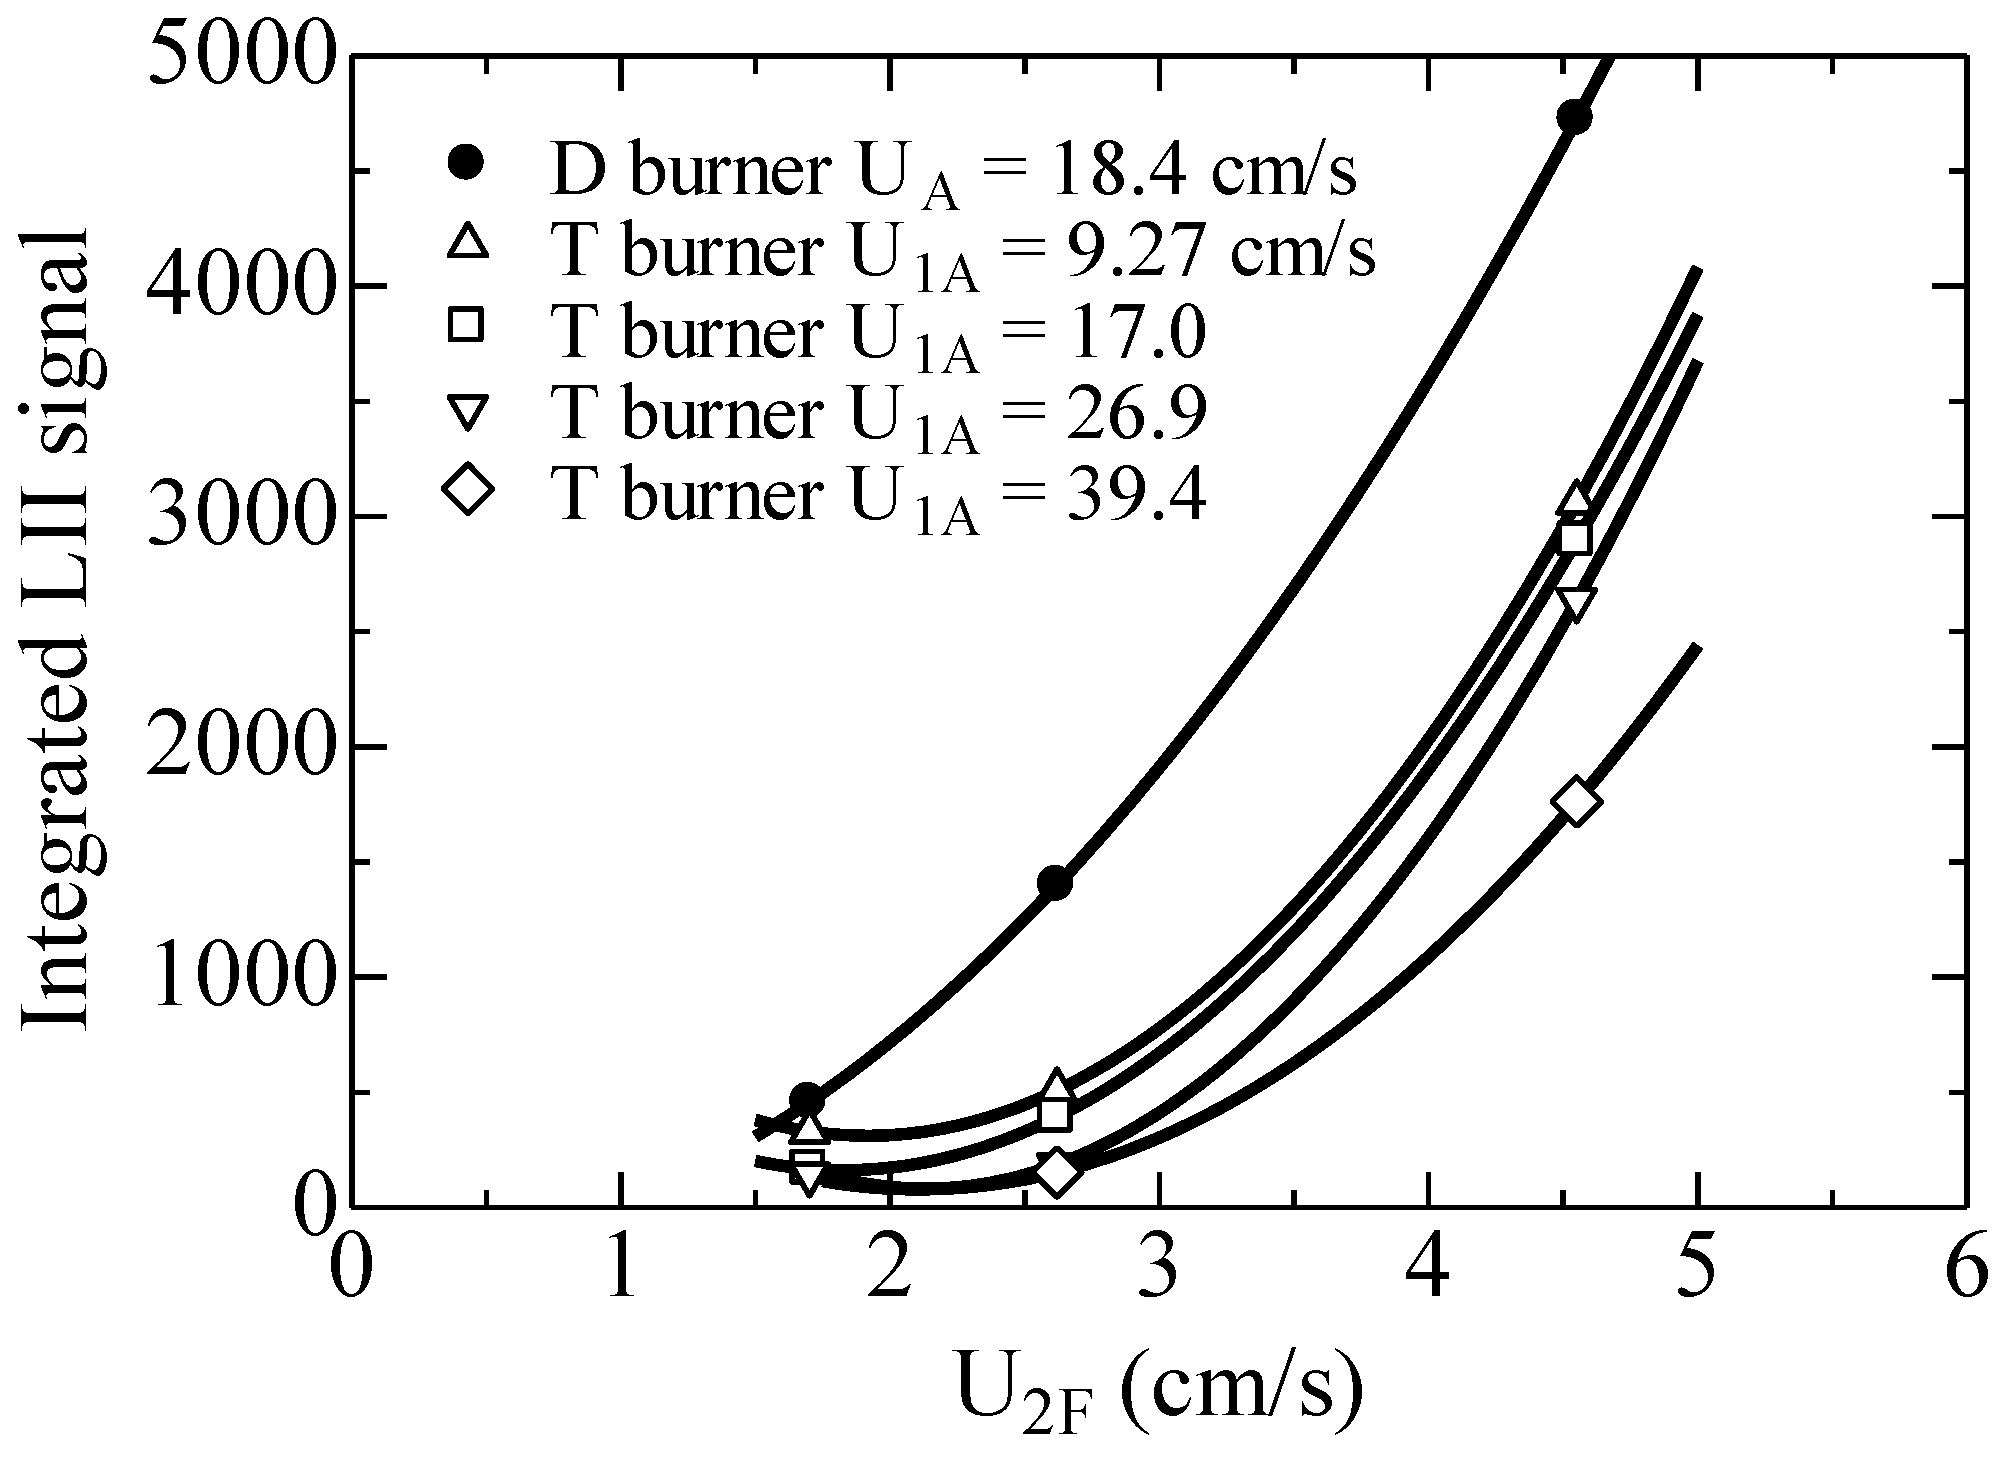
To make clear the PAH and soot amounts in the triple port burner, PAH and soot signals of triple and double port burners were compared at the same fuel supply rate. The fuel flow velocity was U2F = UF = 2.62 cm/s, and the external air flow velocity was U3A = UA = 18.4 cm/s. The internal air flow velocity was varied at U1A = 9.27, 17.0, 26.9 and 39.4 cm/s. Since two diffusion flames are formed in the triple port burner, the total amounts of PAH and soot should be considered. Based on the assumption of the axisymmetry, PAH and soot amounts were evaluated using the following equation.
![Environments 01 00042 i001]() where I is the PAH-LIF or soot LII signal, and V represents the whole volume where these signals were detected. Figure 7 shows the integrated PAH-LIF signal for estimating PAH amount. It is the averaged value of 100 images. In this figure, results of the double port burner are also plotted. It is seen that, even at the same fuel flow velocity, the total PAH of the triple port burner is much lower than that of the double port burner. Interestingly, in the triple port burner, the amount of PAH is reduced by increasing the internal air flow velocity. Since we counted the total PAH in the whole area where PAH exists, the reduction of PAH is not caused by the dilution of internal air flow.
where I is the PAH-LIF or soot LII signal, and V represents the whole volume where these signals were detected. Figure 7 shows the integrated PAH-LIF signal for estimating PAH amount. It is the averaged value of 100 images. In this figure, results of the double port burner are also plotted. It is seen that, even at the same fuel flow velocity, the total PAH of the triple port burner is much lower than that of the double port burner. Interestingly, in the triple port burner, the amount of PAH is reduced by increasing the internal air flow velocity. Since we counted the total PAH in the whole area where PAH exists, the reduction of PAH is not caused by the dilution of internal air flow.

In the same manner, the total soot amounts of both burners were evaluated. Figure 8 shows the integrated LII signals. The conditions are the same in Figure 7. Similarly, the total soot of the triple port burner is smaller. Therefore, the higher internal air flow velocity results in the shorter flame length, which reduces residence time. This could also contribute to the reduction of PAH and soot.
Figure 7.
Integrated PAH-LIF signal for total PAH amount at different fuel flow velocity.

Figure 8.
Integrated LII signal for total soot amount at different fuel flow velocity.
It is reasonable to expect that, to some extent, there should be a correlation between PAH and soot amounts, because PAH is a precursory substance of soot. That is, the soot amount could be partially proportional to the PAH amount. In order to make clear the above expectation, we assume the following formula.
Soot amount = [PAH amount] n
To evaluate the exponential factor of n, natural logarithms of both integrated signals are plotted in Figure 9. Based on the linearity of the red line, the exponential factor is approximately 1.6. It should be noted that soot formation is comprised of four major processes: homogeneous nucleation of soot particles, particle coagulation, particle surface reactions (growth and oxidation), and particle agglomeration [18,19,20]. Since the production of soot is explained by the detailed chemistry, the value of n represents the strength of correlation between soot and PAH, not the two-body chemical reaction. Simply, it is considered that the soot amount decreases through the reduction of PAH.
Figure 9.
Correlation between natural logarithms of integrated PAH-LIF and LII signals.

4. Discussion
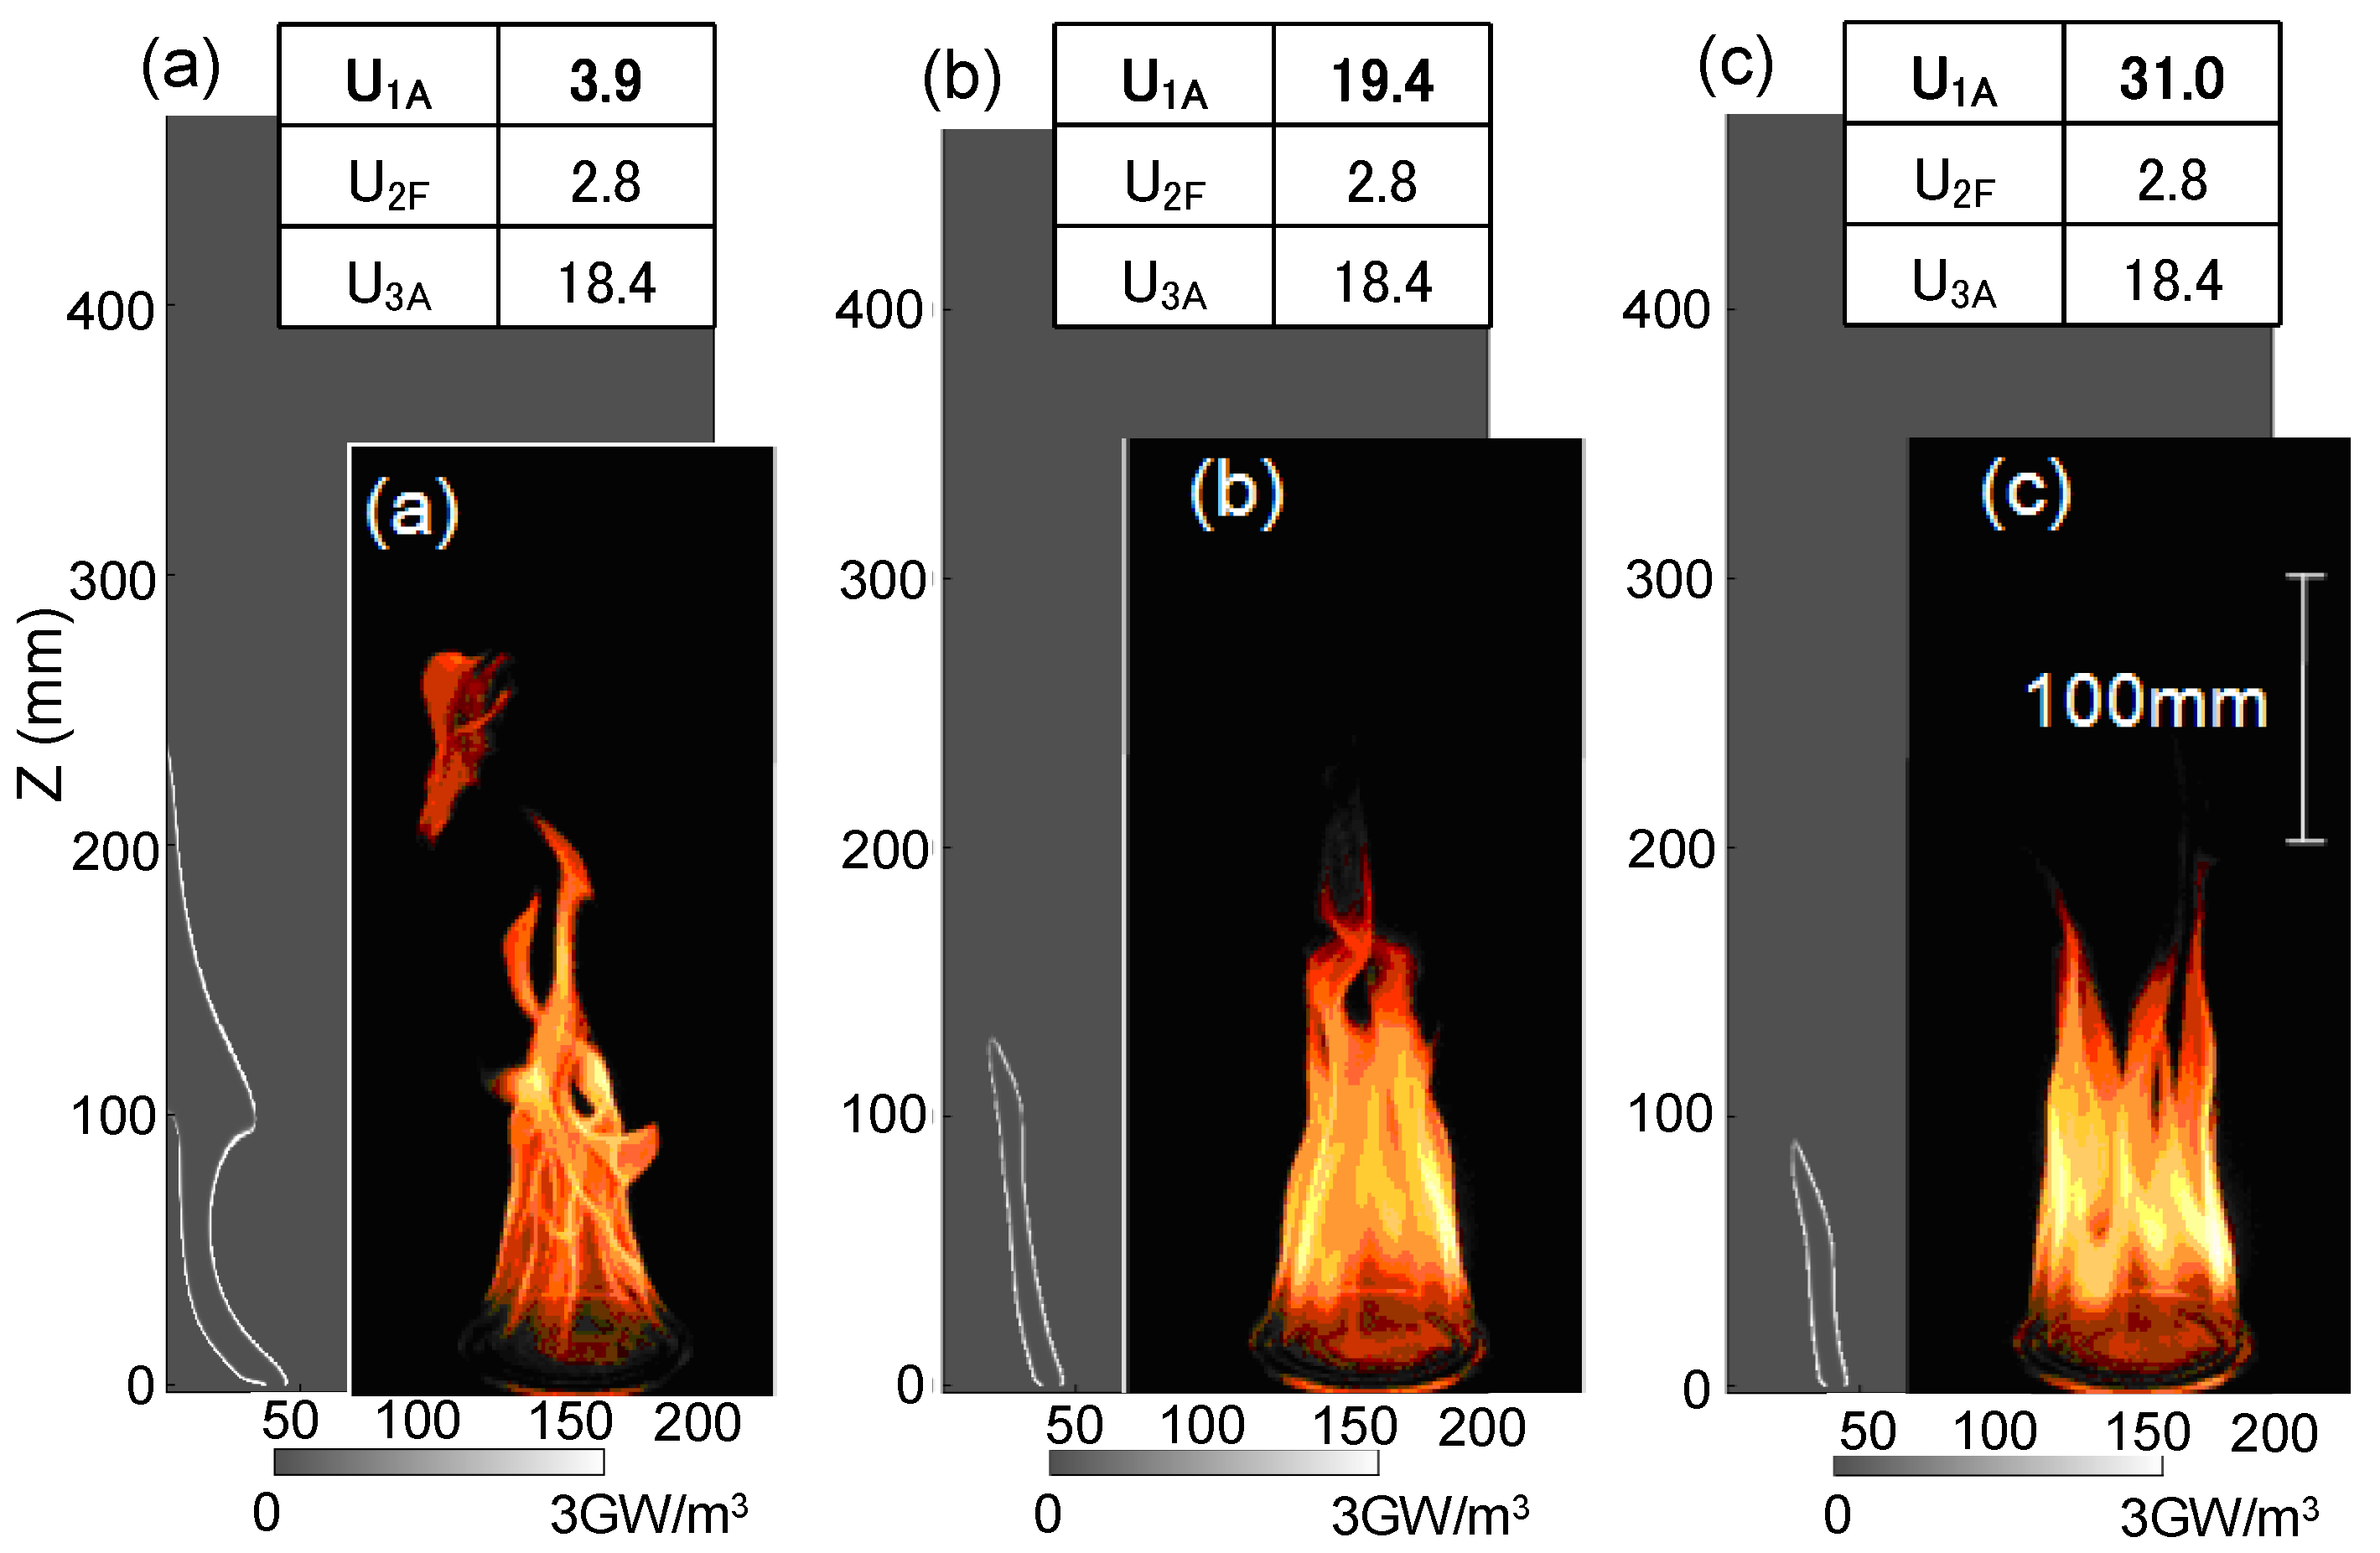
In this section, the present experimental results are discussed based on the results of numerical simulation. In our previous study, we have simulated the flame in the triple port burner. The same numerical model [5,8] was used, except for the reaction scheme. Here, an over-all one step reaction mechanism for non-premixed propane-air flame was adopted [21,22]. At first, the flame shape obtained by the numerical simulation is shown in Figure 10. They are the instantaneous heat release rates. U1A are 3.9, 19.4, and 31.0 cm/s, with the fixed fuel flow velocity of U2F = 2.8 cm/s. For comparison, direct photographs of the flame at these conditions are shown in this figure. In the simulated reaction profile, it is seen that two flame zones are recognized due to the center air injection inside the fuel flow. The flame height determined by the luminous flame zone is already shown in Figure 4, ensuring that the flame length is qualitatively predicted by the simulation.
Next, based on the numerically predicted combustion field, we discuss the difference between the triple port burner and the double port burner. The axial profiles of the reaction rate are shown in Figure 11. Each profile is an example of the instantaneous one obtained by the simulation. Due to the flickering, the spatial profile of the reaction rate fluctuates. To discuss the fuel consumption rate toward the downstream, the maximum value at each axial coordinate is plotted. It should be noted that, the over-all one-step reaction was adopted in the simulation [8]. Thus, the reaction rate is equivalent to the molar fuel consumption rate. In the case of the triple port burner, the internal air flow velocity was set at U1A = 3.9, 19.4, 31.0 cm/s. To discuss the behaviors of inner and outer flames, the reaction rates of both flames are separately examined. By considering the flame configuration, the reaction rate of the double port burner is shown in Figure 11a, obtained at UF = 2.8 cm/s (=U2F), UA = 18.4 cm/s (=U3A).
Figure 10.
Distributions of simulated instantaneous heat release rate, compared with direct photographs of flames in experiments.
Figure 10.
Distributions of simulated instantaneous heat release rate, compared with direct photographs of flames in experiments.

Figure 11.
Axial profiles of simulated maximum reaction rate of (a) outer flame and (b) inner flame in triple port burner are shown. For comparison, profile in double port burner is shown.
Figure 11.
Axial profiles of simulated maximum reaction rate of (a) outer flame and (b) inner flame in triple port burner are shown. For comparison, profile in double port burner is shown.
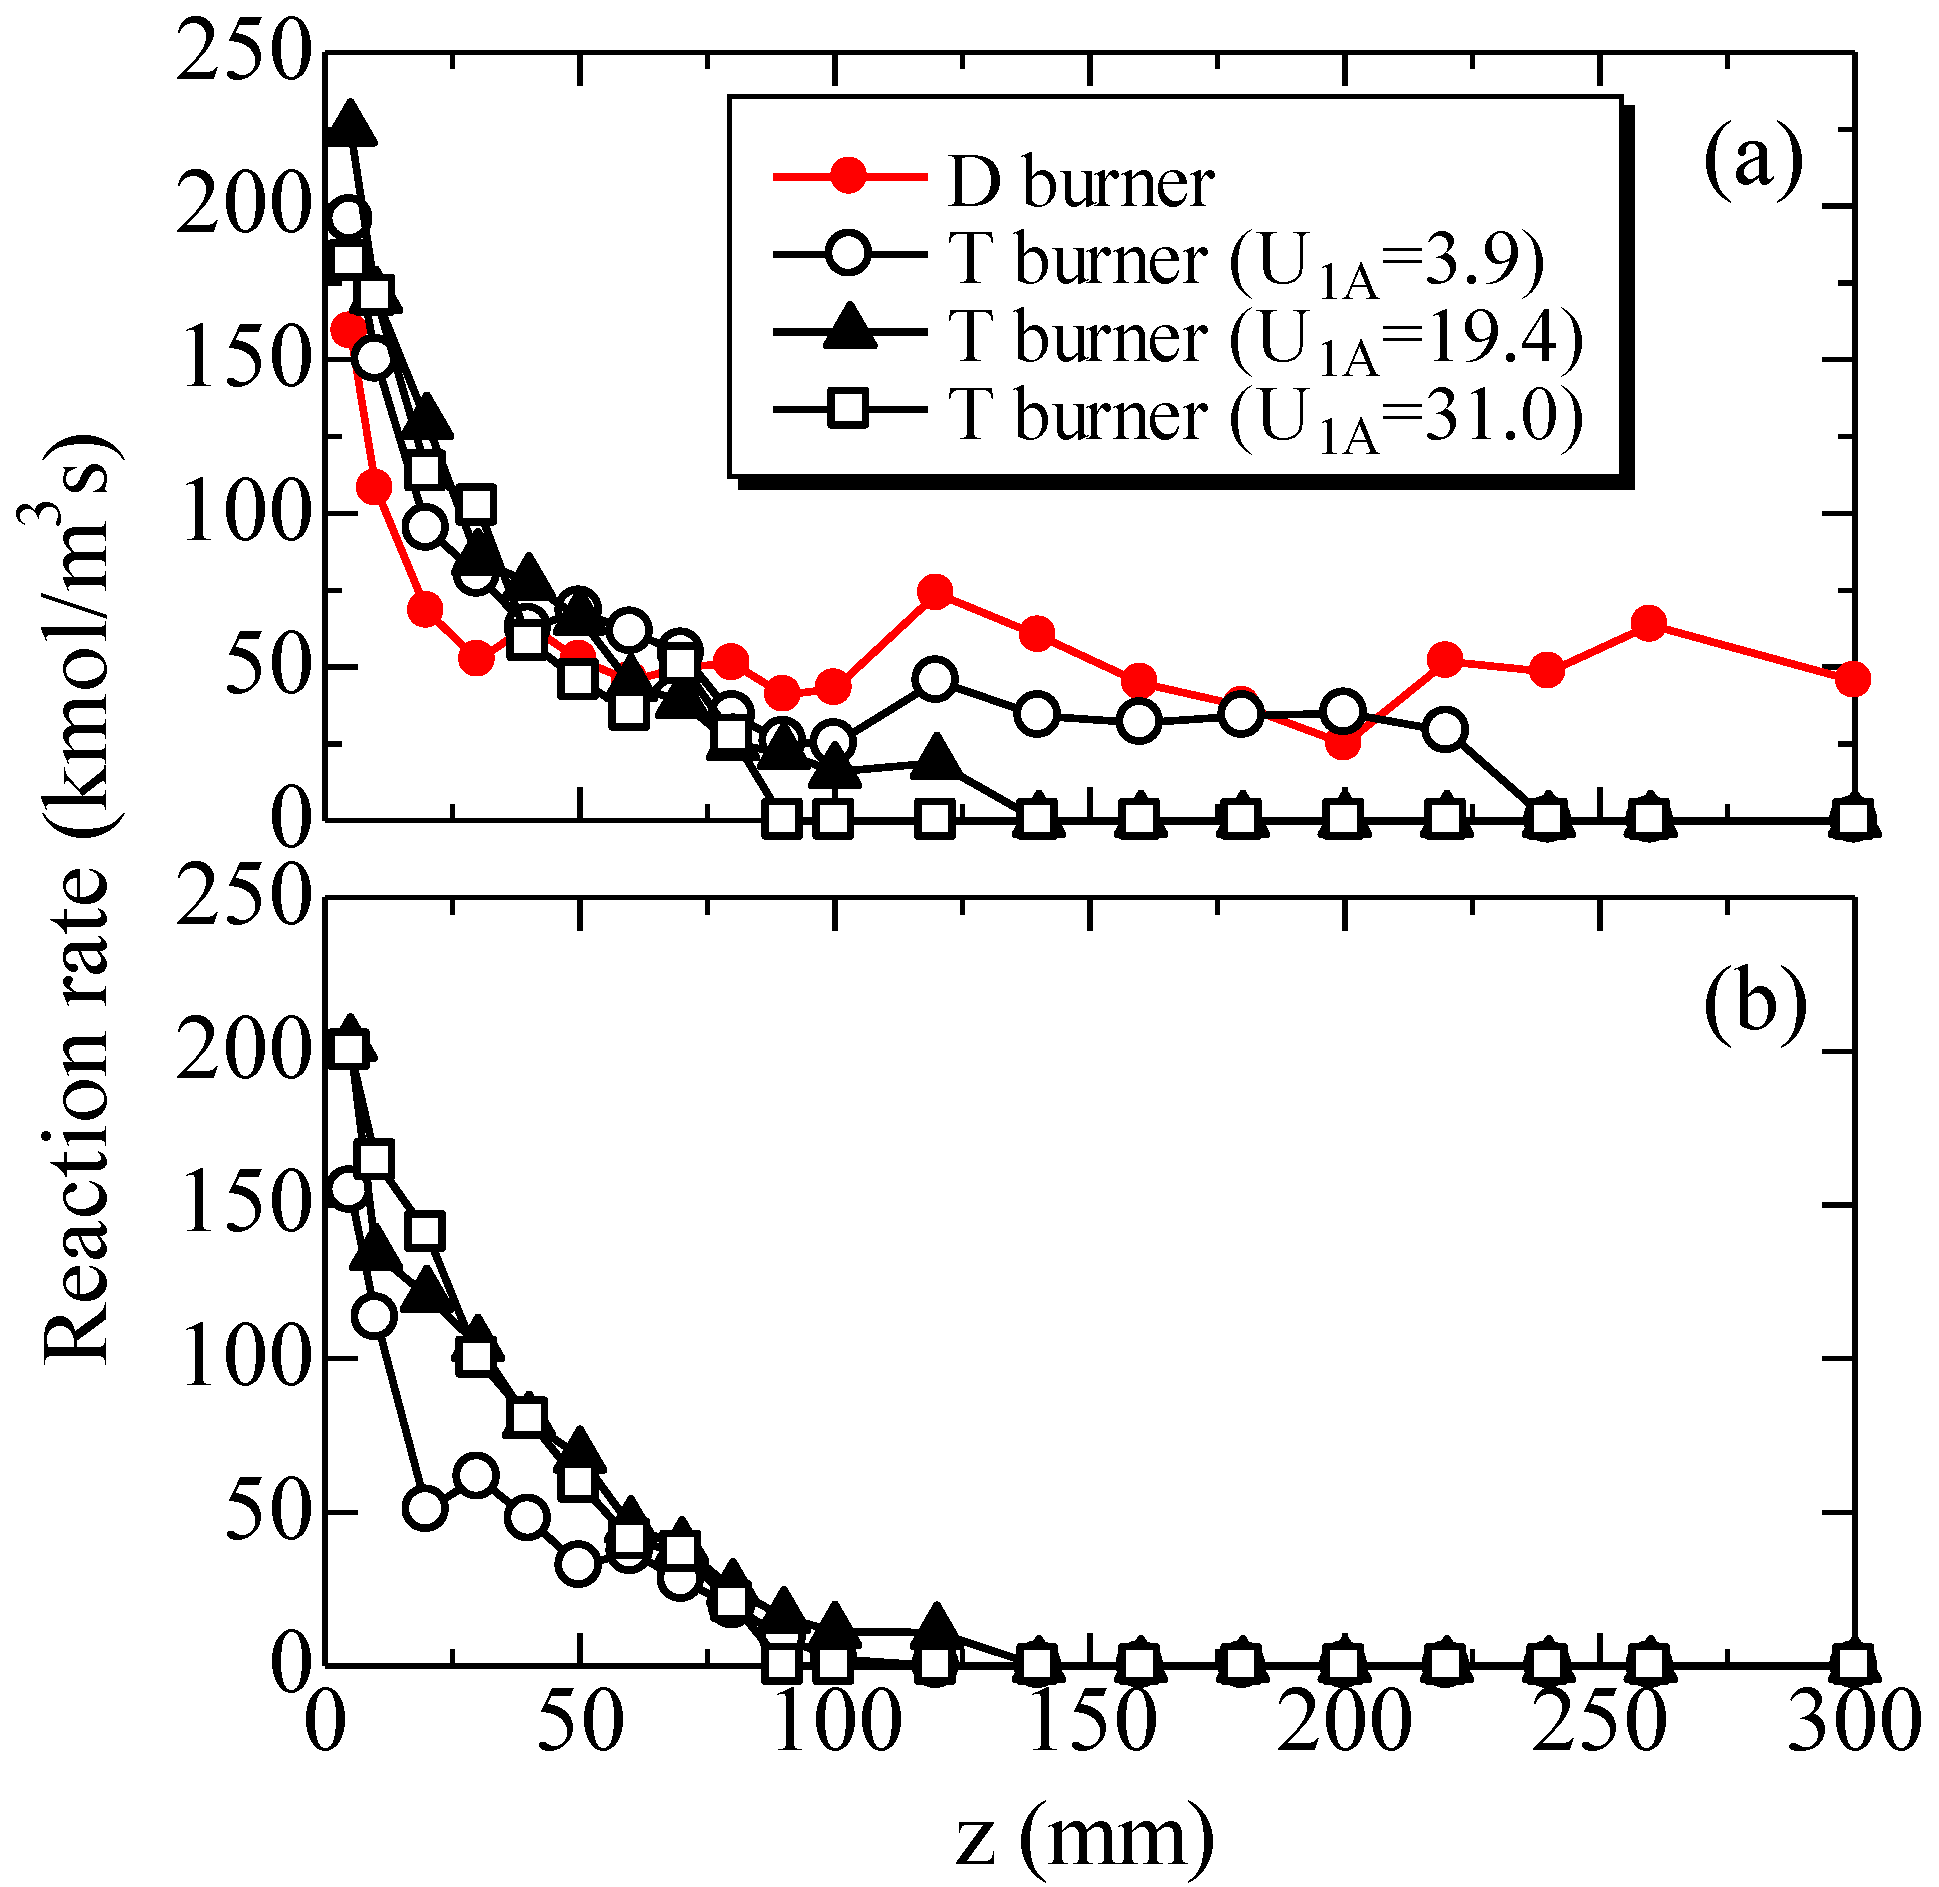
As for the outer flame as well as the inner flame, the reaction rate gradually decreases downstream. The reaction rate of the inner flame in Figure 11b becomes lower by reducing U1A. Expectedly, independent of U1A, the reaction rate of outer flame is almost the same, except for z > 100 mm at U1A = 3.9 cm/s. In this case, since the internal air flow velocity is small, oxygen in the internal air flow is easily consumed; the inner flame vanishes around z = 100 mm (see Figure 10a). Resultantly, at z > 100 mm, the reaction rate of the outer flame is close to that of the double port burner. It seems very reasonable, because oxygen is supplied from one side air flow in the double port burner, forming one diffusion flame. Therefore, in the case of the triple port burner, the center air injection accelerates the fuel consumption, resulting in the shorter flame length.
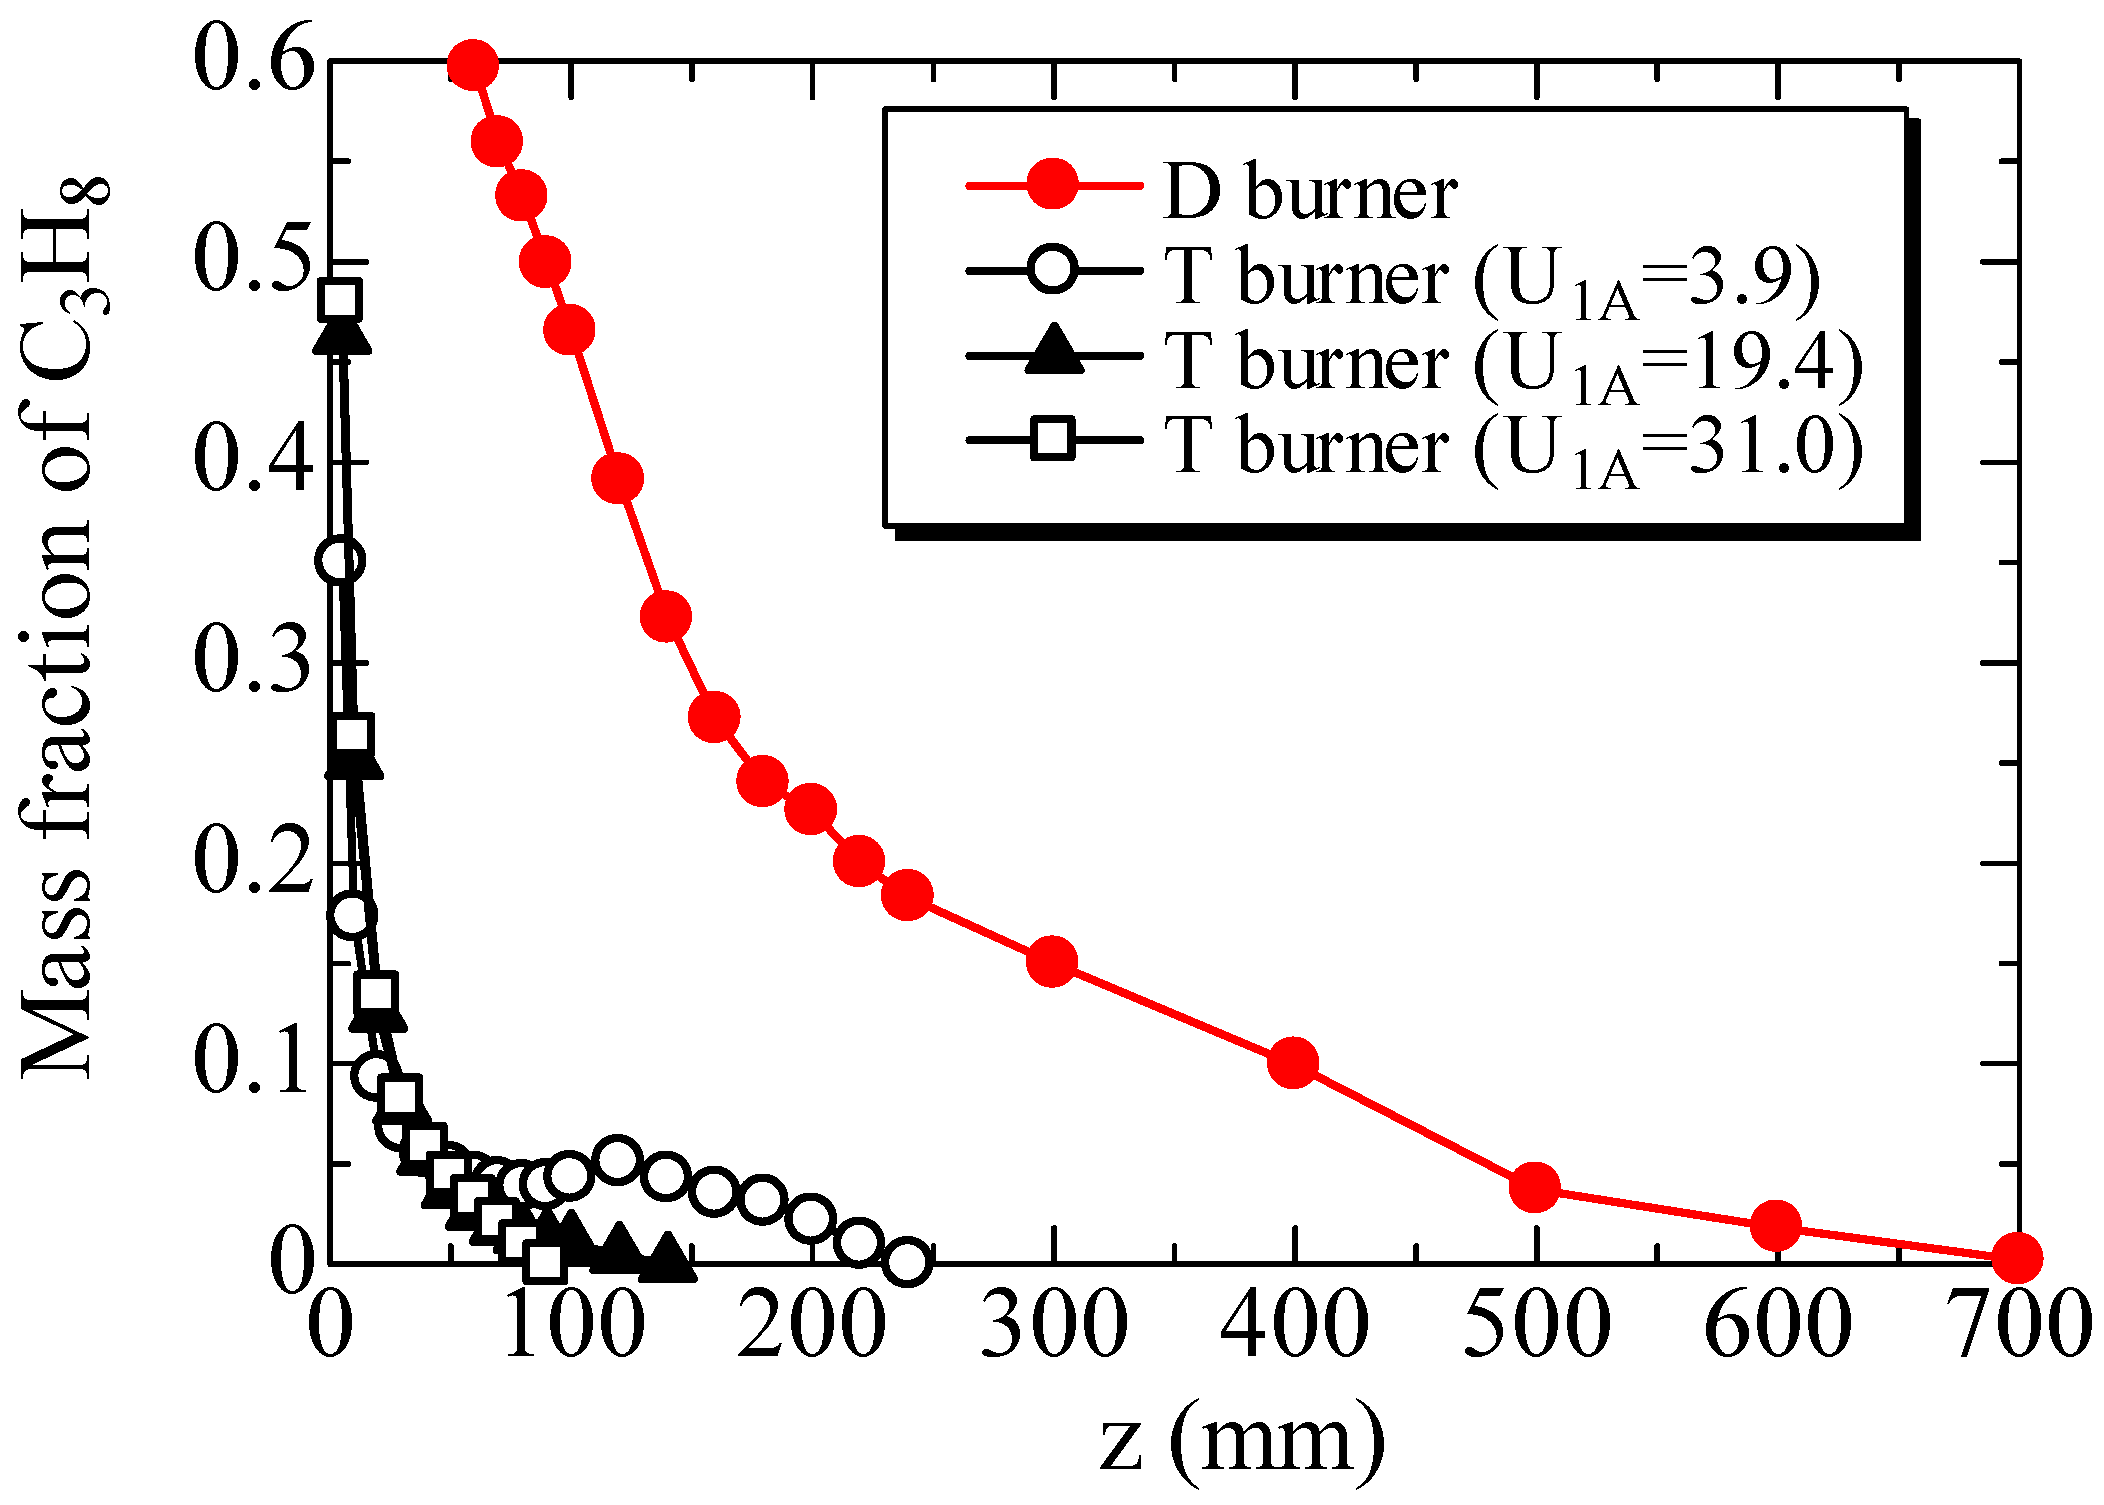
To confirm the above discussion, the maximum fuel mass fraction at each axial coordinate is examined. The simulation results are shown in Figure 12. The profile of the double port burner is also plotted. Since the fuel is consumed only in one diffusion flame, the fuel concentration of the double port burner is much higher. On the other hand, in the case of the tripe port burner, the extremely large reduction of fuel concentration is observed, which is caused by the fuel consumption in both inner and outer flames. Moreover, even at the same external air flow velocity, the fuel consumption is promoted by increasing U1A, which well corresponds to the flame length in Figure 4. Hence, the center air jet plays an important role for the promotion of fuel consumption. Resultantly, in comparison with the double port burner, amounts of PAH and soot are largely reduced.
Figure 12.
Axial distributions of simulated maximum fuel mass fraction at U2F (UF) = 2.8 cm/s, U3A (UA) = 18.4 cm/s for triple port burner and double port burner are shown.
Figure 12.
Axial distributions of simulated maximum fuel mass fraction at U2F (UF) = 2.8 cm/s, U3A (UA) = 18.4 cm/s for triple port burner and double port burner are shown.

5. Conclusions
In this study, by using PAH-LIF and soot LII, we examined relative PAH and soot amounts of the triple port burner and the conventional co-axial burner (double port burner). Here, we focused on the attached flames. We varied the flow conditions of supplied fuel and air. The following conclusions were drawn.
- (1)
- In the triple port burner, two different blue flames are observed near the burner rim, followed by the bright luminous flames with soot. The flame length determined by the luminous flame zone is longer when the fuel flow velocity is increased. On the other hand, the flame length is decreased with an increase in the internal air flow velocity;
- (2)
- Two separate PAH and soot regions are observed. PAH exists between two soot regions, because PAH is a precursor substance of soot. Amounts of PAH and soot of the triple port burner are much smaller than those of the double port burner. Based on the correlation between PAH and soot, the exponential factor turns to be 1.6;
- (3)
- Since the fuel is consumed only in one diffusion flame, the fuel consumption rate of the double port burner is relatively lower. On the other hand, in the case of the tripe port burner, the fuel consumption is largely promoted, because two air flows are supplied to form inner and outer flames. Moreover, even at the same external air flow velocity, the fuel consumption is promoted by increasing the internal air flow velocity, resulting in the shorter flame length. Hence, the center air jet plays an important role for the promotion of fuel consumption. As a result, in comparison with the double port burner, amounts of PAH and soot are largely reduced.
Acknowledgments
The authors thank Christopher R. Shaddix of Sandia National Laboratory in the U.S.A. for very helpful discussions of combustion characteristics of the triple port burner.
Author Contributions
Kazuhiro Yamamoto had the original idea for the study, and drafted the manuscript. Masahiro Takemoto was responsible for data analyses. All authors read and approved the final manuscript.
Conflicts of Interest
The authors declare no conflict of interest.
References
- Kennedy, I.M. The health effects of combustion-generated aerosols. Proc. Combust. Inst. 2007, 31, 2757–2770. [Google Scholar] [CrossRef]
- Frenklach, M.; Wang, H. Soot Formation in Combustion-Mechanisms and Models; Springer: Berlin/Heidelberg, Germany, 2004; pp. 162–164. [Google Scholar]
- Chen, D.; Zainuddin, Z.; Yapp, E.; Akroyd, J.; Mosbach, S.; Kraft, M. A fully coupled simulation of PAH and soot growth with a population balance model. Proc. Combust. Inst. 2013, 34, 1827–1835. [Google Scholar] [CrossRef]
- Vander Wal, R.L.; Jensen, K.A.; Choi, M.Y. Simultaneous laser-induced emission of soot and polycyclic aromatics hydrocarbons within a gas-jet diffusion flame. Combust. Flame 1997, 109, 399–414. [Google Scholar]
- Yamamoto, K.; Kato, S.; Isobe, Y.; Hayashi, N.; Yamashita, H. Lifted flame structure of coannular jet flames in a triple port burner. Proc. Combust. Inst. 2011, 33, 1195–1201. [Google Scholar]
- Shaddix, C.R.; Williams, T.C.; Blevins, L.G.; Schefer, R.W. Flame structure of steady and pulsed sooting inverse jet diffusion flames. Proc. Combust. Inst. 2005, 30, 1501–1508. [Google Scholar]
- Kumfer, B.M.; Skeen, S.A.; Axelbaum, R.L. Soot inception limits in laminar diffusion flames with application to oxy-fuel combustion. Combust. Flame 2008, 154, 546–556. [Google Scholar]
- Okuyama, G; Yamamoto, K.; Hayashi, N.; Yamashita, H. Combustion characteristics and flame structure in a triple port burner. In Proceedings of the 6th International Conference Computational Heat and Mass Transfer, Guangzhou, China, 18–22 May 2009; pp. 373–378.
- Yamamoto, K.; Takemoto, M. Measurement of PAH and soot of diffusion flames in a triple port burner. Fuel Process. Technol. 2013, 107, 99–106. [Google Scholar] [CrossRef]
- Yoon, S.S.; Lee, S.M.; Chung, S.H. Effect of mixing methane, ethane, propane, and propene on the synergistic effect of PAH and soot formation in ethylene-base counterflow diffusion flames. Proc. Combust. Inst. 2005, 30, 1417–1424. [Google Scholar] [CrossRef]
- D’Anna, A.; Commodo, M.; Violi, S.; Allouis, C.; Kent, J. Nano organic carbon and soot in turbulent non-premixed ethylene flames. Proc. Combust. Inst. 2007, 31, 621–629. [Google Scholar]
- Yamamoto, K.; Fujikake, F.; Matsui, K. Non-catalytic after-treatment for diesel particulates using carbon-fiber filter and experimental validation. Proc. Combust. Inst. 2011, 34, 2865–2875. [Google Scholar] [CrossRef]
- Yamamoto, K.; Ozeki, M.; Hayashi, N.; Yamashita, H. Burning velocity and OH concentration in premixed combustion. Proc. Combust. Inst. 2009, 32, 1227–1235. [Google Scholar] [CrossRef]
- Yamamoto, K.; Ishii, S.; Ohnishi, M. Local flame structure and turbulent burning velocity by joint PLIF imaging. Proc. Combust. Inst. 2011, 33, 1285–1292. [Google Scholar] [CrossRef]
- Schulz, C.; Kock, B.F.; Hofmann, M.; Michelsen, H.; Will, S.; Bougie, B.; Suntz, R.; Smallwood, G. Laser-induced incandescence: Recent trends and current questions. Appl. Phys. B 2006, 83, 333–354. [Google Scholar]
- Melton, L.A. Soot diagnostics based on laser heating. Appl. Opt. 1984, 23, 2201–2208. [Google Scholar] [CrossRef]
- Goulay, F.; Schrader, P.E.; Nemes, L.; Dansson, M.A.; Michelsen, H.A. Photochemical interferences for laser-induced incandescence of flame-generated soot. Proc. Combust. Inst. 2009, 32, 963–970. [Google Scholar] [CrossRef]
- Wang, H.; Frenklach, M. A detailed kinetic modeling study of aromatics formation in laminar premixed acetylene and ethylene flames. Combust. Flame 1997, 110, 173–221. [Google Scholar] [CrossRef]
- Marinov, N.M.; Pitz, W.J.; Westbrook, C.K.; Vincitore, A.M.; Castaldi, M.J.; Senkan, S.M.; Melius, C.F. Aromatic and polycyclic aromatic hydrocarbon formation in a laminar premixed n-butane flame. Combust. Flame 1998, 114, 192–213. [Google Scholar] [CrossRef]
- Frenklach, M. Reaction mechanism of soot formation in flames. Phys. Chem. Chem. Phys. 2002, 4, 2028–2037. [Google Scholar] [CrossRef]
- Westbrook, C.K.; Dryer, F.L. Simplified reaction mechanisms for the oxidation of hydrocarbon fuels in flames. Combust. Sci. Technol. 1981, 27, 265–280. [Google Scholar]
- Grinstein, F.F.; Kailasanath, K. Exothermicity and three-dimensional effects in unsteady propane square jets. Proc. Combust. Inst. 1996, 26, 91–96. [Google Scholar] [CrossRef]
© 2014 by the authors; licensee MDPI, Basel, Switzerland. This article is an open access article distributed under the terms and conditions of the Creative Commons Attribution license (http://creativecommons.org/licenses/by/3.0/).
Share and Cite
MDPI and ACS Style
Yamamoto, K.; Takemoto, M. Reductions of PAH and Soot by Center Air Injection. Environments 2014, 1, 42-53. https://doi.org/10.3390/environments1010042
AMA Style
Yamamoto K, Takemoto M. Reductions of PAH and Soot by Center Air Injection. Environments. 2014; 1(1):42-53. https://doi.org/10.3390/environments1010042
Chicago/Turabian StyleYamamoto, Kazuhiro, and Masahiro Takemoto. 2014. "Reductions of PAH and Soot by Center Air Injection" Environments 1, no. 1: 42-53. https://doi.org/10.3390/environments1010042