
Effect of Signal Design of Autonomous Vehicle Intention Presentation on Pedestrians’ Cognition
1
The Department of Industrial Design, Tatung University, Taipei 104, Taiwan
2
The Graduate Institute of Design Science, Tatung University, Taipei 104, Taiwan
3
Bareiss Taiwan Technology Co., Ltd., 28F.-5, No. 93, Sec. 1, Xintai 5th Rd., Xizhi Dist., New Taipei City 22175, Taiwan
*
Author to whom correspondence should be addressed.
Behav. Sci. 2022, 12(12), 502; https://doi.org/10.3390/bs12120502
Submission received: 30 October 2022
/
Revised: 27 November 2022
/
Accepted: 6 December 2022
/
Published: 8 December 2022
(This article belongs to the Special Issue Road Crash Injury and Driver Behavior)
Abstract
:In this study, a method is devised that allows the intentions of autonomous vehicles to be effectively communicated to pedestrians and passengers via an efficient interactive interface. Visual and auditory factors are used as variables to investigate the effects of different autonomous vehicle signal factors on the judgment of pedestrians and to determine the main factors such that the best combination can be proposed. Two visual dimensions (i.e., color and flashing) and three auditory dimensions (i.e., rhythm, frequency, and melody) are used as the experimental signal variables. In addition, deceleration and waiting-to-restart scenarios are investigated. Multiple-choice questions and a subjective cognition scale are used for evaluation. The results show that the combination of green and slow rhythm can be used for the road-user-first case, whereas the combination of red and fast rhythm can be used for the vehicle-first case. Under the same intention, factors of color, flashing, rhythm, and melody are highly similar in terms of the combination mode, except for the frequency. In the deceleration and waiting-to-restart scenarios, the frequencies of the best signal are high and low frequencies, respectively. The results of this study can be used as a reference for the signal design of autonomous vehicles in the future and provide ideas for the interactions between autonomous vehicles and pedestrians.
1. Introduction
Autonomous driving will become one of the mainstream modes of transportation in the future. Consequently, potential traffic safety issues associated with autonomous driving have received significant attention. Some researchers argue that introducing autonomous driving to vehicles may reduce the overall frequency and severity of crashes and personal injuries [1]. However, if misunderstanding occurs in the communication between autonomous vehicles and pedestrians, then undesirable consequences are inevitable [2]. Currently, drivers typically communicate their driving intentions to pedestrians via signals from the vehicle, eye contact, gestures, etc. [3,4,5,6,7]. These communication methods (facial expression, eye contact, gesture, vehicle movement, and the sound from the vehicle) allow pedestrians to clearly understand the intentions of car drivers and to be aware of upcoming vehicles [8,9,10,11,12]. While crossing a road, pedestrians can assess whether they can safely cross an intersection based on the speed and acceleration of vehicles as well as the distance between the vehicles and themselves [13,14]. However, unlike humans, autonomous vehicles have not yet developed the capability to communicate with pedestrians through using and interpreting implicit and explicit communication signals [15]. Furthermore, autonomous vehicles cannot accurately simulate the typical human–vehicle interactions, such as gestures and eye contact [2]. Therefore, traffic accidents and serious injuries may occur when the signals provided by autonomous vehicles to pedestrians and other vehicles are ambiguous. To ensure the safety and acceptance of autonomous vehicles and the trust of other pedestrians, communication strategies between autonomous vehicles and other pedestrians must be developed [16]. These strategies must ensure that autonomous vehicles can interact and communicate with other pedestrians for safer driving. This task is particularly challenging for mixed traffic involving autonomous and manual vehicles [17]. In particular, considering the most recent development of autonomous vehicles, informing about “vehicle behavior” and “vehicle intention” without any direct interaction between the driver and the external environment is becoming increasingly more important [18]. When autonomous vehicles begin to extend from the original restricted areas to open roads with both pedestrians and vehicles, the conventional vehicle indicator light and other typical interaction methods must be adapted appropriately. Researchers have investigated the effect of the intention transmission of autonomous driving from the visual level via lighting, light-emitting diodes (LEDs), or projections [2,14,15,19]. Additionally, researchers have focused on auditory feedback [14,19] and used additional devices [14] or humanoid robots [8] to assist in transmitting vehicle information. Pugliese, Brian J., et al. (2020) [20] reported that pedestrians rely primarily on visual signals to assess the safety risks when crossing a road, whereas they regard auditory signals as auxiliary information. However, a consensus regarding the optimal combination of light and sound for vehicle intention transmission has not been reached. Moreover, the factors of light and sound require further investigation. The optimal combination of light and sound that would result in the highest usability and is most consistent with the cognitive preferences of pedestrians is yet to be identified.
The purpose of this study is to investigate the signal design of autonomous driving based on different scenarios, such that important factors that affect cognition can be identified and a better design combination that is conducive to the cognition of pedestrians can be determined. The findings of this study will serve as a reference for future interactions between pedestrians and autonomous vehicles.
2. Literature Review
Unambiguous vehicle signals are key for resolving traffic ambiguity. Inadequate communication or communication errors are likely to cause traffic accidents [21,22,23], whereas unambiguous signals can inform pedestrians of the vehicle’s intentions or provide guidance signals for further action [24]. Research shows that more than a quarter of traffic accidents are caused by ineffective communication between pedestrians and drivers, particularly when pedestrians decide to cross a road and feel insecure owing to insufficient clear signals [25]. Additionally, gender difference among pedestrians is an important factor. Women generally appear to be more cautious than men and more likely to abide by traffic rules [26,27,28,29,30]. Thus, developing an interactive interface for a new traffic environment is difficult as it necessitates user friendliness with the least training. Moreover, the task time should be short and the high cognitive demand low [31]. In particular, when an accident risk is present, the new interactive interface should be easy to use and learn [32,33]. Additionally, users should be able to understand the information and react accordingly in different locations without further training and testing [34,35]
Currently, well-known research teams and automobile companies are investigating the intention communication signals of autonomous vehicles from different aspects. Klaus Bengler et al. (2020) [36] classified existing studies pertaining to external human–machine interfaces (eHMIs) into four categories: (1) classifying vehicles as “autonomous driving”; (2) implementing light strips based on light mode; (3) displaying text and icon information simultaneously; and (4) displaying information on roads via laser projection. Prior studies showed that pedestrians can understand the signals from LEDs in different orders on the top of the windshield of a vehicle after a brief training period, thus allowing communication between vehicles and pedestrians to be established. Signals from LED interfaces were used to replace eye contact between the driver and road user, thus providing a clearer and more prompt communication mode. However, without learning these functions in advance, pedestrians cannot understand the meaning and indications of the signals [37].
Mitsubishi used the direction of road lighting as an indicator. This indicator can project large and easily understood animation lighting on a road surface to indicate the intention of a vehicle, such as driving forward or backward [38]. Semcon installed a display screen in the front of a vehicle and performed smiling as an interface to interact with pedestrians to confirm that the vehicle would stop for them. Research showed that pedestrians felt comfortable crossing the road when such strategies were applied [39]. Additionally, researchers have evaluated the designs of various “walking” and “no walking” signs. The results showed that pedestrians were more likely to decide to cross a road based on certain reference indicators (e.g., the human–vehicle distance and the human–vehicle velocity difference) instead of the information displayed on external displays [15]. Based on the overall preferences of pedestrians, Métayer & Coeugnet (2021) [40] concluded that LED light strips and pictograms were the two most typically used eHMIs. Both were considered visible and easily understood.
Regarding the color of light, Zhang et al. (2017) [41] discovered that drivers of non-autonomous vehicles associate green with moving vehicles and red with decelerating or stopped vehicles. Furthermore, they associate forward lights with moving vehicles and reverse lights with decelerating or stopped vehicles. Bazilinsky et al. (2019) [42] reported that color imposed the most significant effect on users crossing a road (“walking” and “stop”). Pedestrians were the most convinced of the notion of “walking” being indicated by green signals. This feedback was primarily based on the understanding of signal lights by pedestrians [43]. In human–vehicle interactions, the front brake light of an autonomous vehicle should be green, which is similar to the reuse mode of front brake lights adopted by Declercq et al. (2019) [44] and Petzoldt et al. (2018) [19]. Mahadevan et al. (2017) [45] investigated various interaction modes, including audio, video, and animation. In the absence of a clear intention display mechanism, pedestrians decide whether to cross based on the speed and distance of vehicles. In terms of communication methods, pedestrians typically prefer LED sequence signals to liquid-crystal displays (LCDs) and other communication methods, such as auditory and physical prompts. Researchers have suggested the combination of vision, physics, and sound. Additionally, studies have shown that the location of information prompts is unrestricted, i.e., they can be on a vehicle or within a certain environment.
Shuchisnigdha et al. (2018) [46] designed new sound and visual signals for fully autonomous vehicles. Their experimental results showed that, in terms of vision, the silhouettes of words and walking were favored more by the participants than the dynamic display of a smile. In terms of sound, the participants were concerned that music and horn sounds would be interfered with by other sounds in a traffic environment; therefore, they preferred oral information. Merat et al. (2018) [47] discovered that pedestrians preferred light and sound to text and voice when interacting with autonomous vehicles, whereas Chang et al. (2018) [48] believed that the most accurate presentation method for autonomous vehicle information was text. Stadler et al. (2019) [49] and Othersen et al. (2018) [50] showed that the preferred human–vehicle communication was in the form of images. Meanwhile, some researchers suggested that in the future, autonomous vehicles would be able to communicate with pedestrians via social robots installed on the driver’s seat [8]. Other scholars suggested the use of wearable sensors by pedestrians, which will enable the transmission of various warning signals regarding vehicle intentions to other pedestrians [51] (Gordon et al., 2016).
Currently, the design and research of autonomous human–vehicle interactions are still in the development stages. Researchers have not yet determined the features in autonomous human–vehicle interactions that can achieve efficient, accurate, user-friendly communication. Furthermore, the effects of specific parameters of relevant factors have not been discussed adequately [52]. Most studies show that participants benefited significantly from the interactive interface during their interactions with autonomous vehicles. Therefore, the human–vehicle interaction interface and the specifications for autonomous vehicles must be standardized.
3. Experimental Design
Based on the characteristics of autonomous vehicles and pedestrians as well as the intention information of autonomous vehicles, we established the control factors of field and intention information required for our experiment. Researchers have extensively investigated vehicle information transmission using various methods during autonomous human–vehicle interactions. The results showed that the location of an additional interactive interface implemented did not impose significant effects. The LEDs of a vehicle can be combined with sound, and different fields can be combined with different autonomous vehicle intentions. In this study, we presented information to participants in the form of films, based on which evaluations were conducted. Next, visual and auditory factors were verified and analyzed. The effects of relevant signal design factors on vehicle intention transmission are discussed. We aim to provide answers to the following questions:
Q1: What are the effects of different combinations of light color and sound of vehicles on the transmission of autonomous driving intentions?
Q2: What is the information combination mode that is the most accepted and understood by pedestrians with different vehicle states and vehicle intentions?
3.1. Experimental Sample Setting
The purpose of this study is to determine the relevant factors of human–vehicle interactions and investigate the acceptance of autonomous driving interaction design by pedestrians. To ensure a safe experiment, we performed some tests in advance based on videos [37,48]. A report by the Automotive Research and Test Center stated that LEDs/OLEDs are the current main sources of vehicle light and that they offer rapid operation responses and high luminous efficiency. Furthermore, they provide plasticity and color rendering [53]. Most pedestrians believe that green lights signal an invitation for them to cross a road, whereas red is associated with a warning to stop. In human cognition, red is typically related to “excitement” and “stimulation”, whereas blue and green are related to “safety/comfort” and “gentleness/relaxation”, respectively. The specific design, presentation, and feedback pertaining to the conveyance of vehicle information via light color to pedestrians are yet to be investigated [54]. Traffic signs are designed with red and green lights. The wavelength of red light is longer, and its capability to penetrate air is stronger. Thus, it is more attractive than other colors. Green is used as a contrasting color as it can be easily distinguished from red. Therefore, “red” and “green” were used as visual variables in our experiment. In addition to color, the flashing of light presents certain connotations and inherent meaning in the traffic environment [54]. Flashing can rapidly attract people’s attention [55]. Flashing and flashing modes have been widely used to transmit signals or indicate steering intentions. Flashing headlights are a clear communication tool typically used by drivers when negotiating with pedestrians [54]. Uniform animation (flash and pulse) is more visual and conspicuous than scanning animation (inward scanning, outward scanning, or double scanning) [55].
In terms of sound interaction, researchers have discussed the music, beeping sound, and oral information of “safe crossing” [19]. The psychoacoustic characteristics of sound (rhythm, pitch, and volume) affect people’s psychological perception [56,57,58,59,60]. Similarly, the recognition of approaching objects by people is related to different sound cues [61]. Therefore, sound elements of rhythm, frequency, and melody were used as auditory variables in the current experiment. Single or continuous tone was set for “melody”. The current flashing cycle of traffic signs for pedestrians and car warning lights were set for “rhythm”; two versions of sound rhythm were designed, i.e., fast and slow. The slow version was 0.8 s per time (based on the cycle of traffic signs for pedestrians), and the fast version was 0.5 s per time (which is the fastest cycle of car warning flashing lights). In terms of “frequency”, the original frequency of 500 Hz was changed to 880 Hz to ensure that the sound remained audible in ambient noise [62]. In addition, we found that using a higher frequency (1000 Hz) or a super-high frequency (3000 Hz) can improve the detection rate of sound [63]. Therefore, the sound frequencies used in this study were set to two types, i.e., low and high, whose ranges were 500–880 and 1000–3000 Hz.
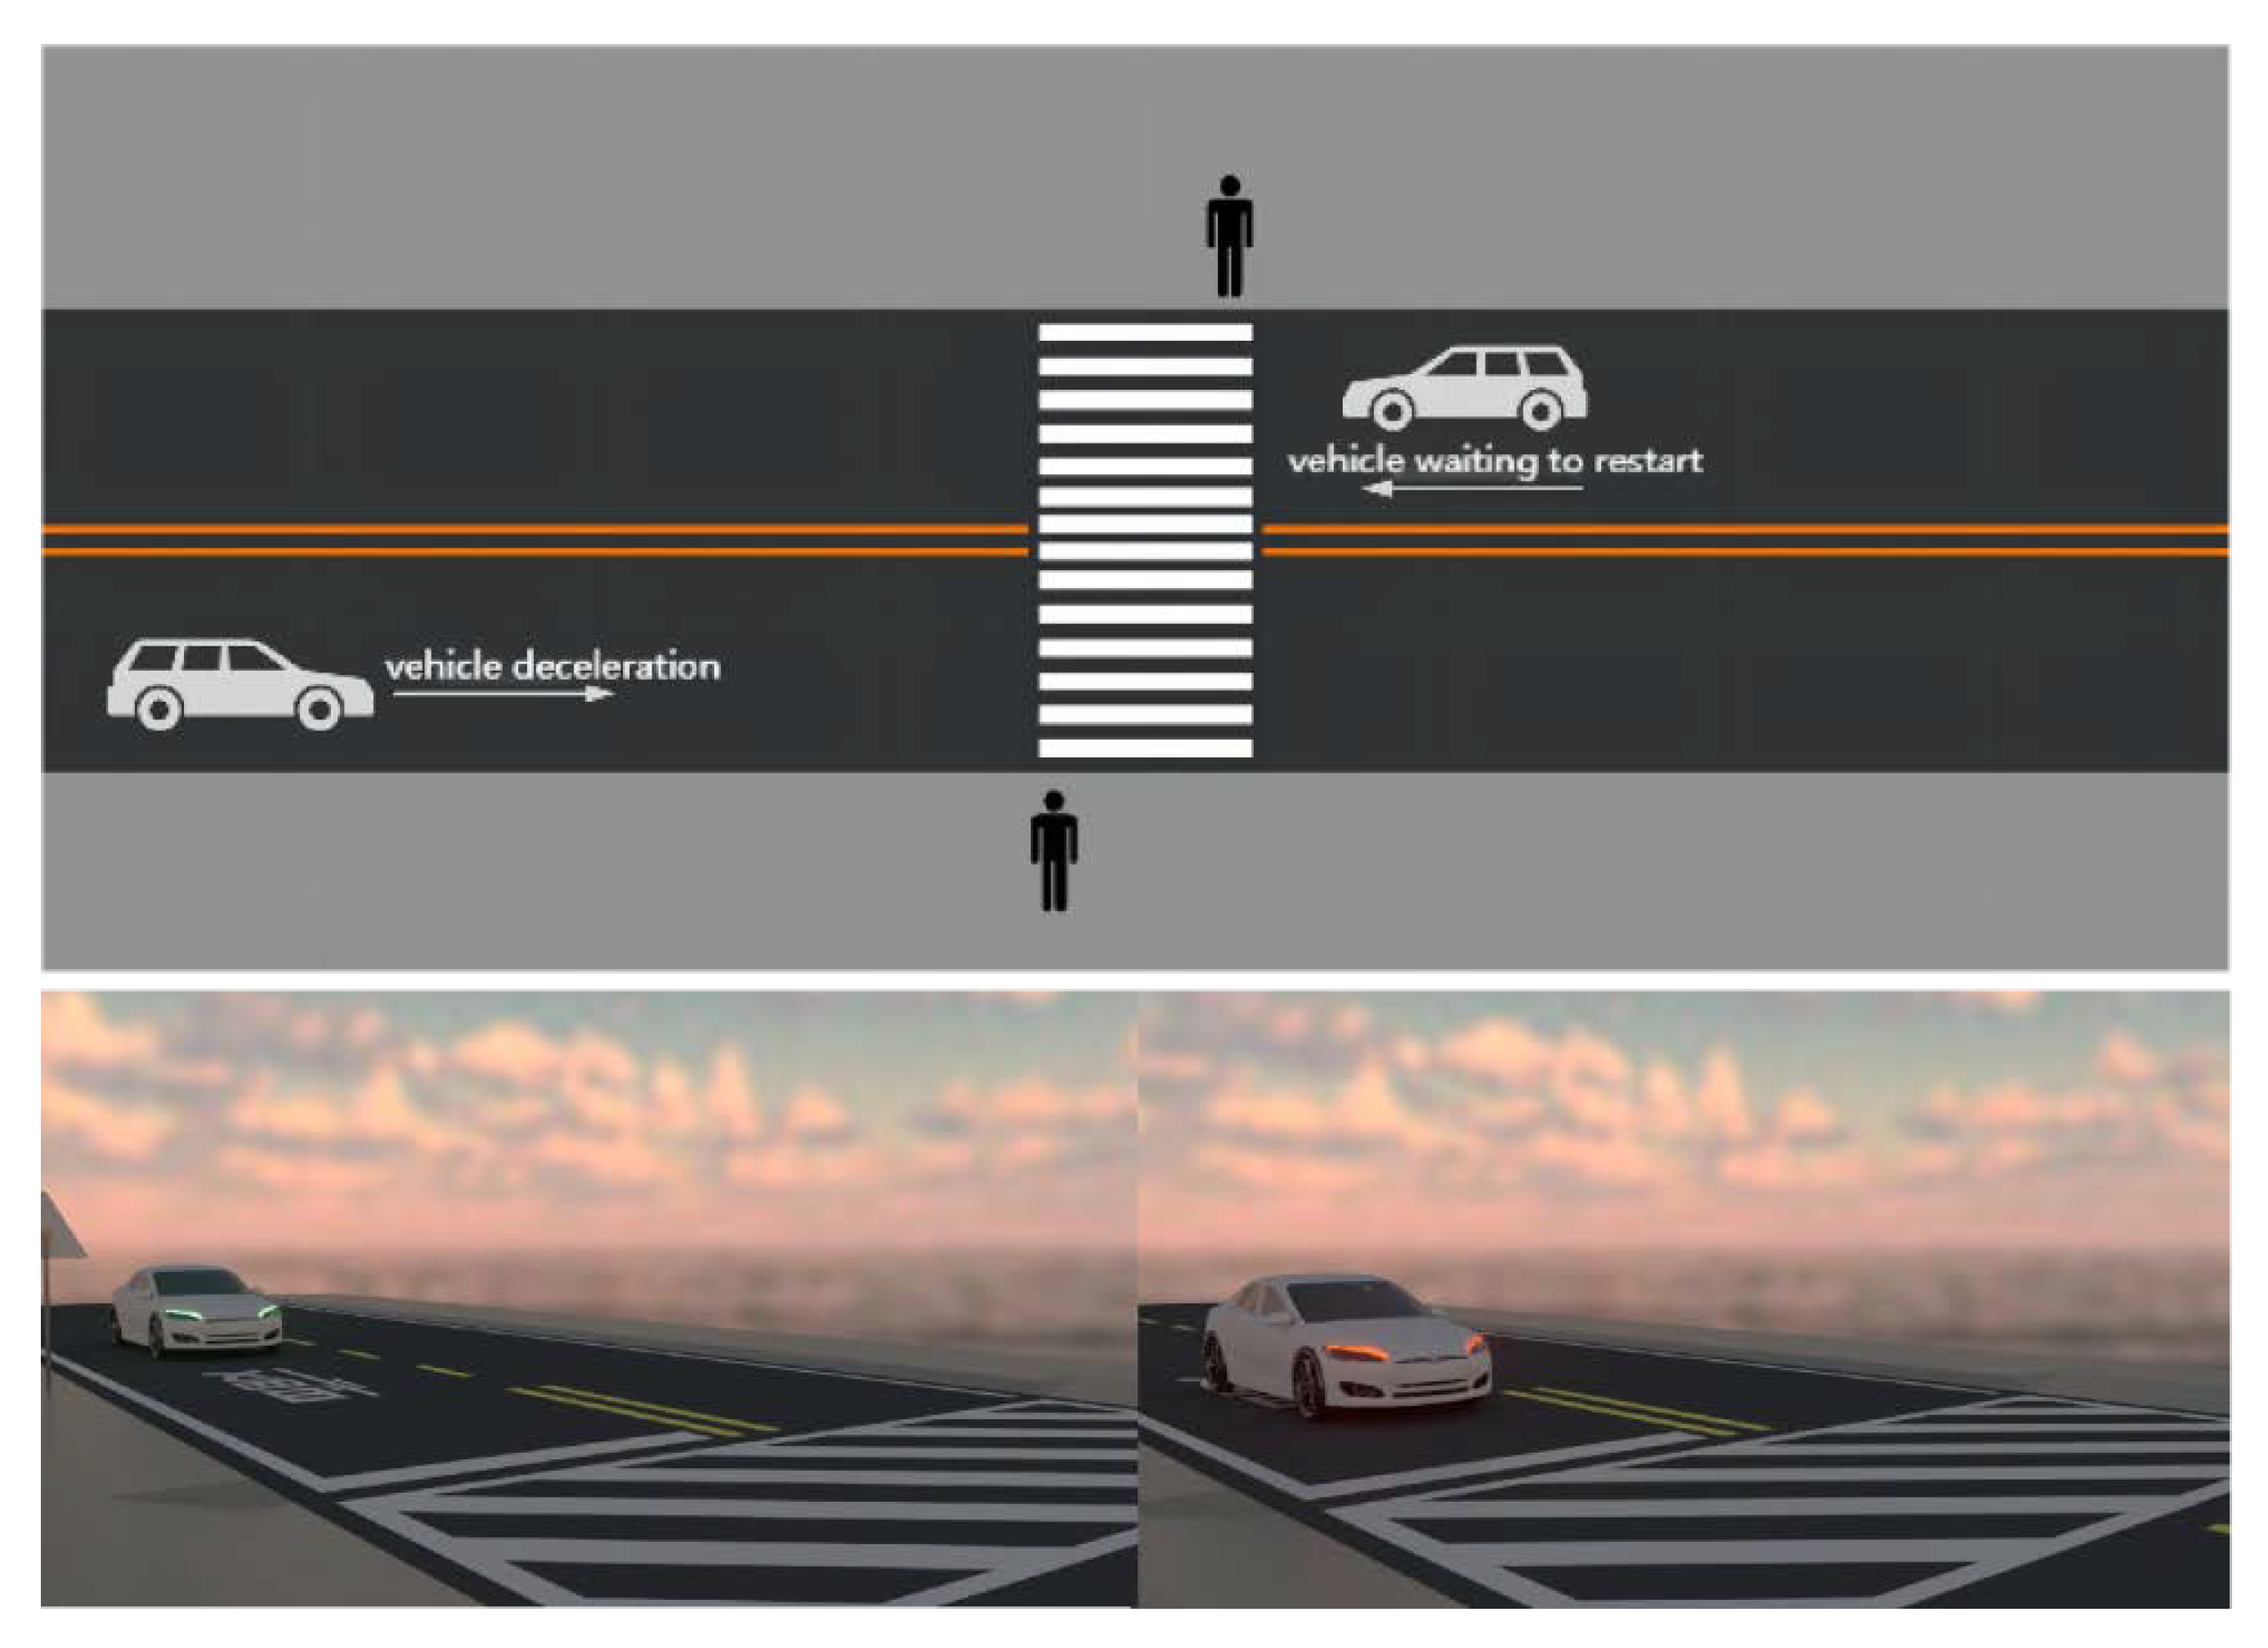
In the experiment, the scene in the film was set as a vehicle traversing straight in the evening. Two scenarios were investigated, i.e., vehicle deceleration and vehicle waiting to restart. The road featured two-way lanes, zebra crossings, and road user signs. The setting was determined primarily based on the fact that vehicles traversing straight are one of the most typical collision scenarios [64]. Elue et al. (2008) [65] found that pedestrians and vehicles are more likely to have a collision probability during evening or twilight. Therefore, the scene of this study was set at nightfall. The main design parameter was the light brightness in the video, and clouds have no influence on the light brightness. To create a more realistic environment, noise from the road environment was added to the scene in the animated film used in the experiment. Yamauchi et al.’s (2014) [66] study claimed that warning sounds had to be 2–3 dB higher than ambient noise to be detected. Therefore, the sound in the film was adjusted to be 3 dB higher than the ambient noise. This method can ensure the sound detectability for the participants, because the variable of the sound will always be 3 dB higher than the ambient noise. According to the U.K. Department of Transportation (1987), when a vehicle is traversing at 40 mph, the probability of death of pedestrians is 85%. Therefore, the vehicle speed in the video was set to 40 mph. The braking reaction distance was 30 to 35 m, and the reaction time of pedestrians was 2–3 s. The scene design of the animated film is shown in Figure 1.
Based on the shape of existing vehicles, we set the visual variables used in this experiment based on the original signals (light signals). The first visual variable was the light representation, and the second visual variable was the light color. In this experiment, the sound elements (rhythm, frequency, and melody) were regarded as auditory variables. Each of the three elements comprised two variables. “Melody” was classified into single tone and continuous tone. In terms of “rhythm”, the slow version featured 0.8 s per time (the traffic sign cycle of pedestrians), and the fast version featured 0.5 s per time (the fastest cycle of car warning flashing lights). Meanwhile, “frequency” was classified into low and high frequencies, whose ranges were 500–880 and 1000–3000 Hz, respectively. The sound samples were downloaded from the websites of SOUND JAY and freeSFX. The rhythms and frequencies of the sound were edited using Audacity. The specific combinations of variables used are listed in Table 1.
3.2. Experimental Procedure
To investigate the key factors in the interaction between autonomous vehicles and pedestrians, we set the headlight color, flashing mode, and sound elements (rhythm, frequency, and melody) of autonomous vehicles as the control variables in the experiment. We used 32 films set for each scenario (the deceleration and waiting-to-restart scenarios), which comprised 64 films. This experiment was conducted in a quiet multimedia lab. The equipment was an Apple MacBook Pro featuring a 16-inch screen and Retina display with a six-speaker sound system and studio-grade microphone. To ensure participants could clearly identify and distinguish the visual and auditory variables in the experiment, they were required to watch the video at a reasonable and comfortable distance. The participant was required to complete the intention judgment 4 s before the film ended. After completing a scenario test, each participant was allowed to rest for 30–60 min before performing another scenario test. To avoid the learning effect between two different scenarios and films, each participant was instructed to conduct two scenario tests with different film starting sequences. After watching each film, the participants were required to select their intention and provide answers to subjective cognitive assessment questionnaires. We investigated the intention selections of each participant for each film based on three options: road user first, vehicle first, and unclear. In particular, the intention judgments by pedestrians were investigated based on their intuitive cognition. Therefore, no correct answer was set for the signal content. The signal intention was determined based on the participants’ judgment. Subsequently, subjective cognitive perception was measured. The items of the questionnaire, i.e., signal usability, signal usefulness, and signal satisfaction, were designed based on the technology acceptance model and the satisfaction degree. Each item was evaluated using the Likert five-point scale. After the questionnaire was completed, a short interview was conducted to understand the feelings and opinions of the participants who watched the film. The scoring items were as follows: The perceptual usability of autonomous vehicle signals was used to evaluate whether the combination of autonomous vehicle signals can be understood easily by pedestrians to determine the vehicle’s intentions. The perceptual usefulness of autonomous vehicle signals was used to evaluate whether the combination of autonomous vehicle signals rendered it safer and more efficient for pedestrians to cross a road. The satisfaction of autonomous vehicle signals was used to evaluate the willingness to use the combination of autonomous vehicle signals for signal transmission.
4. Results and Discussion
The independent variables of intention judgment are a combination of five signals, i.e., the color of autonomous vehicle lights, flashing mode, sound rhythm, sound frequency, and sound melody. Two scenarios were investigated, i.e., deceleration and waiting-to-restart scenarios. Each scenario featured 32 signal judgment selections. In total, 35 participants participated in the experiment, and their basic information is shown in Table 2. Participants’ gender, age, and driving experience are at a reasonably level distribution, and they have no color blindness and could clearly watch the experimental video. Thus, the participants are representative of a larger population.
4.1. Reliability Analysis of Questionnaire
The answer selected for signal intention judgment was a discontinuous score. The internal consistency reliability was used to test the reliability of the results of the intention questionnaires based on two scenarios. Calculation results show that the Cronbach’s α values of the deceleration and waiting-to-restart scenarios were 0.808 and 0.802, respectively, which indicates high reliability for the subsequent Pearson’s chi-square test. In the test of goodness-of-fit, in the deceleration scenario df = 2, p < 0.001, in the waiting-to-restart scenario df = 2, p < 0.001, and the expected frequency <5 is 0.0%, indicating that the verification has reached the basic hypothesis of a sufficient sample number. This result indicates that it has reached a sufficient sample number. The subjective evaluation questionnaire was evaluated based on the Likert five-point scale. The Cronbach’s α values of the deceleration and waiting-to-restart scenarios were calculated to be 0.847 and 0.818, respectively, which indicates high reliability for the subsequent multivariate analysis. Through the test of descriptive statistics, it can be found that the skewness and kurtosis values of usability, usefulness, and satisfaction range from 1 to −1, which means the data conform to normal distribution.
4.2. Analysis Results of Vehicle Deceleration Scenario
The judgment results of vehicle intention are presented in this section. Based on the ISOTC145/SCI public information symbol design program, the recognition accuracy of a standard image symbol should exceed 67% for mass communication. Therefore, the questionnaires were listed based on the percentage (from high to low) of “road-user first” and “vehicles first”, and 67% was specified as the delineating percentage, as shown in Table 3.
To investigate the factors that affect the judgment of pedestrians in the deceleration scenario, we analyzed the intention options. The chi-square test was performed to test the significance of each factor, and the results show in Table 4 that the flashing mode, sound frequency, and melody did not significantly affect the deceleration scenario. The intention indicated horizontal significance for color (chi = 12.000, p = 0.002). Based on the percentage difference, the percentage of “road-user first” selecting green was 100%, and the percentage of “vehicle first” selecting red was 100.00%. The intention was significant for rhythm (chi = 8.867, p = 0.012). Based on the percentage difference, the percentage of “road-user first” selecting slow rhythm was 83.33%, and the percentage of “vehicle first” selecting fast rhythm was 100.00%.
The results of multivariate analysis of variance (MANOVA) for the subjective cognitive assessment based on the deceleration scenario are summarized in Table 5. As shown, color, flashing, and melody imposed significant effects, and the combinations of color × rhythm, color × melody, color × flashing × rhythm × melody exerted significant interaction effects.
The effect verification of the combinations is shown in Table 6. As shown, color, color × rhythm, and color × melody significantly affected usability; color, flashing, color × rhythm, and color × melody significantly affected usefulness; and color, flashing, melody, color × rhythm, and color × melody significantly affected satisfaction.
Next, the simple main effect results of items with two-factor interactions are summarized in Table 7. In terms of usability, the averages of green × slow rhythm, red × fast rhythm, and red × single tone were higher than those of other combinations. In terms of usefulness, the averages of green × slow rhythm, red × fast rhythm, and red × single tone were higher than those of other combinations. In terms of satisfaction, the averages of red × fast rhythm and red × single tone were higher than those of other combinations.
Based on the deceleration scenario, factors without two-factor interactions were organized. The descriptive statistical averages are shown in Table 8. The averages of flashing and high frequency in the categories of usability, usefulness, and satisfaction were greater than those of other factors.
Based on the results above, the recommended parameter combinations of the signal factors corresponding to “road-user first” and “vehicle first” in the deceleration scenario are discussed next. Color significantly affected intention discrimination and subjective cognitive assessment. In terms of intention, the percentage of “road-user first” selecting green was 100%, and the percentage of “vehicle first” selecting red was 100.00%. The flashing mode showed no significance in intention discrimination but indicated significance in subjective usefulness and satisfaction. As flashing did not impose a two-factor interaction effect, flashing was selected based on the average value. Most of the participants mentioned that when they noticed the flashing signal of autonomous vehicles, they were able to promptly discern that they were detected by the vehicle system. The constant lighting caused the participants to form incorrect assumptions regarding the light or headlights of the vehicle. Therefore, using the flashing mode in autonomous vehicles for both “road-user first” and “vehicle first” in the deceleration scenario is considered reasonable. Rhythm showed significance in terms of both intention discrimination and subjective satisfaction. In the deceleration scenario, the percentages of pedestrians first selecting slow and fast rhythms were 83.33% and 100.00%, respectively. Based on the two-factor interaction, the signal combination of color and rhythm indicated interaction. The recommended combinations were green * slow rhythm and red * fast rhythm, which were the same as the intention judgment results. The participants mentioned that when they heard a signal with a fast rhythm, the intention of “vehicle first” was clear, whereas they required more time to decipher the intention of a signal with a slow rhythm. Frequency showed no significance in terms of either intention discrimination or subjective satisfaction and indicated no interaction with other factors. High frequencies indicated significance in subjective cognition. In the deceleration scenario, high-frequency signals were more prevalent than low-frequency signals. Melody showed no significance in intention discrimination but indicated significance in subjective satisfaction. Based on the two-factor interaction, the signal combination of color and melody indicated interaction, and the recommended combination was red * single tone. When the melody was assessed based on the intention, the number of “road-user first” was the same for both continuous and single tones. To distinguish “road-user first” from “vehicle first,” the melody was set to a continuous tone.
Based on the results above, the combination of variables conforming to the signal recommendation scheme is shown in Table 9.
4.3. Analysis Results of Waiting-to-Restart Scenario
After the questionnaire results for the waiting-to-restart scenario were organized, they were ranked based on the statistical percentage of the signal intention answers. The results shown in Table 10 are based on 67% as the benchmark.
Pearson chi-square test results for waiting-to-restart scenario are shown in Table 11, the flashing mode, sound frequency, and melody were not significant, whereas the color was significant (chi = 8.167, p = 0.017). Based on the percentage difference, the percentage of “road-user first” selecting green was 100.00%, and the percentage of “vehicle first” selecting red was 100.00%, which was significantly higher than the average level of 50.00%. In the waiting-to-restart scenario, rhythm showed horizontal significance (chi = 8.167, p = 0.017). Based on the percentage difference, the percentage of “road-user first” selecting slow rhythm was 100.00%, and the percentage of “vehicle first” selecting fast rhythm was 100.00%.
The results of MANOVA for the subjective cognitive assessment in the waiting-to-restart scenario are summarized in Table 12. Flashing showed significance, and color * rhythm indicated a significant interaction effect.
The effect verification of the combinations is shown in Table 13. As is shown, flashing and color × rhythm significantly affected usability, usefulness, and satisfaction.
Next, the simple main effect verification results of items with two-factor interactions are summarized in Table 14. In terms of usability, the averages of green × slow rhythm and red × fast rhythm were higher than those of other combinations. In terms of usefulness and satisfaction, the average of red * fast rhythm was higher than those of other combinations.
Factors without two-factor interactions were organized for the waiting-to-restart scenario. The descriptive statistical averages are shown in Table 15. The averages of flashing, low frequency, and single tone in the usability, usefulness, and satisfaction categories were greater than those of other factors.
Based on to the results above, the recommended parameter combinations of the signal factors corresponding to “road-user first” and “vehicle first” in the waiting-to-restart scenario are discussed next. Color significantly affected the intention discrimination. The percentage of “road-user first” selecting green was 100%, and the percentage of “vehicle first” selecting red was 100.00%, which was the same as the results of the deceleration scenario. Most participants mentioned that in the waiting-to-restart scenario, as the autonomous vehicle was stopped, they would assume that the vehicle would yield to the pedestrians. The signal intention presented by the green light further confirmed the “road-user first” intention. When the red light was signaled, the pedestrians were uncertain about the intention conveyed by the signal. Therefore, the judgment of intention was delayed. The flashing mode showed no significance in intention discrimination but indicated significance in subjective cognitive assessment. Since flashing did not impose a two-factor interaction effect, it was selected based on the average value. Rhythm showed significance in intention discrimination. In the waiting-to-restart scenario, the percentage of “road-user first” selecting slow rhythm was 100%, and the percentage of “vehicle first” selecting fast rhythm was 100.00%. Based on the two-factor interaction, the signal combination of color and rhythm indicated interaction. The recommended combinations were green * slow rhythm and red * fast rhythm, which were the same as the intention judgment results. Frequency showed no significance in terms of either intention discrimination or subjective satisfaction and indicated no interaction with other factors. The low frequency was selected based on the average value. The participants mentioned that they preferred the low-frequency sound signal when the vehicle was near them. Melody showed no significance in terms of either intention discrimination or subjective satisfaction and indicated no interaction with other factors. The single tone was selected based on the average value. The recommended combination was reorganized based on the deceleration scenario, and the recommended melody was a continuous tone with the intention of “road-user first”.
Based on the results above, the combination of variables conforming to the signal recommendation scheme is shown in Table 16.
5. Conclusions
Owing to the gradual increase in commercialization and marketization, autonomous vehicles have become the future development trend. In this regard, traffic safety is the primary problem to be solved. The interactions between autonomous vehicles and pedestrians must be analyzed and discussed comprehensively. Lights and sound are the main human–vehicle interaction sources. In this study, the different colors and presentation methods of existing lights as well as the rhythm, frequency, and melody of sound were investigated. The results showed that, for different driving motivations, in the deceleration and waiting-to-restart scenarios, light color and sound rhythm were the main factors affecting the road user’s interpretation of intentions. For “road-user first”, green and slow rhythm were selected, and for “vehicles first”, red and fast rhythm were selected. In addition, the results of the subjective cognitive assessment revealed that, among all factors, flashing showed significance in terms of both the deceleration and waiting-to-restart scenarios. As such, flashing was used as the best signal in both scenarios. A comparison between the best signal combinations for the deceleration and waiting-to-restart scenarios showed that except for the frequency, the color, flashing mode, rhythm, and melody were highly similar to those for the same intention judgment. In the deceleration and waiting-to-restart scenarios, the best signals featured high and low frequencies, respectively. The overall results showed that the visual factor was superior to the auditory factor in the deceleration scenario, whereas the visual and auditory factors offered the same advantages in the waiting-to-restart scenario.
The effects of different autonomous vehicle signal factors on the cognition of pedestrians were discussed herein. Based on the different situations encountered by autonomous vehicles, we obtained the best signal combinations of different factors via experiment. In this study, the scene of the video was set in the evening on a road where vehicles were going straight and pedestrians were crossing the road without the aid of traffic lights. This situation makes it difficult for pedestrians to judge whether they should pass, which made the scene prone to collision. By studying pedestrians’ cognitive judgment of self-driving cars’ signals in this situation, the optimal signal combination can be obtained and applied to most general road scenarios. The experiment in this study is reproducible. The independent variables include two visual variables (color and status) and three sound variables (melody, rhythm, and frequency). The design of experimental variables is comprehensive; thus, the proposed design of the signal sets has good credibility and feasibility. With the increasing use of autonomous vehicles, the research can be more applicable for designing the signals for pedestrian and self-driving cars as a reference for future research.
To account for safety, we used animated films to present the scenarios. Therefore, the participants were not instructed to perform a safety risk assessment, which is necessary in the actual situation. As such, the participants’ responses and cognitive evaluations might be affected. Due to the use of video simulation, the study did not consider the distance between vehicles and pedestrians, and differences of the close-distance signal. The purpose of our research is mainly focused on pedestrians’ cognitive judgment of self-driving cars’ signals, which emphasizes the understanding of these signals. The state of these signals can be clearly reflected through the image simulation. The experimental videos can be watched and distinguished by the participants to make further judgments. It is feasible to study the communication intentions between pedestrians and self-driving cars, and the results can be similar to real situations. Based on our experimental findings, VR and other technologies can be used to further investigate and analyze the color and rhythm of autonomous vehicles’ signals, which primarily affect the cognitive judgment of pedestrians on signal intentions. Future autonomous vehicle signal designs are expected to improve the safety and efficiency of users crossing roads.
Author Contributions
Data curation, S.-H.L.; formal analysis, D.-D.X. and W.-C.C.; investigation, D.-D.X., S.-H.L., and W.-C.C.; visualization and resources, S.-H.L.; project administration, C.-F.W.; supervision, C.-F.W.; writing—original draft, D.-D.X.; writing—review & editing, C.-F.W. and D.-D.X. All authors have read and agreed to the published version of the manuscript.
Funding
This study was financially supported by MOST 111-2221-E-036-004-MY3.
Institutional Review Board Statement
This study was conducted according to the guidelines of the Declaration of Helsinki, and approved by the Research Ethics Committee of National Taiwan University (protocol code 202206EM051).
Informed Consent Statement
Informed consent was obtained from all subjects involved in the study.
Data Availability Statement
The data presented in this study are available on request from the corresponding author. The data are not publicly available due to the relevant data involving the internal information of the institution and personal information, and there being a need for confidentiality.
Conflicts of Interest
The authors declare no conflict of interest.
References
- National Highway Traffic Safety Administration. Automated Driving Systems: A Vision for Safety; DOT HS 812; US Department of Transportation: Washington, DC, USA, 2017; p. 442. Available online: https://www.nhtsa.gov/sites/nhtsa.gov/files/documents/13069a-ads2.0_090617_v9a_tag.pdf (accessed on 30 August 2016).
- Fridman, L.; Mehler, B.; Xia, L.; Yang, Y.; Facusse, L.Y.; Reimer, B. To Walk or Not to Walk: Crowdsourced Assessment of External Vehicle-to-Pedestrian Displays. arXiv 2017, arXiv:1707.02698. [Google Scholar] [CrossRef]
- LaFrance, A. Will Pedestrians Be Able to Tell What a Driverless Car Is About to Do? The Atlantic, 30 August 2016. Available online: https://www.theatlantic.com/technology/archive/2016/08/designing-a-driverlesscar-with-pedestrians-in-mind/497801/ (accessed on 30 August 2016).
- Charisi, V.; Habibovic, A.; Andersson, J.; Li, J.; Evers, V. Children’s views on identification and intention communication of self-driving vehicles. In Proceedings of the 2017 Conference on Interaction Design and Children, Stanford, CA, USA, 27–30 June 2017; pp. 399–404. [Google Scholar] [CrossRef]
- Šucha, M. Road users’strategies and communication: Driver-pedestrian interaction. In Proceedings of the Transport Research Arena (TRA), Paris, France, 14–17 April 2014. Available online: https://trid.trb.org/view/1327765. (accessed on 30 August 2016).
- Llorca, D.F.; Milanés, V.; Alonso, I.P.; Gavilán, M.; Daza, I.G.; Pérez, J.; Sotelo, M.Á. Autonomous pedestrian collision avoidance using a fuzzy steering controller. IEEE Trans. Intell. Transp. Syst. 2011, 12, 390–401. [Google Scholar] [CrossRef] [Green Version]
- Mirnig, N.; Perterer, N.; Stollnberger, G.; Tscheligi, M. Three strategies for autonomous car-to-pedestrian communication: A survival guide. In Proceedings of the Companion of the 2017 ACM/IEEE International Conference on Human-Robot Interaction, Vienna, Austria, 6–9 March 2017; p. 209. [Google Scholar] [CrossRef]
- Guéguen, N.; Meineri, S.; Eyssartier, C. A pedestrian’s stare and drivers’ stopping behavior: A field experiment at the pedestrian crossing. Saf. Sci. 2015, 75, 87–89. [Google Scholar] [CrossRef]
- Hamlet, C.C.; Axelrod, S.; Kuerschner, S. Eye contact as an antecedent to compliant behavior. J. Appl. Behav. Anal. 1984, 17, 553–557. [Google Scholar] [CrossRef] [Green Version]
- Ren, Z.; Jiang, X.; Wang, W. Analysis of the influence of pedestrians’ eye contact on drivers’ comfort boundary during the crossing conflict. Procedia Eng. 2016, 137, 399–406. [Google Scholar] [CrossRef] [Green Version]
- Schmidt, S.; Faerber, B. Pedestrians at the kerb–Recognising the action intentions of humans. Transp. Res. Part F Traffic Psychol. Behav. 2009, 12, 300–310. [Google Scholar] [CrossRef]
- Šucha, M. Sensation seeking v psychologické diagnostice řidičů. Psychologie pro praxi 2015, 48, 71–78. Available online: https://karolinum.cz/casopis/psychologie-pro-praxi/rocnik-48/cislo-3/clanek-971 (accessed on 17 February 2015).
- Mahadevan, K.; Somanath, S.; Sharlin, E. “Fight-or-Flight”: Leveraging Instinctive Human Defensive Behaviors for Safe Human-Robot Interaction. In Proceedings of the 2018 ACM/IEEE International Conference, Chicago, IL, USA, 5–8 March 2018. [Google Scholar] [CrossRef]
- Clamann, M.; Aubert, M.; Cummings, M.L. Evaluation of vehicle-topedestrian communication displays for autonomous vehicles. In Proceedings of the Transportation Research Board 96th Annual Meeting, Washington, DC, USA, 8–12 January 2017; p. 17. [Google Scholar]
- Stanciu, S.C.; Eby, D.W.; Molnar, L.J.; St. Louis, R.M.; Zanier, N.; Kostyniuk, L.P. Pedestrians/bicyclists and autonomous vehicles: How will they communicate? Transp. Res. Rec. 2018, 2672, 58–66. [Google Scholar] [CrossRef]
- Habibovic, A.; Lundgren, V.M.; Andersson, J.; Klingegård, M.; Lagström, T.; Sirkka, A.; Larsson, P. Communicating intent of automated vehicles to pedestrians. Front. Psychol. 2018, 9, 1336. [Google Scholar] [CrossRef]
- Fuest, T.; Sorokin, L.; Bellem, H.; Bengler, K. Taxonomy of traffic situations for the interaction between automated vehicles and human road users. In Advances in Human Aspects of Transportation; Springer: Cham, Switzerland, 2017; pp. 708–719. [Google Scholar]
- Petzoldt, T.; Schleinitz, K.; Banse, R. Potential safety effects of a frontal brake light for motor vehicles. IET Intell. Transp. Syst. 2018, 12, 449–453. [Google Scholar] [CrossRef]
- Deb, S.; Warner, B.; Poudel, S.; Bhandari, S. Identification of external design preferences in autonomous vehicles. In Proceedings of the 2016 Industrial and Systems Engineering Research Conference, Anaheim, CA, USA, 21–24 May 2016; Available online: https://www.researchgate.net/publication/297019875_Identification_of_External_Design_Preferences_in_Autonomous_Vehicles (accessed on 22 May 2016).
- Pugliese, B.J.; Barton, B.K.; Davis, S.J.; Lopez, G. Assessing pedestrian safety across modalities via a simulated vehicle time-to-arrival task. Accid. Anal. Prev. 2020, 134, 105344. [Google Scholar] [CrossRef] [PubMed]
- Wilde, G.J.S. Immediate and delayed social interaction in road user behaviour. Appl. Psychol. 1980, 29, 439–460. [Google Scholar] [CrossRef]
- Clay, D. Driver Attitude and Attribution: Implications for Accident Prevention. Ph.D. Thesis, Cranfield University, Cranfield, UK, 1995. Available online: http://hdl.handle.net/1826/3239. (accessed on 30 August 2016).
- Sucha, M.; Dostal, D.; Risser, R. Pedestrian-driver communication and decision strategies at marked crossings. Accid. Anal. Prev. 2017, 102, 41–50. [Google Scholar] [CrossRef] [PubMed] [Green Version]
- Rasouli, A.; Tsotsos, J.K. Autonomous vehicles that interact with pedestrians: A survey of theory and practice. IEEE Trans. Intell. Transp. Syst. 2019, 21, 900–918. [Google Scholar] [CrossRef] [Green Version]
- Risto, M.; Emmenegger, C.; Vinkhuyzen, E.; Cefkin, M.; Hollan, J. Human-vehicle interfaces: The power of vehicle movement gestures in human road user coordination. In Proceedings of the Driving Assessment Conference, Manchester Village, Vermont, 26–29 June 2017; pp. 186–192. [Google Scholar] [CrossRef] [Green Version]
- Heimstra, N.W.; Nichols, J.; Martin, G. An experimental methodology for analysis of child pedestrian behavior. Pediatrics 1969, 44, 832–838. [Google Scholar] [CrossRef]
- Holland, C.; Hill, R. The effect of age, gender and driver status on pedestrians’ intentions to cross the road in risky situations. Accid. Anal. Prev. 2007, 39, 224–237. [Google Scholar] [CrossRef]
- Moore, R.L. Pedestrian choice and judgment. J. Oper. Res. Soc. 1953, 4, 3–10. [Google Scholar] [CrossRef]
- Yagil, D. Beliefs, motives and situational factors related to pedestrians’ self-reported behavior at signal-controlled crossings. Transp. Res. Part F Traffic Psychol. Behav. 2000, 3, 1–13. [Google Scholar] [CrossRef]
- Tom, A.; Granié, M.-A. Gender differences in pedestrian rule compliance and visual search at signalized and unsignalized crossroads. Accid. Anal. Prev. 2011, 43, 1794–1801. [Google Scholar] [CrossRef] [Green Version]
- Issa, T.; Isaias, P. Usability and human computer interaction (HCI). In Sustainable Design; Springer: London, UK, 2015; pp. 19–36. [Google Scholar] [CrossRef]
- Chen, J.Y.; Haas, E.C.; Barnes, M.J. Human performance issues and user interface design for teleoperated robots. IEEE Trans. Syst. Man Cybern. 2007, 37, 1231–1245. [Google Scholar] [CrossRef]
- Spool, J.M. Web Site Usability: A designer’s Guide; Morgan Kaufmann Publishers: Amsterdam, The Netherlands, 1999. [Google Scholar]
- Ben-Bassat, T.; Shinar, D. Ergonomic guidelines for traffic sign design increase sign comprehension. Hum. Factors 2006, 48, 182–195. [Google Scholar] [CrossRef] [PubMed] [Green Version]
- Ng, A.W.; Chan, A.H. The guessability of traffic signs: Effects of prospective-user factors and sign design features. Accid. Anal. Prev. 2007, 39, 1245–1257. [Google Scholar] [CrossRef] [PubMed]
- Bengler, K.; Rettenmaier, M.; Fritz, N.; Feierle, A. From HMI to HMIs: Towards an HMI framework for automated driving. Information 2020, 11, 61. [Google Scholar] [CrossRef] [Green Version]
- Lagstrom, T.; Lundgren, V.M. AVIP-Autonomous Vehicles Interaction with Pedestrians. Ph.D. Thesis, Chalmers University of Technology, Gothenburg, Sweden. Available online: https://publications.lib.chalmers.se/records/fulltext/238401/238401.pdf (accessed on 2 May 2022).
- Mitsubishi Electric Introduces Road-Illuminating Directional Indicators. Available online: http://www.mitsubishielectric.com/news/2015/1023.html?cid=rss (accessed on 30 June 2017).
- Snyder, J.B. This Self-Driving Car Smiles at Pedestrians. 2016. Available online: https://www.autoblog.com/2016/09/16/this-self-driving-car-smiles-atpedestrians/ (accessed on 16 September 2016).
- Métayer, N.; Coeugnet, S. Improving the experience in the pedestrian’s interaction with an autonomous vehicle: An ergonomic comparison of external hmi. Appl. Ergon. 2021, 96, 103478. [Google Scholar] [CrossRef]
- Zhang, J.; Vinkhuyzen, E.; Cefkin, M. Evaluation of an autonomous vehicle external communication system concept: A survey study. In Advances in Human Aspects of Transportation; Springer: Cham, Switzerland, 2017; pp. 650–661. [Google Scholar] [CrossRef]
- Bazilinskyy, P.; Dodou, D.; de Winter, J. Survey on eHMI concepts: The effect of text, color, and perspective. Transp. Res. Part F Traffic Psychol. Behav. 2019, 67, 175–194. [Google Scholar] [CrossRef]
- McDougall, S.J.; Curry, M.B.; De Bruijn, O. Measuring symbol and icon characteristics: Norms for concreteness, complexity, meaningfulness, familiarity, and semantic distance for 239 symbols. Behav. Res. Methods Instrum. Comput. 1999, 31, 487–519. [Google Scholar] [CrossRef] [Green Version]
- De Clercq, K.; Dietrich, A.; Núñez Velasco, J.P.; De Winter, J.; Happee, R. External human-machine interfaces on automated vehicles: Effects on pedestrian crossing decisions. Hum. Factors 2019, 61, 1353–1370. [Google Scholar] [CrossRef] [Green Version]
- Mahadevan, K.; Somanath, S.; Sharlin, E. Communicating Awareness and Intent in Autonomous Vehicle-Pedestrian Interaction; University of Calgary: Calgary, AB, Canada, 2017. [Google Scholar] [CrossRef]
- Shuchisnigdha, D.; Strawderman, L.J.; Carruth, D.W. Investigating pedestrian suggestions for external features on fully autonomous vehicles: A virtual reality experiment. Transp. Res. Part F Traffic Psychol. Behav. 2018, 59, 135–149. [Google Scholar] [CrossRef]
- Merat, N.; Louw, T.; Madigan, R.; Wilbrink, M.; Schieben, A. What externally presented information do vrus require when interacting with fully automated road transport systems in shared space? Accid. Anal. Prev. 2018, 118, 244–252. [Google Scholar] [CrossRef]
- Chang, C.M.; Toda, K.; Igarashi, T.; Miyata, M.; Kobayashi, Y. A video-based study comparing communication modalities between an autonomous car and a pedestrian. In Proceedings of the 10th International Conference on Automotive User Interfaces and Interactive Vehicular Applications, New York, NY, USA, 23 September 2018; pp. 104–109. [Google Scholar] [CrossRef]
- Stadler, S.; Cornet, H.; Theoto, T.N.; Frenkler, F. A tool, not a toy: Using virtual reality to evaluate the communication between autonomous vehicles and pedestrians. In Augmented Reality and Virtual Reality; Tom Dieck, M., Jung, T., Eds.; Springer: Cham, Switzerland, 2019; pp. 203–216. [Google Scholar] [CrossRef]
- Othersen, I.; Conti-Kufner, A.; Dietrich, A.; Maruhn, P.; Bengler, K. Designing for automated vehicle and pedestrian communication. In Proceedings of the Perspectives on eHMIs from Older and Younger Persons (Netherlands: HFES Europe Annual Meeting), Amsterdam, The Netherlands, 14–16 October 2018; Available online: https://www.hfes-europe.org/largefiles/proceedingshfeseurope2018.pdf (accessed on 8 October 2018).
- Gordon, M.S.; Kozloski, J.R.; Kundu, A.; Malkin, P.K.; Pickover, C.A. Automated Control of Interactions between Self-Driving Vehicles and Pedestrians. U.S. Patent 9,483,948, 7 August 2015. [Google Scholar]
- Alexandros, R.; Alm, H. External human-machine interfaces for autonomous vehicle-to-pedestrian communication: A review of empirical work. Front. Psychol. 2019, 10, 2757. [Google Scholar] [CrossRef]
- Kim, J.K.; Schubert, E.F. Transcending the replacement paradigm of solid-state lighting. Opt. Express 2008, 16, 21835–21842. [Google Scholar] [CrossRef] [PubMed]
- Dey, D.; Habibovic, A.; Pfleging, B.; Martens, M.; Terken, J. Color and animation preferences for a light band eHMI in interactions between automated vehicles and pedestrians. In Proceedings of the 2020 CHI Conference on Human Factors in Computing Systems, Honolulu, HI, USA, 25–30 April 2020; pp. 1–13. [Google Scholar] [CrossRef]
- Guzman-Martinez, E.; Leung, P.; Franconeri, S.; Grabowecky, M.; Suzuki, S. Rapid eye-fixation training without eyetracking. Psychon. Bull. Rev. 2009, 16, 491–496. [Google Scholar] [CrossRef] [PubMed] [Green Version]
- Cao, Y.; Zhuang, X.; Ma, G. Shorten pedestrians’ perceived waiting time: The effect of tempo and pitch in audible pedestrian signals at red phase. Accid. Anal. Prev. 2019, 123, 336–340. [Google Scholar] [CrossRef] [PubMed]
- Cocenas-Silva, R.; Bueno, J.L.O.; Molin, P.; Bigand, E. Multidimensional scaling of musical time estimations. Percept. Mot. Ski. 2011, 112, 737–748. [Google Scholar] [CrossRef] [PubMed]
- Coutinho, E.; Cangelosi, A. Musical emotions: Predicting second-by-second subjective feelings of emotion from low-level psychoacoustic features and physiological measurements. Emotion 2011, 11, 921. [Google Scholar] [CrossRef] [Green Version]
- Gomez, P.; Danuser, B. Relationships between musical structure and psychophysiological measures of emotion. Emotion 2007, 7, 377. [Google Scholar] [CrossRef] [Green Version]
- Husain, G.; Thompson, W.F.; Schellenberg, E.G. Effects of musical tempo and mode on arousal, mood, and spatial abilities. Music. Percept. 2002, 20, 151–171. [Google Scholar] [CrossRef] [Green Version]
- Rosenblum, L.D.; Carello, C.; Pastore, R.E. Relative effectiveness of three stimulus variables for locating a moving sound source. Perception 1987, 16, 175–186. [Google Scholar] [CrossRef]
- Poulsen, T. Acoustic traffic signal for blind pedestrians. Appl. Acoust. 1982, 15, 363–376. [Google Scholar] [CrossRef]
- Misdariis, N.; Cera, A.; Levallois, E.; Locqueteau, C. Do Electric Cars Have to Make Noise? An Emblematic Opportunity for Designing Sounds and Soundscapes. In Acoustics, Nantes, France. 23 April 2012. Available online: https://hal.archives-ouvertes.fr/hal-00810920. (accessed on 30 August 2016).
- Yue, L.; Abdel-Aty, M.; Wu, Y.; Zheng, O.; Yuan, J. In-depth approach for identifying crash causation patterns and its implications for pedestrian crash prevention. J. Saf. Res. 2020, 73, 119–132. [Google Scholar] [CrossRef]
- Eluru, N.; Bhat, C.R.; Hensher, D.A. A mixed generalized ordered response model for examining pedestrian and bicyclist injury severity level in traffic crashes. Accid. Anal. Prev. 2008, 40, 1033–1054. [Google Scholar] [CrossRef] [PubMed]
- Yamauchi, K.; Sano, T.; Hasegawa, S.; Tamura, F.; Takeda, Y. Detectability and hearing impression of additional warning sounds for electric or hybrid vehicles. In Proceedings of the INTER-NOISE and NOISE-CON Congress and Conference Proceedings, Fort Lauderdale, FL, USA, 16–19 November 2014; pp. 5279–5285. Available online: https://kyushu-u.pure.elsevier.com/en/publications/detectability-and-hearing-impression-of-additional-warning-sounds (accessed on 14 October 2014).
Figure 1.
Scene design of animated film.

Table 1.
Combinations of sound and visual variables.
| Interactive Design Elements of Autonomous Driving | Type | Parameter |
|---|---|---|
| Lighting | Color | Red |
| Green | ||
| Status | Flash | |
| Always on | ||
| Melody | Single tone | |
| Continuous tone | ||
| Sound | Rhythm | Fast: 0.5 s/time |
| Slow: 0.8 s/time | ||
| Frequency | High frequency: 1000–3000 Hz | |
| Low frequency: 500–880 Hz |
Table 2.
Basic information of the participants.
| Item | Option | Number of People | Percentage (%) |
|---|---|---|---|
| Gender | Male | 17 | 48.57 |
| Female | 18 | 51.43 | |
| Age | Youth | 17 | 48.57 |
| Middle-aged and elderly | 18 | 51.43 | |
| Driving experience | No driving experience | 7 | 20.00 |
| Less than 1 year | 6 | 17.14 | |
| 1–3 years | 5 | 14.29 | |
| 4–10 years | 3 | 8.57 | |
| More than 10 years | 14 | 40.00 | |
| Traffic accident | With accidents | 17 | 48.57 |
| Without accidents | 18 | 51.43 | |
| Role in the accident | Driving | 13 | 37.14 |
| Motorcycle riders | 4 | 11.43 | |
| No | 18 | 51.43 |
Table 3.
Percentage of intention with different variable combinations for road-user first and vehicle first in deceleration scenario.
Table 3.
Percentage of intention with different variable combinations for road-user first and vehicle first in deceleration scenario.
| Road-User First | Color | Lighting | Rhythm | Frequency | Melody | Percentage |
|---|---|---|---|---|---|---|
| video1 | Green | Always on | Fast | Low | Single tone | 71.4% |
| video23 | Green | Flash | Slow | High | Single tone | 71.4% |
| video27 | Green | Flash | Slow | Low | Continuous tone | 71.4% |
| video31 | Green | Flash | Slow | High | Continuous tone | 71.4% |
| video21 | Green | Always on | Slow | High | Single tone | 68.6% |
| video25 | Green | Always on | Slow | Low | Continuous tone | 68.6% |
| Vehicle First | Color | Lighting | Rhythm | Frequency | Melody | Percentage |
| video26 | Red | Flash | Fast | High | Single tone | 77.1% |
| video32 | Red | Always on | Fast | Low | Single tone | 74.3% |
| video18 | Red | Flash | Fast | High | Continuous tone | 68.6% |
| video30 | Red | Flash | Fast | Low | Single tone | 68.6% |
| video24 | Red | Always on | Fast | Low | Continuous tone | 68.6% |
| video28 | Red | Always on | Fast | High | Single tone | 68.6% |
Table 4.
Statistical results of Pearson chi-square test in deceleration scenario.
| Item | Value | Deceleration Intention (%) | χ2 | p | ||
|---|---|---|---|---|---|---|
| 1.0 | 2.0 | 3.0 | ||||
| Color | Green | 6(100.00) | 0(0.00) | 10(50.00) | 12.000 | 0.002 ** |
| Red | 0(0.00) | 6(100.00) | 10(50.00) | |||
| Lighting | Always on | 3(50.00) | 3(50.00) | 10(50.00) | 0.000 | 1.000 |
| Flash | 3(50.00) | 3(50.00) | 10(50.00) | |||
| Rhythm | Fast | 1(16.67) | 6(100.00) | 9(45.00) | 8.867 | 0.012 * |
| Slow | 5(83.33) | 0(0.00) | 11(55.00) | |||
| Frequency | Low | 3(50.00) | 3(50.00) | 10(50.00) | 0.000 | 1.000 |
| High | 3(50.00) | 3(50.00) | 10(50.00) | |||
| Melody | Single tone | 3(50.00) | 4(66.67) | 9(45.00) | 0.867 | 0.648 |
| Dual tone | 3(50.00) | 2(33.33) | 11(55.00) | |||
* p < 0.05; ** p < 0.01.
Table 5.
MANOVA results of subjective cognition in deceleration scenario.
| Effect | Value | F | df | Degree of Freedom Error | Significance | n2p |
|---|---|---|---|---|---|---|
| Color | 0.940 | 5631.287 | 3.000 | 1086.000 | 0.000 ** | 0.940 |
| Lighting | 0.010 | 3.477 | 3.000 | 1086.000 | 0.016 ** | 0.010 |
| Melody | 0.010 | 3.487 | 3.000 | 1086.000 | 0.015 ** | 0.010 |
| Color × Rhythm | 0.008 | 2.926 | 3.000 | 1086.000 | 0.033 ** | 0.008 |
| Color × Melody | 0.022 | 8.248 | 3.000 | 1086.000 | 0.000 ** | 0.022 |
| Color × Lighting × Rhythm × Melody | 0.009 | 3.453 | 3.000 | 1086.000 | 0.016 ** | 0.009 |
| Melody | 0.010 | 3.487 | 3.000 | 1086.000 | 0.015 ** | 0.010 |
** p < 0.01.
Table 6.
Verification and analysis results of effects among different subjective cognitive combinations in deceleration scenario.
Table 6.
Verification and analysis results of effects among different subjective cognitive combinations in deceleration scenario.
| Source | Dependent Variable | Type 2 SS | Degree of Freedom | Mean Square | F | Significance | n2p |
|---|---|---|---|---|---|---|---|
| Usability | Color | 9.844 | 1 | 9.844 | 10.448 | 0.001 ** | 0.010 |
| Color × Rhythm | 22.008 | 1 | 22.008 | 23.360 | 0.000 ** | 0.021 | |
| Color × Melody | 9.108 | 1 | 9.108 | 9.668 | 0.002 ** | 0.009 | |
| Usefulness | Color | 6.758 | 1 | 6.758 | 7.036 | 0.008 ** | 0.006 |
| Lighting | 6.758 | 1 | 6.758 | 7.036 | 0.008 ** | 0.006 | |
| Color × Rhythm | 15.322 | 1 | 15.322 | 15.953 | 0.000 ** | 0.014 | |
| Color × Melody | 4.251 | 1 | 4.251 | 4.426 | 0.036 * | 0.004 | |
| Satisfaction | Color | 5.432 | 1 | 5.432 | 5.609 | 0.018 * | 0.005 |
| Lighting | 8.229 | 1 | 8.229 | 8.497 | 0.004 ** | 0.008 | |
| Melody | 6.604 | 1 | 6.604 | 6.819 | 0.009 ** | 0.006 | |
| Color × Rhythm | 7.557 | 1 | 7.557 | 7.803 | 0.005 ** | 0.007 | |
| Color × Melody | 5.157 | 1 | 5.157 | 5.325 | 0.021 * | 0.005 |
* p < 0.05; ** p < 0.01.
Table 7.
Verification and analysis results of simple main effects of subjective cognition in deceleration scenario.
Table 7.
Verification and analysis results of simple main effects of subjective cognition in deceleration scenario.
| Type 2 SS | df | MS | F | p | Comparison | |||
|---|---|---|---|---|---|---|---|---|
| Usability | Green | Rhythm | 10.066 | 1 | 10.066 | 10.149 | 0.002 * | Fast rhythm (M = 3.30, SD = 1.032) < Slow rhythm (M = 3.57, SD = 0.958) |
| Red | Rhythm | 10.618 | 1 | 10.618 | 11.267 | 0.001 * | Fast rhythm (M = 3.75, SD = 0.947) > Slow rhythm (M = 3.47, SD = 0.994) | |
| Melody | 7.529 | 1 | 7.529 | 7.942 | 0.005 * | Single tone (M = 3.73, SD = 0.973) > Dual tone (M = 3.39, SD = 1.009) | ||
| Usefulness | Green | Rhythm | 4.596 | 1 | 4.596 | 4.802 | 0.029 * | Fast rhythm (M = 3.37, SD = 1.026) < Slow rhythm (M = 3.56, SD = 0.928) |
| Red | Rhythm | 9.529 | 1 | 9.529 | 9.428 | 0.002 ** | Fast rhythm (M = 3.74, SD = 0.994) > Slow rhythm (M = 3.48, SD = 1.013) | |
| Melody | 6.184 | 1 | 6.184 | 6.081 | 0.014 * | Single tone (M = 3.72, SD = 0.967) > Dual tone (M = 3.50, SD = 1.049) | ||
| Satisfaction | Red | Rhythm | 5.972 | 1 | 5.972 | 5.805 | 0.016 * | Fast rhythm (M = 3.58, SD = 1.017) > Slow rhythm (M = 3.37, SD = 1.011) |
| Melody | 11.472 | 1 | 11.472 | 11.262 | 0.001 ** | Single tone (M = 3.62, SD = 0.972) > Dual tone (M = 3.33, SD = 1.045) |
* p < 0.05; ** p < 0.01.
Table 8.
Descriptive statistical average of certain factors in deceleration scenario.
| M | SD | N | |||
|---|---|---|---|---|---|
| Usability | Lighting | Always on | 3.47 | 1.027 | 560 |
| Flash | 3.58 | 0.941 | 560 | ||
| Frequency | Low | 3.49 | 1.010 | 560 | |
| High | 3.55 | 0.961 | 560 | ||
| Usefulness | Lighting | Always on | 3.46 | 1.044 | 560 |
| Flash | 3.61 | 0.928 | 560 | ||
| Frequency | Low | 3.49 | 1.008 | 560 | |
| High | 3.57 | 0.971 | 560 | ||
| Satisfaction | Lighting | Always on | 3.31 | 1.017 | 560 |
| Flash | 3.48 | 0.955 | 560 | ||
| Frequency | Low | 3.37 | 0.999 | 560 | |
| High | 3.43 | 0.980 | 560 |
Table 9.
Signal combination with the highest average of subjective cognitive assessment for deceleration scenario.
Table 9.
Signal combination with the highest average of subjective cognitive assessment for deceleration scenario.
| Deceleration Scenario | Color | Lighting | Rhythm | Frequency | Melody |
|---|---|---|---|---|---|
| Road-user first | Green | Flash | Slow | High | Continuous tone |
| Vehicle first | Red | Flash | Fast | High | Single tone |
Table 10.
Percentage of intention with different variable combinations for road-user first and vehicle first in waiting-to-restart scenario.
Table 10.
Percentage of intention with different variable combinations for road-user first and vehicle first in waiting-to-restart scenario.
| Road-User First | Color | Lighting | Rhythm | Frequency | Melody | Percentage |
|---|---|---|---|---|---|---|
| video27 | Green | Flash | Slow | Low | Continuous tone | 80.0% |
| video23 | Green | Flash | Slow | High | Single tone | 77.1% |
| video29 | Green | Always on | Slow | Low | Single tone | 74.3% |
| video17 | Green | Flash | Slow | High | Continuous tone | 74.3% |
| video19 | Green | Always on | Slow | High | Continuous tone | 68.6% |
| Vehicle First | Color | Lighting | Rhythm | Frequency | Melody | Percentage |
| video26 | Red | Flash | Fast | High | Continuous tone | 68.6% |
| video32 | Red | Flash | Fast | High | Single tone | 68.6% |
| video18 | Red | Always on | Fast | Low | Single tone | 68.6% |
Table 11.
Pearson chi-square test results for waiting-to-restart scenario.
| Item | Value | Intention Judgment (%) | χ2 | p | ||
|---|---|---|---|---|---|---|
| Road-User First | Vehicle First | Not Known | ||||
| Color | Green | 5(100.00) | 0(0.00) | 11(45.83) | 8.167 | 0.017 * |
| Red | 0(0.00) | 3(100.00) | 13(54.17) | |||
| Lighting | Always on | 2(40.00) | 1(33.33) | 13(54.17) | 0.700 | 0.705 |
| Flash | 3(60.00) | 2(66.67) | 11(45.83) | |||
| Rhythm | Fast | 0(0.00) | 3(100.00) | 13(54.17) | 8.167 | 0.017 * |
| Slow | 5(100.00) | 0(0.00) | 11(45.83) | |||
| Frequency | Low | 3(60.00) | 1(33.33) | 12(50.00) | 0.533 | 0.766 |
| High | 2(40.00) | 2(66.67) | 12(50.00) | |||
| Melody | Single tone | 3(60.00) | 2(66.67) | 11(45.83) | 0.700 | 0.705 |
| Continuous tone | 2(40.00) | 1(33.33) | 13(54.17) | |||
* p < 0.05.
Table 12.
MANOVA analysis results of subjective cognition in waiting-to-restart scenario.
| Effect | Value | F | Assumed Degree of Freedom | Degree of Freedom for Error | Significance | Partial Eta Squared |
|---|---|---|---|---|---|---|
| Lighting | 0.012 | 4.571 | 3.000 | 1086.000 | 0.003 ** | 0.012 |
| Color × Rhythm | 0.017 | 6.279 | 3.000 | 1086.000 | 0.000 ** | 0.017 |
** p < 0.01.
Table 13.
Verification and analysis results of effects among subjective cognition combinations in waiting-to-restart scenario.
Table 13.
Verification and analysis results of effects among subjective cognition combinations in waiting-to-restart scenario.
| Source | Dependent Variable | Type III Sum of Squares | Degree of Freedom | Mean Square | F | Significance | Partial Eta Squared |
|---|---|---|---|---|---|---|---|
| Usability | Lighting | 6.451 | 1 | 6.451 | 6.737 | 0.010 ** | 0.006 |
| Color × Rhythm | 17.251 | 1 | 17.251 | 18.015 | 0.000 ** | 0.016 | |
| Usefulness | Lighting | 8.575 | 1 | 8.575 | 9.368 | 0.002 ** | 0.009 |
| Color × Rhythm | 14.629 | 1 | 14.629 | 15.981 | 0.000 ** | 0.014 | |
| Satisfaction | Lighting | 13.289 | 1 | 13.289 | 12.788 | 0.000 ** | 0.012 |
| Color × Rhythm | 11.604 | 1 | 11.604 | 11.166 | 0.001 ** | 0.010 |
** p < 0.01.
Table 14.
Verification and analysis results of simple main effect of subjective cognition in waiting-to-restart scenario.
Table 14.
Verification and analysis results of simple main effect of subjective cognition in waiting-to-restart scenario.
| df | MS | F | p | Comparison | ||||
|---|---|---|---|---|---|---|---|---|
| Usability | Green | Rhythm | 4.971 | 1 | 4.971 | 5.331 | 0.021 * | Fast rhythm (M = 3.58, SD = 1.031) < Slow rhythm (M = 3.78, SD = 0.895) |
| Red | Rhythm | 10.618 | 1 | 10.618 | 10.473 | 0.001 ** | Fast rhythm (M = 3.72, SD = 0.988) > Slow rhythm (M = 3.44, SD = 1.016) | |
| Usefulness | Red | Rhythm | 11.184 | 1 | 11.184 | 11.449 | 0.001 ** | Fast rhythm (M = 3.74, SD = 0.983) > Slow rhythm (M = 3.46, SD = 0.993) |
| Satisfaction | Red | Rhythm | 5.765 | 1 | 5.765 | 5.163 | 0.023 * | Fast rhythm (M = 3.56, SD = 1.061) > Slow rhythm (M = 3.35, SD = 1.052) |
* p < 0.05; ** p < 0.01.
Table 15.
Descriptive statistical averages of factors in waiting-to-restart scenario.
| M | SD | N | |||
|---|---|---|---|---|---|
| Usability | Lighting | Always on | 3.55 | 1.012 | 560 |
| Flash | 3.70 | 0.953 | 560 | ||
| Frequency | Low | 3.67 | 0.962 | 560 | |
| High | 3.58 | 1.007 | 560 | ||
| Melody | Single tone | 3.68 | 0.959 | 560 | |
| Dual tone | 3.58 | 1.009 | 560 | ||
| Usefulness | Lighting | Always on | 3.55 | 0.971 | 560 |
| Flash | 3.73 | 0.947 | 560 | ||
| Frequency | Low | 3.68 | 0.935 | 560 | |
| High | 3.60 | 0.989 | 560 | ||
| Melody | Single tone | 3.68 | 0.920 | 560 | |
| Dual tone | 3.60 | 1.003 | 560 | ||
| Satisfaction | Lighting | Always on | 3.37 | 1.040 | 560 |
| Flash | 3.59 | 0.993 | 560 | ||
| Frequency | Low | 3.51 | 1.015 | 560 | |
| High | 3.45 | 1.030 | 560 | ||
| Melody | Single tone | 3.51 | 0.997 | 560 | |
| Dual tone | 3.45 | 1.047 | 560 |
Table 16.
Signal combination with the highest average of subjective cognitive assessment based on waiting-to-restart scenario.
Table 16.
Signal combination with the highest average of subjective cognitive assessment based on waiting-to-restart scenario.
| Waiting-to-Restart Scenario | Color | Lighting | Rhythm | Frequency | Melody |
|---|---|---|---|---|---|
| Road-user first | Green | Flash | Slow | Low | Continuous tone |
| Vehicle first | Red | Flash | Fast | Low | Single tone |
Publisher’s Note: MDPI stays neutral with regard to jurisdictional claims in published maps and institutional affiliations. |
© 2022 by the authors. Licensee MDPI, Basel, Switzerland. This article is an open access article distributed under the terms and conditions of the Creative Commons Attribution (CC BY) license (https://creativecommons.org/licenses/by/4.0/).
Share and Cite
MDPI and ACS Style
Wu, C.-F.; Xu, D.-D.; Lu, S.-H.; Chen, W.-C. Effect of Signal Design of Autonomous Vehicle Intention Presentation on Pedestrians’ Cognition. Behav. Sci. 2022, 12, 502. https://doi.org/10.3390/bs12120502
AMA Style
Wu C-F, Xu D-D, Lu S-H, Chen W-C. Effect of Signal Design of Autonomous Vehicle Intention Presentation on Pedestrians’ Cognition. Behavioral Sciences. 2022; 12(12):502. https://doi.org/10.3390/bs12120502
Chicago/Turabian StyleWu, Chih-Fu, Dan-Dan Xu, Shao-Hsuan Lu, and Wen-Chi Chen. 2022. "Effect of Signal Design of Autonomous Vehicle Intention Presentation on Pedestrians’ Cognition" Behavioral Sciences 12, no. 12: 502. https://doi.org/10.3390/bs12120502
Note that from the first issue of 2016, this journal uses article numbers instead of page numbers. See further details here.