Groundwater Quality Assessment Using Fuzzy-AHP in An Giang Province of Vietnam
by
 , ,
, ,
Huynh Vuong Thu Minh
1,
Ram Avtar
2,* ,
,
Pankaj Kumar
3 ,
,
Dat Q. Tran
4,
Tran Van Ty
5,
Hari Charan Behera
6 and
Masaaki Kurasaki
2
1
Graduate School of Environmental Earth Science, Hokkaido University, Sapporo 060-0810, Japan
2
Faculty of Environmental Earth Science, Hokkaido University, Sapporo 060-0810, Japan
3
Natural Resources and Ecosystem Services, Institute for Global Environmental Strategies, Hayama 240-0115, Japan
4
Department of Agricultural Economics and Agribusiness, University of Arkansas at Fayetteville, Fayetteville, AR 72701, USA
5
Department of Hydraulic Engineering, Can Tho University, Can Tho City 900000, Vietnam
6
Indian Statistical Institute, Giridih Jharkhand 815301, India
*
Author to whom correspondence should be addressed.
Geosciences 2019, 9(8), 330; https://doi.org/10.3390/geosciences9080330
Submission received: 9 May 2019
/
Revised: 23 July 2019
/
Accepted: 24 July 2019
/
Published: 27 July 2019
(This article belongs to the Special Issue Hydrogeochemistry and Groundwater Management)
Abstract
:Along with rapid population growth in Vietnam, there is an increasing dependence on groundwater for various activities. An Giang province is known to be one of the agricultural intensification areas of The Vietnamese Mekong Delta (VMD). This study aimed to evaluate the spatiotemporal variation of groundwater quality for a period of ten years from 2009 to 2018 in An Giang. The weighted groundwater quality index (GWQI) was developed based on the fuzzy analytic hierarchy process (Fuzzy-AHP) for assigning weighted parameters. The results show that that shallow wells in the Northeast and Southeast regions of An Giang were mostly categorized under “bad water” quality with high arsenic (As) concentration over the years partly due to huge amounts of sediment deposition in monsoon season. Overall, the reason for the poor groundwater quality in An Giang was the combined effect of both natural and human activities. On the other hand, we detected high values of GWQI links with high As concentration in areas where people extract more groundwater for irrigation. Temporal variation of GWQI suggested that groundwater quality at eight wells has improved from 2009 to 2018 in the wet season as compared to the dry season. The reason behind the improvement of groundwater quality during wet season was the decrease in river discharge, which causes less deposition of suspended solids near the flood plains. Moreover, the filling of unused wells can reduce the movement of pollutants from unused wells to groundwater aquifers. Although there was not sufficient evidence to show the relationship between As and sediment concentration, the temporal reduction trend in river discharge and suspended solids was detected in An Giang. The understanding of groundwater quality can help policymakers protect and manage limited water resources in the long-term.
1. Introduction
Multiple criteria decision-making (MCDM) is a selective model used for evaluation of many complex decisions [1,2]. The fuzzy analytic hierarchy process (Fuzzy-AHP), based on AHP under fuzzy environment, is one of the most robust and flexible MCDM tools in the evaluation procedure [2,3]. In 1980, a simple AHP method was introduced based on a ratio scale [2,4,5]. The method was commonly applied in previous studies with advantages such as its simple and flexible model with a wide range of usages [6,7]. The disadvantages of the AHP method include the uncertainty and ambiguity in expressing opinions, as the method depends on the decision maker’s knowledge and experiences during the decision-making process. Moreover, among other factors, the AHP method does not contain feedback loops [8].
The fuzzy set was first developed by Zadeh in 1965 [5] and combined with Saaty’s priority theory to reduce human ambiguity [9,10]. Later, the Fuzzy-AHP was further developed in order to overcome the uncertainty and ambiguity of criteria weights in deterministic and inflexible classifications [11]. Using the Fuzzy-AHP can provide a fuzzy number—interval judgment values rather than fixed or exact values [2]. This approach reduces uncertainty in assigned relative weight. As a result, the Fuzzy-AHP has been successfully used in many actual decision situation making such as energy alternatives selection [12,13], supplier selection [14], environmental sustainability evaluation [7], and water quality assessment [15,16,17]. Baghapour et al. [15] conducted the Fuzzy-AHP with fuzzy ordered weighted averaging (FOWA) for developing of the groundwater quality index (GWQI). They further revealed that it could effectively calculate weights of groundwater quality parameters. Deng et al. [18] used fuzzy number scales with pair-wise comparisons for solving decision problems involving qualitative data very effectively in Australia. Two of the fuzzy pair-wise comparisons and FOWA were used for different water resource assessments, such as prioritizing the restoration strategies for Lake Urmia, Iran to avoid shrinkage [17], evaporation estimation [19,20], water consumption prediction [21], rainfall-runoff forecasting and modelling [22,23,24], and evaluation of groundwater pollution using GWQI [25].
To assess water quality, various multivariate statistical analyses were successfully applied in many previous studies, such as groundwater modelling using the principal component analysis (PCA) technique [26,27,28]. However, PCA can only reduce the dimensionality of large data sets based on the variation of variables in the new coordinate axis and the modelling approach required detailed data [28,29]. Whereas, the powerful water quality index (WQI) tool can be used to summarize a huge number of parameters into a single index [30]. The WQI method was first developed by Horton in 1965 [31] by using ten parameters of water quality. It has since been widely applied in Asian countries [32]. In 1970, Brown et al. [33] introduced a new WQI which is similar to the index of Horton. Later, many modifications were made for WQI such as the weight arithmetic water quality index (WAWQI), National Sanitation Foundation water quality index (NSFWQI), Oregon water quality index (GWQI), and WQIal for aquatic life recommended by Mekong River Commission (MRC) [32,34,35].
Many studies used the top-down approach, in which the fixed weight of groundwater quality is used to calculate the GWQI. For example, Asadi et al. [36] and Maheswaran et al. [37] used the weight of groundwater quality of WHO to calculate the GWQI in the Hyderabad and Salem districts of India. There are many water quality parameters that contribute to groundwater pollution in the study area, each with its own important value. In this study, we used the bottom-up approach at the local level in terms of weighted values of water quality parameters to find out the locally important groundwater parameters in An Giang province of the Vietnamese Mekong Delta (VMD). The Fuzzy-AHP technique, a systematic method, is an effective tool to weigh multiple parameters in classifying the clear groundwater quality based on GWQI. This study focused on estimating the groundwater WQI (GWQI) by using Fuzzy-AHP to assess groundwater quality in An Giang. The Fuzzy-AHP approach was used due to its computational effectiveness in weighted values of water quality selection and its ability to reduce uncertainty from experts’ opinions [38,39]. The pair-wise comparison with triangular fuzzy numbers, along with the weighted arithmetic index methods were used to calculate the GWQI. Inverse distance weighted (IDW) interpolation was used to display variation in spatial and temporal parameters which was applied in many studies [28,40,41]. Clear understanding about groundwater quality changes in time and space is very essential in the VMD and An Giang.
In the Vietnamese Mekong Delta (VMD), people rely both on surface and groundwater resources not only for irrigation and aquaculture, but also for daily domestic usage. However, the poor surface water quality with high concentrations of nutrients in secondary canals was found in An Giang [29]. The reason is the release of untreated agricultural runoff from rice intensification inside the full-dike protected area in An Giang [29]; as these pose serious health risks if the water is consumed without adequate treatment [42,43]. Therefore, groundwater sources serve as one of the main supplies for domestic water use, and partly for irrigation, due to surface water quality often exceeding the permission of the Vietnamese standards for domestic water supply in An Giang in recent years [44]. However, a few studies on groundwater quality assessment were conducted, such as Thu et al. [45] who investigated sources of As contamination in the groundwater in An Phu of An Giang province; Anh and Giao [46] evaluated the impact of water quality on the health risks in An Giang province, especially with regard to As concentration. To the best of our knowledge, there are no holistic studies that evaluate groundwater quality in the context of agricultural intensification and its evolution process using the GWQI using the fuzzy number in An Giang. Therefore, in this study, we clarify whether rice intensification has an effect on groundwater quality or not. The findings of this study can provide the status of groundwater quality at a spatiotemporal scale, which would be useful for decision-makers to design timely management plans for water resources and thus minimize any further adverse effect on human’s health.
2. Study Area
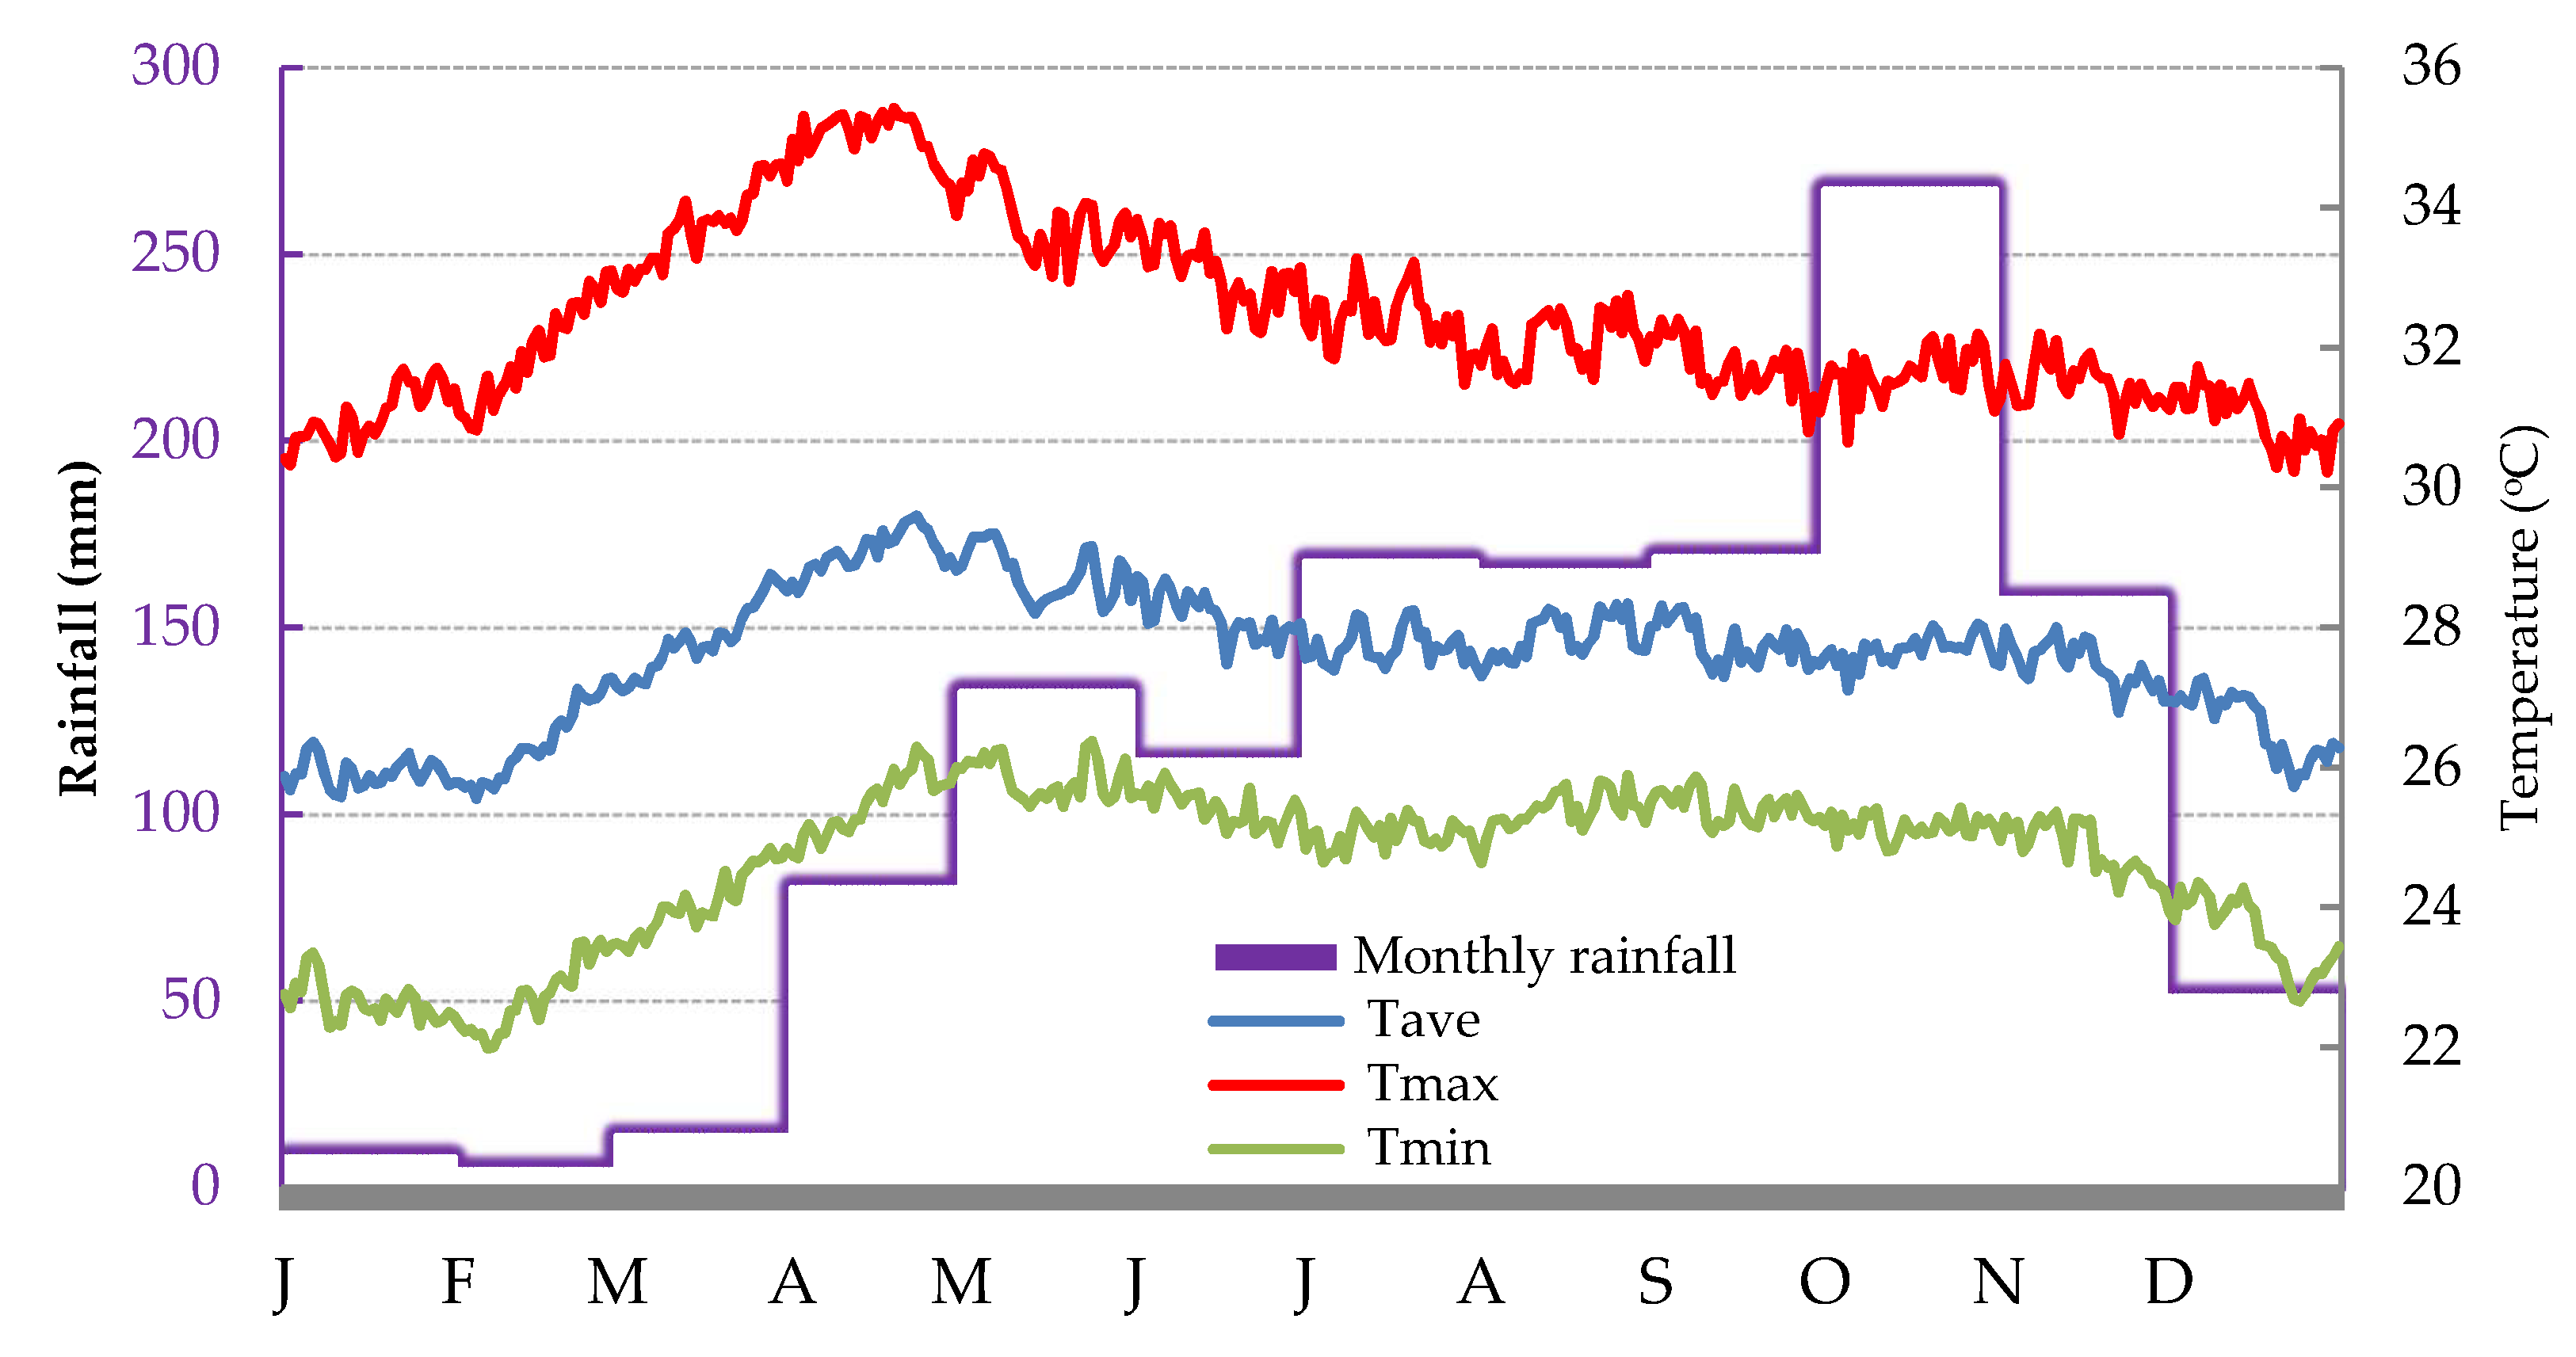
An Giang province encompasses an area of about 3406 km2 with a total population of about 2 million people in 2017. The province is located in the upper region of the VMD, which is comprised of a dense river network system (Figure 1). The wet season starts from May to November, and the dry season occurs during December through April (Figure 2). The mean annual rainfall is about 1400 mm, of which 90% occurs during the wet season. An Giang province is part of the agricultural intensification region of the VMD, where the water regime is mainly under human control through sluice gates, canals, and dike systems [47,48,49]. The land use/land cover (LULC) map of An Giang shows the percentage of various LULC classes in 2018 with a triple, double, and single rice crop, and other classes that cover 46.6%, 24.7%, 7.3%, and 21.4%, respectively [50]. The highly irrigated triple and double rice crops occur inside the dike system using surface water, which has negative impacts on surface and groundwater quality especially in the full-dike system [29,46]. Consequently, the health of two million people in An Giang may be at risk [45,46]. Moreover, the single rice cropping was dominant in the region that is far away from the main river with less of a river network system. The single rice cropping area also includes cultivation of rainfed rice in the wet season and vegetables in the dry season using groundwater. River discharge data show a decreasing trend in the wet season and a slightly increasing trend in the dry season from 2009 to 2017 (Figure 1).
An Giang province belongs to the Southern part of Vietnam with five main aquifers, namely, the Upper Pleistocene aquifer (qp3), Middle-Upper Pleistocene aquifer (qp2-3), Lower Pleistocene aquifer (qp1), Medium Pliocene aquifer (n22), and Lower Pliocene aquifer (n21) [51]. The groundwater was mostly extracted from the Pleistocene and Holocene aquifers since deposited outcrop on the surface was found, which is supplied for domestic and irrigation purposes [52]. In 2014, the total number of existing groundwater wells was 4746, which included 233 unused/discontinued wells. Out of 4513 wells, there were 553 wells used for irrigation and 3960 wells for the domestic water supply [53,54,55].
3. Data and Methodology
Groundwater quality data of eight wells were collected from 2009 to 2018 in the wet and dry seasons from the Department of Natural Resources and Environment of An Giang (DONRE) (Figure 1). The depth of G6 and G8 wells (deep well), which ranged from 80–300 m below ground level, lie in the Pleistocene aquifer. Whereas, depth of G1, G2, G3, G4, G5, and G7 wells (shallow wells), which are exploited at the average depth of 50 m, lie in the Holocene aquifer. Furthermore, wells G5 and G6 were exploited mainly for industrial zones, while the other six wells’ supply was used for domestic uses and irrigation. Six groundwater quality parameters: As, NO3, NH4+, CaCO3, total Fe, and pH were analyzed in March and September each year using standard methodology [56].
Figure 3 shows the process to determine the relative weight for each groundwater quality parameter in order to calculate the GWQI. We conducted Fuzzy-AHP, which was developed to weight criteria in decision-making by using the output of the experts’ opinions. The weighted value was assigned by pair-wise comparison for each of the six groundwater quality parameters, including As, NO3, pH, NH4+, CaCO3, and total Fe. Twenty experts were clustered in 4 groups and the experts in each group compared the parameters by pair-wise variables comparison using fuzzy triangular number scales and four scenarios of pair-wise were obtained. The Fuzzy-AHP process of weighting was accomplished in four steps and GWQI was then calculated [16]. We used inverse distance weighting (IDW) interpolation to display the results of the GWQI.
3.1. The Fuzzy- AHP with Pair-Wise Comparison Approach
To achieve relative weights of groundwater quality parameters in the Fuzzy-AHP, the process was divided into four steps, namely: hierarchy construction development, pair-wise comparisons represented by fuzzy numbers, the fuzzy triangular number calculation, and normalized weights of parameters establishment.
3.1.1. Step 1: Hierarchy Construction Development
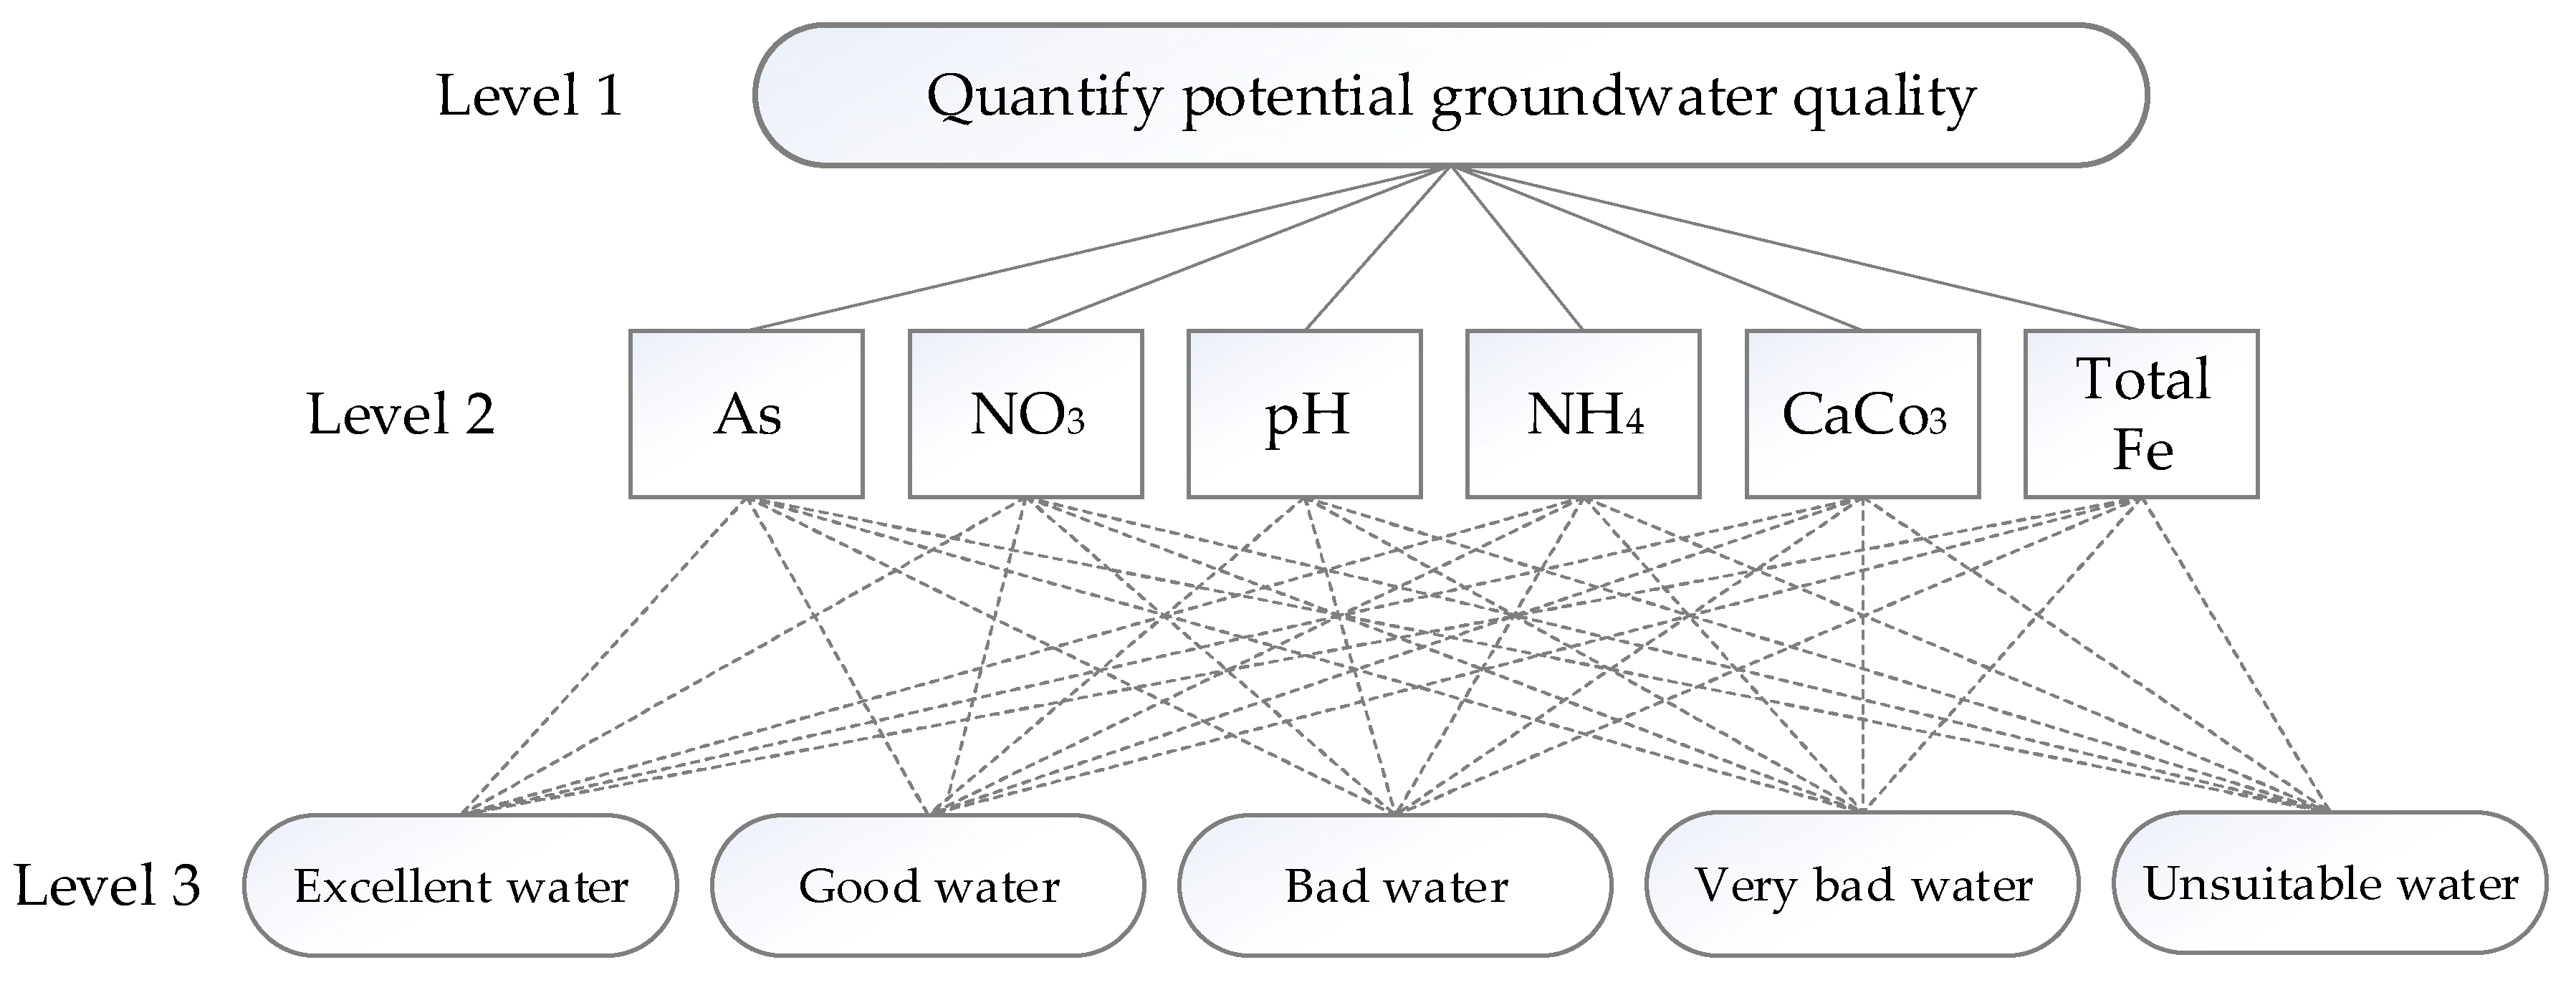
We conducted the hierarchy structure composed of three levels (Figure 4). The first level was the overall objective to determine the quantification of the potential of groundwater resources; the second level was the comparison of water quality parameters. We used a fuzzy triangular number scale which was transferred from linguistic terms corresponding to Saaty’s scale (1980) in Table 1 through pair-wise comparison matrices [4,57]. The higher weighting of a parameter shows high importance of that parameter. Finally, the groundwater quality was assessed based on five classes of GQWI.
3.1.2. Step 2: The Pair-Wise Comparisons Represented by Fuzzy Numbers
Decision making was based on the opinions of five experts in each group (professors in universities, government experts, nongovernment experts, and water supply companies) [15]. The fuzzy triangular number scales were used to compare between two parameters and find out the more important parameter. The parameters were compared by transferring them from linguistic terms to fuzzy number (Table 1). The pair-wise contribution matrix is expressed in Equation (Equation (1)). The sensitivity assessment was conducted to reduce the uncertainty of the experts’ opinions by comparison of parameters’ weights in four scenarios based on mean values and standard deviation (SD). The lowest SD in the weight change was selected as the optimal relative weight.
where, : Fuzzy triangle number, tilde (): the triangular number; represents the kth decision maker’s preference of ith criterion over jth criterion; is the average decision-maker.
3.1.3. Step 3: Determine the Fuzzy Triangular Number
The geometric mean technique for computing the weights (Wi) was extended to the fuzzy positive reciprocal matrices [58] and comparison values of each parameter were calculated as shown in Equation (2).
where, i = 1, 2, … n; : triangular values; later, replacing the fuzzy triangular number by (-1) power of summation vector and finally making it in increasing order.
3.1.4. Step 4: The Normalized Weights of Criteria
The normalized weight (Ni) was estimated by the corresponding normalized row mean (Equation (3)).
where, ; in which ; is non-fuzzy number i, is the fuzzy weight of criterion i; is reverse vector.
3.2. Groundwater Quality Index (GWQI)
The estimation of the GWQI was based on parameter weighting. A weighted value was used by using pair-wise comparison to each other and this assigned weighted value played a major role in the calculation of the index value. Table 2 shows that the limited threshold of quality values based on the National Technical Regulation on Groundwater Quality of Vietnam (standard number 09-MT:2015/BTNMT) [59], and this was used to calculate the quality rating scale. Due to the considered parameters having different units and ranges of values, all parameters had to be turned into sub-indices expressed on a single scale. Thus, we calculated based on the following: Relative weight (Wrj), quality rating scale (qi), and GWQI.
3.2.1. Relative Weight Calculation ()
3.2.2. The Quality Rating Scale Calculation ()
3.2.3. Groundwater Quality Index Calculation
In this study, we calculated the GWQI based on the weighted arithmetic index method recommended by the World Health Organization (WHO) using Equation (6). The weighted arithmetic index method can be used with different parameters. It is flexible for assessment and management of water quality because it was applied in many previous studies [16,60,61], Groundwater quality was classified based on rating values of GWQI in Table 3.
where, GWQI: Groundwater quality index, a number between 0 to 300 units was divided into the five grade scales as shown in Table 3.
4. Results
4.1. The Fuzzy-AHP with Pair-Wise Comparison
To determine the weighted parameters, 20 experts in four groups were asked to enter into the pair-wise comparison matrix of AHP defined weighting parameters in four scenarios. Table 4 shows pair-wise comparisons in scenario 3, in which As, CaCO3, and Fe were of “equal importance” while As was of “moderate importance” with NH4+, and NO3, and “strong importance” with pH. Then, four scenarios were defined to estimate absolute group weights of different parameters obtained from pair-wise comparison as shown in Table 5. Next, the optimal status of decision-making powers were determined by sensitivity analysis. To reduce the uncertainty of the experts’ opinions, we compared all the possible scenarios and calculated sensitivity values for all 6 paired scenarios. Table 6 shows the sensitivity comparison among six paired scenarios. It is clearly visible that scenario 3 performed best with the lowest SD (SD = 0.007) in the sensitivity analysis. Table 7 shows the relative weight factors of different water quality parameters. As together with Fe concentrations and pH values were the most and least important parameters, respectively (Table 7).
4.2. Groundwater Quality Index (GWQI)
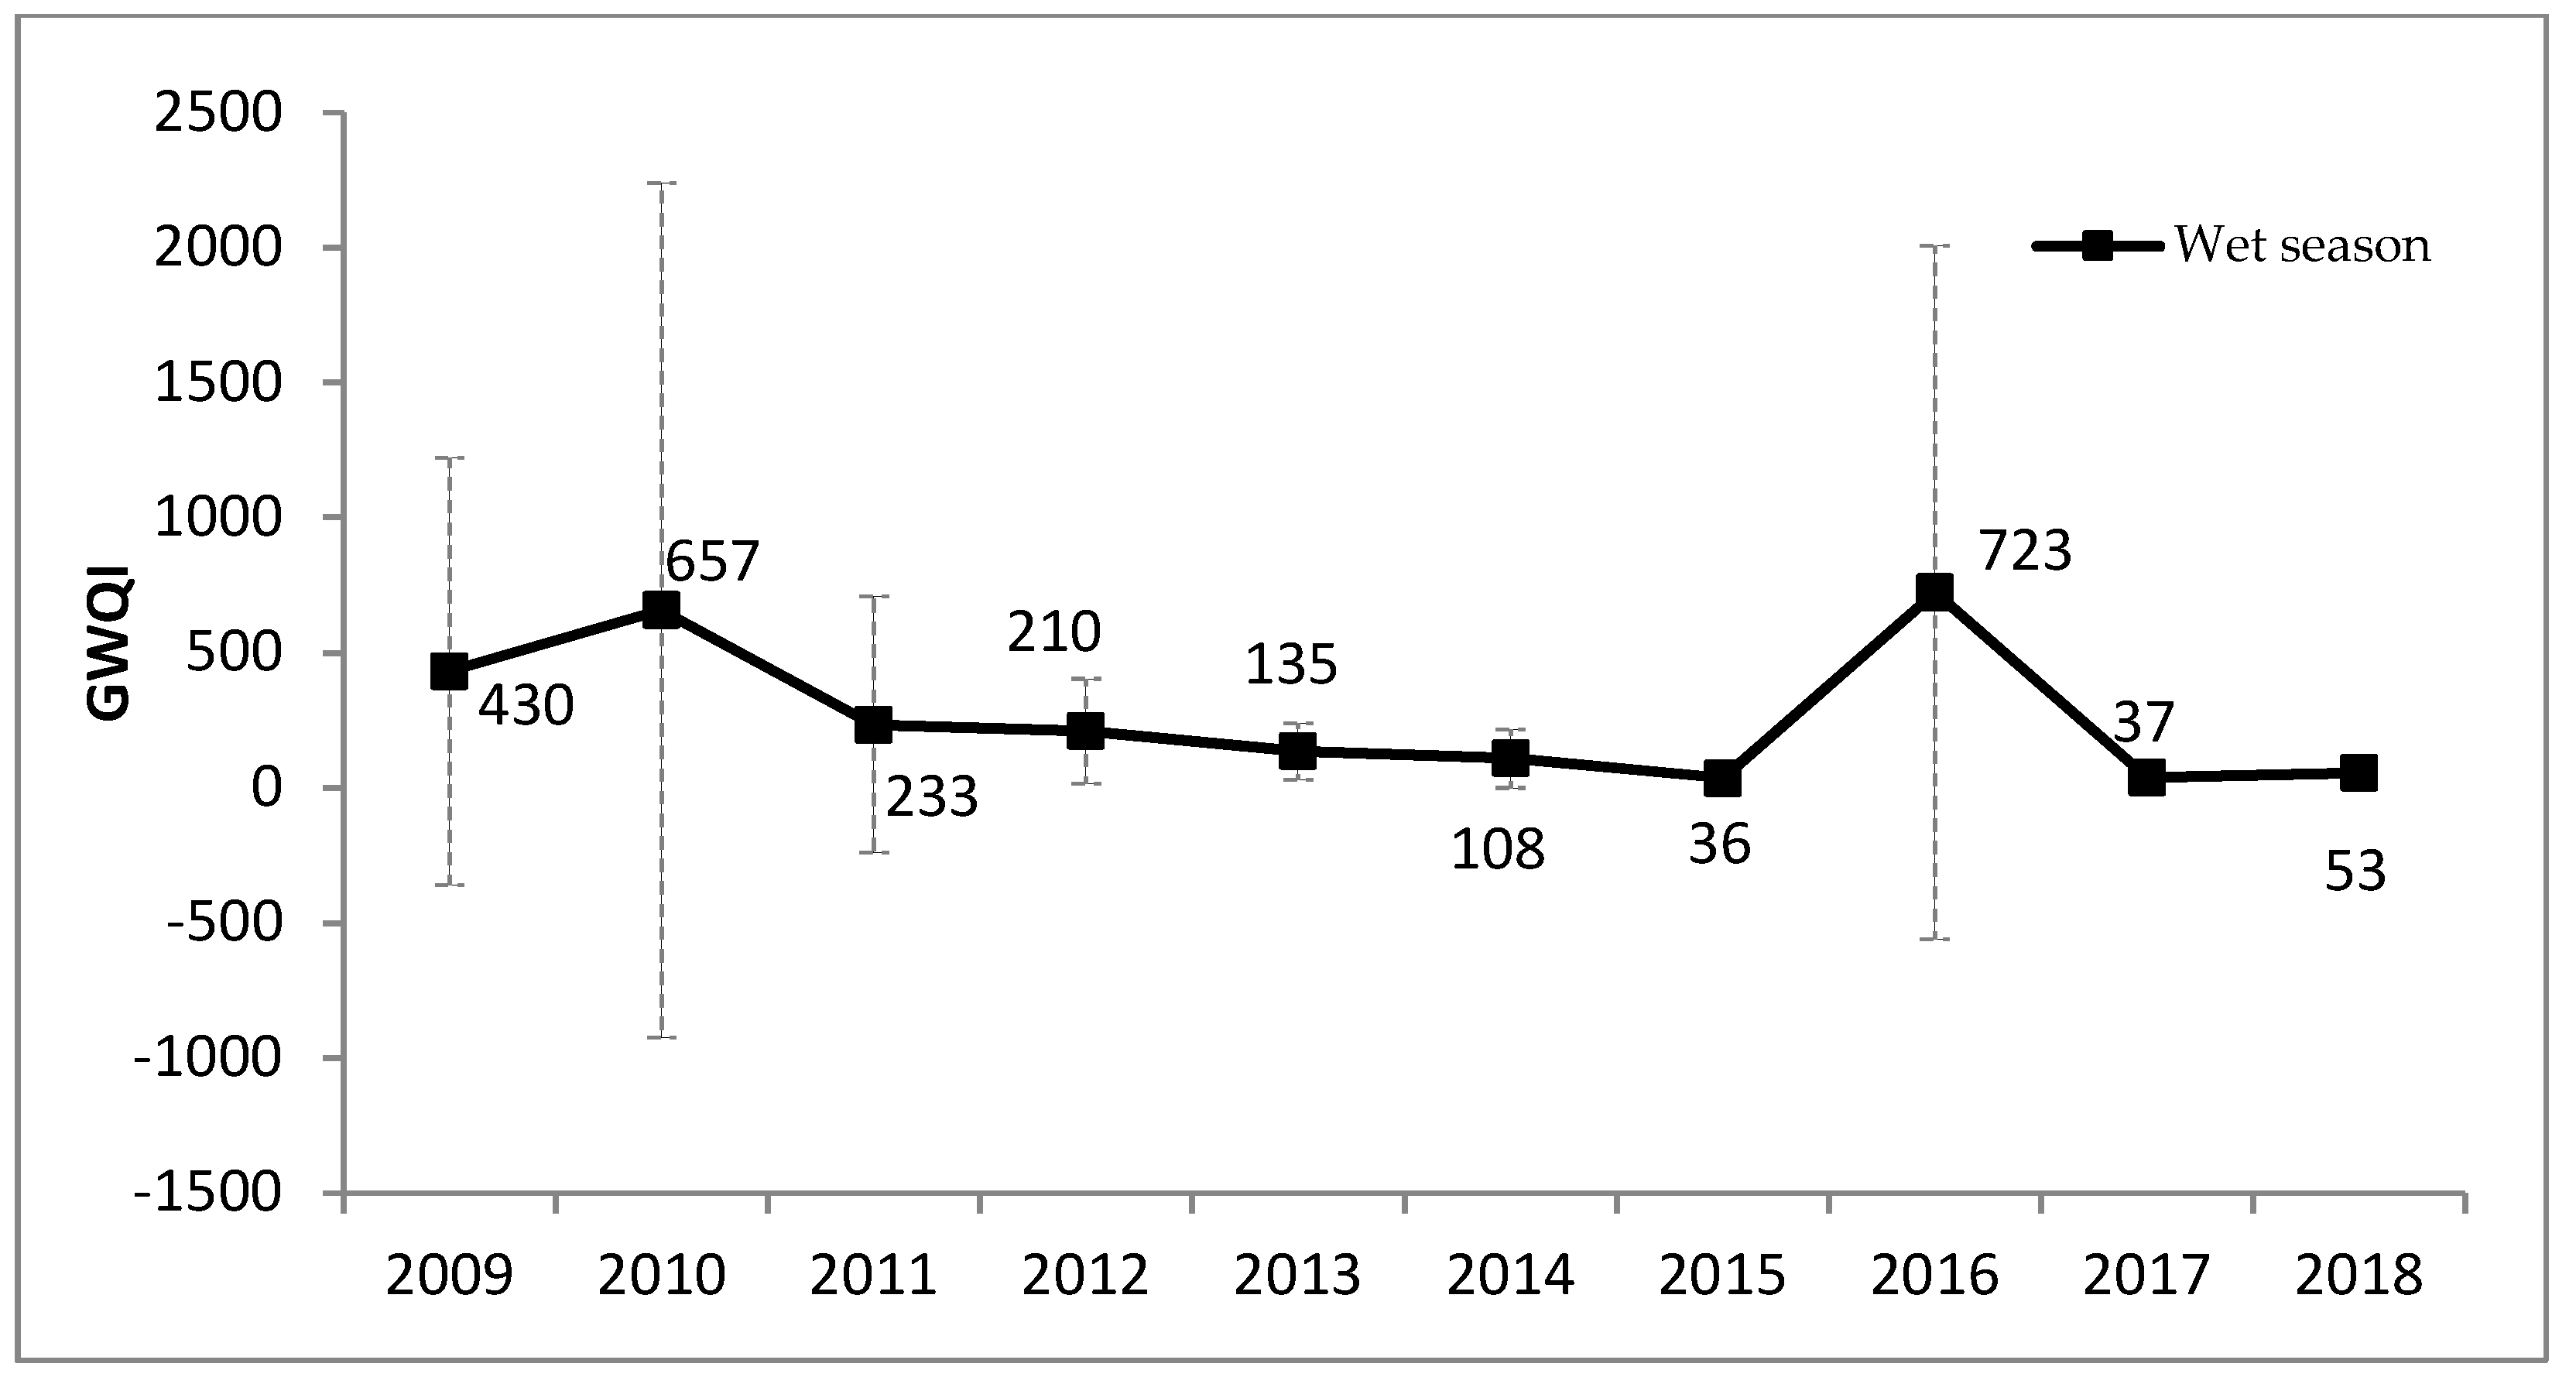
The temporal average WQI changes and percentage of the groundwater samples for different categories for the period of 2009–2018 were presented in Figure 5, Figure 6, Figure 7 and Figure 8, respectively. Observed groundwater quality was better in the dry season as compared to the wet season except for NH4+ (Table A1 and Table A2 in Appendix A). Minh et al. [29] also found NH4+ concentration in surface water in the wet season was higher than in the dry season in An Giang. However, we found that the improvement in water quality took place since 2009. The wide range of the GWQI values from 2009 to 2018 show the best and the worst water quality observed at G6 and G4 in two seasons, respectively. In 2018, the GWQI values at G6 were found to be 47 and 41 units in the dry and wet seasons respectively, while the GWQI at G4 were detected to be 132 and 76 units in the dry season and the wet season, respectively. Net groundwater quality improvement occurred in most wells during the years 2009–2018 except G1, G3, and G4 in the dry season. For example, in the dry season the “Very bad water” group of G1, G3, and G4 experienced 202, 176, and 885 units, respectively in 2009, which improved to be “good” quality level in 2014 at G1 (GWQI = 67 units) compared to G3 and G4, with WQI values of 102 and 161 units to be “bad water” quality, respectively (Figure 6). However, G3, an G4 became “bad water” in 2016 and 2018 while G1 became “unsuitable water for drinking” in 2018. Water quality was significantly improved from “very bad water” quality level at G1, G3, G7, and G8 in the wet season to the “good water” and “excellent water” quality level in 2016 and 2018 in the dry season. The water quality of G4 had not been improved during 2009–2018 in both of the seasons. The water quality in well G5 in the wet season first declined from 2009 to 2012, but it has not recovered to achieve “good water” level in 2014 and in 2018. The well G7 and G8 improved significantly in quality during 2009 to 2018 in both of the seasons (Table A3 and Table A4 in Appendix B). Figure 5 and Figure 8 show the percentage of wells with groundwater quality based on GWQI in the dry and wet seasons, respectively. About 39% of wells were in the “bad water” group from 2009 to 2012, but only 25% of wells were considered to be at “bad water” level in the dry season in 2018.
4.3. Groundwater Quality Assessment
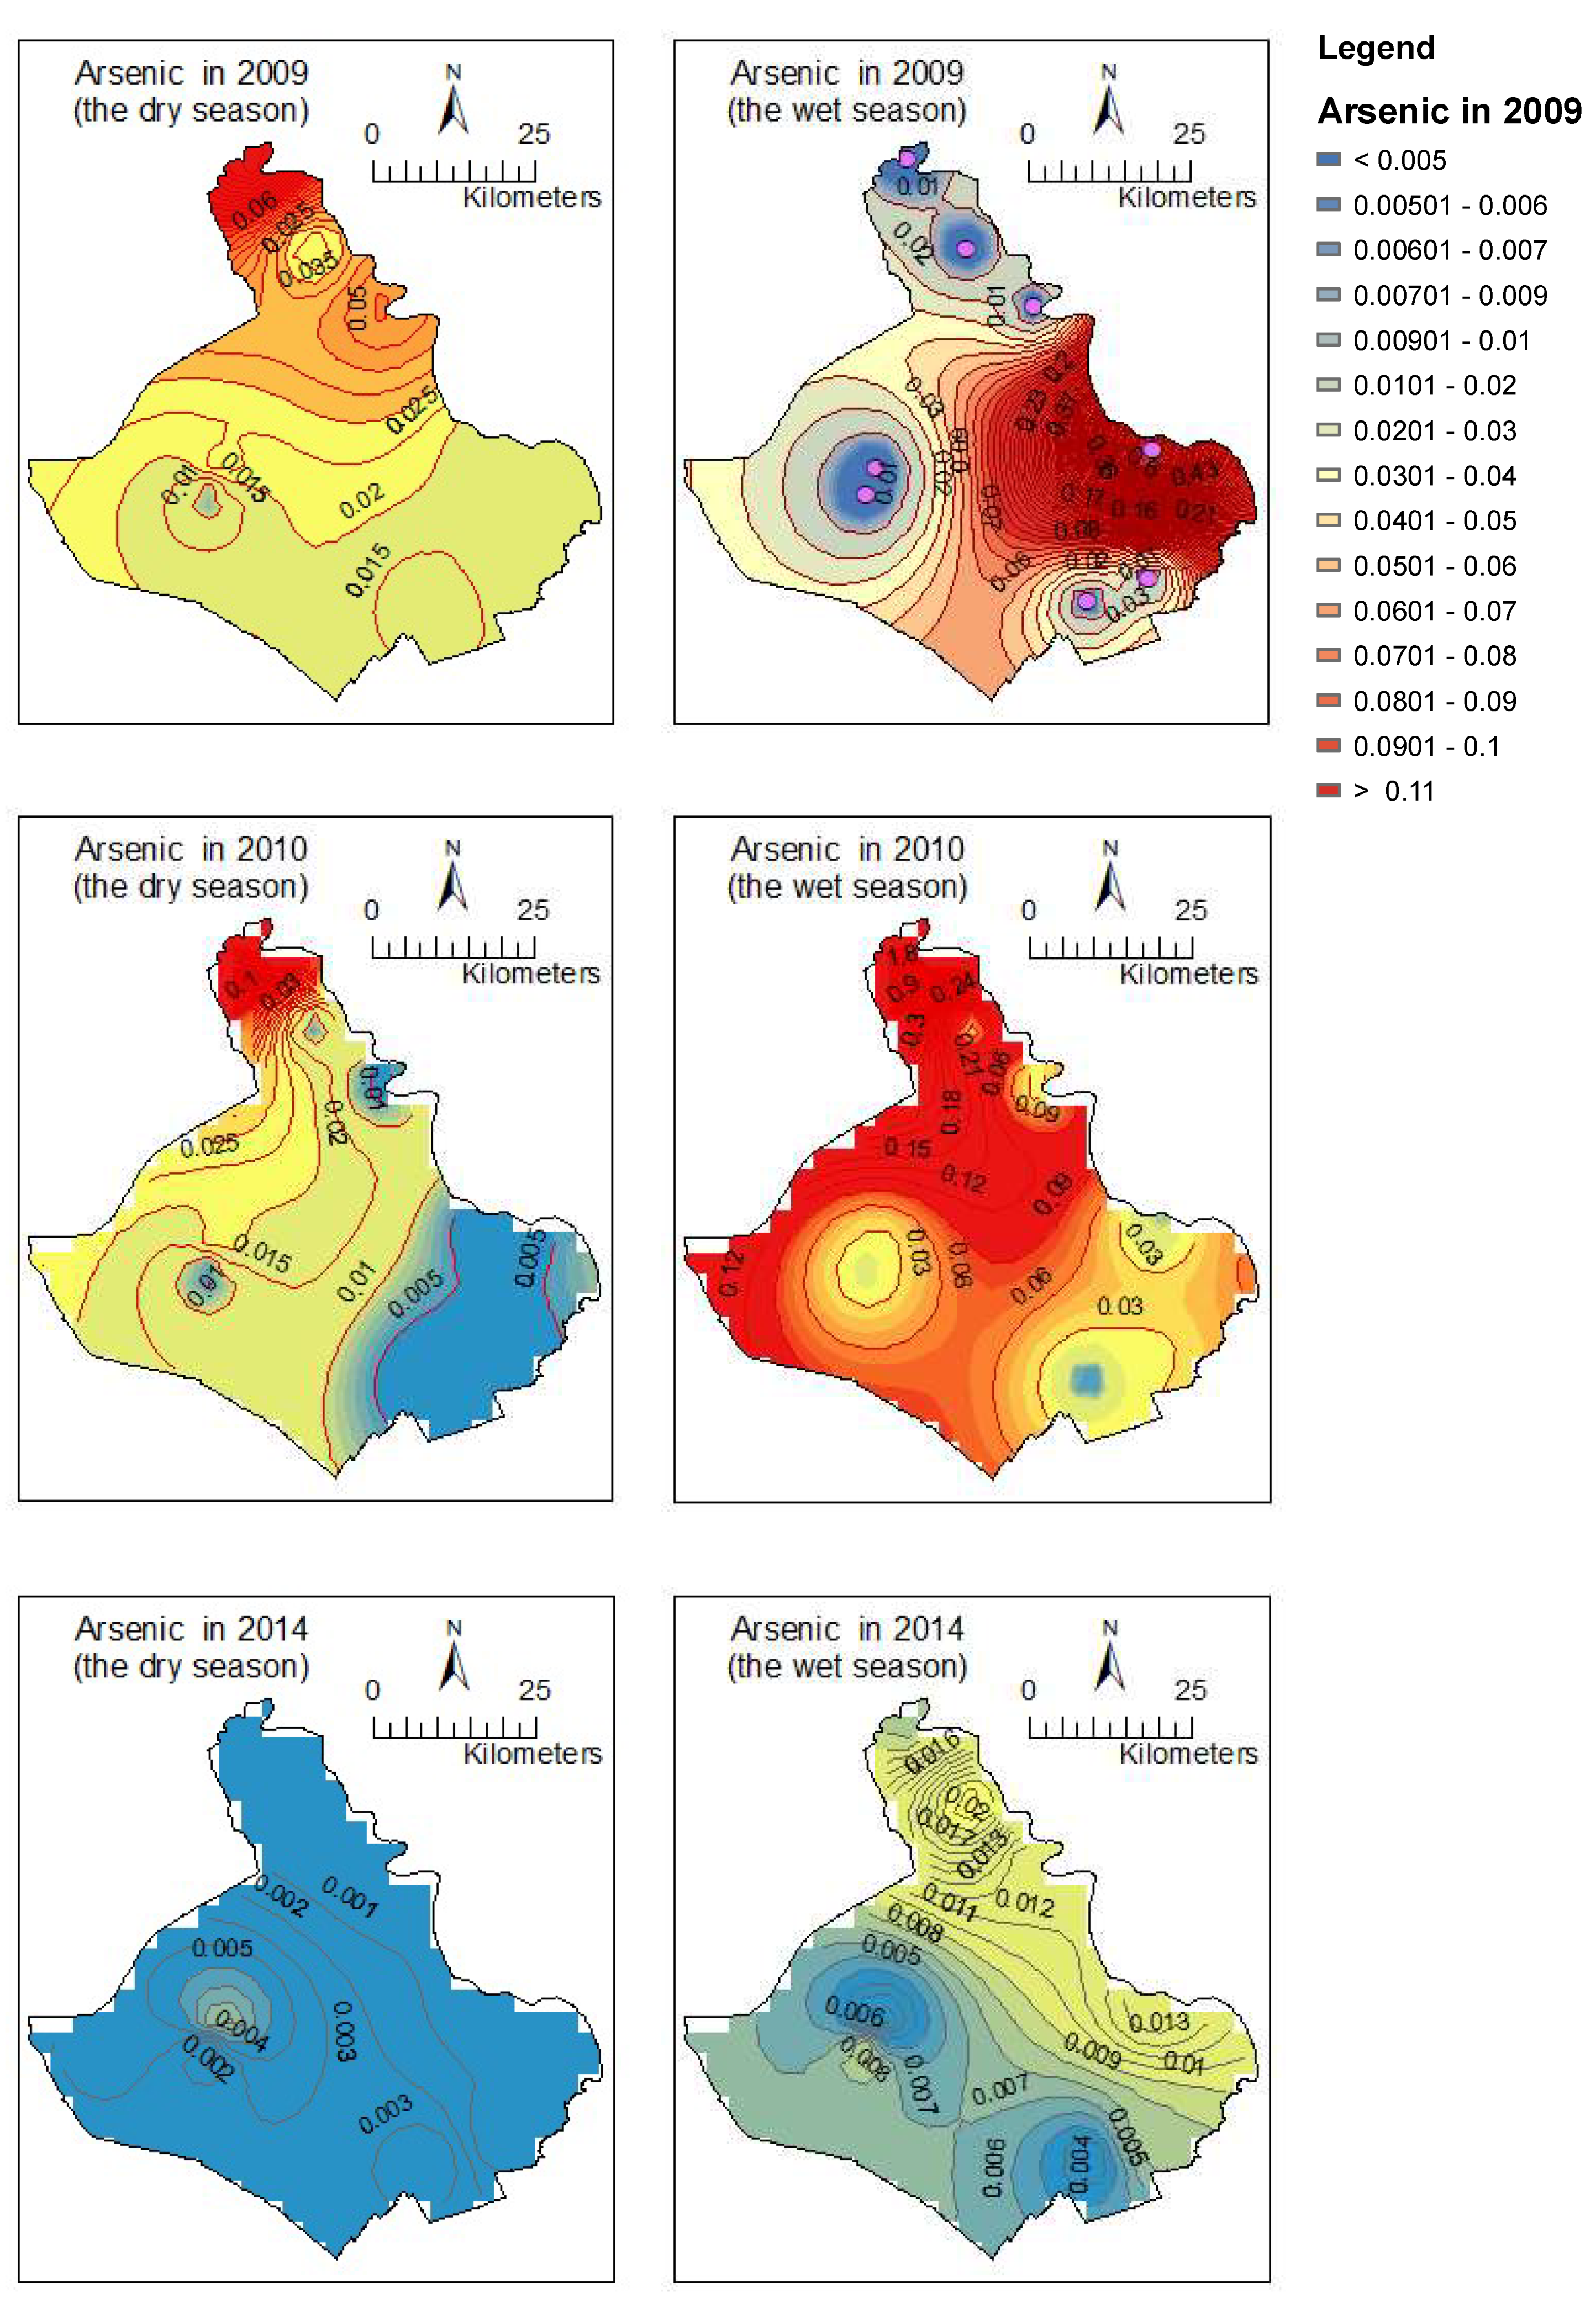
GWQI spatial distribution maps were prepared for the years of 2009, 2013, 2014, and 2018, and classified in accordance with GWQI rating system shown in Figure 9. The spatial distribution maps for As are displayed in Figure A1 in Appendix C. The shallow wells (G1, G3, and G4) had the lowest water quality in different years. Being shallow wells, these sampling locations encounter an aquitard (clay) layer as shown in Figure 1, which enhances the reducing condition inside the aquifer and triggers the arsenic mobilization when exposed to oxidative conditions by oxyhydroxide reduction theory [62]. However, the water quality of the G1 well improved in the two seasons since 2014 and decreased again in the dry season of 2018. The shallow wells G1 and G3 are located at the Northeastern part of An Giang, while G4 is located in the Southeastern part of An Giang. The wells G1, G3, and G4 are located between, and close to, the Mekong and Bassac Rivers. It is well-reported that mobilization is prominent in the river flood plain [63]. Therefore, As concentration was the highest for well numbers G1 and G4, as they are located in the vicinity of the river plain. Also, As had the highest weightage among all water quality parameters. High As concentration led to poor water quality.
In general, As values decreased from 2009 to 2018. The extremely high As concentrations were detected during 2009 and 2010 in both seasons. The highest concentration of As was found in G4 in 2009 at Cho Moi district located in the Southeast region. The second-highest concentration levels of As were identified at well G1 at An Phu district in the Northeast region. Thu et al. [45], Chakraborti et al. [64], and Anh et al. [46] also showed a high concentration of As in the VMD such as An Giang, Long An, and Dong Thap provinces. Arsenic above 0.01 mg/L was typically found in wells with aquifer of Holocene rather than Pleistocene aquifer [64].
5. Discussion
The groundwater sources serve as the main supply for domestic use, and partially for irrigation purposes in areas with less river networks. Understanding groundwater quality can serve policymakers to protect and effectively manage the limited water resources available in the region.
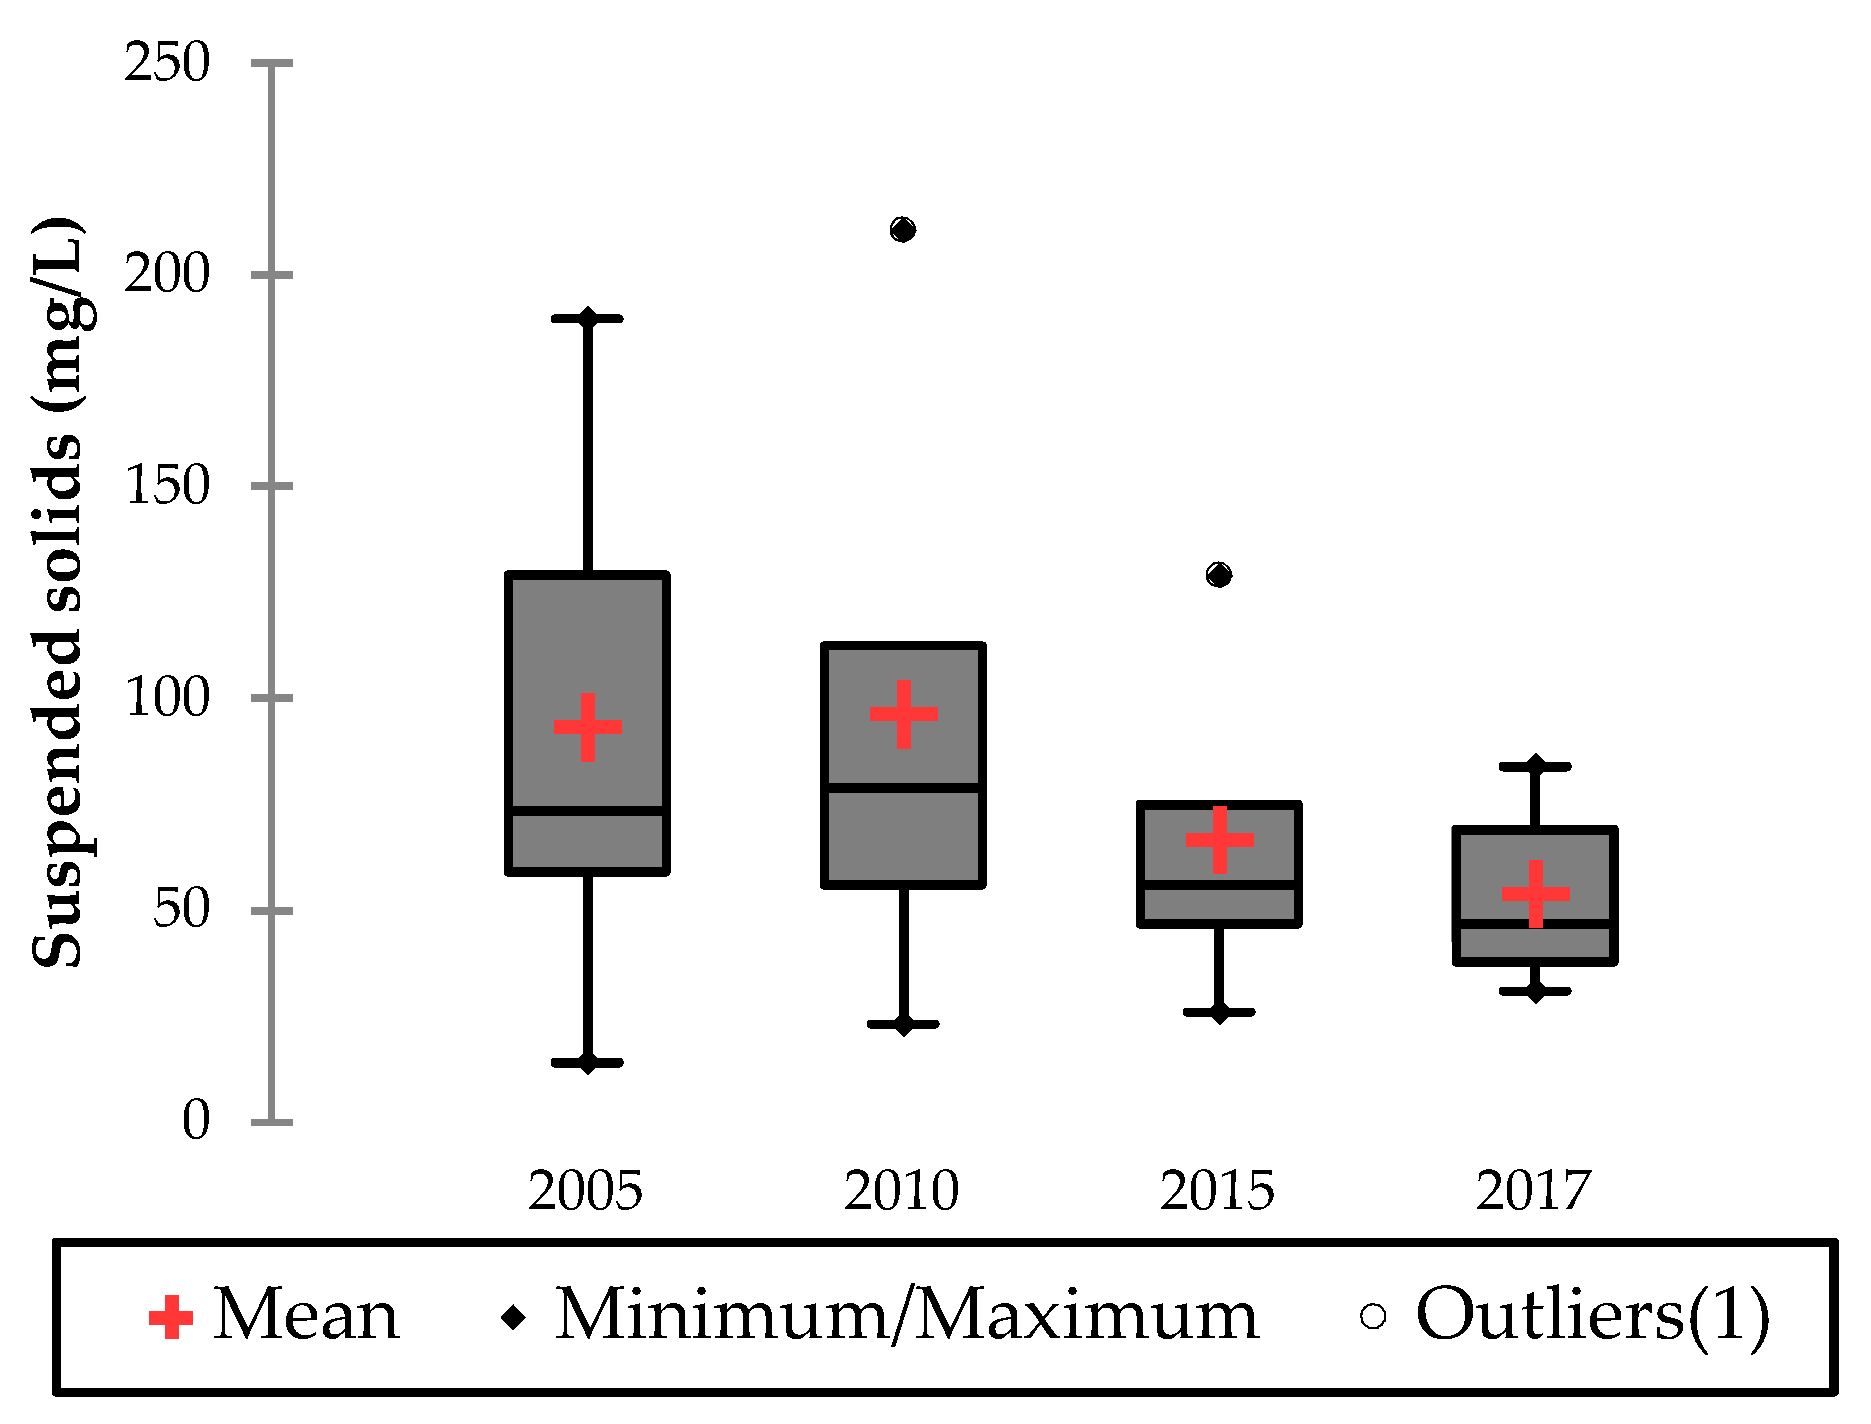
For this study, the Fuzzy-AHP considered As and total iron as the most important factors that affect the GWQI, with a weighted parameter of approximately wi = 0.258. Temporal variation of GWQI suggests that the trend of groundwater quality at eight wells improved from 2009 to 2018 due to less sediment deposition and effective environmental management policies in An Giang. The construction of hydropower plants in the upper Mekong River basin caused a decrease in river discharge and sediment deposition in the study area [48,65]. Ngoc et al. [65] predicted the reduction of sediment at Tan Chau station in the future due to the expansion of hydropower plants. Arsenic contaminant is often found as a result of natural conditions and human activities in Asian countries [66]. Geogenically, As concentration in groundwater is found in young Quaternary deltaic and alluvial sediments and As concentration also related to sediment concentration [66,67]. Moreover, Chuan et al. [67] found the high relationship between sediment and As concentration in China. Figure 10 shows the decreasing trend of suspended solids in surface water from 2005 to 2017 at Long Xuyen station in An Giang. This result was consistent with the reduction of As concentration in the wet season. Besides the water resources, regulation related to water and environmental protection was effectively implemented in An Giang. The decision 1566/QĐ-UBND of “Environmental Protection Planning of An Giang Province up to 2020”, which was issued in 2011 limits the use of chemical fertilizers in agricultural activities, and requires waste treatment systems for raising livestock, poultry and aquatic products basing on national standards and environmental sanitation.
The quality of groundwater greatly improved from 2014 to 2018 as compared to 2009 to 2013. In 2009, four out of eight wells were identified as “bad water” quality to “unsuitable water for drinking” during wet season. In 2013, 75% and 50% of wells achieved “good water” to “excellent water” levels in the dry season and wet season, respectively. In 2018, water quality of six wells in the dry season and seven wells in the wet season achieved “good water” to “excellent water” quality (accounting for 66% in the dry season and 100% in the wet season). However, groundwater quality at well G4 at Cho Moi district was considered mostly “unsuitable water for drinking” from 2009 to 2014 and became “good water” in the wet season in 2018. The shallow wells such as G1, G2, G3, and G4, which achieved a “bad water” quality with high As concentration, lie between the Mekong and Bassac Rivers, which have huge amounts of sediment deposition in monsoon season. This result agrees with other studies by Hoang et al. [64] and Vongphuthone et al. [63]. Arsenic deposition might be caused by huge amounts of sediment deposition during the monsoon season [64,66,67]. The An Giang government recommends treating As in groundwater taken from Holocene and the Upper Pleistocene aquifers before using, especially in the An Phu, Phu Tan, and Cho Moi districts.
The relationship between GWQI and agricultural intensification was not very clear. For example, high GWQI together with high As concentration was found in the Northeast and Southeast regions of An Giang province. However, the Southwestern side of An Giang province, including Thoai Son, and Chau Phu districts located on the left bank of the Bassac River, had slightly higher GWQI but lower As concentration. These regions mentioned above were not using groundwater for irrigation while a triple rice cropping model was mostly cultivated, which means excessive use of fertilizers caused water quality deterioration. On the other hand, only the regions near mountainous areas such as Tri Ton and Tinh Bien districts, where single rice cropping was often applied, extracted groundwater for irrigation. Furthermore, we detected the high values of GWQI links with high As concentration, where single and double rice crops were cultivated. In a nutshell, high As contamination in groundwater was found in agricultural land which used shallow groundwater for irrigation. Here, both the redox aquifer condition and use of phosphate-rich fertilizers lead to As enrichment in the groundwater. Here, microbial colony strongly absorb both As and phosphate while catalyzing reductive dissolution of iron-oxyhydroxide under the reducing condition. On the other hand, with excessive groundwater extraction, aquifer environment becomes oxidative in nature and microbial colonies start decomposing while releasing both As and phosphate. The other potential theory is with the application of phosphate-rich fertilizers, which enhance the competitive exchange of phosphate with As [62]. Findings from Thu et al. [45] supported high As concentration in wells in the Northeast and Southeast regions of An Giang province that are mainly concentrated in the riverside areas with depths of 15–36 m.
The groundwater quality improved in An Giang from 2009 to 2018 mainly due to the effective management of water resources by the An Giang government. Due to the high groundwater pollution observed during mid-2000, policymakers ordered the locals not to use 1460 unused wells during 2005–2009 because these wells were not covered and thus pollution sources may leach to the aquifer, especially in the wet season with deep water levels and inundation. There was effective implementation of decisions, which were issued by An Giang government, such as 69/2010/QD-UBND (in article 8 of chapter 3) and an updated decision version 38/2015/QD-UBND that specified protection of the quality of groundwater by filling unused wells. The government decided to fill the unused wells to prevent mixing of the pollutants from agricultural activities and human waste with the groundwater. Based on the preliminary data in An Giang, in 2017, less than 300 unused wells needed to be continuously filled.
The use of fuzzy logic seems to be the clearest innovation in the last decade, and its use is appropriate for an accurate GWQI. This approach allows for evaluating the impact of each variable on the final index of the quality of the water. However, it remains to establish weighting factors for specific water use. These weighting factors must be locally determined. Also, the weighting partly affects the final index obtained and can change significantly when changing the expert’s awareness and perspective. Therefore, the sensitivity assessment was conducted to reduce the uncertainty by comparison of parameters’ weights in four scenarios based on mean values and SD. The lowest SD in the weight change was selected as the optimal relative weight. However, the disadvantage of pair-wise comparison is the need to repeat calculations as it follows the same step as the pair-wise comparison of each water quality parameters.
Although As concentration in An Giang was under the permissible limits of the National technical regulation on groundwater quality (0.05 mg/L) since 2014, it still exceeds the WHO permissible limit of 0.01 mg/L [50]. There is insufficient evidence to conclude whether agricultural activity affects aquifer. However, we detected a high level of As in regions practicing agricultural production with the extraction of groundwater for irrigation. Many types of setup time reduction problems can be solved by using multiple criteria decision making (MCDM) techniques such as Fuzzy-AHP, but they must be utilized according to the suitability of the problem in order to develop the best decision.
6. Conclusions
This study applied of Fuzzy-AHP in weighing the parameters for calculating GWQI. The results indicated that the groundwater quality of some regions was bad in the year 2009. However, groundwater quality has improved over the years. One of the most important reasons for the poor water quality was the combined effect of both natural and human activities. The lithological structure (sediment deposition) and leaching of chemicals from agricultural runoff might go to groundwater aquifers. The As contaminant from sediment concentration was often found in the shallow aquifer. In recent years, there was less deposition of suspended solids near the flood plains which causes low As concentration. Besides, the An Giang government implemented the effective management of unused water wells by placing restrictions on filling the unused wells in these agricultural areas. Although enhancing the management of unused or abandoned groundwater wells did not eliminate the contamination it can improve aquifer water quality. Thus, the effective management of unused wells is one of the factors that improved groundwater quality in the periods of 2009–2018. The results of this study can help policymakers to make some future plans such as conducting suitability analyses of groundwater quality in different sectors. Another possible area of research is to look for the willingness of farmers to switch to different cropping patterns by growing crops with less water demand as mitigation measures in regions where groundwater has high As concentration.
The GWQI based on the Fuzzy-AHP was successfully applied to assess groundwater quality in An Giang. The weighted parameters via a bottom-up approach provided a better understanding of water quality issues at the local level. More monitoring wells should be installed for diligent and regular monitoring, which will give more reliable GWQI. It is necessary to consider more scenarios to reduce uncertainty at the first stage in terms of pair-wise comparison using Fuzzy-AHP method. Furthermore, we need to consider degrees of confidence and attitudes of experts. Also, we should compare the weighted arithmetic index method to other methods in terms of the weighted parameter values.
Author Contributions
Conceptualization, R.A., M.K., P.K., and H.V.T.M.; methodology, R.A., and H.V.T.M.; software, R.A., T.V.T., D.Q.T., and H.C.B.; validation, R.A., M.K.; original draft preparation, R.A., M.K., P.K., D.Q.T., T.V.T., H.C.B., and H.V.T.M.; review and editing, R.A., M.K., P.K., and H.V.T.M.
Funding
This study is funded in part by the Can Tho University Improvement Project VN14-P6.
Acknowledgments
The authors thank the Vietnamese Ministry of Education and Training, Can Tho University, and Hokkaido University for supporting us to complete this research. Also, the authors appreciate the contributions made by anonymous reviewers.
Conflicts of Interest
The authors declare no conflict of interest.
Appendix A

Table A1.
Statistical summary of physico-chemical parameters for groundwater samples in the dry season in An Giang, during 2009–2018.
Table A1.
Statistical summary of physico-chemical parameters for groundwater samples in the dry season in An Giang, during 2009–2018.
| Well | As | NO3− | pH | NH4+ | CaCO3 | Fe | ||||||
|---|---|---|---|---|---|---|---|---|---|---|---|---|
| Ave ± SD | Range | Ave ± SD | Range | Ave ± SD | Range | Ave ± SD | Range | Ave ± SD | Range | Ave ± SD | Range | |
| G1 | 0.06 ± 0.09 | 0–0.25 | 0.43 ± 1.01 | 0–3.3 | 7 ± 0.51 | 6.6–8.4 | 2.01 ± 2.63 | 0–8.37 | 671 ± 316 | 83–975 | 1.53 ± 3.04 | 0–9.73 |
| G2 | 0.01 ± 0.02 | 0–0.05 | 0.1 ± 0.11 | 0–0.25 | 6.9 ± 0.5 | 6.3–8.3 | 2.09 ± 1.96 | 0–4.80 | 279 ± 352 | 132–1265 | 0.34 ± 0.44 | 0–1.42 |
| G3 | 0.02 ± 0.02 | 0–0.05 | 0.38 ± 0.52 | 0–1.45 | 7.1 ± 0.54 | 6.4–8.2 | 3.17 ± 2.7 | 0–6.28 | 958 ± 823 | 15–1788 | 0.19 ± 0.31 | 0–0.91 |
| G4 | 0.01 ± 0.02 | 0–0.05 | 0.45 ± 0.79 | 0–2.5 | 6.7 ± 0.28 | 6.3–7.1 | 2.65 ± 2.53 | 0–7 | 851 ± 460 | 173–1485 | 0.55 ± 0.49 | 0–1.24 |
| G5 | 0.01 ± 0.01 | 0–0.03 | 0.09 ± 0.19 | 0–0.62 | 7 ± 0.47 | 6.3–7.8 | 0.86 ± 0.67 | 0–2.13 | 648 ± 309 | 166–1063 | 0.28 ± 0.50 | 0–1.58 |
| G6 | 0.01 ± 0.01 | 0–0.02 | 0.08 ± 0.17 | 0–0.56 | 7.1 ± 0.34 | 6.5–7.6 | 0.75 ± 0.63 | 0–1.8 | 284 ± 277 | 14–820 | 1.37 ± 2.62 | 0–8.31 |
| G7 | 0.02 ± 0.01 | 0–0.03 | 3.96 ± 5.44 | 0–14.1 | 7.2 ± 0.25 | 6.5–7.5 | 0.43 ± 0.57 | 0–1.5 | 424 ± 201 | 172–722 | 0.09 ± 0.14 | 0–0.44 |
| G8 | 0.01 ± 0.01 | 0–0.02 | 0.67 ± 1.17 | 0–3.47 | 7 ± 0.32 | 6.4–7.3 | 1.72 ± 1.67 | 0–4.43 | 234 ± 66 | 146–320 | 0.31 ± 0.38 | 0–0.94 |
Table A2.
Statistical summary of physico-chemical parameters for groundwater samples in the wet season in An Giang, during 2009–2018.
Table A2.
Statistical summary of physico-chemical parameters for groundwater samples in the wet season in An Giang, during 2009–2018.
| Well | As | NO3− | pH | NH4+ | CaCO3 | Fe | ||||||
|---|---|---|---|---|---|---|---|---|---|---|---|---|
| Ave ± SD | Range | Ave ± SD | Range | Ave ± SD | Range | Ave ± SD | Range | Ave ± SD | Range | Ave ± SD | Range | |
| G1 | 0.26 ± 0.82 | 0–2.6 | 0.3 ± 0.38 | 0–1.08 | 6.9 ± 0.2 | 6.5–7.2 | 0.70 ± 0.88 | 0–2.86 | 788 ± 216 | 426–1056 | 0.22 ± 0.41 | 0–1.4 |
| G2 | 0.54 ± 1.67 | 0–5.29 | 0.16 ± 0.31 | 0–1.06 | 6.9 ± 0.3 | 6.1–7.3 | 2.39 ± 2.66 | 0–7.08 | 365 ± 417 | 152–1504 | 0.14 ± 0.14 | 0–0.4 |
| G3 | 0.01 ± 0.01 | 0–0.02 | 0.19 ± 0.26 | 0–0.81 | 6.6 ± 0.2 | 6.2–6.9 | 1.71 ± 2.22 | 0–5.25 | 1763 ± 1116 | 171–3966 | 0.16 ± 0.13 | 0–0.34 |
| G4 | 0.84 ± 2.6 | 0–8.35 | 0.28 ± 0.43 | 0–1.29 | 6.5 ± 0.3 | 6.1–6.9 | 2.83 ± 3.01 | 0–10 | 1496 ± 1685 | 129–5996 | 0.52 ± 0.58 | 0–1.48 |
| G5 | 0.55 ± 1.72 | 0–5.44 | 0.03 ± 0.04 | 0–0.11 | 6.7 ± 0.4 | 6.1–7.3 | 0.64 ± 0.95 | 0–2.7 | 651 ± 308 | 83–918 | 0.62 ± 0.94 | 0–2.41 |
| G6 | 0.002 ± 0.003 | 0–0.01 | 0.08 ± 0.14 | 0–0.46 | 6.79 ± 0.3 | 6.2–7.2 | 0.23 ± 0.24 | 0–0.7 | 366 ± 280 | 66–808 | 1.17 ± 2.26 | 0–7.31 |
| G7 | 0.006 ± 0.008 | 0–0.02 | 10 ± 14.78 | 0–38.5 | 6.9 ± 0.2 | 6.6–7.4 | 1.15 ± 1.93 | 0–4.7 | 521 ± 294 | 208–1228 | 0.42 ± 0.995 | 0–3.23 |
| G8 | 0.005 ± 0.005 | 0–0.01 | 1.04 ± 2.14 | 0–6.26 | 6.8 ± 0.3 | 6.5–7.2 | 0.66 ± 0.88 | 0–2.32 | 270 ± 193 | 116–730 | 2.28 ± 4.99 | 0–14.6 |
Appendix B
Table A3.
Annual Groundwater classification based on WQI in the dry season.
| 2009 | 2010 | 2011 | 2012 | 2013 | 2014 | 2015 | 2016 | 2017 | 2018 | |
|---|---|---|---|---|---|---|---|---|---|---|
| G1 | Very bad | Very bad | Unsuitable for drinking | Good | Good | Good | Good | Excellent | Excellent | Very bad |
| G2 | Good | Excellent | Very bad | Good | Good | Good | Excellent | Excellent | Good | Good |
| G3 | Bad | Excellent | Excellent | Bad | Bad | Bad | Excellent | Bad | N/A | N/A |
| G4 | Unsuitable for drinking | Bad | Excellent | Unsuitable for drinking | Unsuitable for drinking | Bad | Excellent | Bad | Good | Bad |
| G5 | Good | Excellent | Good | Excellent | Good | Good | Excellent | Excellent | Good | Good |
| G6 | Excellent | Excellent | Excellent | Good | Excellent | Excellent | Excellent | Excellent | Good | Excellent |
| G7 | Good | Excellent | Bad | Very bad | Excellent | Excellent | Excellent | Excellent | Excellent | Excellent |
| G8 | Excellent | Excellent | Good | Good | Excellent | Excellent | Good | Excellent | N/A | N/A |
Table A4.
Annual Groundwater classification based on WQI in the wet season.
| 2009 | 2010 | 2011 | 2012 | 2013 | 2014 | 2015 | 2016 | 2017 | 2018 | |
|---|---|---|---|---|---|---|---|---|---|---|
| G1 | Excellent | Unsuitable for drinking | Good | Good | Good | Good | Good | Excellent | Excellent | Good |
| G2 | Good | Good | Bad | Good | Bad | Excellent | Excellent | Unsuitable for drinking | Good | Good |
| G3 | Bad | Good | Very bad | Bad | Bad | Good | Excellent | Excellent | N/A | N/A |
| G4 | Unsuitable for drinking | Bad | Unsuitable for drinking | Unsuitable for drinking | Unsuitable for drinking | Very bad | Good | Excellent | Good | Good |
| G5 | Excellent | Good | Unsuitable for drinking | Very bad | Excellent | Excellent | Excellent | Unsuitable for drinking | Excellent | Excellent |
| G6 | Excellent | Excellent | Excellent | Good | Excellent | Excellent | Excellent | Excellent | Excellent | Excellent |
| G7 | Very bad | Good | Bad | Good | Bad | Excellent | Excellent | Excellent | Excellent | Excellent |
| G8 | Bad | Excellent | Excellent | Good | Excellent | Excellent | Excellent | Excellent | N/A | N/A |
Appendix C
Figure A1.
Concentrations of As (mg/L) were displayed by IDW in An Giang province.
References
- Pomerol, J.-C.; Sergio, B.-R. Multicriterion Decision in Management: Principles and Practice; Kluwer Academic Publishers: Dordrecht, The Netherlands, 2000; ISBN 978-1-46-154459-3. [Google Scholar]
- Zavadskas, E.; Turskis, Z. Multiple Criteria Decision Making (MCDM) Methods in Economics: An Overview. Technol. Econ. Dev. Econ. 2011, 17, 397–427. [Google Scholar] [CrossRef]
- Büyüközkan, G.; Feyzioğlu, O.; Nebol, E. Selection of the strategic alliance partner in logistics value chain. Int. J. Prod. Econ. 2008, 113, 148–158. [Google Scholar] [CrossRef]
- Saaty, T.L. The Analytic Hierarchy Process; McGraw-Hill: New York, NY, USA, 1980. [Google Scholar]
- Zadeh, L.A. Fuzzy sets. Inf. Control 1965, 8, 338–353. [Google Scholar] [CrossRef] [Green Version]
- Karakuş, C.B. Evaluation of groundwater quality in Sivas province (Turkey) using water quality index and GIS-based analytic hierarchy process. Int. J. Environ. Health Res. 2018, 1–20. [Google Scholar] [CrossRef] [PubMed]
- Larimian, T.; Zarabadi, Z.S.S.; Sadeghi, A. Developing a fuzzy AHP model to evaluate environmental sustainability from the perspective of Secured by Design scheme—A case study. Sustain. Cities Soc. 2013, 7, 25–36. [Google Scholar] [CrossRef]
- Petkovic, J.; Sevarac, Z.; Jaksic, M.L.; Marinkovic, S. Application of fuzzy AHP method for choosing a technology within service company. Technics Technol. Educ. Manag. 2012, 7, 332–341. [Google Scholar]
- Bellman, R.E.; Zadeh, L.A. Decision making in a fuzzy environment. Manag. Sci. 1970, 17, 141–164. [Google Scholar] [CrossRef]
- Renigier-Bilozor, M.; Janowski, A.; Walacik, M. Geoscience Methods in Real Estate Market Analyses Subjectivity Decrease. Geosciences 2019, 9, 130. [Google Scholar] [CrossRef]
- Lermontov, A.; Yokoyama, L.; Lermontov, M.; Machado, M.A.S. River quality analysis using fuzzy water quality index: Ribeira do Iguape river watershed, Brazil. Ecol. Indic. 2009, 9, 1188–1197. [Google Scholar] [CrossRef]
- Casillas, J.; Francisco, J.M.-L. Marketing Intelligent Systems Using Soft Computin: Manageral and Research Applications; Springer: New York, NY, USA, 2010. [Google Scholar]
- Kahraman, C.; Kaya, İ. A fuzzy multicriteria methodology for selection among energy alternatives. Expert Syst. Appl. Int. J. 2010, 37, 6270–6281. [Google Scholar] [CrossRef]
- Ayhan, M.B. A Fuzzy AHP Approach for Supplier Selection Problem: A Case Study in a Gear Motor Company. Int. J. Manag. Value Supply Chains (IJMVSC) 2013, 4, 2886. [Google Scholar]
- Baghapour, M.A.; Shooshtarian, M.R. Extending a Consensus-based Fuzzy Ordered Weighting Average (FOWA) Model in New Water Quality Indices. Iran. J. Health Saf. Environ. 2017, 4, 824–834. [Google Scholar]
- Shooshtarian, M.R.; Dehghani, M.; Margherita, F.; Gea, O.C.; Mortezazadeh, S. Land use change and conversion effects on ground water quality trends: An integration of land change modeler in GIS and a new Ground Water Quality Index developed by fuzzy multi-criteria group decision-making models. Food Chem. Toxicol. 2018, 114, 204–214. [Google Scholar] [CrossRef] [PubMed]
- Azarnivand, A.; Hashemi-Madani, F.S.; Banihabib, M.E. Extended fuzzy analytic hierarchy process approach in water and environmental management (case study: Lake Urmia Basin, Iran). Environ. Earth Sci. 2015, 73, 13–26. [Google Scholar] [CrossRef]
- Deng, H. Multicriteria analysis with fuzzy pairwise comparison. Int. J. Approx. Reason. 1999, 21, 215–231. [Google Scholar] [CrossRef] [Green Version]
- Goyal, M.K.; Bharti, B.; Quilty, J.; Adamowski, J.; Pandey, A. Modeling of daily pan evaporation in sub tropical climates using ANN, LS-SVR, Fuzzy Logic, and ANFIS. Expert Syst. Appl. 2014, 41, 5267–5276. [Google Scholar] [CrossRef]
- Moghaddamnia, A.; Ghafari Gousheh, M.; Piri, J.; Amin, S.; Han, D. Evaporation estimation using artificial neural networks and adaptive neuro-fuzzy inference system techniques. Adv. Water Resour. 2009, 32, 88–97. [Google Scholar] [CrossRef]
- Firat, M.; Güngör, M. Monthly total sediment forecasting using adaptive neuro fuzzy inference system. Stoch. Environ. Res. Risk Assess. 2010, 24, 259–270. [Google Scholar] [CrossRef]
- Ren, L.; Xiang, X.-Y.; Ni, J.-J. Forecast Modeling of Monthly Runoff with Adaptive Neural Fuzzy Inference System and Wavelet Analysis. J. Hydrol. Eng. 2013, 18, 1133–1139. [Google Scholar] [CrossRef]
- Wang, K.-H. Altunkaynak Abdusselam Comparative Case Study of Rainfall-Runoff Modeling between SWMM and Fuzzy Logic Approach. J. Hydrol. Eng. 2012, 17, 283–291. [Google Scholar] [CrossRef]
- Casper, M.; Gemmar, P.; Gronz, O.; Johst, M.; Stüber, M. Fuzzy logic-based rainfall—runoff modelling using soil moisture measurements to represent system state. Hydrol. Sci. J. 2007, 52, 478–490. [Google Scholar] [CrossRef]
- Aryafar, A.; Yousefi, S.; Doulati Ardejani, F. The weight of interaction of mining activities: Groundwater in environmental impact assessment using fuzzy analytical hierarchy process (FAHP). Environ. Earth Sci. 2013, 68, 2313–2324. [Google Scholar] [CrossRef]
- Minh, H.V.T.; Ngoc, D.T.H.; Ngan, H.Y.; Men, H.V.; Van, T.N.; Ty, T.V. Assessment of Groundwater Level and Quality: A Case Study in O Mon and Binh Thuy Districts, Can Tho City, Vietnam. Fac. Eng. Naresuan Univ. 2016, 11, 25–33. [Google Scholar]
- Saraswat, C.; Kumar, P.; Dasgupta, R.; Avtar, R.; Bhalani, P. Sustainability assessment of the groundwater quality in the Western India to achieve urban water security. Appl. Water Sci. 2019, 9, 73. [Google Scholar] [CrossRef] [Green Version]
- Avtar, R.; Kumar, P.; Singh, C.K.; Sahu, N.; Verma, R.L.; Thakur, J.K.; Mukherjee, S. Hydrogeochemical Assessment of Groundwater Quality of Bundelkhand, India Using Statistical Approach. Water Qual. Expo. Health 2013, 5, 105–115. [Google Scholar] [CrossRef]
- Minh, H.V.T.; Kurasaki, M.; Van Ty, T.; Tran, D.Q.; Le, K.N.; Avtar, R.; Rahman, M.; Osaki, M. Effects of Multi-Dike Protection Systems on Surface Water Quality in the Vietnamese Mekong Delta. Water 2019, 11, 1010. [Google Scholar] [CrossRef]
- Singh, C.K.; Shashtri, S.; Mukherjee, S.; Kumari, R.; Avatar, R.; Singh, A.; Singh, R.P. Application of GWQI to Assess Effect of Land Use Change on Groundwater Quality in Lower Shiwaliks of Punjab: Remote Sensing and GIS Based Approach. Water Resour. Manag. 2011, 25, 1881–1898. [Google Scholar] [CrossRef]
- Horton, R.K. An index number system for rating water quality. J. Water Pollut. Control Fed. 1965, 37, 300–305. [Google Scholar]
- Tyagi, S.; Sharma, B.; Singh, P.; Dobhal, R. Water Quality Assessment in Terms of Water Quality Index. Am. J. Water Resour. 2013, 1, 34–38. [Google Scholar]
- Brown, R.M.; McClelland, N.I.; Deininger, R.A.; Tozer, R.G. A Water Quality Index: Do We Dare? Water Sew. Works 1970, 117, 339–343. [Google Scholar]
- Bhargava, D.S.; Saxena, B.S.; Dewakar, R.W. A study of geo-pollutants in the Godavary river basin in India. Asian Environ. 1998, 12, 36–59. [Google Scholar]
- Campbell, I. Review of the MRC Water Quality Indices; Mekong River Commission: Vientiane, Laos, 2014. [Google Scholar]
- Asadi, S.S.; Vuppala, P.; Reddy, M.A. Remote sensing and GIS techniques for evaluation of groundwater quality in municipal corporation of Hyderabad (Zone-V), India. Int. J. Environ. Res. Public Health 2007, 4, 45–52. [Google Scholar] [CrossRef]
- Maheswaran, G.; Elangovan, K. Groundwater Quality Evaluation in Salem District, Tamil Nadu, Based on Water Quality Index. Int. Q. Sci. 2014, 13, 547–552. [Google Scholar]
- Chang, D.-Y. Applications of the extent analysis method on fuzzy AHP. Eur. J. Oper. Res. 1996, 95, 649–655. [Google Scholar] [CrossRef]
- Zarghami, M.; Szidarovszky, F. Group decision support system for ranking of water resources projects. In Proceedings of the 3rd International Conference on Water Resources and Arid Environments (2008) and the 1st Arab Water Forum, Riyadh, Saudi Arabia, 16–19 November 2008. [Google Scholar]
- Avtar, R.; Kumar, P.; Singh, C.; Mukherjee, S. A comparative study on hydrogeochemistry of Ken and Betwa Rivers of Bundelkhand using statistical approach. Water Qual. Expo. Health 2011, 2, 169–179. [Google Scholar] [CrossRef]
- Avtar, R.; Kumar, P.; Surjan, A.; Gupta, L.; Roychowdhury, K. Geochemical processes regulating groundwater chemistry with special reference to nitrate and fluoride enrichment in Chhatarpur area, Madhya Pradesh, India. Environ. Earth Sci. 2013, 70, 1699–1708. [Google Scholar] [CrossRef]
- Wilbers, G.-J.; Becker, M.; Nga, L.T.; Sebesvari, Z.; Renaud, F.G. Spatial and temporal variability of surface water pollution in the Mekong Delta, Vietnam. Sci. Total Environ. 2014, 485, 653–665. [Google Scholar] [CrossRef]
- Thuy, P.T.; Van Geluwe, S.; Nguyen, V.-A.; Van der Bruggen, B. Current pesticide practices and environmental issues in Vietnam: Management challenges for sustainable use of pesticides for tropical crops in (South-East) Asia to avoid environmental pollution. J. Mater. Cycles Waste Manag. 2012, 14, 379–387. [Google Scholar] [CrossRef]
- National technical regulation on ground water quality (QCVN 09-MT: 2015/btnmt). Available online: https://text.123doc.org/document/3552981-qcvn-09mt-2015btnmt-national-technical-regulation-on-ground-water-quality.htm (accessed on 27 July 2019).
- Thu, T.A.; Tinh, T.K.; Minh, V.Q. Investigating sources of arsenic contamination in groundwater in An Phu district. J. Cantho Univ. 2011, 17a, 118–123. [Google Scholar]
- Anh, P.K.; Giao, N.T. Groundwater Quality and Human Health Risk Assessment Related to Groundwater Consumption in an Giang Province. J. Heavy Met. Toxicity Dis. 2018, 3. [Google Scholar] [CrossRef]
- Tuan, L.A.; Minh, H.V.T.; Tuan, D.D.A.; Thao, N.T.P. Baseline Study for Community Based Water Management Project; Mekong Water Governance Program Vietnam: Hanoi, Vietnam, 2015. [Google Scholar]
- Dat, T.Q.; Kanchit, L.; Thares, S.; Trung, N.H. Modeling the Influence of River Discharge and Sea Level Rise on Salinity Intrusion in Mekong Delta. In Proceedings of the the 1st Environment Asia International Conference, Bangkok, Thailand, 23–26 March 2011. [Google Scholar]
- Van Ty, T.; Sunada, K.; Ichikawa, Y. Water resources management under future development and climate change impacts in the Upper Srepok River Basin, Central Highlands of Vietnam. Water Policy 2012, 14, 725–745. [Google Scholar] [CrossRef]
- Minh, H.V.T.; Avtar, R.; Mohan, G.; Misra, P.; Kurasaki, M. Monitoring and Mapping of Rice Cropping Pattern in Flooding Area in the Vietnamese Mekong Delta Using Sentinel-1A Data: A Case of An Giang Province. ISPRS Int. J. Geo-Inf. 2019, 8, 211. [Google Scholar] [CrossRef]
- South Vietnam geological mapping division Project of Impact assessment of climate change to land water resources in the Mekong Delta proposal of response solutions. South Vietnam Geological Mapping Division. Tp Ho Chi Minh, Vietnam 2013.
- Hung, D.; Bang, N.; Giang, P. Groundwater Resources of the Mekong Delta and Studying Areas. South. Geol. Div. Hydrogeol. Eng. Geol. 1998. [Google Scholar]
- DONRE. Water Resource Distribution in An Giang; Department of Natural Resources and Environment (DONRE): Melbourne, Australia.
- Department of Natural Resources and Environment (DONRE). Report on Environmental Status in An Giang Province, 2005–2009; Department of Natural Resources and Environment: Long Xuyen, An Giang, Vietnam, 2010; p. 152.
- General Statistical Office of Vietnam (GSO). Statistical Yearbook of An Giang 2012; General Statistical Office of Vietnam (GSO): Hanoi, Vietnam, 2013.
- Greenberg, A.E.; Clesceri, L.S.; Eaton, A.D. Standard Methods for the Examination of Water and Wastewater; American Public Health Association: Washington, DC, USA, 1992; ISBN 087-5-53-2071. [Google Scholar]
- Soberi, M.S.F.; Ahmad, R. Application of fuzzy AHP for setup reduction in manufacturing industry. J. Eng. Res. Educ. 2016, 8, 73–84. [Google Scholar]
- Buckley, J.J. Fuzzy hierarchical analysis. Fuzzy Sets Syst. 1985, 17, 233–247. [Google Scholar] [CrossRef]
- Ministry of Natural Resources and Environment. National Technical Regulation on Ground Water Quality; Ministry of Natural Resources and Environment: Hanoi, Vietnam, 2015.
- Ashiyani, N.; Suryanarayana, T.M.V. Assessment of groundwater quality using GWQI method—A case study of nadiad taluka, Gujarat, India. In Proceedings of the 20th International Conference on Hydraulics, Water Resources and River Engineering, Roorkee, India, 17–19 December 2015. [Google Scholar]
- Rupal, M.; Tanushree, B.; Sukalyan, C. Quality Characterization of Groundwater using Water Quality Index in Surat city, Gujarat, India. Int. Res. J. Environ. Sci. 2012, 1, 14–23. [Google Scholar]
- McArthur, J.; Banerjee, D.; Hudson-Edwards, K.; Mishra, R.; Purohit, R.; Ravenscroft, P.; Cronin, A.; Howarth, R.; Chatterjee, A.; Talukder, T. Natural organic matter in sedimentary basins and its relation to arsenic in anoxic ground water: The example of West Bengal and its worldwide implications. Appl. Geochem. 2004, 19, 1255–1293. [Google Scholar] [CrossRef]
- Chakraborti, D.; Singh, K.S.; Rahman, M.M.; Dutta, N.R.; Mukherjee, C.S.; Pati, S.; Kar, B.P. Groundwater Arsenic Contamination in the Ganga River Basin: A Future Health Danger. Int. J. Environ. Res. Public Health 2018, 15, 180. [Google Scholar] [CrossRef]
- Hoang, T.H.; Bang, S.; Kim, K.-W.; Nguyen, M.H.; Dang, D.M. Arsenic in groundwater and sediment in the Mekong River delta, Vietnam. Environ. Pollut. 2010, 158, 2648–2658. [Google Scholar] [CrossRef]
- Ngoc, T.A. Assessing the Effects of Upstream Dam Developments on Sediment Distribution in the Lower Mekong Delta, Vietnam. J. Water Resour. Prot. 2017, 9, 822–840. [Google Scholar] [CrossRef] [Green Version]
- Vongphuthone, B.; Kobayashi, M.; Igarashi, T. Factors affecting arsenic content of unconsolidated sediments and its mobilization in the Ishikari Plain, Hokkaido, Japan. Environ. Earth Sci. 2017, 76, 645. [Google Scholar] [CrossRef]
- de Chuan, G.; Zhi-min, W. Analysis of the source of arsenic in the Yellow River and its relation to sediment. IAHS-AISH Publ. 1986, 156, 249–255. [Google Scholar]
Figure 1.
Study area map with the location of monitoring wells and Tan Chau hydrological station on Mekong River. Discharge data were collected from the Southern Regional Hydrometeorology Center in Vietnam, during 2009–2017. The geological data were collected from the Southern Geological Division geohydrology and Engineering Geology.
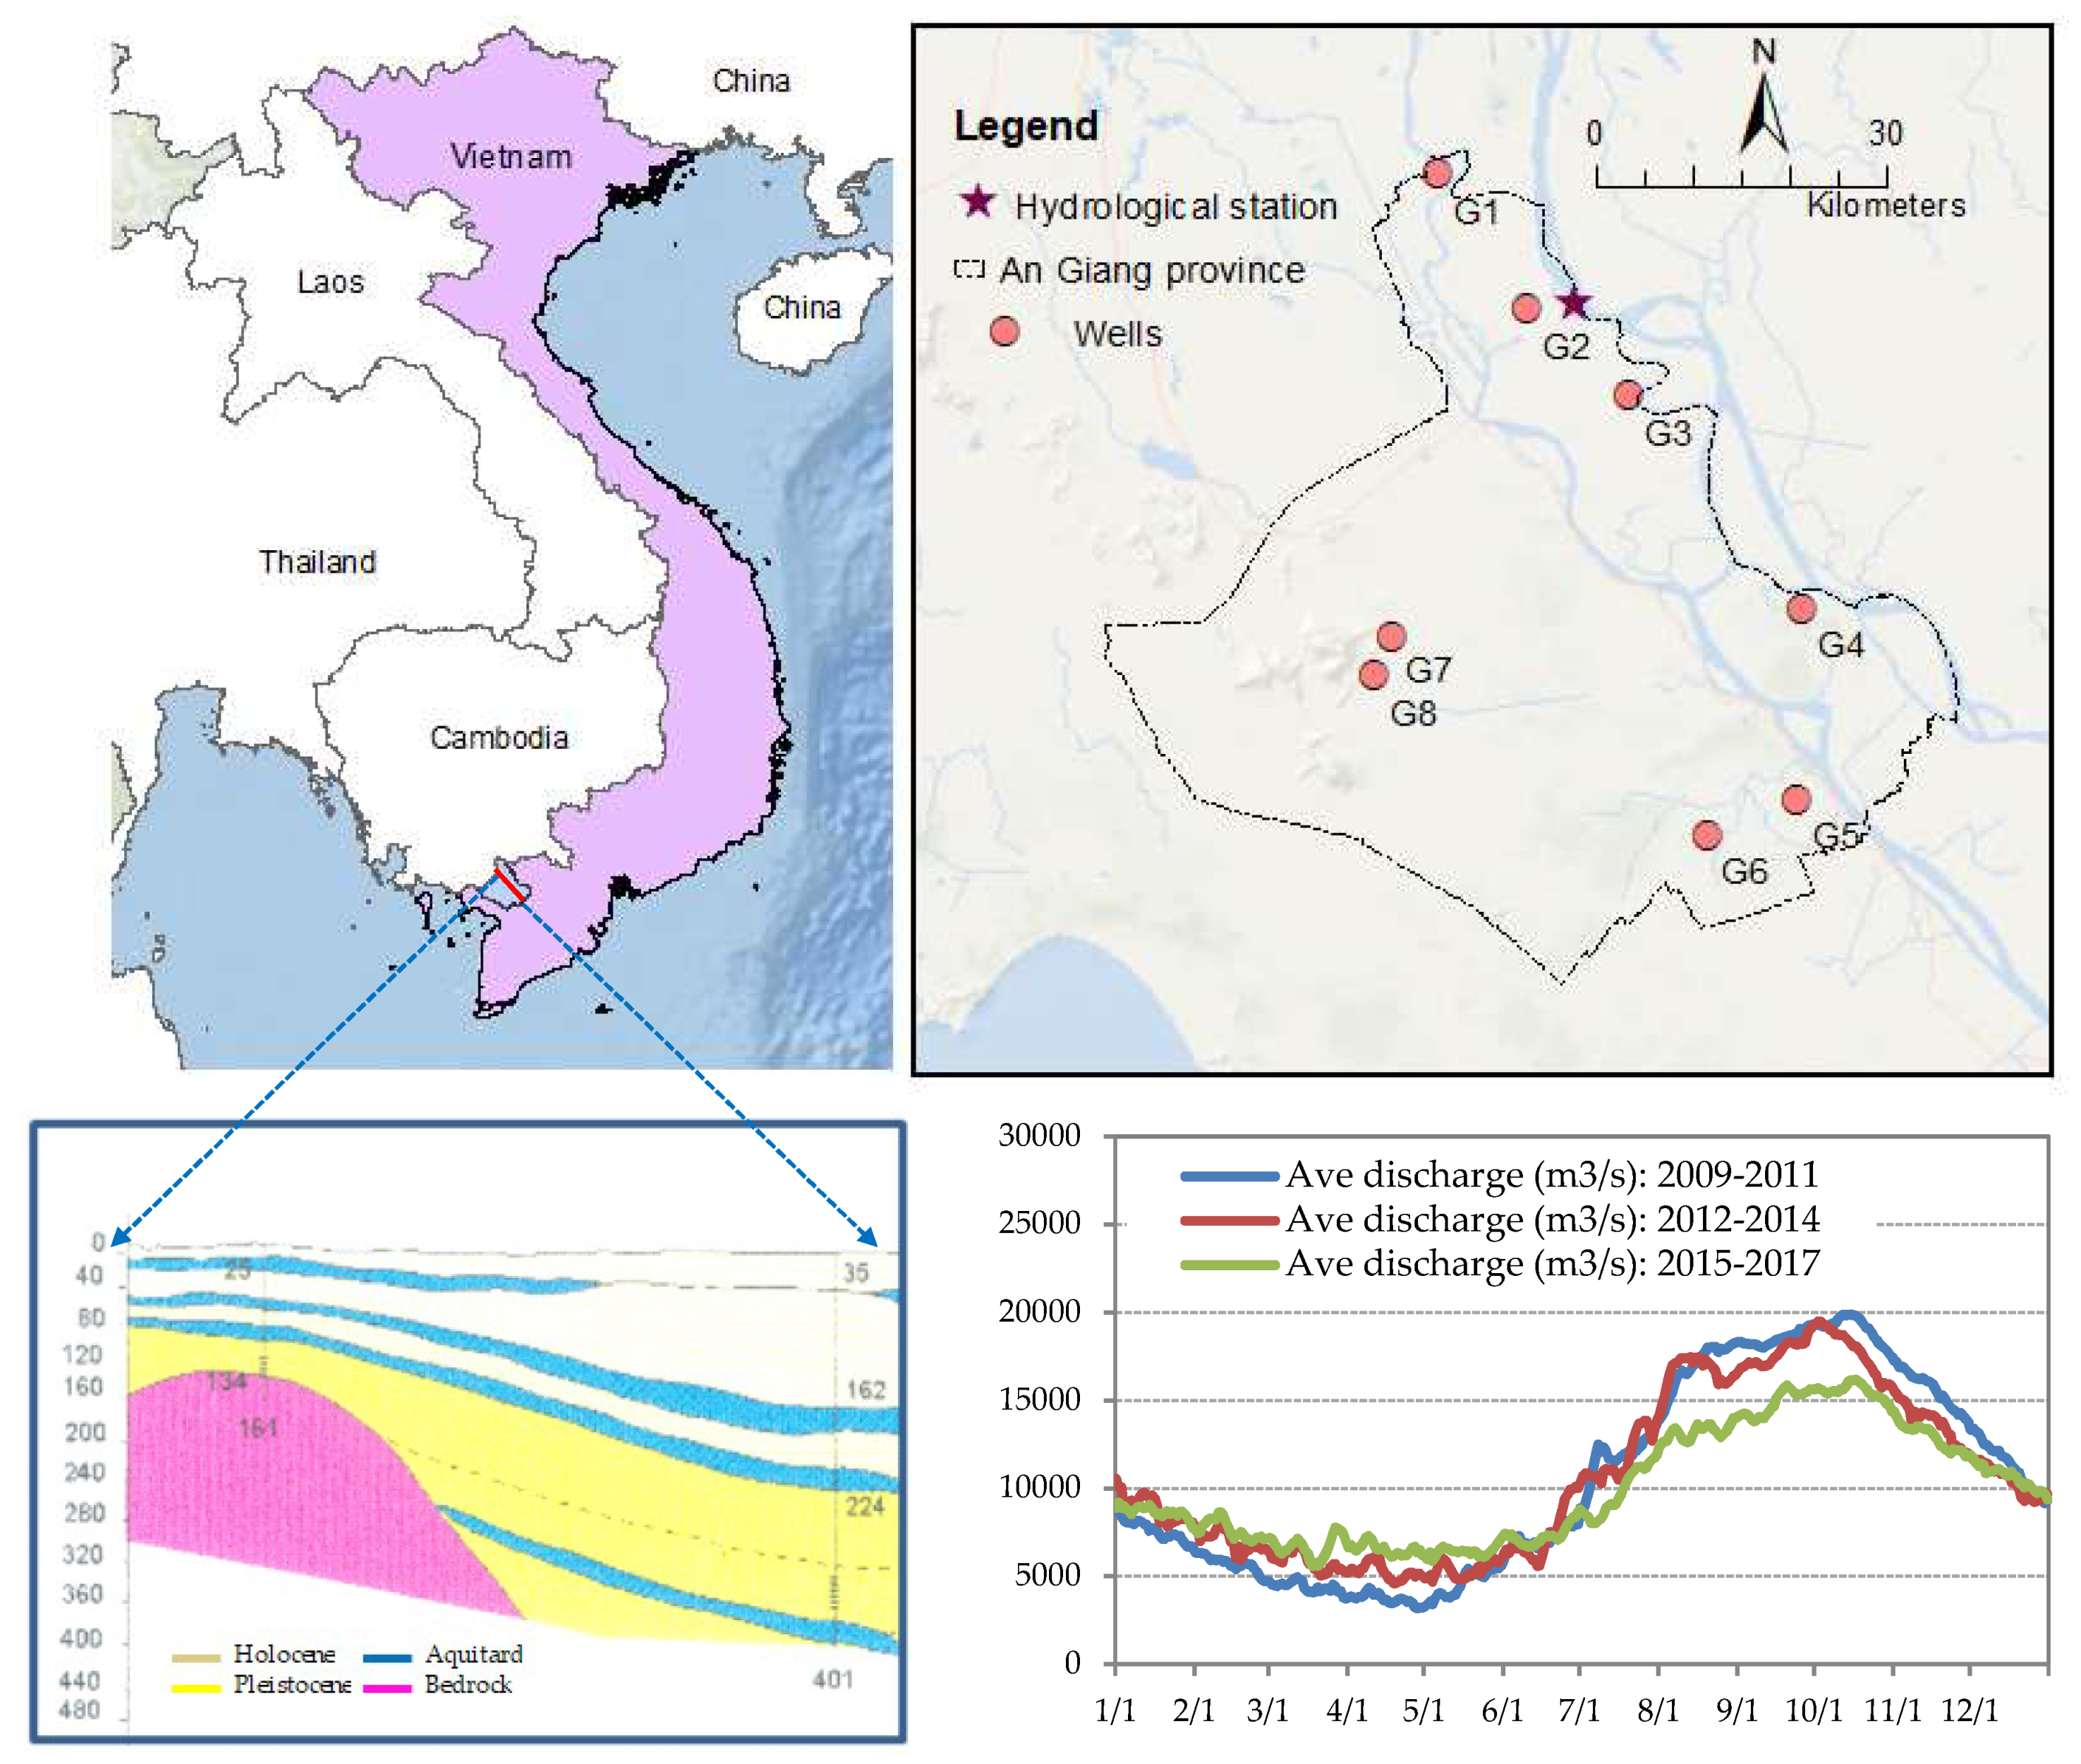
Figure 2.
Average monthly rainfall, daily mean temperature (Tave), daily maximum temperature (Tmax), and daily minimum temperature (Tmin) during the period 1978–2016, collected from Southern Regional Hydrometeorology Center in Vietnam.
Figure 2.
Average monthly rainfall, daily mean temperature (Tave), daily maximum temperature (Tmax), and daily minimum temperature (Tmin) during the period 1978–2016, collected from Southern Regional Hydrometeorology Center in Vietnam.
Figure 3.
Flowchart of study progress of weighted groundwater quality indices by using the fuzzy analytic hierarchy process (Fuzzy-AHP).
Figure 3.
Flowchart of study progress of weighted groundwater quality indices by using the fuzzy analytic hierarchy process (Fuzzy-AHP).
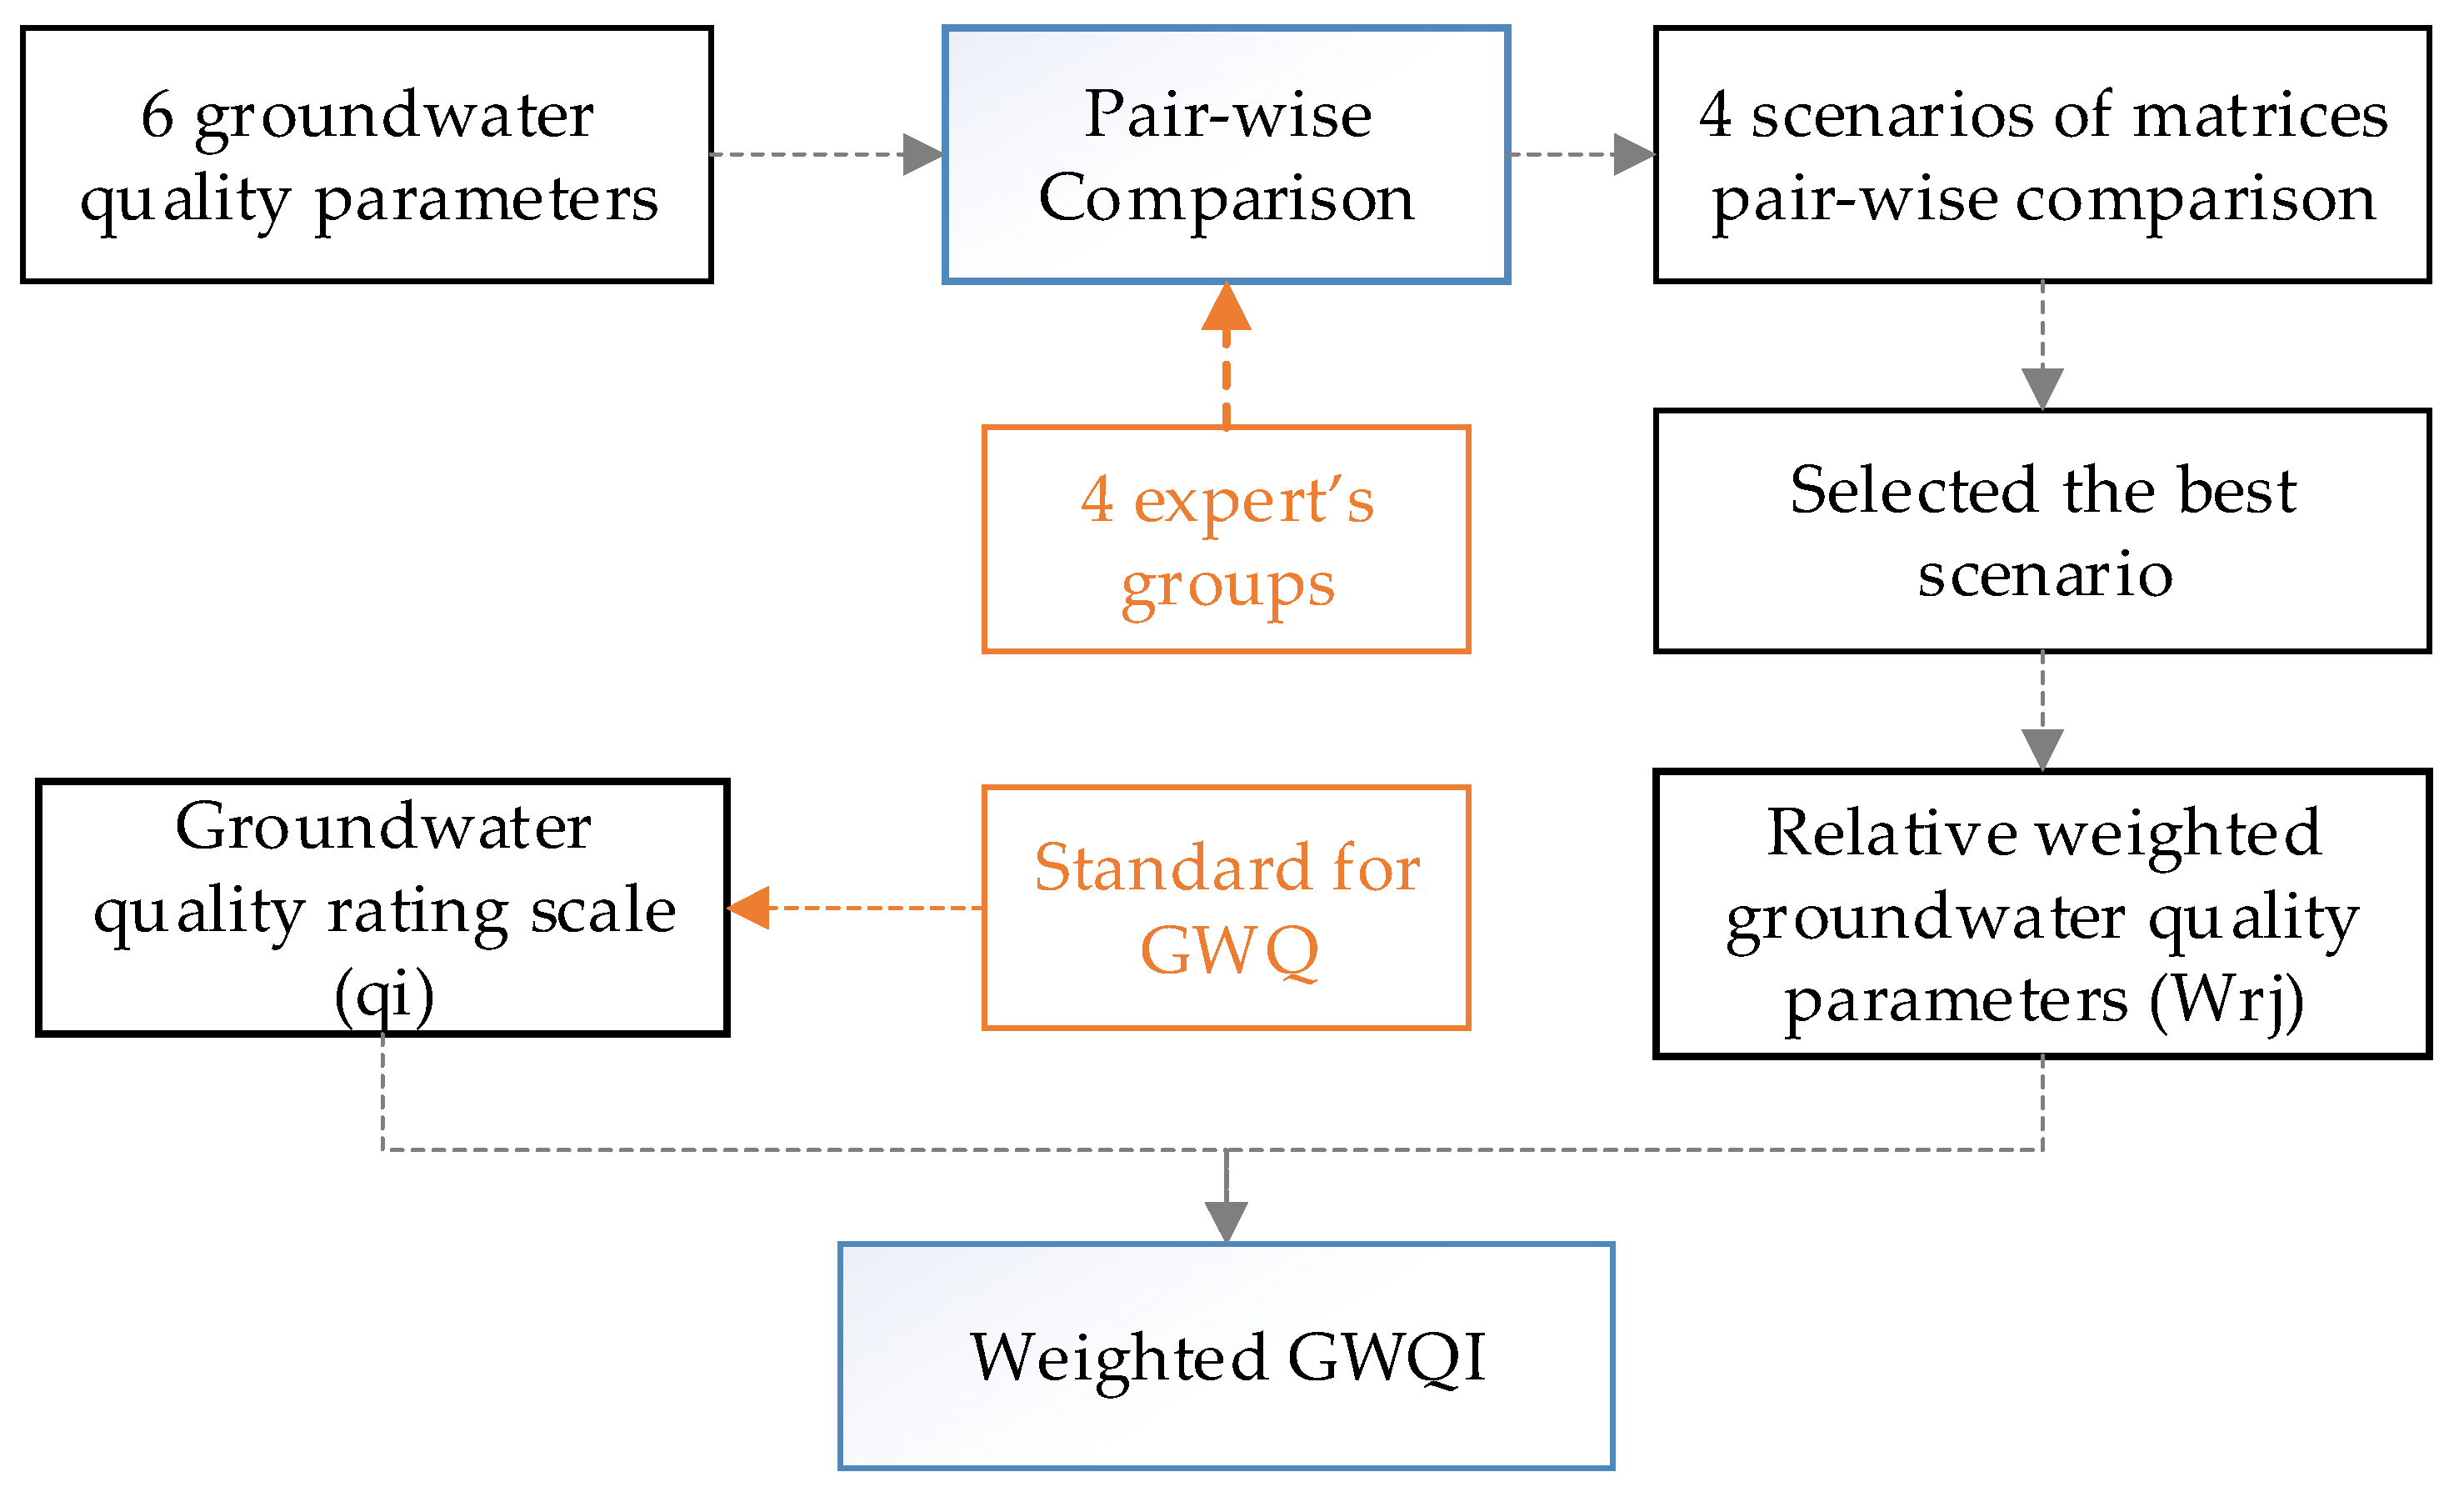
Figure 4.
The hierarchy structure for the performance evaluation process of groundwater quality assessment.
Figure 4.
The hierarchy structure for the performance evaluation process of groundwater quality assessment.
Figure 5.
The average of GWQI units of eight wells in the dry season, during 2009–2018.
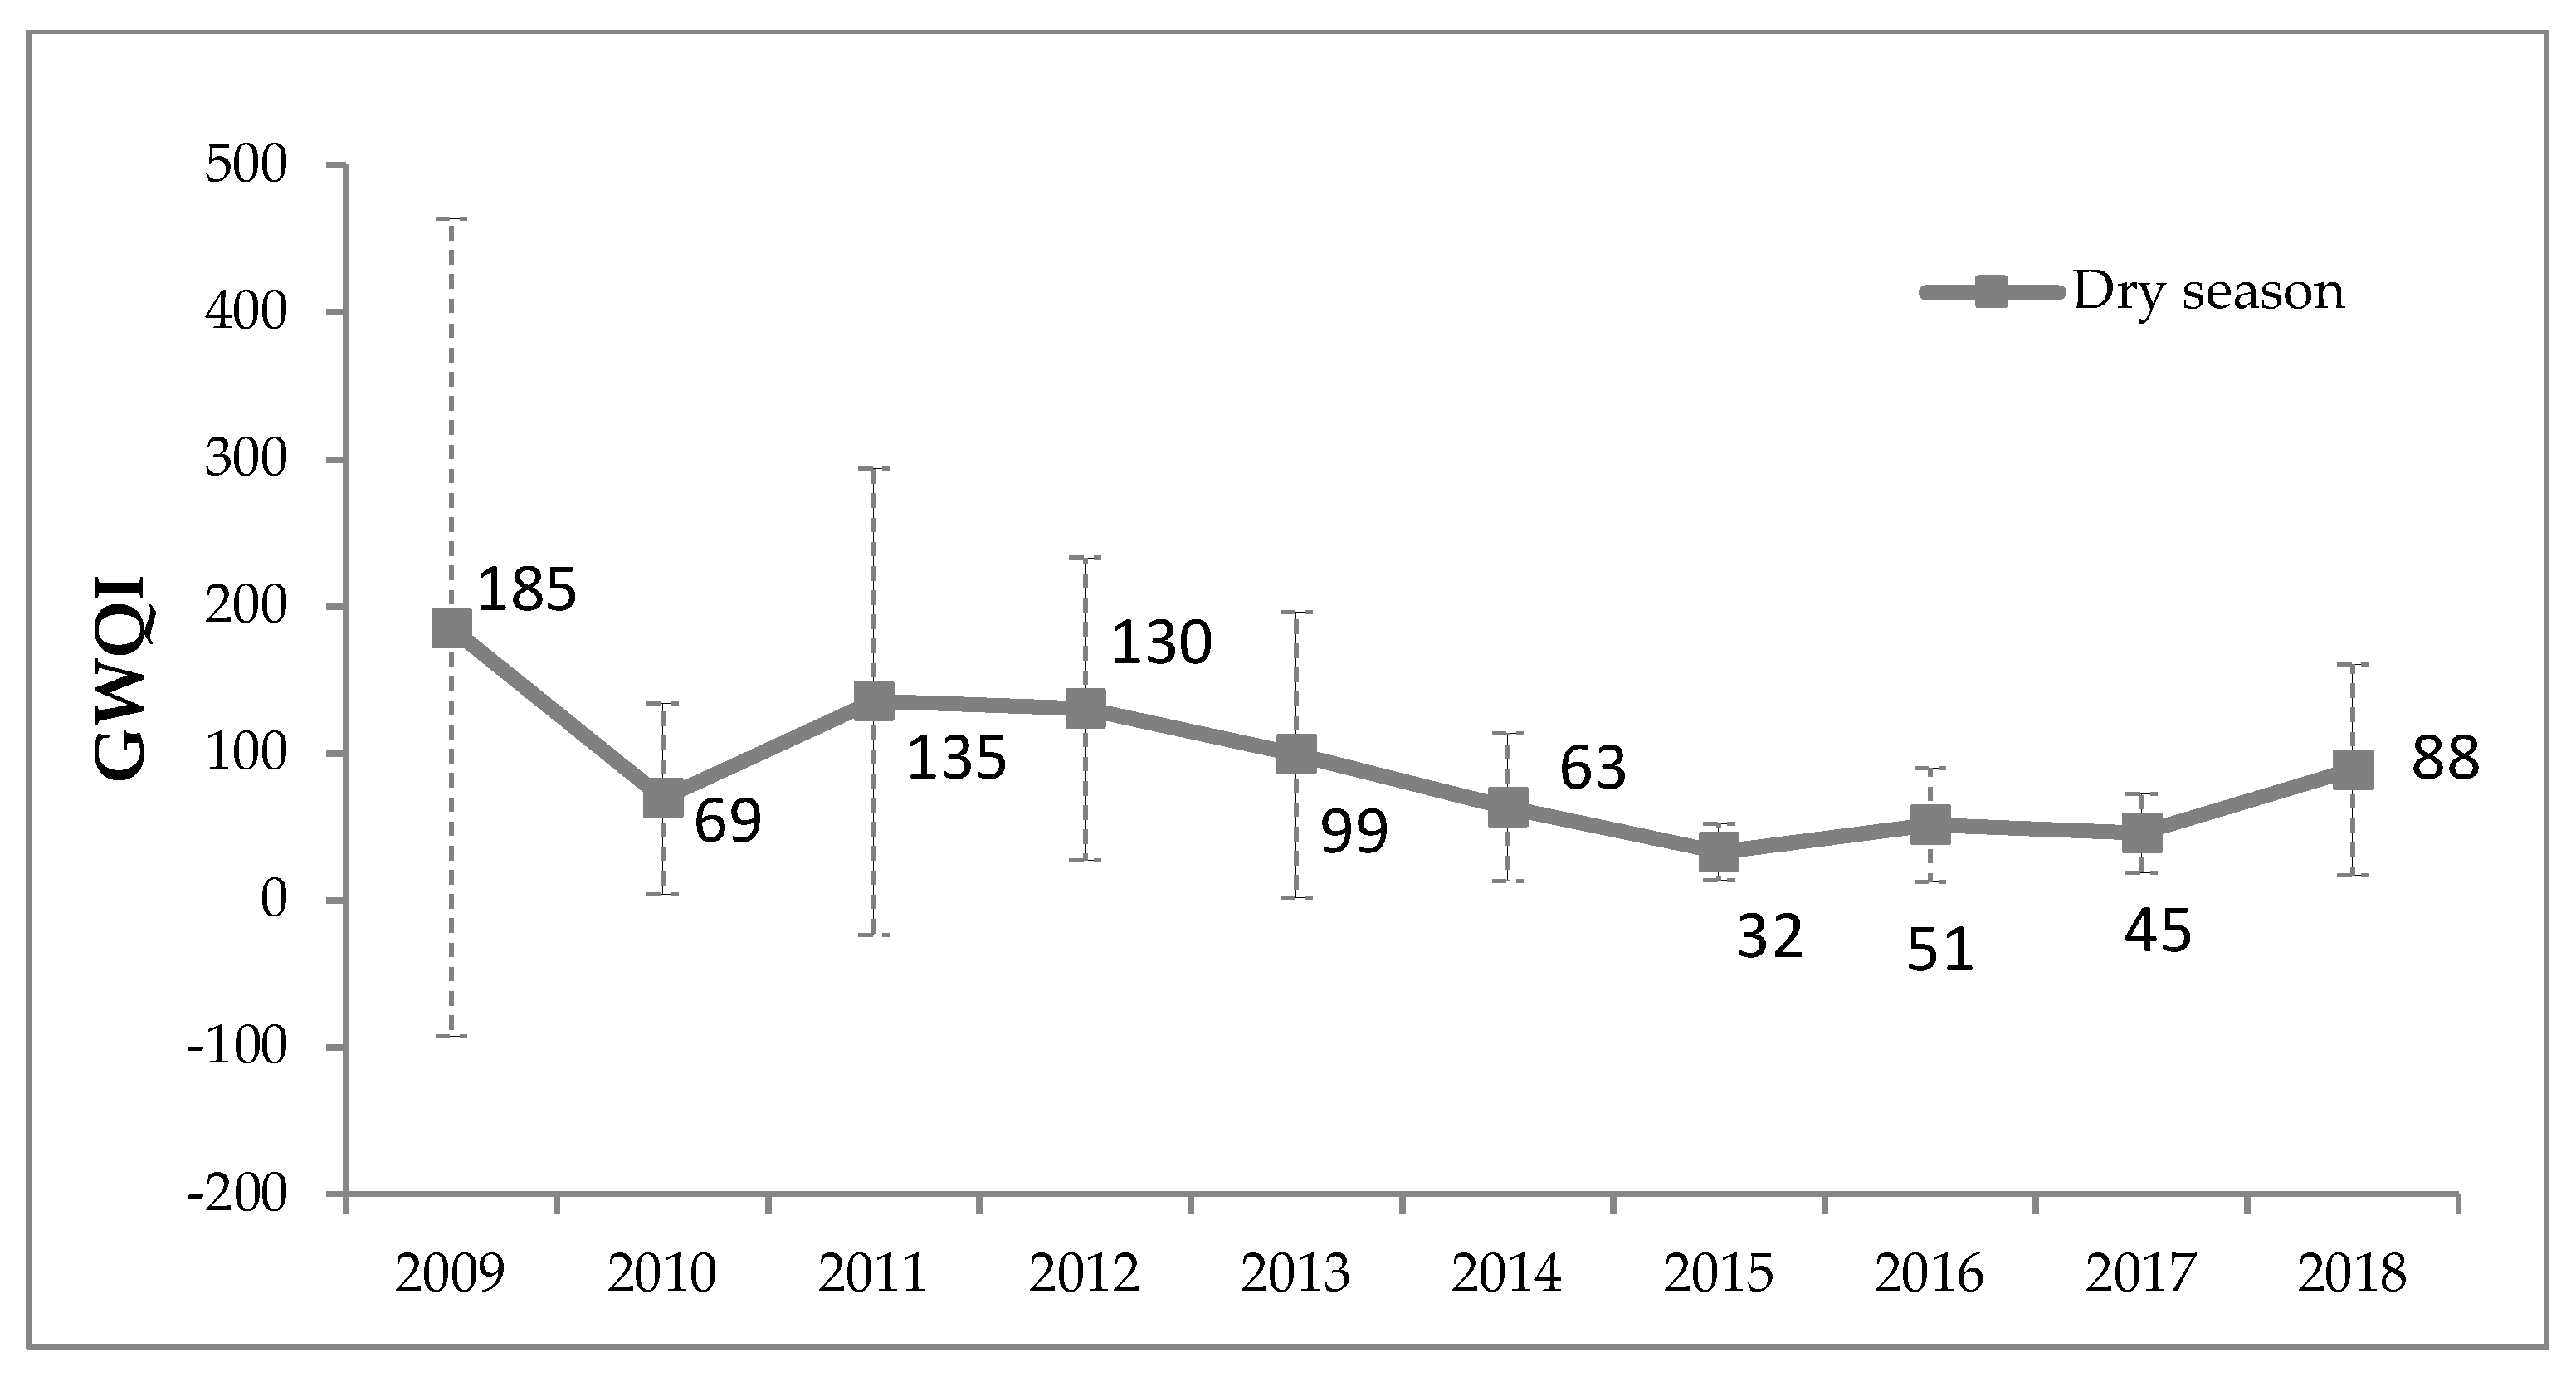
Figure 6.
Percentage of groundwater quality at eight wells based on GWQI in the dry season during 2009–2018.
Figure 6.
Percentage of groundwater quality at eight wells based on GWQI in the dry season during 2009–2018.
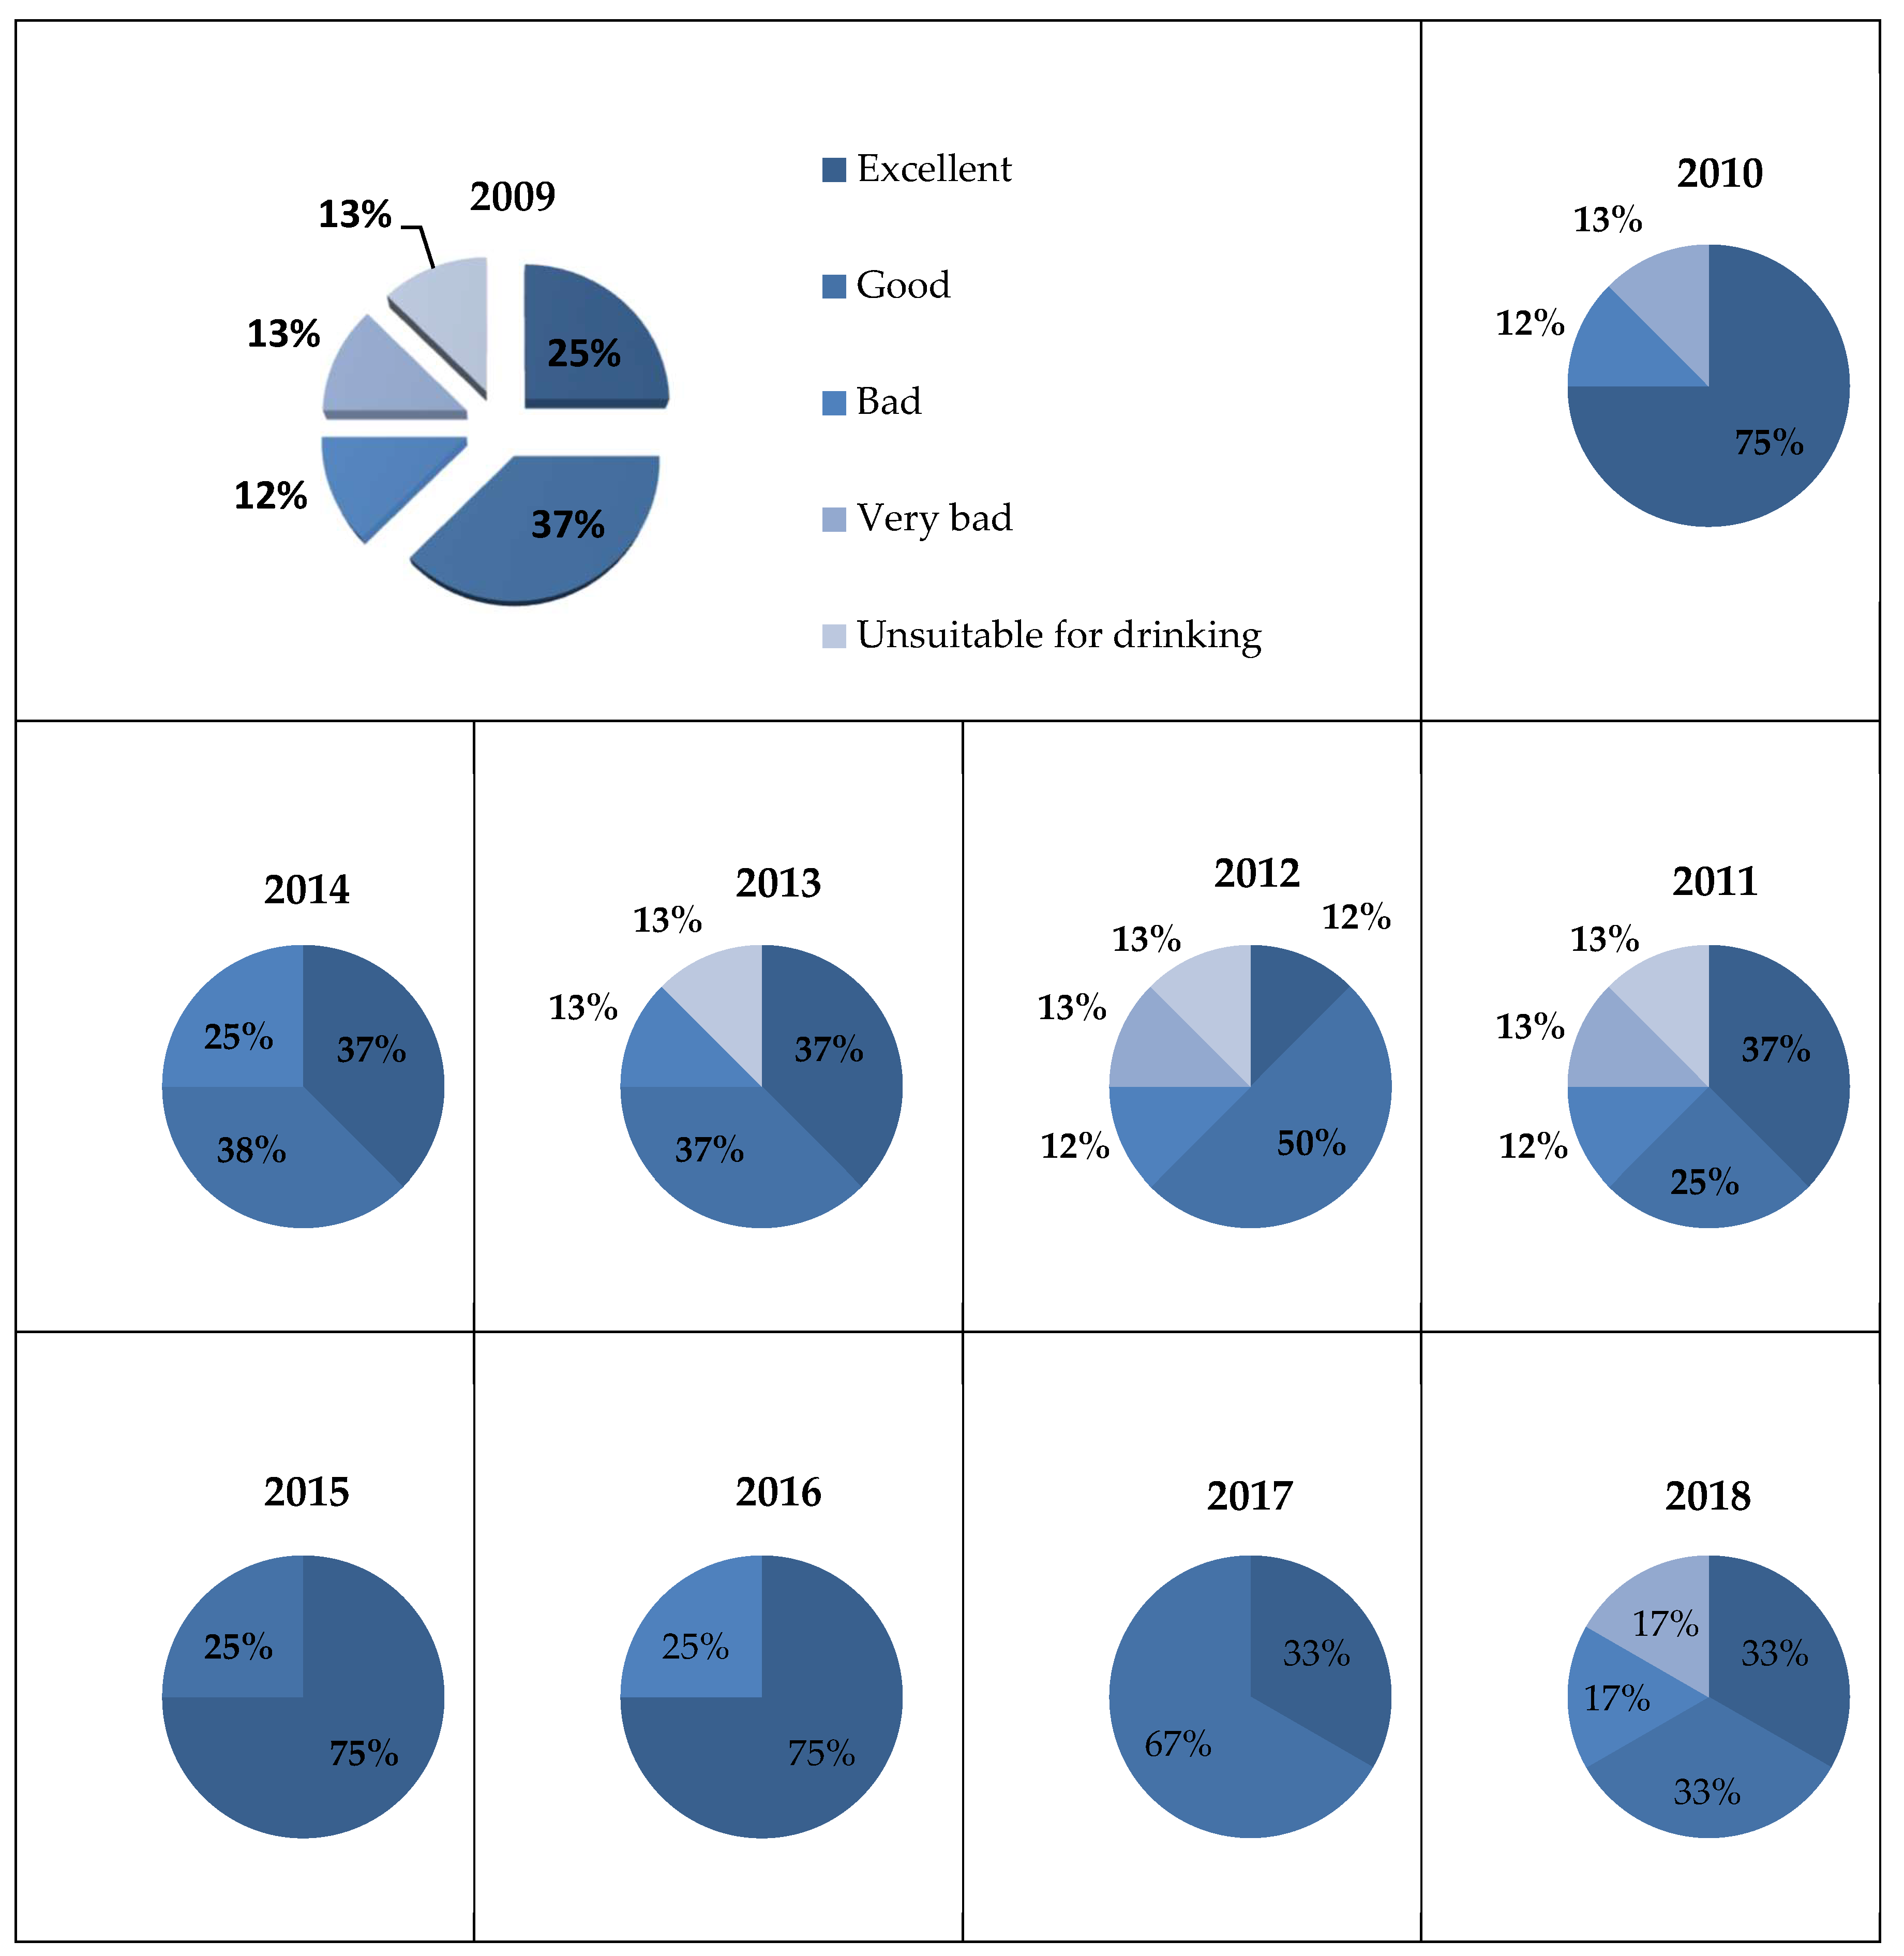
Figure 7.
The average of GWQI unit of eight wells in the wet season, during 2009–2018.
Figure 8.
Percentage of groundwater quality at eight wells based on GWQI in the wet season, during 2009–2018.
Figure 8.
Percentage of groundwater quality at eight wells based on GWQI in the wet season, during 2009–2018.

Figure 9.
The groundwater quality index (GWQI) in An Giang. Notes: <50 (Excellent water), 50–100 (Good water), 100–200 (Bad water), 200–300 (Very bad water), and >300 (Unsuitable for drinking).
Figure 9.
The groundwater quality index (GWQI) in An Giang. Notes: <50 (Excellent water), 50–100 (Good water), 100–200 (Bad water), 200–300 (Very bad water), and >300 (Unsuitable for drinking).
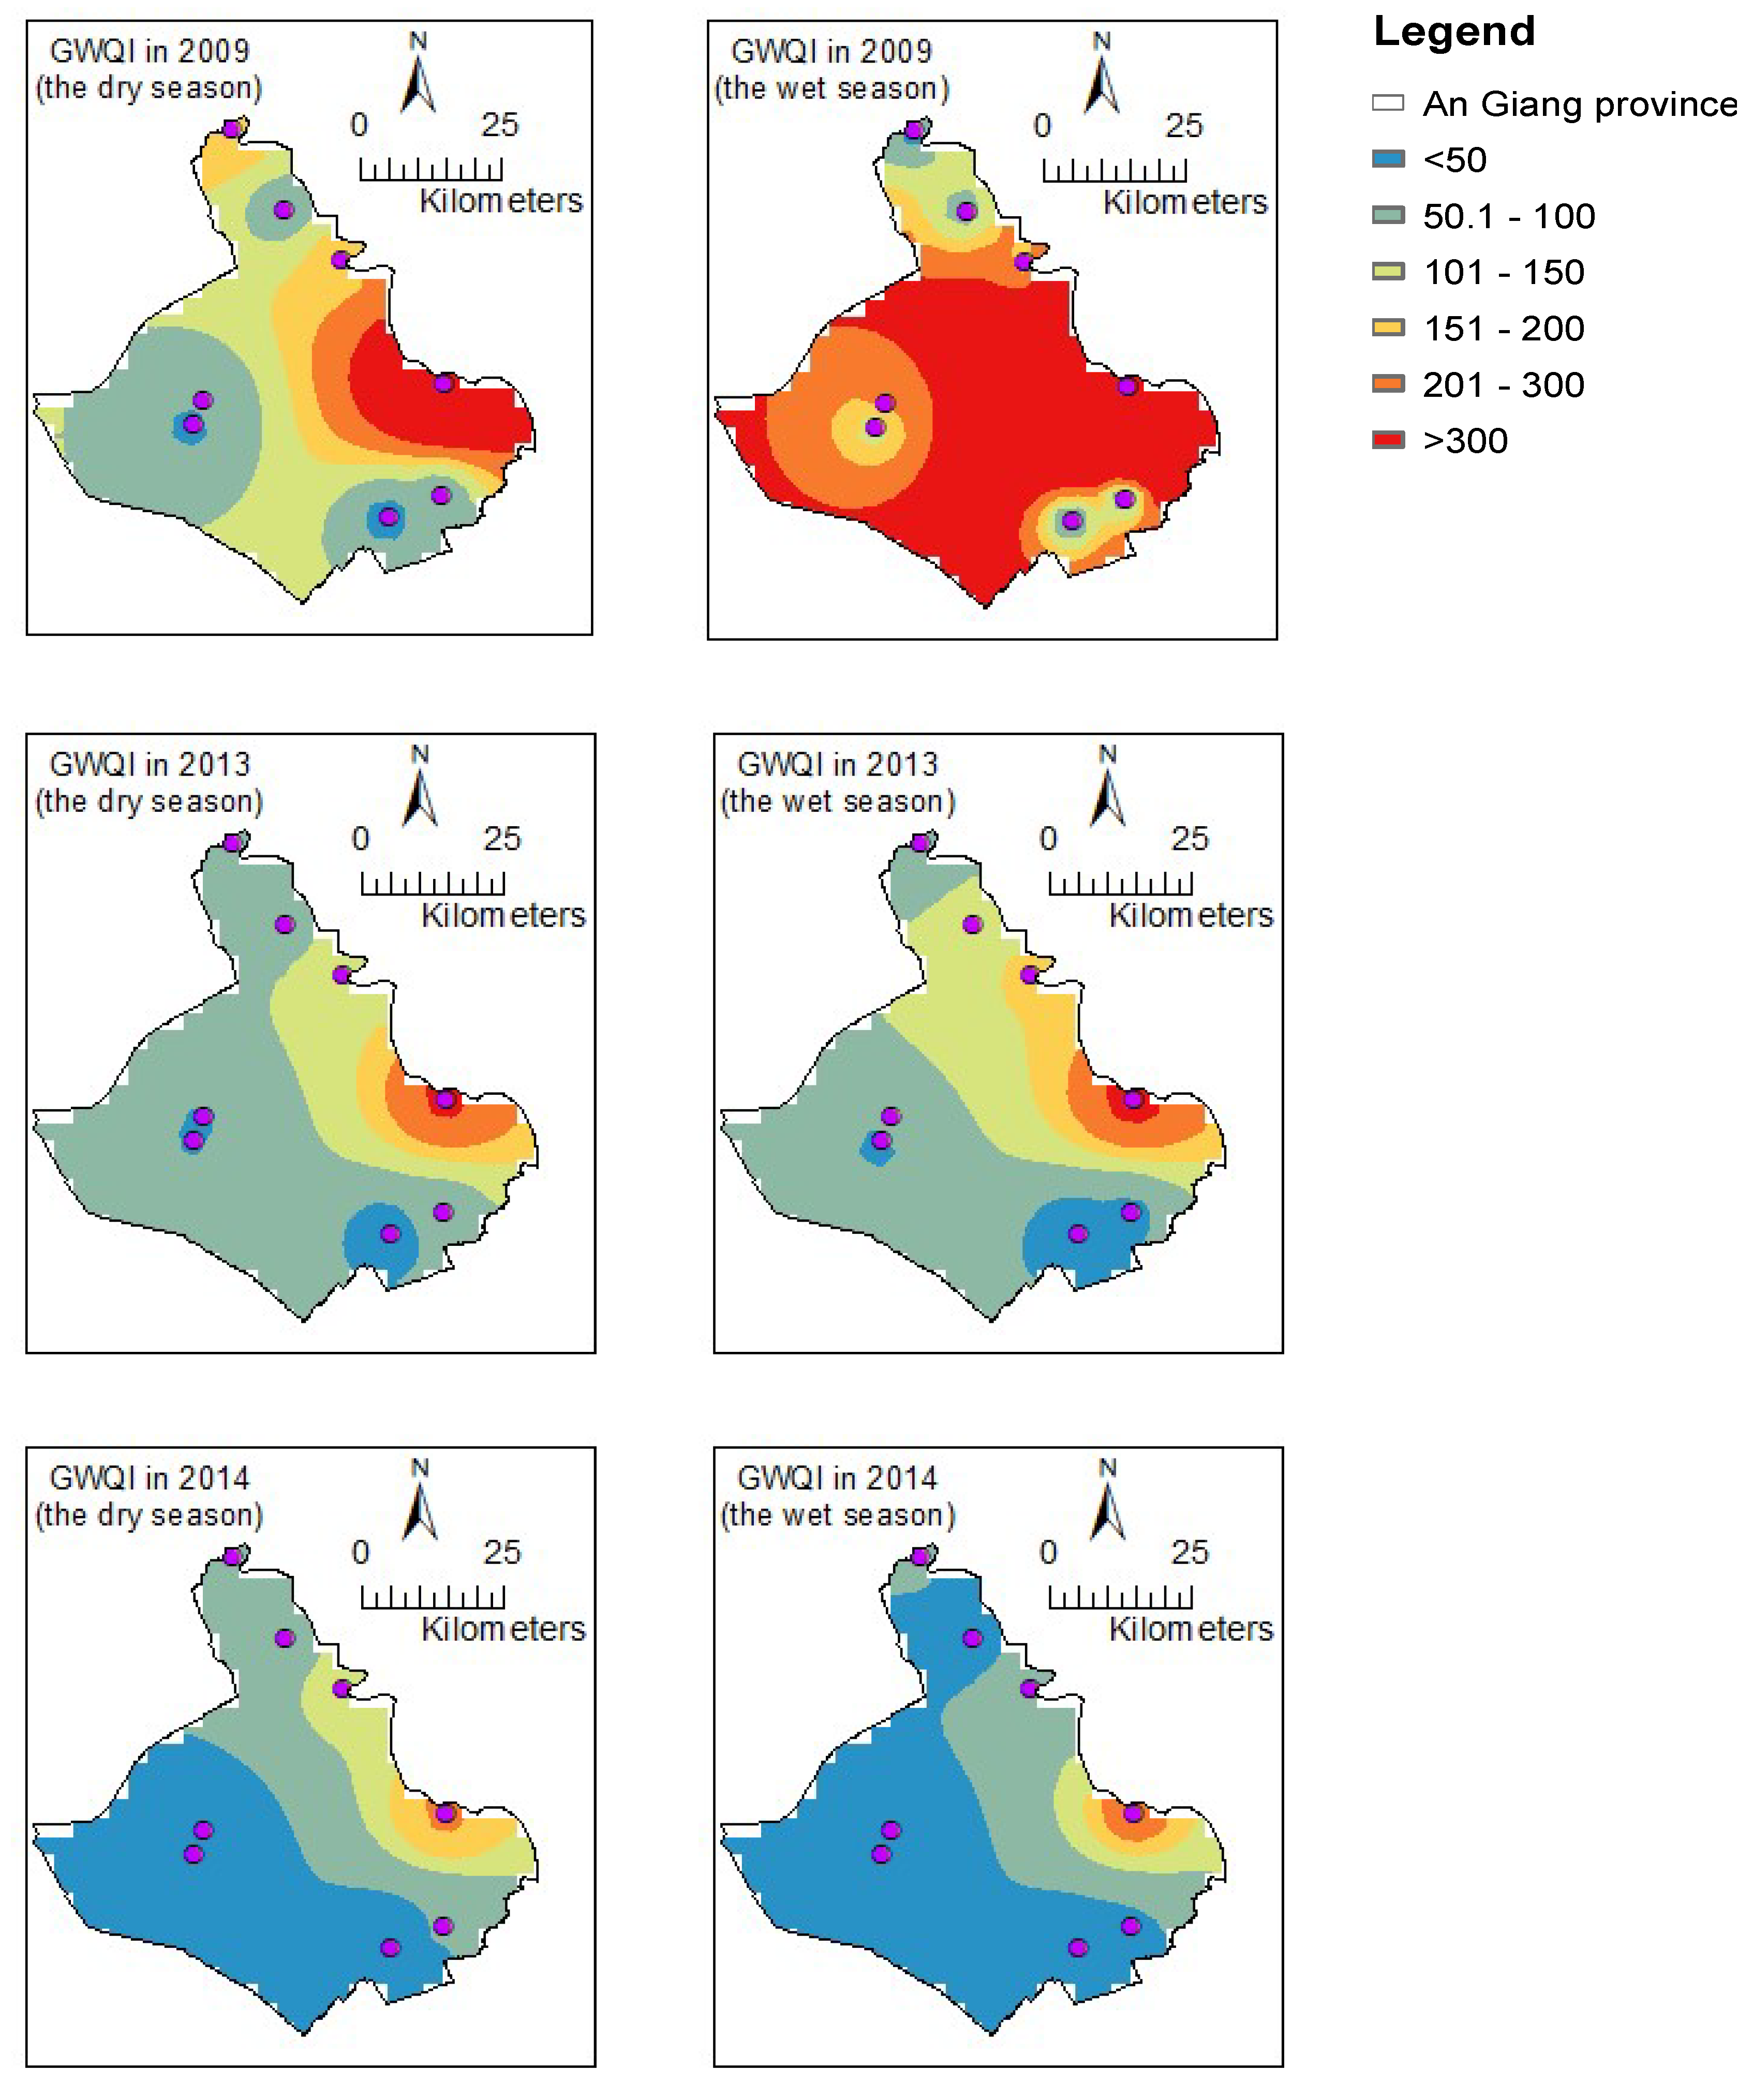
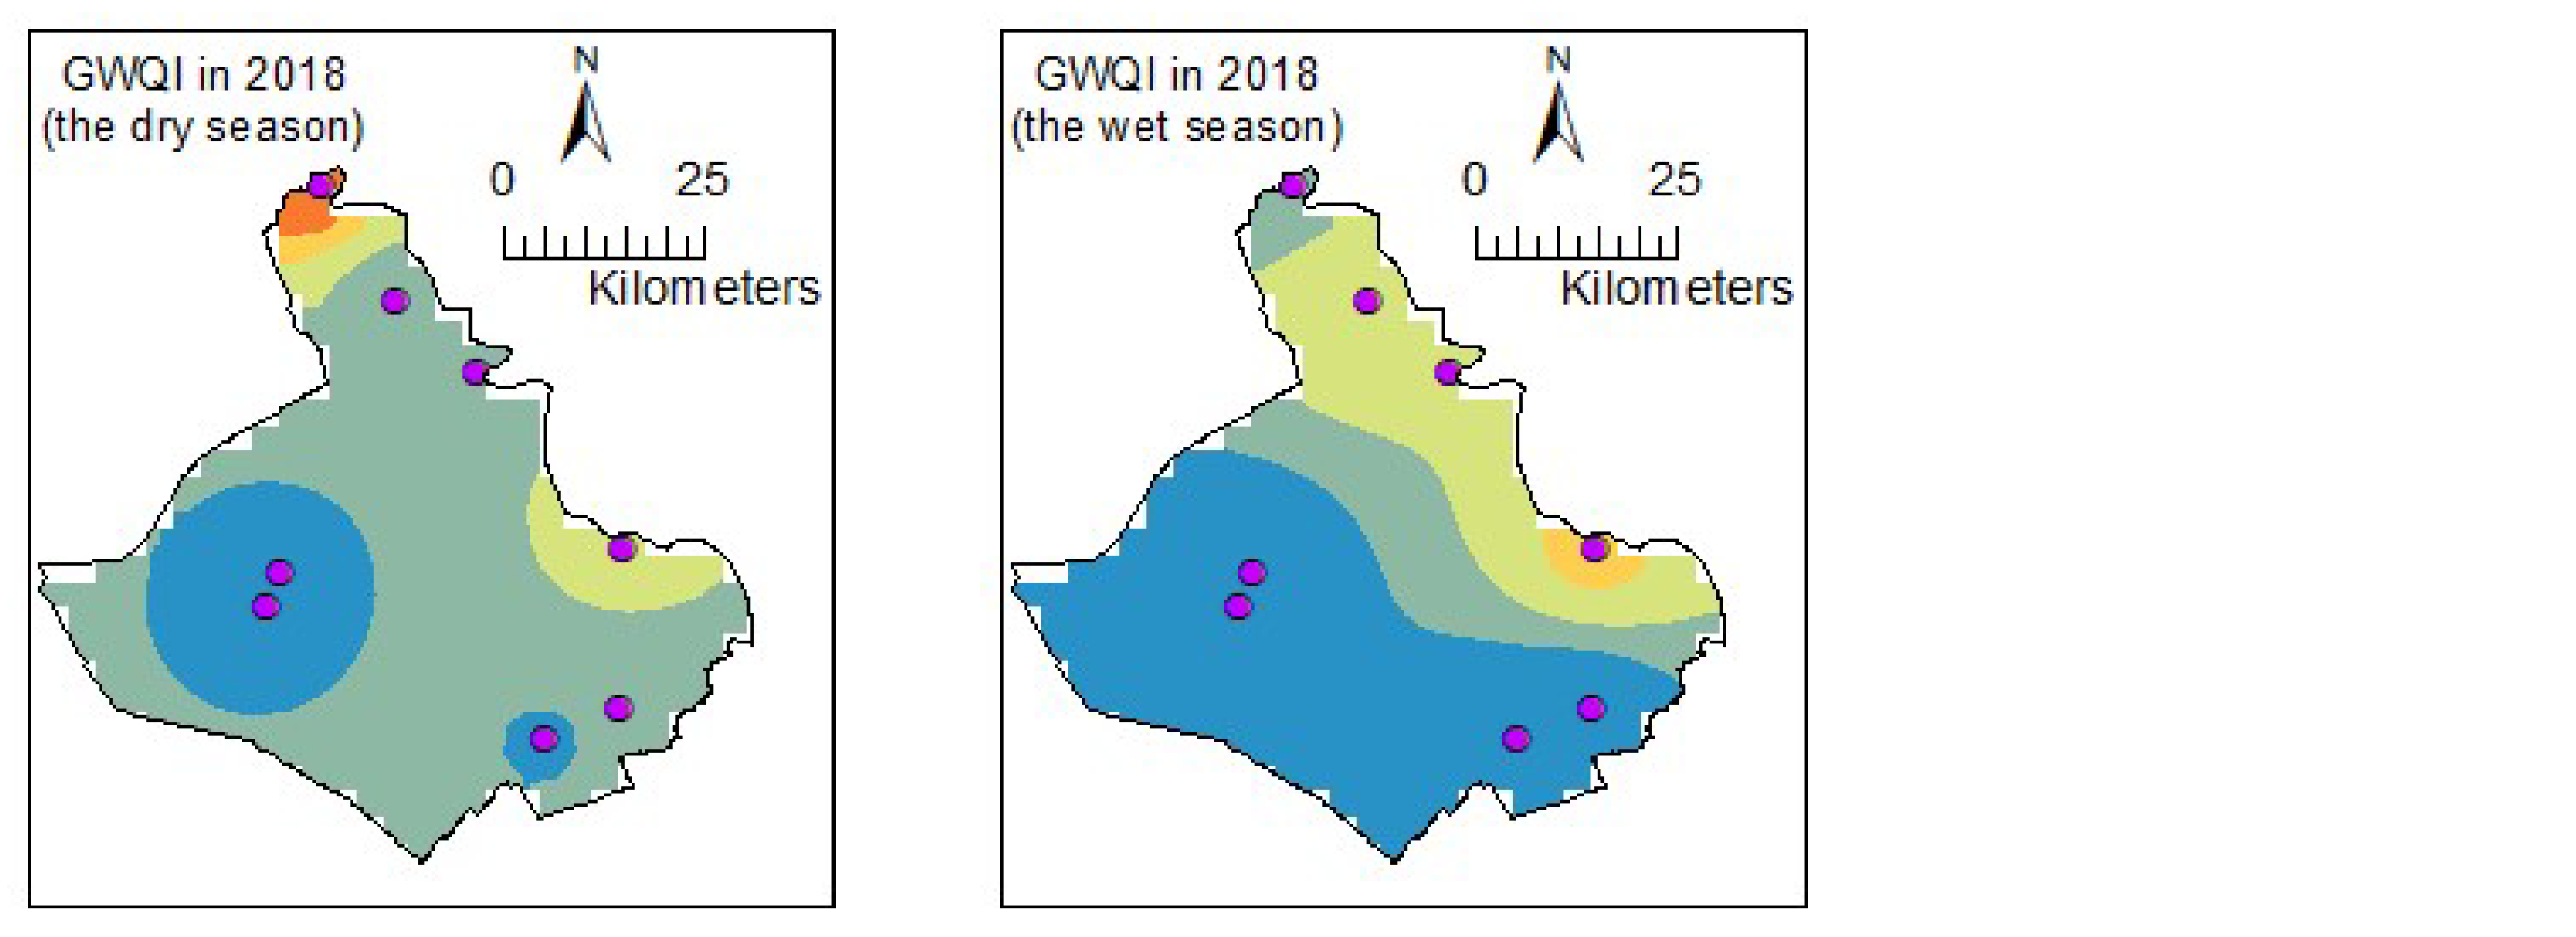
Figure 10.
Box plot shows temporal changes in suspended solids in 2005, 2010, 2015, and 2017 at Long Xuyen station, An Giang. Data of suspended solids were obtained from the Southern Regional Hydrometeorological Center in Hochiminh city, Vietnam.
Figure 10.
Box plot shows temporal changes in suspended solids in 2005, 2010, 2015, and 2017 at Long Xuyen station, An Giang. Data of suspended solids were obtained from the Southern Regional Hydrometeorological Center in Hochiminh city, Vietnam.
Table 1.
Linguistic terms and the corresponding triangular fuzzy scale.
| Saaty’s Scale | Linguistic Terms | Fuzzy Triangular Scale (TFN) |
|---|---|---|
| 1 | Equal importance | (1,1,1) |
| 3 | Moderate importance of one over another | (2,3,4) |
| 5 | Essential or strong importance | (4,5,6) |
| 7 | Demonstrated importance | (6,7,8) |
| 9 | Extreme importance | (9,9,9) |
| 2, 4, 6, 9 | Intermediate values between two adjacent judgments | (1,2,3), (3,4,5), (5,6,7), and (7,8,9) |
Table 2.
Groundwater quality parameters, units, and limited threshold values based on the Vietnamese standard.
Table 2.
Groundwater quality parameters, units, and limited threshold values based on the Vietnamese standard.
| Parameters | Units | Limited Threshold Values |
|---|---|---|
| As | mg/L | 0.05 |
| NO3 | mg/L | 15 |
| pH | - | 5.5–8.5 |
| NH4+ | mg/L | 1 |
| CaCO3 | mg/L | 500 |
| Total Fe | mg/L | 5 |
Table 3.
Water quality classification based on the weighted groundwater quality index (GWQI) for human consumption.
Table 3.
Water quality classification based on the weighted groundwater quality index (GWQI) for human consumption.
| GWQI | <50 | 50–100 | 100–200 | 200–300 | >300 |
|---|---|---|---|---|---|
| Quality classification | Excellent | Good | Bad | Very bad | Unsuitable for drinking |
Table 4.
Pair-wise comparisons in scenario 3.
| Criteria | As | NO3 | pH | NH4+ | CaCO3 | Fe |
|---|---|---|---|---|---|---|
| As | (1,1,1) | (2,3,4) | (4,5,6) | (2,3,4) | (1,1,1) | (1,1,1) |
| NO3 | (1/4,1/3,1/2) | (1,1,1) | (4,5,6) | (1,1,1) | (1/4,1/3,1/2) | (1/4,1/3,1/2) |
| pH | (1/6,1/5,1/4) | (1/6,1/5,1/4) | (1,1,1) | (1/6,1/5,1/4) | (1/6,1/5,1/4) | (1/6,1/5,1/4) |
| NH4+ | (1/4,1/3,1/2) | (1,1,1) | (4,5,6) | (1,1,1) | (1,1,1) | (1/4,1/3,1/2) |
| CaCO3 | (1,1,1) | (2,3,4) | (4,5,6) | (1,1,1) | (1,1,1) | (1,1,1) |
| Fe | (1,1,1) | (2,3,4) | (4,5,6) | (2,3,4) | (1,1,1) | (1,1,1) |
Table 5.
Absolute group weights of parameters obtained from the pair-wise comparison.
| Parameters | wj | |||
|---|---|---|---|---|
| S1 | S2 | S3 | S4 | |
| As | 0.396 | 0.431 | 0.265 | 0.253 |
| NO3− | 0.075 | 0.095 | 0.111 | 0.136 |
| pH | 0.024 | 0.030 | 0.038 | 0.048 |
| NH4+ | 0.068 | 0.106 | 0.131 | 0.125 |
| CaCO3 | 0.163 | 0.166 | 0.219 | 0.190 |
| Total Fe | 0.319 | 0.241 | 0.265 | 0.275 |
| Sum | 1.046 | 1.069 | 1.028 | 1.026 |
| Mean | 0.174 | 0.178 | 0.171 | 0.171 |
| SD | 0.151 | 0.143 | 0.093 | 0.085 |
Table 6.
Scenarios’ sensitivity analyses results.
| Analysis | Compared Scenarios | Mean | SD | ||
|---|---|---|---|---|---|
| 1 | S1 | to | S2 | 0.0037 | 0.008 |
| 2 | S1 | to | S3 | 0.0031 | 0.058 |
| 3 | S1 | to | S4 | 0.0034 | 0.065 |
| 4 | S2 | to | S3 | 0.0068 | 0.050 |
| 5 | S2 | to | S4 | 0.0071 | 0.058 |
| 6 | S3 | to | S4 | 0.0003 | 0.007 |
| Min | 0.0003 | 0.007 | |||
Table 7.
Relative weight factors of different water quality parameters.
| Parameters | wj |
|---|---|
| As | 0.258 |
| NO3− | 0.107 |
| pH | 0.037 |
| NH4+ | 0.127 |
| CaCO3 | 0.214 |
| Total Fe | 0.258 |
© 2019 by the authors. Licensee MDPI, Basel, Switzerland. This article is an open access article distributed under the terms and conditions of the Creative Commons Attribution (CC BY) license (http://creativecommons.org/licenses/by/4.0/).
Share and Cite
MDPI and ACS Style
Minh, H.V.T.; Avtar, R.; Kumar, P.; Tran, D.Q.; Ty, T.V.; Behera, H.C.; Kurasaki, M. Groundwater Quality Assessment Using Fuzzy-AHP in An Giang Province of Vietnam. Geosciences 2019, 9, 330. https://doi.org/10.3390/geosciences9080330
AMA Style
Minh HVT, Avtar R, Kumar P, Tran DQ, Ty TV, Behera HC, Kurasaki M. Groundwater Quality Assessment Using Fuzzy-AHP in An Giang Province of Vietnam. Geosciences. 2019; 9(8):330. https://doi.org/10.3390/geosciences9080330
Chicago/Turabian StyleMinh, Huynh Vuong Thu, Ram Avtar, Pankaj Kumar, Dat Q. Tran, Tran Van Ty, Hari Charan Behera, and Masaaki Kurasaki. 2019. "Groundwater Quality Assessment Using Fuzzy-AHP in An Giang Province of Vietnam" Geosciences 9, no. 8: 330. https://doi.org/10.3390/geosciences9080330
Note that from the first issue of 2016, this journal uses article numbers instead of page numbers. See further details here.