Detection of Boulders in Side Scan Sonar Mosaics by a Neural Network


1
Leibniz Institute for Baltic Sea Research Warnemünde, 18119 Rostock, Germany
2
Coastal Geology and Sedimentology, Institute of Geosciences, University of Kiel, 24118 Kiel, Germany
*
Author to whom correspondence should be addressed.
Geosciences 2019, 9(4), 159; https://doi.org/10.3390/geosciences9040159
Submission received: 6 March 2019
/
Revised: 27 March 2019
/
Accepted: 29 March 2019
/
Published: 3 April 2019
(This article belongs to the Special Issue Geological Seafloor Mapping)
Abstract
:Boulders provide ecologically important hard grounds in shelf seas, and form protected habitats under the European Habitats Directive. Boulders on the seafloor can usually be recognized in backscatter mosaics due to a characteristic pattern of high backscatter intensity followed by an acoustic shadow. The manual identification of boulders on mosaics is tedious and subjective, and thus could benefit from automation. In this study, we train an object detection framework, RetinaNet, based on a neural network backbone, ResNet, to detect boulders in backscatter mosaics derived from a sidescan-sonar operating at 384 kHz. A training dataset comprising 4617 boulders and 2005 negative examples similar to boulders was used to train RetinaNet. The trained model was applied to a test area located in the Kriegers Flak area (Baltic Sea), and the results compared to mosaic interpretation by expert analysis. Some misclassification of water column noise and boundaries of artificial plough marks occurs, but the results of the trained model are comparable to the human interpretation. While the trained model correctly identified a higher number of boulders, the human interpreter had an advantage at recognizing smaller objects comprising a bounding box of less than 7 × 7 pixels. Almost identical performance between the best model and expert analysis was found when classifying boulder density into three classes (0, 1–5, more than 5) over 10,000 m2 areas, with the best performing model reaching an agreement with the human interpretation of 90%.
1. Introduction
Hard substrata are ecologically important as they provide habitat structures for highly specialized communities that in turn significantly contribute to benthic production, and provide irreplaceable ecosystem services [1]. Often, hard bottom habitats feature a complex topography. The three-dimensional structures enhance small-scale spatial habitat variability and thereby lead to high biodiversity. They provide refuge or serve as nursery areas for a variety of species throughout the marine food-webs and the inhabiting communities play a major role in benthic-pelagic coupling and nutrient cycling. Consequently, marine hard-substrata are not only areas of special interest to study ecosystem functioning, but also for marine nature conservation and their detection should be a key goal of geological seafloor mapping. In the Baltic Sea, hardgrounds are mostly fields of cobbles (6.4 cm to 25.6 cm), boulders (25.6 cm to 4.1 m), and blocks (>4.1 m) [2] that eroded out of glacial till deposits [3,4,5]. Hard substrates as the southern Baltic boulder fields are protected habitats under European Habitats Directive (HD 92/43/EEC annex 1 1170—reefs). Boulder distribution and the area they provide for settlement of marine life is not quantitatively known. A reason for this is that cobbles and boulders (or features of similar acoustic appearance such as certain biogenic reefs [6] or underwater mines [7]) currently cannot reliably be detected automatically especially on heterogenous seafloor.
In current practice, boulder detection often requires time-consuming manual interpretation of sidescan-sonar or multibeam echo sounder backscatter mosaics and/or confirmation by underwater video footage [8]. In principle, it has to be differentiated between the detection of buried boulders, and boulders exposed at the seafloor. Buried boulders may be detected by seismic methods [8]. While the detection of slightly buried boulders is important, especially considering dynamic areas such as parts of the North Sea, where boulders may be frequently exposed or covered based on environmental conditions [9], the focus of this study is on the detection of stable surficial boulders widespread in the Baltic Sea. Ongoing, full-coverage hydroacoustic surveys in the Baltic Sea [10] utilize sidescan-sonar technology. Lacking the morphological information provided by multibeam echo sounders frequently used for habitat classification in recent years [11], towed sidescan-sonar systems offer the advantage of lower grazing angles and thus increased presence of acoustic shadows due to the elevated boulder surface [12,13]. Since backscatter mosaics are essentially georeferenced acoustic imagery of the seafloor following data processing, techniques for the detection of objects in images can be applied to the problem. Techniques that have been developed for the identification of man-made objects rely on feature extraction and selection of classification algorithms by human experts [14,15,16]. These methods rely on spatial domain filtering to detect highlight-shadow sequences and often operate on raw sonar images to transparently provide high detection performance in real-time. In contrast, during training on labeled data, neural networks independently learn patterns in input data—in this study, comprising processed backscatter mosaics and no raw sonar data—that can be used for classification. Especially in the field of computer vision, deep convolutional neural networks [17] were found to be highly capable tools for the recognition and classification of objects within images.
While neural networks have been previously applied to backscatter mosaics in the field of marine habitat mapping [18,19], these were not convolutional networks optimized for image analysis. Convolutional neural networks operate by convolving an input image with different kernel functions, thus generating a large number of filtered images that differ due to the different weights of the kernels. The basic assumption of convolutional neural networks is that no connection between all pixels of an image is required for classification, but that local pixel patterns have a higher significance. During training on labelled images, the weights of the randomly initialized kernels are continuously adjusted to be sensitive to characteristic features of the sample data. A stack of several trained convolutional layers, each layer operating on the output of the previous layer and combined with activation functions that allow the network to learn nonlinear relationships as well as regular reductions in image size to assess large scale patterns, detects increasingly abstract features of images and can be used for image classification tasks. Well known implementations of such convolutional neural networks for image classification are, e.g., AlexNet [20] or different instances of the VGG network [21]. Deeper convolutional networks become increasingly difficult to train due to different learning rates in the individual layers of the network, which is an issue commonly termed the vanishing gradient problem [22,23]. To resolve this issue, deep residual networks (e.g., ResNet) [24] were developed, which add shortcuts between selected layers of a convolutional network. This causes networks to learn on the residuals of the filtered input image, allowing the construction of very deep networks. For the purpose of object detection, the network structures introduced above are embedded into frameworks [25] that merge the task of image classification with the detection of boundary boxes or masks of different objects within one image. These frameworks are directly applicable to the interpretation of backscatter mosaics. Thus, the objective of this study is to train an object detection framework (RetinaNet) on boulders apparent in backscatter mosaics in the Baltic Sea (Figure 1) and determine boulder densities as currently suggested for the German Mapping Guidelines for North Sea and Baltic Sea.
2. Materials and Methods
2.1. Preparation of Train, Validation, and Test Datasets
The Department of Hydrographic Surveying and Marine Geodesy of the German Federal Maritime and Hydrographic Agency (BSH) provided sidescan-sonar raw data. Data were recorded using an EG&G DF-1000 side scan sonar in July 2013. The 384 kHz channel was used to create the mosaics. The altitude of the sidescan-sonar in the investigation area varied between 15 m and 37 m above the seafloor, due to extensive seafloor morphology and a constant cable length. The recorded slant range was 84 m. Sidescan-sonar mosaics were produced within an administrative agreement between the Leibniz Institute for Baltic Sea Research Warnemünde (IOW) and the BSH. In this study, higher backscatter intensities are displayed in darker colors. To obtain a training dataset, three sidescan-sonar mosaics of ~2.5 km2 in total (Figure 1) were manually interpreted regarding the occurrence of boulders and blocks using the open-source software QGIS 3.4 (https://qgis.org, last accessed on 21 March 2019). The native resolution of the backscatter mosaics is 0.25 m in the horizontal and vertical direction. For each detected boulder, a georeferenced boundary box was saved within a SQlite database (www.sqlite.org, last accessed on 21 March 2019). Examples of training boundary boxes are displayed in Figure 2. A total number of 4617 boulders were identified. In addition, a total of 2005 negative examples were digitized. These examples include nadir effects, plough marks, and effects of water column stratification.
Subsequently, the mosaics of the training area were exported as square GeoTiff tiles with a spatial extension of 25 m2 and 225 m2. The individual tiles include between 0 and more than 160 manually detected boulders. To avoid boundary effects, where bounding boxes of manually interpreted boulders are cut by the tile boundary, tiles were exported with an overlap of 1.0 m. This ensures that the large majority of observed boulders are completely visible on at least one image. Due to the overlap, identical boulders can be present on different images. Therefore, for the purpose of this study, subsequent detections that are within 0.5 m of an already present detection are ignored, which may cause an underestimation of boulders in areas with high boulder density. The coordinates of the manually interpreted bounding boxes in the database were compared with the geographical extension of each tile. If the bounding box of boulder is situated completely within a tile, pixel coordinates of the boulder were calculated and a training/validation sample was created. This check is necessary to avoid the boundary of an image tile being trained as a boulder.
Following this procedure, the results were randomly shuffled to create separated training (80% of samples) and validation (20% of samples) datasets using the scikit-learn library of Python [26]. For testing of the trained models, a fourth mosaic (Figure 1) was tiled with the same spatial extension, resolution and overlap. To assess the performance of the trained model on widespread 1 m resolution mosaics, the test backscatter mosaic was also downsampled to a resolution of 1 m.
For classification and object detection, we use an open source RetinaNet [27] implementation in Python, available on GitHub (https://github.com/fizyr/keras-retinanet, last accessed on 6 February 2019). The architecture of RetinaNet includes a backbone convolutional neural network connected to a feature pyramid [28], which detects potential objects in the backscatter mosaics. The detected objects are forwarded to two subnetworks, one for classifying the objects within the bounding box (in this case, the two available classes are boulders and background), and one for the regression of the bounding box coordinates. As a backbone for classification we used ResNet50, with pretrained weights from the Microsoft Coco dataset [29] to speed up training. Initial tests not reported here were carried out using VGG16 as a backbone as well, but ResNet50 consistently provided better results. To update the weights of the convolutional layers, RetinaNet implements a focal loss mechanism [27] for backpropagation of errors during training, which puts an emphasis on the loss contributed by difficult training samples.
RetinaNet expects by default an input image side length of 800 pixels, corresponding to 200 m or 800 m depending on the resolution of the image tiles (0.25 m or 1 m). During training, the extent of the input image is reduced to 1/16th of the original image. This deletes most of the cobbles and fine boulder information from the data if large scale mosaics were fed directly into the network. Hence, the smaller tiles exported from the backscatter mosaics were upscaled to values between 300 and 1200 pixels, which is the simplest approach to facilitate small object detection [30,31]. The size of anchor boxes used to determine the bounding box of objects were left at their standard settings of 32, 64, 128, 256, and 512 pixels. An areal overlap of the bounding box with a manually interpreted bounding box of 0.5 was required to count as a positive detection. To counter overfitting, and the constant orientation of acoustic shadows in the North-South direction due to the East-West tow direction of the acoustic sonar, which cannot be assumed in general, a strong random transformation was applied to the training data. We applied a random rotation, a translation by −0.3 to 0.3 times the image size, a shearing of the picked boulders between −114° and 114°, random scaling down to 0.7 and up to 1.4 and a chance of 0.5 to mirror the image in the North–South and East–West directions.
2.2. Training of RetinaNet
For training of RetinaNet, we set the batch size to 2 and the steps per training epoch between 50 and 800. The number of epochs was kept constant at 30, since the deep network is rapidly overfitting on the limited training dataset after few epochs. Independent models were calculated for the tiles of 25 m2 and 225 m2, and termed the 25 m2 and 225 m2 model. For all image sizes, losses and mean average precision (mAP) [32] are peaking rapidly following 5–15 training epochs. The mAP describes the classification accuracy of the detected boulders, the overlap of the detected bounding boxes with the training bounding boxes, and the percentage of objects identified in every tile. A higher mAP corresponds to a better identification. The data were evaluated on the validation dataset (Figure 3). The following description relates to training on mosaics with 0.25 m resolution. It can be observed that the mAP on the validation dataset is controlled by the size of the input image. The mAP for tiles of 25 m2 exceed 0.6. It drops to slightly below 0.4 for image sizes of 225 m2. This decrease is only partially offset by increasing the upscaled image extension presented to the neural network. Here, a higher upscaling causes a change in mAP of less than 0.1. As larger images consume increasingly more memory and computing capacity, it was not possible to test the relationship routinely upwards of 800 pixels, and limited example runs indicate no mAP increase for upscaling factors exceeding ~15×. The number of steps per epoch has an impact on final mAP of 0.1 to 0.15 chiefly for small image tiles of 25 m2, where it was found that a mean number of steps of ~500 delivered the best results. For larger images, the impact of steps per epoch decreases, and is offset by a larger number of training epochs before overfitting occurs. For mosaics downscaled to 1 m resolution, mAP on the validation dataset were generally less than 0.1.
Based on these observations, a model trained with 225 m2 mosaic tiles, upscaled to 800 pixels, and a model trained with 25 m2 image tiles, upscaled to 300 pixels, were used for further testing on 0.25 m resolution mosaics. The upscaling causes a magnification of boulders by a factor of 13.3 to 15. A model with 225 m2 tiles, upscaled to 300 pixels, was used for classification of mosaics with 1 m resolution, corresponding to an upscaling factor of 20×. The threshold score (probability) for including an object as a boulder was set to 0.5 for all models trained on 0.25 m mosaics and 0.25 for models trained on 1 m mosaics. Detections with lower scores were omitted.
2.3. Determination of Boulder Densities
Boulder densities over 100 × 100 m boxes in the test area (Figure 1) were grouped into three classes, following recent agreements of national German expert groups for the initial assessment of boulder density in large-scale surveys in the German Baltic Sea and North Sea. Classes comprise 0 boulders, 1–5 boulders, and 6 and more boulders. The human interpretation was taken as a baseline. To estimate model performance in comparison to the human interpretation, a confusion matrix was calculated, and the accuracy (ACC), precision (P), and recall (R) were determined by utilizing Pythons sklearn.metrics package (version 0.20.3) [26]. Accuracy describes the percentage of boxes where the interpretation of human interpreter and trained model agree. Precision describes the tendency of the model to not produce false positives, where the best value is 1 and the worst 0. Recall describes the ability of the model to find the same number of boxes for each boulder density class as the human interpreter, where the best value is 1 and the worst 0.
3. Results
3.1. Description of Backscatter Mosaics
Two natural features—glacial till covered by lag deposits and sand areas—are distinguished in the backscatter mosaics and occur both in the training and testing area (Figure 1), corresponding to published maps of seafloor composition [33]. Displayed in darker colors that represent higher backscatter intensities, extended areas of glacial till covered with lag sediment are visible. The majority of surficial boulders in the investigation area are located within lag deposits. The boulders are characterized by increased backscatter on the side that faces the sonar, and decreased backscatter (acoustic shadow) on the other side. Acoustic shadows are either facing towards north or south in all our backscatter mosaics due to east–west ship routes. Grayish colors representing intermediate backscatter intensities, typically corresponding to sandy sediments, are located adjacent to the glacial till covered with lag sediments. Pockets of sandy material are situated within areas covered by lag sediment. While visually decreasing in abundance, individual boulders occur on top of the sandy seafloor, indicating the presence of lag deposits or glacial till closely beneath the surface. In total, 4617 boulders have been recognized on the training mosaics, while a manual counting at a scale of 1:250 yielded 3192 boulders in the test area (Figure 4). The size distribution of the visually interpreted objects in the training mosaics (Figure 5) shows an increasing probability of occurrence for objects with bounding boxes approx. 4.5 m2 in area, with rapidly decreasing probability of occurrence for larger and smaller objects. Crossing both glacial till and sand, elongated plough marks created as a side effect of offshore windpark construction work are present in all backscatter mosaics. The boundaries of the plough marks are typically marked by one or two lines of elongated high backscatter intensity (Figure 6). Within the cable plough marks, boulders or boulder-like features occur frequently, as well as areas of low backscatter intensity between the elongated high backscatter lines. The sedimentological composition of the areas of low backscatter intensities is unknown due to the lack of dedicated ground truthing. East–west directed areas of low backscatter contrast present in all mosaics correspond to the nadir lines of the used sidescan-sonar (Figure 6), where no usable backscatter information is present. In addition, the impact of internal water column stratification is frequently observed. It is caused by small irregularities of the stratification scattering the acoustic signal and is recognized by a curved, chaotic change of backscatter intensities especially in the outer parts of the sonar swath (Figure 6).
3.2. Application of RetinaNet to the Test Backscatter Mosaic
The models trained on 25 m2 and 225 m2 m image subsets were applied to the test mosaic. The following description relates to the application on the 0.25 m resolution mosaic. For the 25 m2 model, the total number of detected boulders in the test area is 5330 (Figure 4). This model detects a higher number of boulder candidates within the sandy seafloor area characterized by intermediate backscatter intensities. In comparison to the visual interpretation, a higher number of objects are detected near the boundaries of the high backscatter plough marks. Some misclassification occurs due to artefacts caused by scatter on internal water column stratification (Figure 6). Within the glacial till boundaries, the 25 m2 model detects a high number of cobbles or small boulders, only a few pixels in size and partly showing only a minimal acoustic shadow 1 pixel in width. However, a visual comparison with the manually interpreted mosaics indicates that the human expert is able to interpret smaller features (Figure 4). A histogram showing the bounding box size of the detected objects (Figure 5) confirms this observation, with the percentage of objects with a bounding box size smaller than 5 m2 considerably higher compared to the 225 m2 model, but still below manual interpretation. Boulders with extensive shadows exceeding 1 m in size can be detected several times due to the overlapping image tiles. For the 25 m2 model, it was tested whether model and human agree if a boulder is present in a tile for 6933 randomly selected samples chosen from the test area. The results are displayed as a binary Receiver Operating Characteristic (ROC) curve available in the supplemental material (Figure S1). The area under the ROC (AUC) is 0.97.
The number of boulders detected by the 225 m2 model is 666 (Figure 4). Few classifications near the boundaries of the cable plough marks occur. The model is not sensitive to artifacts from water column stratification. The number of boulders detected in sandy areas and inside the lag deposits is considerably lower compared to the 25 m2 model (Figure 4). The 225 m2 model captures individual boulders but is not detecting fine boulders or boulders that show only a minimal acoustic shadow. This is reflected in a histogram of the bounding box area (Figure 5), which demonstrates a decrease in detected boulders of small size compared to the 25 m2 model.
For the mosaic of 1 m resolution, the 225 m2 model found a total of 572 boulders (Figure 4). A direct comparison with the interpretation of 0.25 m resolution mosaics shows that both smaller and larger boulders are not detected when using a coarser resolution, and several small boulders may be interpreted as a single large object in lower resolution. The first mode of the bounding box size distribution is located at 10 m2 (Figure 5).
3.3. Boulder Densities
For assessing the applicability of the network in practical work, we compared the classification of boulder density per 10,000 m2 boxes in three groups (no boulder, 1–5 boulders, >5 boulders). The visual interpretation of boulder densities into three classes (Figure 7) confirms high boulder densities on areas covered by lag sediment, while low boulder abundances or the absence of boulders characterize the sand seafloor facies. Accuracy for the 25 m2 model is 0.9 over all classes. The model detects higher boulder densities in low density areas compared to expert classification, with 27% of the boxes that were visually empty counted to contain at least one object by the model. Therefore, the number of empty boxes is underestimated, resulting in a reduced recall for class 0, and reduced precision for class 1–5 (Table 1). Almost no misclassification occurs for boxes visually interpreted to include 1–5 or more than 5 boulders, with recall values of 0.88 and 0.98, respectively. In contrast, the 225 m2 model tends to underestimate boulder density compared to the expert interpretation, with most of the boxes with 1–5 boulders classified as empty, and 28% of the boxes with >5 boulders classified as medium density (Figure 8). This outcome is reflected in low precision and recall rates for the 1–5 class, and reduced recall for the >5 class. The automatic classification of boulder densities based on mosaics with 1 m resolution shows an increase of empty and intermediate boxes compared both to the human interpretation and the higher resolution models, with overall accuracy dropping to 0.54, and precision and recall being less than 0.7 for class 0, and less than 0.5 for class 1–5.
4. Discussion
4.1. Constraining the Minimum Size of Detected Boulders
In marine conservation, all hard substrata with a diameter >64 mm can potentially form a geogenic reef (DG ENV). Therefore, it is mandatory to detect objects of the smallest possible size and to consider the minimum object size detectable by the trained models. The minimum size of objects whose detection can be trained by RetinaNet depends on a) the resolution of the input backscatter mosaic and b) the minimum anchor box of the network measured in pixels multiplied by the threshold of areal overlap of 0.5 required for a positive training [30,31]. For a minimum anchor box of 32 pixels, this results in a theoretical minimum threshold for positive training of 23 × 23 pixels. With the used strong upscaling factor of 13×–15×, this would in principle allow objects of 1 × 3 pixel extension to be trained upon, corresponding to a minimum bounding box area of approx. 0.2 m2 at a backscatter mosaic resolution of 0.25 m, and 3 m2 at a backscatter mosaic resolution of 1 m. However, the detection of objects three pixels in size prior to upscaling would likely result in substantial misclassification due to noise and artefacts inherent in the sidescan-sonar data or due to upscaling artefacts, since no real internal features could be learned by a neural network. In addition, the creation of training datasets at these scales is highly challenging, since the differentiation between real features and noise or artifacts becomes difficult for the human expert interpreter as well, and the pixel-accurate digitization of bounding boxes is unfeasible. Therefore, almost no objects of this size are included in the training dataset (Figure 5). For objects with a 4 × 4 pixel extension, equal to 1 m2 at 0.25 m mosaic resolution, a detection appears possible, since they result in 52 × 52 to 60 × 60 pixels following upscaling and a higher number of corresponding objects is included in the training dataset. However, the bounding box threshold criterion of 0.5 may still be missed for these size classes in case of different alignment of bounding boxes. In addition, it needs to be considered that manually digitized bounding boxes are necessarily inaccurate at the pixel-level and may not be reproduced by the model, and errors on bounding boxes effect smaller objects more than larger objects [30]. For 7 × 7 pixel bounding boxes (3.1 m2 at 0.25 m resolution), a detection appears feasible following the upscaling, as can be observed by the increased detection frequency by the 25 m2 model rivaling the human interpreter (Figure 5).
Naturally, the size of the boulders is not equal to the size of the bounding box, which includes the shadow and some surrounding background. Sidescan-sonar backscatter mosaics do not preserve information on acoustic incidence angles and towfish height that would be needed for an accurate geometrical reconstruction of object size [34], but rough approximations may be made nonetheless. To constrain object size, the area of several boulders facing towards the sidescan-sonar and an eventual transition zone representing the boulder top were measured and divided by the total area of the bounding box (examples shown in Figure 9). Albeit highly variable, the actual boulder encompasses approximately 20% of a bounding box area on average for mosaics of 0.25 m resolution. For bounding boxes of 7 × 7 pixels (3.1 m2) that are picked up with high frequency by the model and the human interpreter, this would equal a boulder-covered area of 3 × 3 pixels (approx. 0.6 m2) at 0.25 m mosaic resolution. In the following, it is assumed that most boulders have a round shape. If the assumption of round shape is violated, e.g., for artificial objects, their detection by the model depends on the orientation of the object to the sidescan-sonar. Ideally, this orientation would be made available as additional data during model training. For round boulders, the diameter of a boulder fitting within a 3 × 3 pixel square will be between 0.5 m at minimum and 0.75 m at maximum. Based on the resolution of the input data, the composition of the training dataset and training parameters chosen in this study, boulders of smaller diameter would likely not be picked up reliably by either the trained model or a human interpreter. For mosaics of 1 m resolution, the minimum size of detected objects decreases correspondingly. For these mosaics, the ratio between bounding box area and estimated stone surface is closer to 0.3 (one example shown in Figure 9). With the most frequent bounding box at 1 m mosaic resolution located at 10 m2, corresponding to approx. 3 × 3 pixels (Figure 5), boulders below diameters of 2 m to 3 m will not be detected reliably.
With the spatial resolution available in large-scale practical applications today, the models trained by neural networks may be useful for the secure identification of medium and large boulders as well as blocks, but not fine boulders or cobbles. A reliable direct classification of cobbles and fine boulders will need higher resolution input data, which can be difficult for large areas of interest. If covering a large percentage of seafloor, the presence of cobbles and fine boulders may be detected indirectly, e.g., by utilizing angular response curves [35,36] and multifrequency backscatter approaches currently under active development [37,38,39,40]. Eventually, the density of medium and large boulders may be used as a proxy for the overall density of hard substrata available for biota and consequently for the identification of reefs sensu habitats directive (code 1170). However, future work on the statistical distribution of cobbles and boulders in lag deposits of different geological origin is recommended.
4.2. Model Performance on the Validation Dataset
The accuracy of the different models on the validation dataset were highly variable. In contrast to the models trained on 0.25 m resolution mosaics, the mAP of models validated on the 1.0 m backscatter mosaic is significantly worse (Figure 3). This is caused by the use of a training dataset digitized on the 0.25 m resolution mosaics for training. On the 1 m mosaic, a high number of boulders cannot be differentiated due to the decreased resolution, and are not found during model validation. It was attempted to create a training dataset on 1 m mosaics, but due to the coarse resolution (examples in Figure 4 and Figure 9), it is not possible for a human interpreter to reliably distinguish potential boulders from noise and create accurate bounding boxes. As an effect, the score assigned by the 1 m trained model to detections in the test area decreased, which was offset by cutting the score threshold required for a positive detection from 0.5 to 0.25.
For the 0.25 m resolution mosaics, the main difference in performance between the 25 m2 and 225 m2 model is the higher sensitivity of the 25 m2 model, picking more boulders on the lag deposits and the sandy seafloor, but also being more sensitive to boundaries of the cable plough marks. It is unlikely that the different upscaling of boulders in the original mosaic is responsible for the sensitivity increase, as it is very similar for both models (15× for the 25 m2 model and 13.3× for the 225 m2 model), and both should be able to detect boulders of 7 × 7 pixels in extension as discussed above. It may rather be assumed that the reason is the different amount of background, which is implicitly trained in ResNet. While to our knowledge no boulder size distributions of the different Baltic Sea lag deposits area exist, it may be a reasonable assumption that the number of small boulders is increasing nonlinearly: The source of objects exposed on Kriegers Flak are glacial till deposits. A correlation of grain size distribution on the type of till, original bedrock, and topography exists [41], but lodgement tills widespread in the Baltic show grain size maxima in the silt-clay and gravel domain [42]. Given that significant reemergence of cobbles and boulders from glacial till takes place over decades [43], thus quickly regenerating following submergence of the former coastlines, effects of Holocene water level fluctuations [44] in the Baltic Sea do not need to be considered. The grain size of the armor layer that forms on top of glacial is typically located in the gravel fraction in the Baltic Sea [45], not resolved by the acoustic backscatter mosaics and below the 3 m2 to 5 m2 bounding box related to boulders of ~0.7 m diameter. Hence, the decrease in objects with bounding boxes smaller than approx. 3 m2 is presumably caused by increasing difficulty of interpreting small objects from the background, ultimately limited by mosaic resolution, and does not represent the true geological conditions. Therefore, a lot of small boulders or large cobbles are overlooked by the human interpreter (Figure 2), forming false negatives during training. These objects are trained as background during the training runs especially for the 225 m2 model, reducing its sensitivity to small objects. For further optimization of the neural network, efforts to improve the training dataset with more extensive ground truthing including small objects are required.
4.3. Sources of Error and Comparison with Expert Interpretation
A main criteria for the practical applicability of automated objects detections is to reduce the number of false positive detections. An especially difficult source of error during the detection of objects of small size—both for humans and the trained models—is caused by stratification of the water column, which scatters acoustic waves at oblique incidence angles and is very prominent in sidescan-sonar backscatter data especially in the Baltic Sea (an example shown in Figure 6). A second source of misclassification are the boundaries of the plough marks. The higher backscatter intensities at their boundary facing towards the sidescan-sonar due the morphological depression formed by the central trough, are in some cases wrongly picked up especially by the 25 m2 model (Figure 6). However, due to the glacial till situated closely beneath the sand surface, boulders may have been exposed within the plough marks. Therefore, a judgement whether an object was picked correctly or erroneously by the model was not always possible. It is expected that the use of snippet-derived multibeam echo sounder backscatter data [46], would mitigate both sources of misclassification. Since snippet derived backscatter centers the backscatter time series on the detected seafloor position, effects of noise situated in the water column are minimized. In addition, the availability of a local bathymetric data would help to distinguish the boundaries of plough marks from discrete objects. Still, for a random selection of samples, the AUC of 0.97 between the best model and human interpreter (Figure S1) indicates a generally very high agreement between model and human. The remaining misclassifications in backscatter mosaics can be mitigated using a raster-based approach (Figure 7) that also allows to distinguish boulder densities into the three classes mentioned above. The reasoning behind this classification was that a human interpreter can quickly recognize 5 items in a 100 × 100 m box at a glance, but is required to count objects exceeding four or five [47]. With an overall average accuracy of 0.9, the performance of the trained 25 m2 model is very close to the results of a human interpreter. All models achieve a precision of 1.0 on boulder densities class >5 (Table 1), indicating the quality of the found boxes needs no further quality check by the human interpreter. However, the recall (and corresponding overall accuracy) is continuously decreasing with tile size and mosaic resolution, indicating an increasing amount of seafloor with high density coverage of boulders is not recognized. A higher disagreement is observed for boxes interpreted as empty, or including 1–5 boulders, where values for either precision or recall drop below 0.6, potentially requiring additional quality assurance by human interpreters. However, it has to be taken into account that the human interpretation is certainly not always correct, given the inevitable lack of ground truthing, and absolute performance of the models may be better than indicated by these values. In summary, it is suggested that neural networks could take over most of the tedious process of digitizing boulder sized objects from backscatter data into maps of boulder density. Those maps can in turn serve as a baseline for the identification of reefs (code 1170) protected under European legislation, but to obtain complete maps of individual boulders, an improvement of the training datasets to increase the sensitivity of the models will be required.
5. Conclusions
Neural networks are capable of detecting boulder sized objects in sidescan-sonar backscatter mosaics. It is found that a reliable detection requires boulders to encompass at least 3 × 3 pixels in the backscatter mosaics of 0.25 m and 1 m resolution, thus dictating the minimum boulder diameter that is reliably detected. To further improve the trained models, an improved training dataset with more positive and negative examples including other environments, such as shallow waters, will be required. In addition, the models should be transferred to include multibeam echo sounders or interferometric sidescan-sonar derived mosaics, because coregistered bathymetric data would be available for detection and effects of water column noise minimized. With these modifications in place, the proposed approach may serve as a tool to identify reefs that are protected under European legislation in offshore areas where remote sensing by drones, airplanes, or satellites is not applicable and may also replace the time consuming manual interpretation in reporting for marine constructions.
Supplementary Materials
The following are available online at https://www.mdpi.com/2076-3263/9/4/159/s1, Figure S1: Binary ROC curve for the 25 m2 model compared against the human interpretation of 6933 samples from the test area. It was tested whether model and human agree if a boulder is present in a 25m2 area. S2: Full resolution mosaics of the training and test area in geographic coordinates (WGS84). S3: Sqlite database (geographic coordinates WGS84) with the boundary boxes of manually picked stones and negative examples.
Author Contributions
Conceptualization, P.F. and A.D.; Methodology, P.F. and F.T.; Formal Analysis, P.F.; Investigation, P.F., A.F., F.T., A.D.; Writing—Original Draft Preparation, P.F.; Writing—Review & Editing, A.D., A.F. and F.T.; Visualization, P.F. and F.T.
Funding
This research received no external funding.
Acknowledgments
The authors wish to thank the Federal Maritime and Hydrographic Agency (BSH) for their support, namely Jennifer Valerius and Claudia Propp. Philippe Blondel and two anonymous reviewers provided detailed and constructive comments that improved the manuscript. The publication of this article was funded by the Open Access Fund of the Leibniz Association.
Conflicts of Interest
The authors declare no conflict of interest.
References
- Wahl, M. Habitat Characteristics and Typical Functional Groups. In Marine Hard Bottom Communities: Patterns, Dynamics, Diversity, and Change; Wahl, M., Ed.; Ecological Studies; Springer Berlin Heidelberg: Berlin/Heidelberg, Germany, 2009; pp. 7–17. ISBN 978-3-540-92704-4. [Google Scholar]
- Terry, J.; Goff, J. Megaclasts: Proposed Revised Nomenclature at the Coarse End of the Udden-Wentworth Grain-Size Scale for Sedimentary Particles. J. Sediment. Res. 2014, 84, 192–197. [Google Scholar] [CrossRef]
- Andrén, T.; Björck, S.; Andrén, E.; Conley, D.; Zillén, L.; Anjar, J. The Development of the Baltic Sea Basin During the Last 130 ka. In The Baltic Sea Basin; Harff, J., Björck, S., Hoth, P., Eds.; Springer Berlin Heidelberg: Berlin/Heidelberg, Germnay, 2011; pp. 75–97. ISBN 978-3-642-17219-9. [Google Scholar]
- Feldens, P.; Diesing, M.; Wilken, D.; Schwarzer, K. Submarine eskers preserved on Adler Grund, south-western Baltic Sea. Baltica 2013, 26, 137–144. [Google Scholar] [CrossRef]
- Lemke, W.; Jensen, J.; Bennike, O.; Endler, R.; Witkowski, A.; Kuijpers, A. Hydrographic thresholds in the western Baltic Sea: Late Quaternary geology and the Dana River concept. Mar. Geol. 2001, 176, 191–201. [Google Scholar] [CrossRef]
- Glogowski, S.; Dullo, W.-C.; Feldens, P.; Liebetrau, V.; von Reumont, J.; Hühnerbach, V.; Krastel, S.; Wynn, R.B.; Flögel, S. The Eugen Seibold coral mounds offshore western Morocco: Oceanographic and bathymetric boundary conditions of a newly discovered cold-water coral province. Geo-Mar. Lett. 2015, 35, 257–269. [Google Scholar] [CrossRef]
- Blondel, P. Automatic mine detection by textural analysis of COTS sidescan sonar imagery. Int. J. Remote Sens. 2000, 21, 3115–3128. [Google Scholar] [CrossRef]
- Papenmeier, S.; Hass, H. Detection of Stones in Marine Habitats Combining Simultaneous Hydroacoustic Surveys. Geosciences 2018, 8, 279. [Google Scholar] [CrossRef]
- Zeiler, M.; Schulz-Ohlberg, J.; Figge, K. Mobile sand deposits and shoreface sediment dynamics in the inner German Bight (North Sea). Mar. Geol. 2000, 170, 363–380. [Google Scholar] [CrossRef]
- BSH Guideline for Seafloor Mapping in German Marine Waters Using High-Resolution Sonars; BSH No. 7201; Federal Maritime and Hydrographic Agency (BSH): Hamburg and Rostock, Germany, 2016; p. 147.
- Brown, C.J.; Blondel, P. Developments in the application of multibeam sonar backscatter for seafloor habitat mapping. Appl. Acoust. 2009, 70, 1242–1247. [Google Scholar] [CrossRef]
- Brown, C.; Hewer, A.; Limpenny, D.; Cooper, K.; Rees, H.; Meadows, W. Mapping seabed biotopes using sidescan sonar in regions of heterogeneous substrata: Case study east of the Isle of Wight, English Channel. Underw. Technol. 2004, 26, 27–36. [Google Scholar] [CrossRef]
- Wilken, D.; Feldens, P.; Wunderlich, T.; Heinrich, C. Application of 2D Fourier filtering for elimination of stripe noise in side-scan sonar mosaics. Geo-Mar. Lett. 2012, 32, 337–347. [Google Scholar]
- Reed, S.; Petillot, Y.; Bell, J. An automatic approach to the detection and extraction of mine features in sidescan sonar. IEEE J. Ocean. Eng. 2003, 28, 90–105. [Google Scholar] [CrossRef]
- Fakiris, E.; Papatheodorou, G.; Geraga, M.; Ferentinos, G. An Automatic Target Detection Algorithm for Swath Sonar Backscatter Imagery, Using Image Texture and Independent Component Analysis. Remote Sens. 2016, 8, 373. [Google Scholar] [CrossRef]
- Wang, X.; Zhao, J.; Zhu, B.; Jiang, T.; Qin, T. A Side Scan Sonar Image Target Detection Algorithm Based on a Neutrosophic Set and Diffusion Maps. Remote Sens. 2018, 10, 295. [Google Scholar] [CrossRef]
- Liang, M.; Hu, X. Recurrent convolutional neural network for object recognition. In Proceedings of the 2015 IEEE Conference on Computer Vision and Pattern Recognition (CVPR); IEEE: Boston, MA, USA, 2015; pp. 3367–3375. [Google Scholar]
- Bourgeois, B.; Walker, C. Sidescan Sonar Image Interpretation with Neural Networks. In Proceedings of the OCEANS 91 Proceedings; IEEE: Honolulu, HI, USA, 1991; pp. 1687–1694. [Google Scholar]
- Marsh, I.; Brown, C. Neural network classification of multibeam backscatter and bathymetry data from Stanton Bank (Area IV). Appl. Acoust. 2009, 70, 1269–1276. [Google Scholar] [CrossRef]
- Krizhevsky, A.; Sutskever, I.; Hinton, G.E. ImageNet Classification with Deep Convolutional Neural Networks. In Proceedings of the 25th International Conference on Neural Information Processing Systems—Volume 1; Curran Associates Inc.: New York, NY, USA, 2012; pp. 1097–1105. [Google Scholar]
- Simonyan, K.; Zisserman, A. Very Deep Convolutional Networks for Large-Scale Image Recognition. arXiv 2014, arXiv:1409.1556. [Google Scholar]
- Pascanu, R.; Mikolov, T.; Bengio, Y. On the Difficulty of Training Recurrent Neural Networks. In Proceedings of the International Conference on Machine Learning, Atlanta, GA, USA, 16–21 June 2013. [Google Scholar]
- Veit, A.; Wilber, M.; Belongie, S. Residual Networks Behave Like Ensembles of Relatively Shallow Networks. In Proceedings of the Advances in Neural Information Processing Systems, Barcelona, Spain, 5–10 December 2016. [Google Scholar]
- He, K.; Zhang, X.; Ren, S.; Sun, J. Deep Residual Learning for Image Recognition. In Proceedings of the IEEE Conference on Computer Vision and Pattern Recognition, Boston, MA, USA, 7–12 June 2015. [Google Scholar]
- Agarwal, S.; Terrail, J.O.D.; Jurie, F. Recent Advances in Object Detection in the Age of Deep Convolutional Neural Networks. arXiv 2018, arXiv:1809.03193. [Google Scholar]
- Pedregosa, F.; Varoquaux, G.; Gramfort, A.; Michel, V.; Thirion, B.; Grisel, O.; Blondel, M.; Prettenhofer, P.; Weiss, R.; Dubourg, V.; et al. Scikit-learn: Machine Learning in Python. J. Mach. Learn. Res. 2011, 12, 2825–2830. [Google Scholar]
- Lin, T.-Y.; Goyal, P.; Girshick, R.; He, K.; Dollár, P. Focal Loss for Dense Object Detection. In Proceedings of the IEEE International Conference on Computer Vision, Venice, Italy, 22–29 October 2017. [Google Scholar]
- Lin, T.-Y.; Dollár, P.; Girshick, R.; He, K.; Hariharan, B.; Belongie, S. Feature Pyramid Networks for Object Detection. In Proceedings of the IEEE Conference on Computer Vision and Pattern Recognition, Las Vegas, NV, USA, 27–30 June 2016. [Google Scholar]
- Lin, T.-Y.; Maire, M.; Belongie, S.; Bourdev, L.; Girshick, R.; Hays, J.; Perona, P.; Ramanan, D.; Zitnick, C.L.; Dollár, P. Microsoft COCO: Common Objects in Context. In European Conference on Computer Vision; Springer: Cham, Switzerland, 2014. [Google Scholar]
- Eggert, C.; Zecha, D.; Brehm, S.; Lienhart, R. Improving Small Object Proposals for Company Logo Detection. In Proceedings of the 2017 ACM on International Conference on Multimedia Retrieval, Bucharest, Romania, 6–9 June 2017; pp. 167–174. [Google Scholar]
- Ren, Y.; Zhu, C.; Xiao, S. Small Object Detection in Optical Remote Sensing Images via Modified Faster R-CNN. Appl. Sci. 2018, 8, 813. [Google Scholar] [CrossRef]
- Everingham, M.; Van Gool, L.; Williams, C.K.I.; Winn, J.; Zisserman, A. The Pascal Visual Object Classes (VOC) Challenge. Int. J. Comput. Vis. 2010, 88, 303–338. [Google Scholar] [CrossRef]
- Tauber, F. Meeresbodensedimente und Meeresbodenrelief in der Deutschen Ostsee: Datenpositionen und Blattschnitt, Karte Nr. 2930 = Seabed Sediments and Seabed Relief in the German Baltic Sea: Data Positions and Sheet Index, Map no. 2930 [Map] 1: 550 000, 54° N; Bundesamt für Seeschifffahrt und Hydrographie: Hamburg, Germany, 2012. [Google Scholar]
- Blondel, P. The Handbook of Sidescan Sonar; Springer: New York, NY, USA, 2009. [Google Scholar]
- Alevizos, E.; Greinert, J. The Hyper-Angular Cube Concept for Improving the Spatial and Acoustic Resolution of MBES Backscatter Angular Response Analysis. Geosciences 2018, 8, 446. [Google Scholar] [CrossRef]
- Che Hasan, R.; Ierodiaconou, D.; Laurenson, L. Combining angular response classification and backscatter imagery segmentation for benthic biological habitat mapping. Estuar. Coast. Shelf Sci. 2012, 97, 1–9. [Google Scholar] [CrossRef]
- Fakiris, E.; Blondel, P.; Papatheodorou, G.; Christodoulou, D.; Dimas, X.; Georgiou, N.; Kordella, S.; Dimitriadis, C.; Rzhanov, Y.; Geraga, M.; et al. Multi-Frequency, Multi-Sonar Mapping of Shallow Habitats—Efficacy and Management Implications in the National Marine Park of Zakynthos, Greece. Remote Sens. 2019, 11, 461. [Google Scholar] [CrossRef]
- Feldens, P.; Schulze, I.; Papenmeier, S.; Schönke, M.; Schneider von Deimling, J. Improved Interpretation of Marine Sedimentary Environments Using Multi-Frequency Multibeam Backscatter Data. Geosciences 2018, 8, 214. [Google Scholar] [CrossRef]
- Gaida, T.C.; Tengku Ali, T.A.; Snellen, M.; Amiri-Simkooei, A.; Van Dijk, T.A.G.P.; Simons, D.G. A Multispectral Bayesian Classification Method for Increased Acoustic Discrimination of Seabed Sediments Using Multi-Frequency Multibeam Backscatter Data. Geosciences 2018, 8, 455. [Google Scholar] [CrossRef]
- Buscombe, D.; Grams, P.E. Probabilistic Substrate Classification with Multispectral Acoustic Backscatter: A Comparison of Discriminative and Generative Models. Geosciences 2018, 8, 395. [Google Scholar] [CrossRef]
- Haldorsen, S. Grain-size distribution of subglacial till and its relstion to glacial crushing and abrasion. Boreas 1981, 10, 91–105. [Google Scholar] [CrossRef]
- Bennett, M.R.; Glasser, N.F. Glacial Geology: Ice Sheets and Landforms, 2nd ed.; Wiley-Blackwell: Oxford, UK, 2009. [Google Scholar]
- Bohling, B.; May, H.; Mosch, T.; Schwarzer, K. Regeneration of submarine hard-bottom substrate by natural abrasion in the western Baltic Sea. Marbg. Geogr. Schriften 2009, 145, 66–79. [Google Scholar]
- Lampe, R. Lateglacial and Holocene water-level variations along the NE German Baltic Sea coast: Review and new results. Quat. Int. 2005, 133–134, 121–136. [Google Scholar] [CrossRef]
- Winn, K.; Averdieck, F.-R.; Werner’, F. Spät- und postglaziale Entwicklung des Vejsnaes-Gebietes (Westliche Ostsee). Meyniana 1982, 34, 1–28. [Google Scholar]
- Kunde, T.; Held, P.; Sternberg, H.; Schneider von Deimling, J. Ammunition detection using high frequency multibeam snippet backscatter information. Mar. Pollut. Bull. 2018, 133, 481–490. [Google Scholar] [CrossRef]
- Butterworth, B. The development of arithmetical abilities. J. Child Psychol. Psychiatry 2005, 46, 3–18. [Google Scholar] [CrossRef] [PubMed]
Figure 1.
Location of the investigation area in the Baltic Sea and position of mosaics used for testing and training. Full resolution mosaics are available as Supplementary Material S2.
Figure 1.
Location of the investigation area in the Baltic Sea and position of mosaics used for testing and training. Full resolution mosaics are available as Supplementary Material S2.

Figure 2.
Examples of boulder bounding boxes manually interpreted from the training mosaic. Ideally, stones are characterized by a high backscatter front facing the sidescan-sonar, an intermediate backscatter top, and an adjacent acoustic shadow (A). In several cases, densely packed boulders (B) could not be individually digitized and have not been included in the training dataset. Arrows indicate the direction of insonification in A and B. Several cobbles or small boulders (upper right) have been missed during mosaic screening. All training boundary boxes are available as Supplementary Material S3.
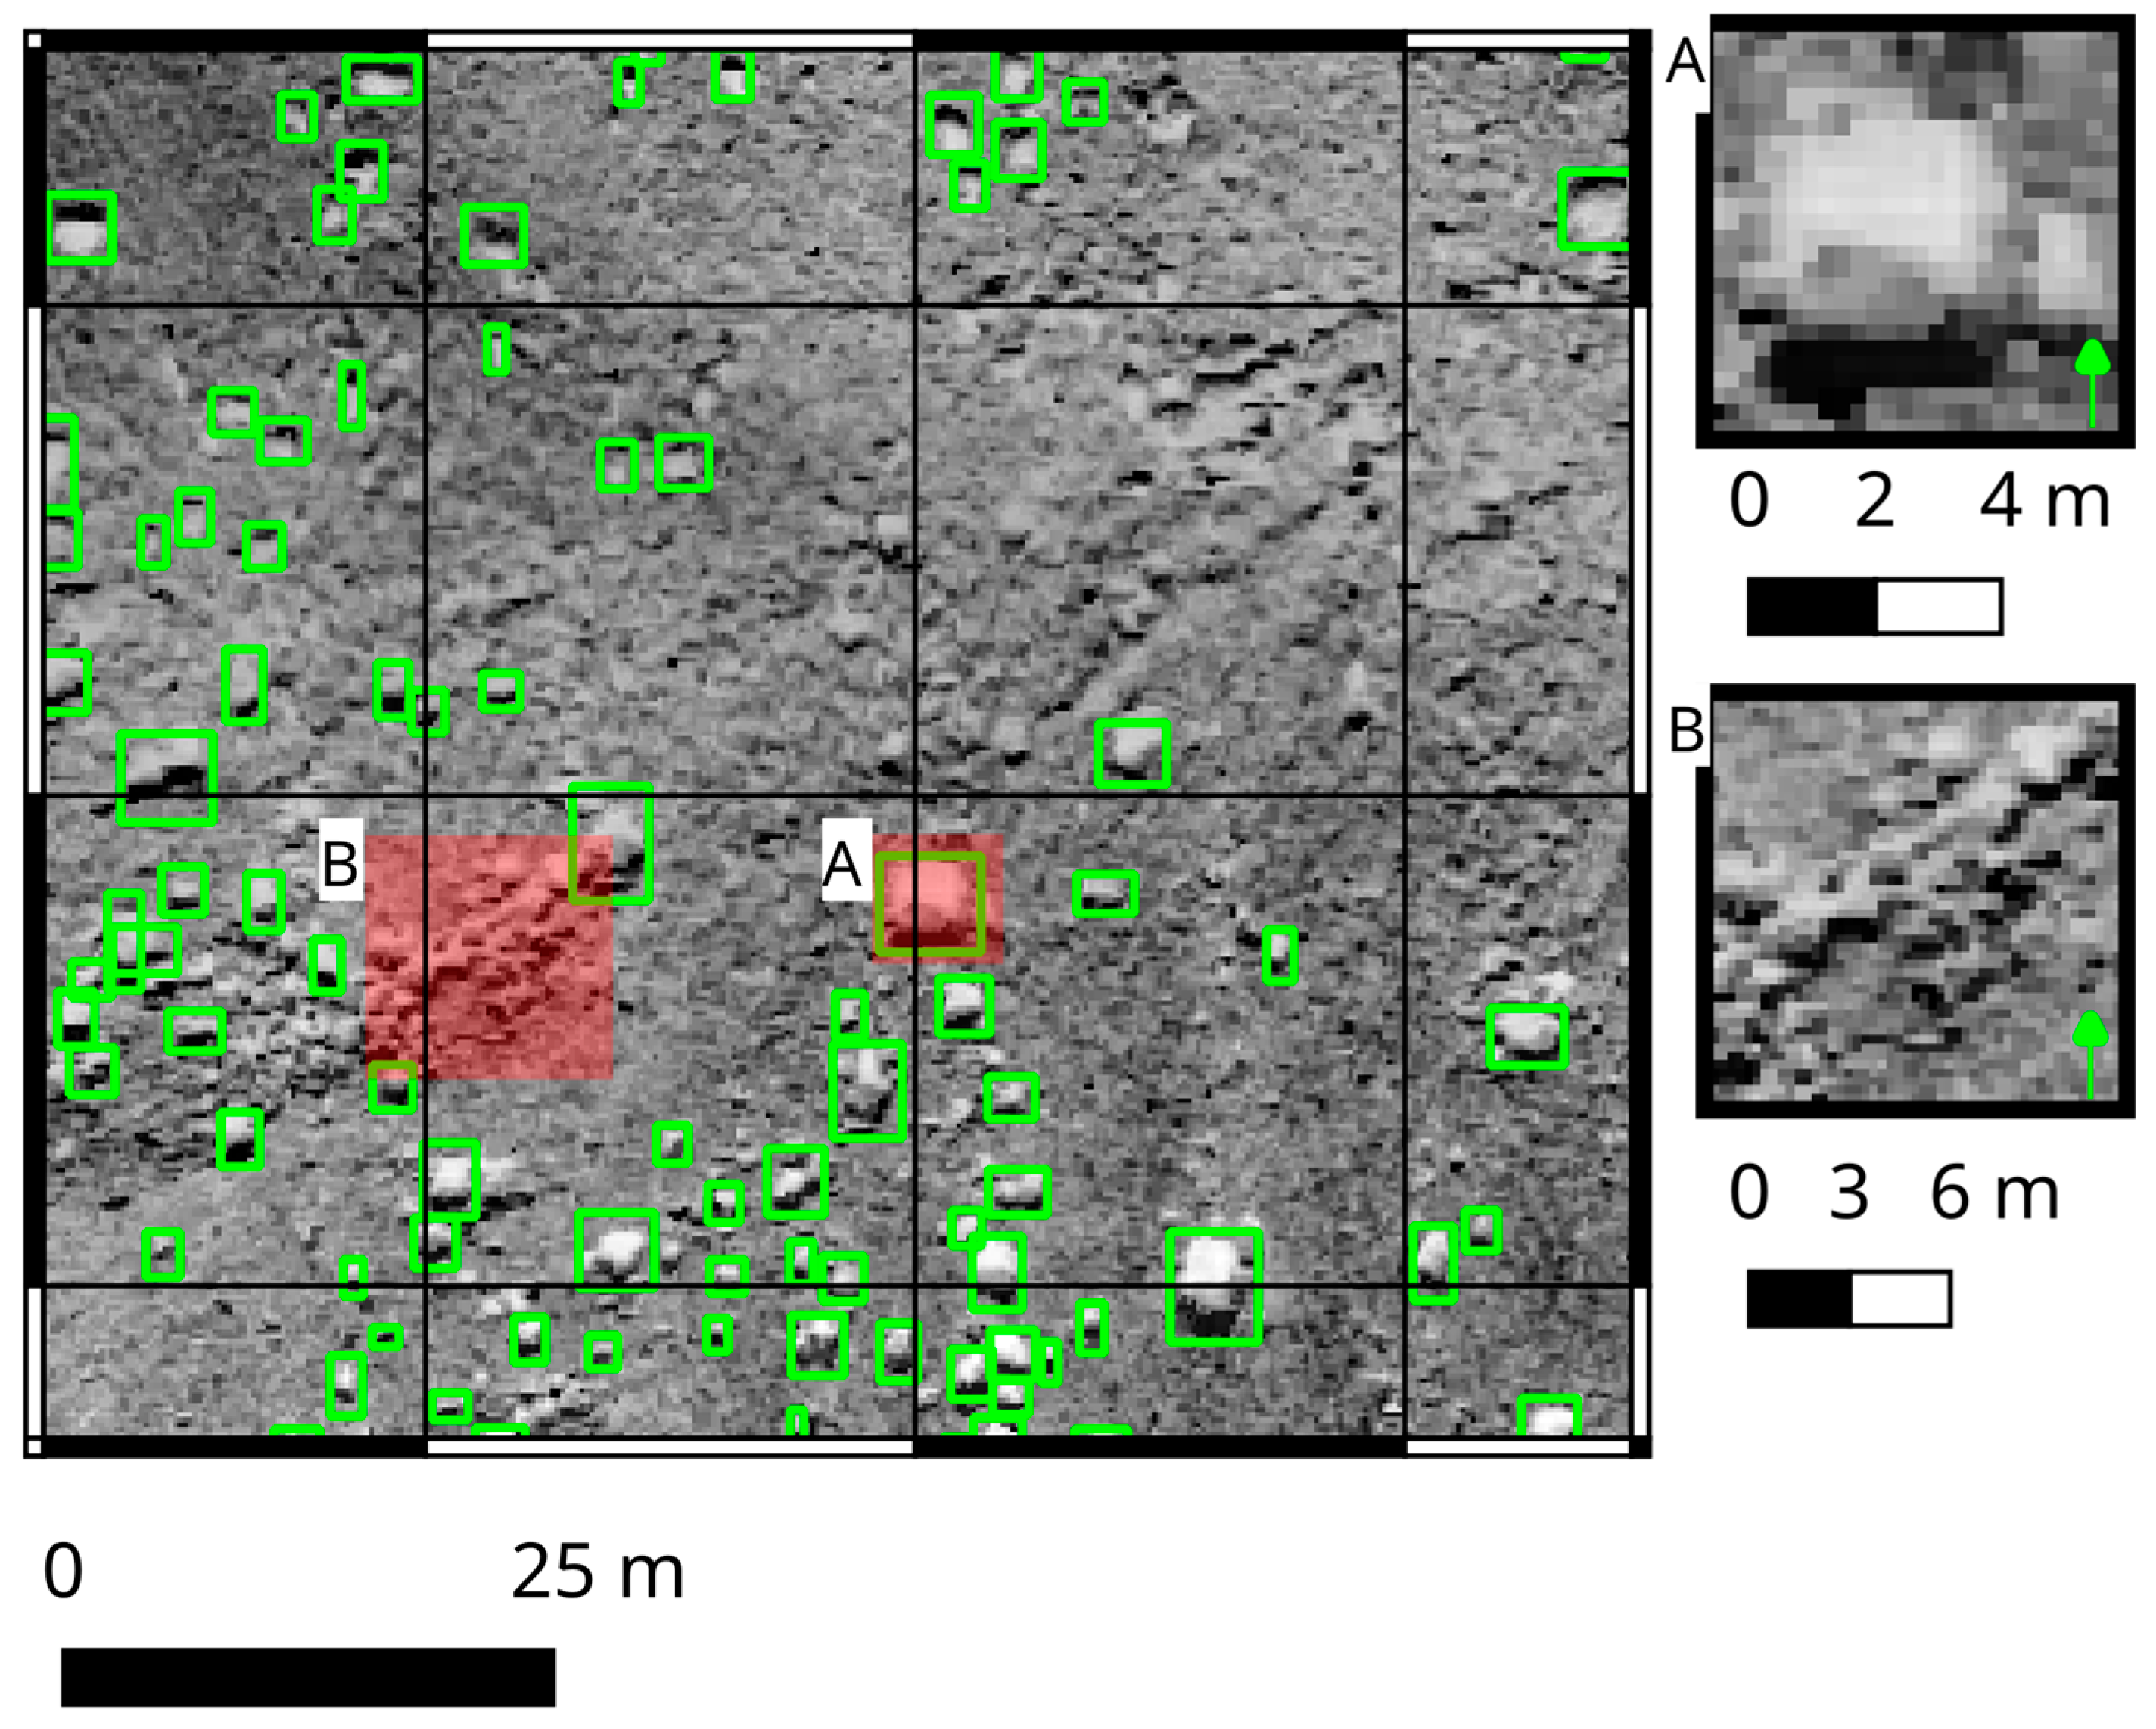
Figure 3.
Training results of the different models. Image size refers to the width and height of the backscatter mosaic tiles. Pixel size refers to the pixel count each mosaic tile is upscaled to prior to training with the neural network. The mean average precision (mAP) represents the model performance on the validation dataset.

Figure 4.
Boulders (green boxes and dots) detected manually and by the 25 m2 and 225 m2 model trained on backscatter mosaics with 0.25 m and 1.0 m resolution. For the manual interpretation of the test mosaic, no bounding boxes are available.
Figure 4.
Boulders (green boxes and dots) detected manually and by the 25 m2 and 225 m2 model trained on backscatter mosaics with 0.25 m and 1.0 m resolution. For the manual interpretation of the test mosaic, no bounding boxes are available.

Figure 5.
Histogram of the relative percentage of different bounding box areas of boulders and their shadows. The side length of a square object equivalent to the bounding box area is given for 0.25 m and 1 m backscatter mosaics. Bounding boxes for manual classification were determined from the training mosaics, the bounding boxes for the models are derived from the test mosaics.

Figure 6.
Details of classification results on sand and examples of misclassification due to water column stratification and cable plough marks. All boulder detections are based on the 25 m2 model. The underlying mosaic resolution is 0.25 m.
Figure 6.
Details of classification results on sand and examples of misclassification due to water column stratification and cable plough marks. All boulder detections are based on the 25 m2 model. The underlying mosaic resolution is 0.25 m.

Figure 7.
Block densities as determined by expert interpretation (A), the 25 m2 model based on a 0.25 m resolution mosaic (B), the 225 m2 model based on a 0.25 m resolution mosaic (C) and the 225 m2 model based on a 1 m resolution mosaic (D).
Figure 7.
Block densities as determined by expert interpretation (A), the 25 m2 model based on a 0.25 m resolution mosaic (B), the 225 m2 model based on a 0.25 m resolution mosaic (C) and the 225 m2 model based on a 1 m resolution mosaic (D).

Figure 8.
Confusion matrix of boulder densities determined by the different models vs. the visually interpreted mosaic. Parameters derived from the confusion matrix are given in Table 1.
Figure 8.
Confusion matrix of boulder densities determined by the different models vs. the visually interpreted mosaic. Parameters derived from the confusion matrix are given in Table 1.

Figure 9.
Relationship between area of different bounding boxes (upper number) and estimated area actually covered by boulders (lower number) for 1 m and 0.25 m mosaics. Although variable, the area covered by boulders represents 20% of the bounding box on average. Arrows indicate the direction of insonification.


Table 1.
Accuracy (ACC), precision (P), and recall (R) of the boulder density confusion matrix.
| Model | 0 (P/R) | 1–5 (P/R) | >5 (P/R) | ACC |
|---|---|---|---|---|
| 25 m2 | 0.93/0.72 | 0.54/0.88 | 1.00/0.98 | 0.90 |
| 225 m2 | 0.75/1.00 | 0.20/0.38 | 1.00/0.72 | 0.75 |
| 225 m2 @ 1 m | 0.60/0.67 | 0.14/0.50 | 1.00/0.50 | 0.54 |
© 2019 by the authors. Licensee MDPI, Basel, Switzerland. This article is an open access article distributed under the terms and conditions of the Creative Commons Attribution (CC BY) license (http://creativecommons.org/licenses/by/4.0/).
Share and Cite
MDPI and ACS Style
Feldens, P.; Darr, A.; Feldens, A.; Tauber, F. Detection of Boulders in Side Scan Sonar Mosaics by a Neural Network. Geosciences 2019, 9, 159. https://doi.org/10.3390/geosciences9040159
AMA Style
Feldens P, Darr A, Feldens A, Tauber F. Detection of Boulders in Side Scan Sonar Mosaics by a Neural Network. Geosciences. 2019; 9(4):159. https://doi.org/10.3390/geosciences9040159
Chicago/Turabian StyleFeldens, Peter, Alexander Darr, Agata Feldens, and Franz Tauber. 2019. "Detection of Boulders in Side Scan Sonar Mosaics by a Neural Network" Geosciences 9, no. 4: 159. https://doi.org/10.3390/geosciences9040159
Note that from the first issue of 2016, this journal uses article numbers instead of page numbers. See further details here.