Assessing the Protective Capacity of Aquifers Using Very-Low-Frequency Electromagnetic Survey
by
 ,
,
Oghenero Ohwoghere-Asuma
1,* ,
,
Kizito Ejiro Aweto
1,
Felix I. Chinyem
1 and
Hyacinth O. Nwankwoala
2 1
Department of Geology, Delta State University, Abraka 330106, Nigeria
2
Department of Geology, University of Port Harcourt, River State 5323, Nigeria
*
Author to whom correspondence should be addressed.
Geosciences 2018, 8(5), 150; https://doi.org/10.3390/geosciences8050150
Submission received: 29 November 2017
/
Revised: 9 March 2018
/
Accepted: 21 March 2018
/
Published: 26 April 2018
Abstract
:The protective capacity of aquifers is a prerequisite for groundwater quality in areas prone to contamination from the ground surface. Aquifers without protective layers are more susceptible to contaminations from point and non-point sources. The protective capacity of an aquifer significantly correlates with the thickness of clay and organic materials that mantled it. To assess aquifer protective capacity, electrical conductivity property of saturated clay was determined from filtered imaginary and real components of Very Low-Frequency Electromagnetic (VLF-EM). The filtered real components against distance and current density pseudo-section produced from real components were concomitantly used for interpretation. Clays capping aquifers were delineated from those without capping from low and high values of filtered imaginary and real components and current density pseudo-section. The distribution of clay laterally across the area indicates that aquifers are poorly protected and susceptible to contaminations from a point and non-point sources. The apparent agreement between inferred geology from VLF-EM interpretation, borehole data and resistivity data underscores the efficacy of VLF-EM as an important tool that can be used or combined with other geophysical methods and borehole information/data for assessment of the protective capacity of the aquifer.
1. Introduction
Aquifer vulnerability is a concept that describes the susceptibility of groundwater quality to contaminant loading [1] and is influenced by the inherent properties of the aquifer. Groundwater covering layers are necessary for the protection of an aquifer against imposed contaminant loading. The degree of protection is determined by the geologic material covering the aquifer. The type of geologic material covering aquifer is important as its presence or absence may act as a barrier or facilitate the infiltration of contaminants. It also degrades contaminants through chemical, mechanical and biological processes. The availability of a barrier or its absence renders aquifers more or less vulnerable to migrating contaminants due to a low infiltration rate.
Generally, the vulnerability of an aquifer is low when infiltration rate is high and vice versa. Infiltration rate is controlled by the hydraulic conductivity and the thickness of the geologic layer covering groundwater [2,3]. Geologically, the groundwater-covering layer may either consist of sand or clay, which, in turn, is covered by a thin layer of organic matter. Clay and organic materials that capped aquifers are capable of absorbing migrating contaminants, and doing this prevents further transport of contaminants into groundwater. Permeable sand facilitates higher infiltration rates and enhances transport of contaminants into aquifers. Thus, aquifers with sand as covering material are more vulnerable than clay, which is less vulnerable to an imposed contaminant loading. Generally, contaminants are transported by infiltrating rainwater from the ground surface through the unsaturated into the saturated zones. Consequently, the geological materials covering aquifers are vital to the protection of groundwater against contamination.
The use of geophysical methods for the identification of subsurface lithology in sedimentary terrain has attracted wide usage, especially the direct current method. The same approach can be used for aquifer protective capacity determination by inferring conductivity of subsurface lithology from resistivity. Most studies in the Nigeria Niger Delta involving vulnerability of aquifers have been on electrical resistivity methodology and with no record of VLF-EM. The reason is that VLF-EM usage is believed to be more applicable to basement terrain than sedimentary terrain. The protective capacity of the aquifers in Sapele, part of the Niger Delta, Nigeria was assessed by Atakpo [4] from electrical resistivity sounding. The assessment divulged that aquifers in the area are poorly protected from probable contaminants from the ground surface. The authors [5] revealed that aquifers underneath Yenegoa City, Bayelsa state, Nigeria, are poorly to moderately protected. VLF-EM has been used in conjunction with resistivity data in the determination of soil and groundwater contaminated by hydrocarbon in the state of Utah, USA, and Alvin et al. [6], concluded that both methods are effective for groundwater contamination study. The researchers [7] utilized high resistivity contrast between basement rocks and sedimentary rocks to delineate gravel, sand and clay covering material from basement rock using VLF-EM data. Similarly, the authors of [8] used VLF-EM at Isara-Remo, southwestern Nigeria, to identify fissures that are potential zones for groundwater in basement rocks. In addition, Raji and Adeoye [9] used coupled VLF and resistivity approach to delineate leachate plume at a reclaimed open dumpsite. In all of these studies, tremendous success was achieved from the usage of VLF-EM.
The source of groundwater contaminants in the study area includes leachates from ubiquitous dumpsites, septic tanks, pesticides, herbicides and wastes from mechanic workshops. The impacts of drinking contaminated groundwater on humans are well documented in the literature [10,11,12], and, consequently, it is natural that aquifers need to be protected from anthropogenic sources. The protection of aquifers is exclusively relevant to the sustainable management of groundwater resources. The study is significant because groundwater forms the principal source of drinking water in the Niger Delta, and, thus, its quality is essential for the social economic development and well-being of the people of the region. The best management approach to protecting and sustaining groundwater quality is to circumvent pollutants from contaminating it [10,13]. This is because materials that mantled most aquifers are themselves barriers and have the propensity to degrade contaminants. Generally, aquifers are made of sand, sandstones and limestone and are confined by clays. Confined aquifers are less predisposed to contamination compared to sand. Sands saturated with freshwater and saltwater are characterized by low and high conductivity; clays, on the other hand, they are of high electrical conductivity. The study explores the electrical conductivities properties of VLF-EM to delineate the protective capacity of aquifer vis-a-vis examination of the conductivity of the geologic materials, which mantled aquifers.
2. Description of the Study Area
2.1. Location
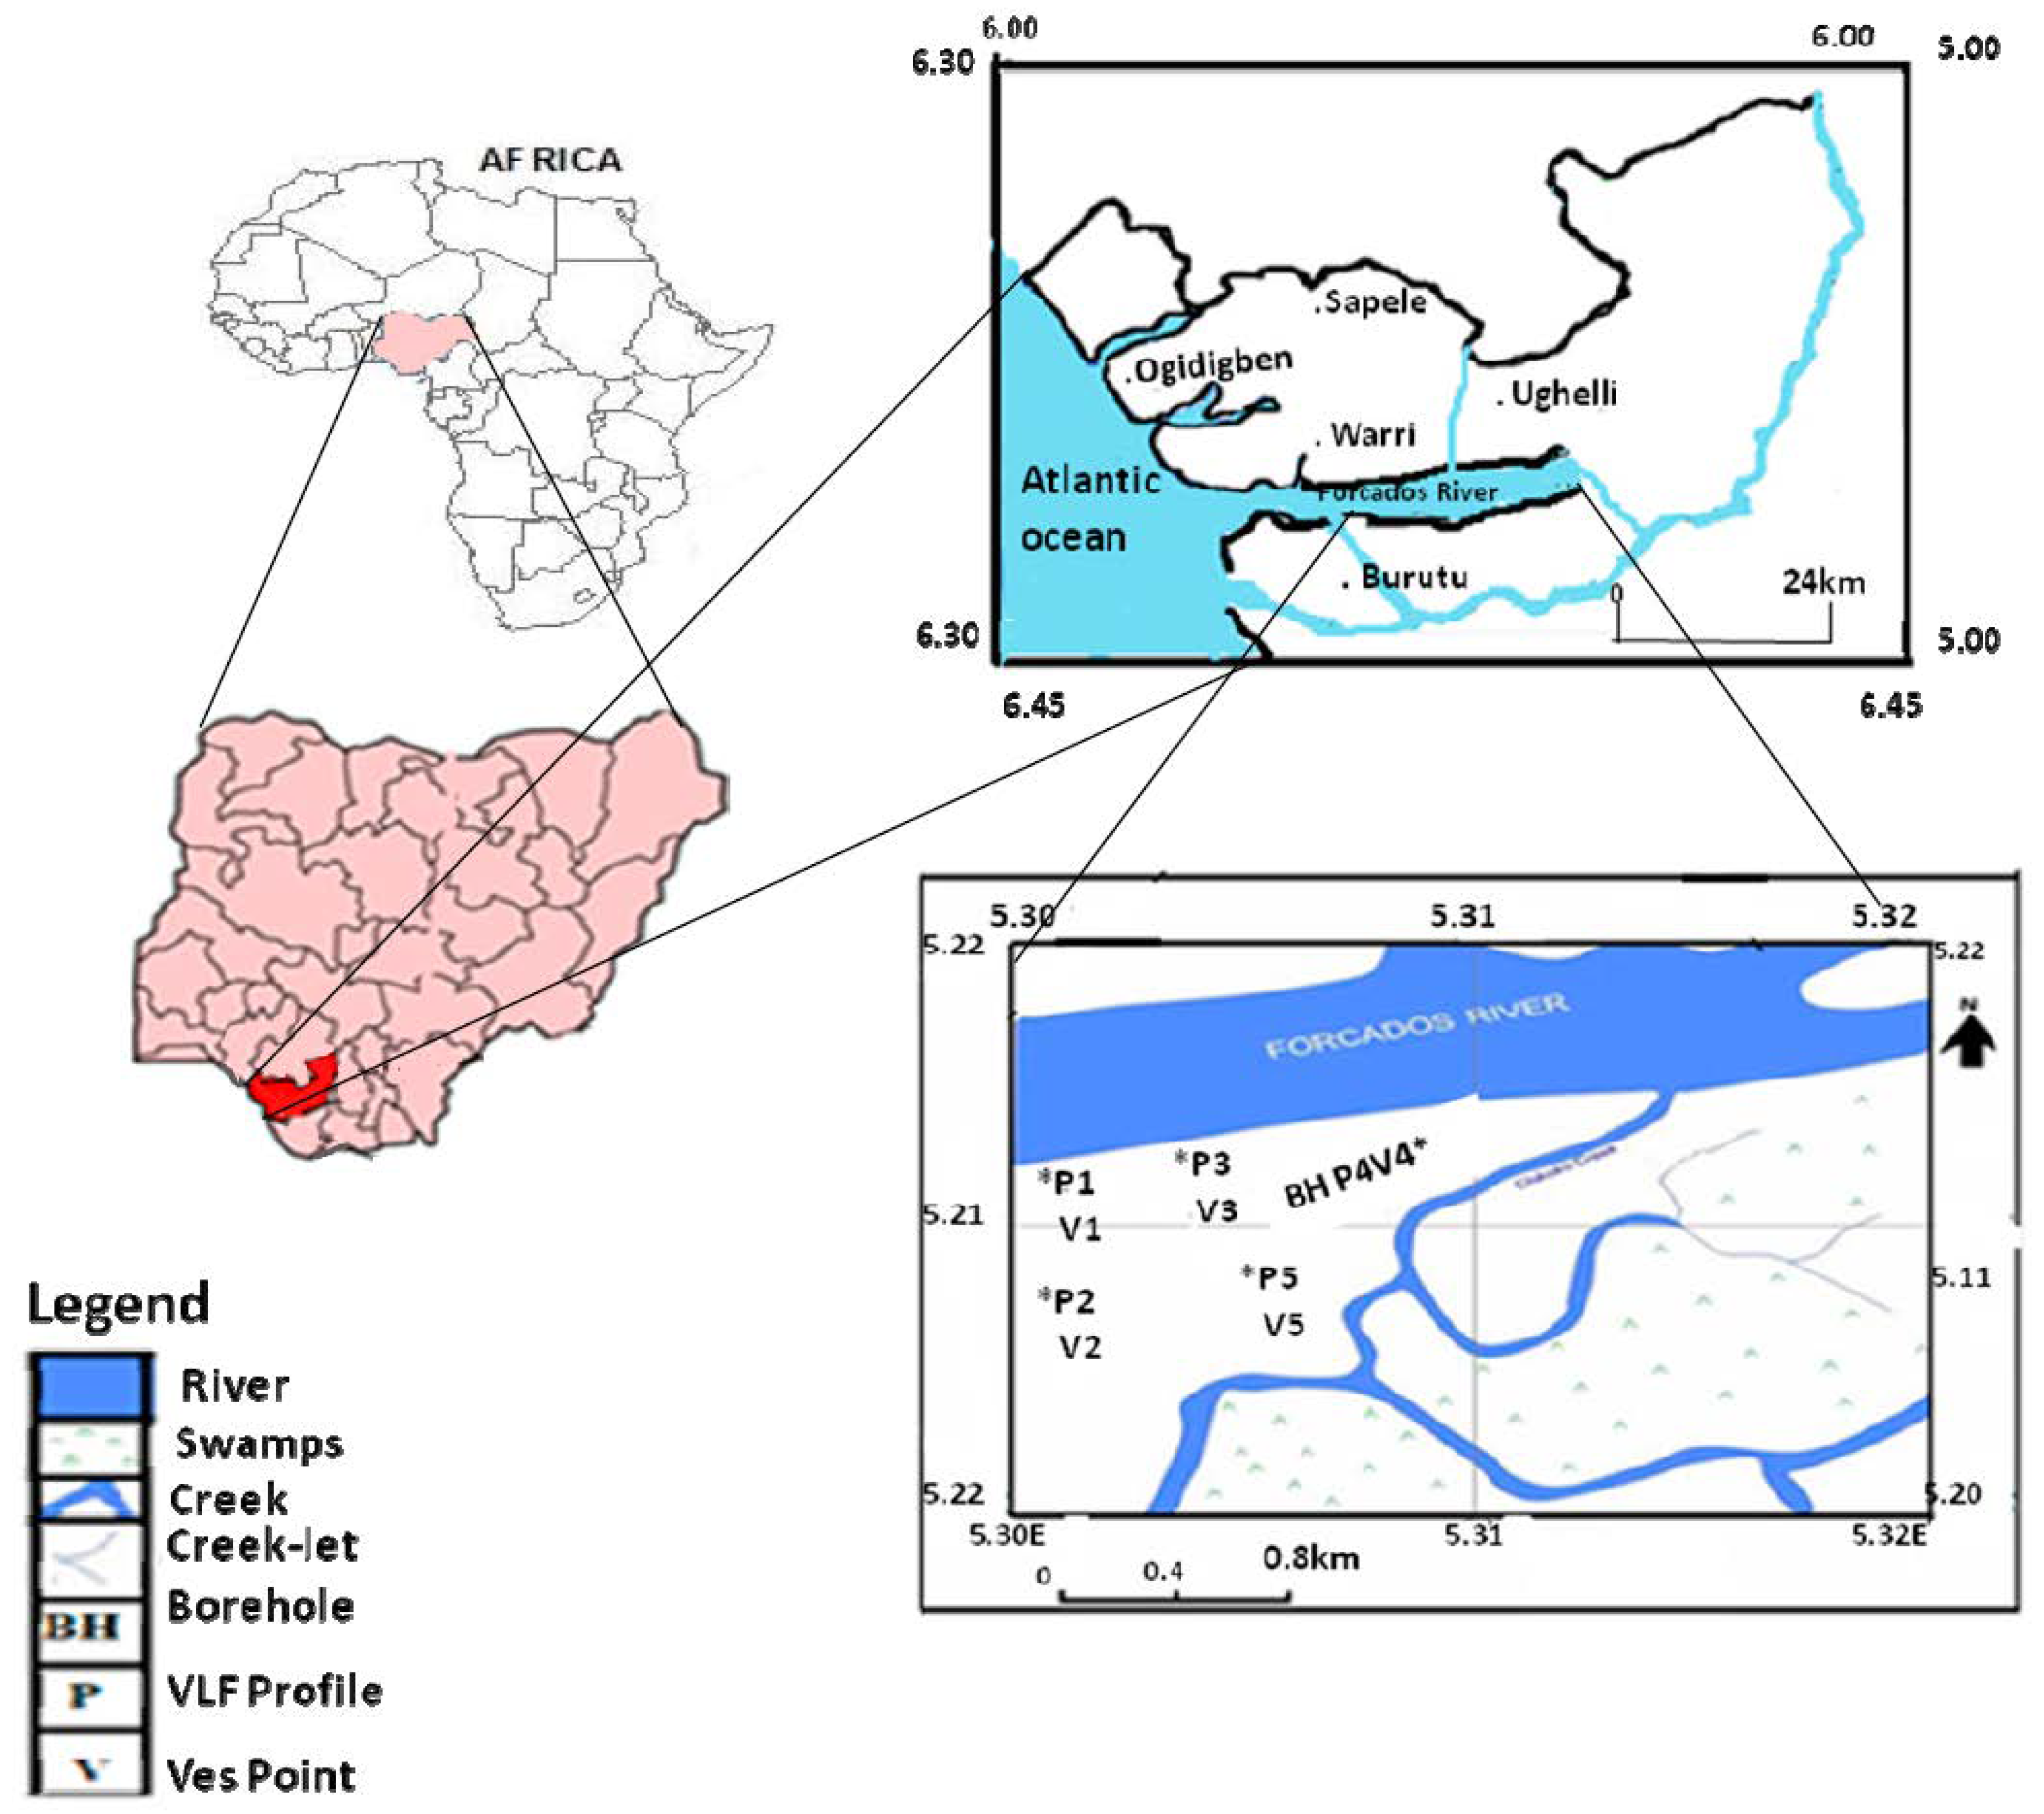
Burutu is a very small island town in the coastal areas of Delta State, Nigeria (Figure 1). The study area is situated at about latitude, which ranges from 05°21′0.5″ to 05°21′59.9″ and longitude 05°30′3.3″ to 05°30′30.7″. It covers an area of approximately less than 12 km2 and situated north of Forcados in the western Niger Delta. The study site is part of the low-lying topographic of the Niger Delta region with an elevation that rarely exceeds 4 m above mean sea level. It is sandwiched between rives of brackish and freshwater, thus making it an island and transitional environment. These rivers and sea tide have a tremendous influence on the vegetation types of the area, characteristically freshwater and brackish-saline mangrove forests. The climate is tropically defined by wet and dry seasons. The wet season spans from April to October with a break in August. The dry season periods are from November to March. The annual rainfall is greater than 3000 mm; thunderstorms are common at the beginning and towards the end of the rainy season. The annual temperature ranges from 25 °C to 34 °C.
2.2. Geologic Setting
The sediments underlying the subsurface of the study area are constituents of the deposits of the Niger Delta basin fills. The geologic history of the evolution of the Niger Delta basin can be traced to the tectonic activities that truncated the development of Benue Trough. The tectonic activity was triggered by the tectonic extension of the African plate from the South American continental plate and the attendant opening of the South Atlantic [14,15]. In order of increasing age, the basin fills of the Niger Delta are categorized into Quaternary deposits (Recent), Benin (Oligocene), Agbada (Eocene) and Akata (Paleocene) Formations (Table 1). The Benin Formation consists of clays, sand, silts, gravel; Agbada sandstone and shale and Akata shale. The availability of oil reservoirs in the Agbada Formation has paved the way for access to a lot of subsurface data, which have resulted in several studies on the basin fills [16,17,18,19,20,21,22,23,24] and others.
Aquifers in the basin occur in the Quaternary deposits and the Benin Formation, respectively. The aquifers of the Quaternary deposit are mostly unconfined with successions of sand that alternate silts and clays. The silt and clay become more predominant with increasing distance to the sea. The sediments of the Benin Formation are fine, medium and coarse-grained sand, clays, silts and gravels. The aquifers in the Benin Formation are very copious with higher transmissivities. The main source of water in the study area for domestic purposes is the shallow aquifer of the Sombrerio plain sand, consisting of sand and intercalation of clays. The groundwater quality from the aquifers is relatively poor due to the quantum of dissolved iron. There are three shades of colour of groundwater associated with shallow aquifers in the area, which range from dark, light yellow and colourless; as a result, many drilled boreholes have been abandoned [25]. The colour is a result of high concentrations of dissolved iron and organic matter. Generally, the groundwater in the area is characterized by pH less than 7 and with moderate electrical conductivity, especially the shallow aquifer. Deep aquifers at depth of 200 m have also been abandoned due to possession of a very high concentration of electrical conductivity and total dissolve solids of the groundwater and coincidental lacks iron and chloride [26]. The water table ranges from 0.2 to 3 m and, during the wettest months, it is at the ground surface. The direction of groundwater flow is towards River Forcados [25], wetlands, streams, swamps and marshes.
Aquifers in the areas are usually recharged by precipitation, discharged through pumping and flow into the river, swamps and marshes. The rivers, streams and creeks are the surface water bodies comprising the area. The presence of groundwater mounds, wetland conditions and swamps, marshes, accumulation of metallic ions and reducing conditions in the area reflect discharge areas of regional flow systems [27]. The watershed is mainly drained by the surface water bodies and they form a sub-basin within the Delta.
3. Materials and Methods
Acquisition of VLF-EM Data
Frequencies that range from 15–30 Hz used by VLF-EM are made available by military radio transmitter stations scattered around the world. These frequencies are used in a submarine system for communication and navigation purposes. The VLF-EM is an electromagnetic radiation generated by the military radio stations. Primary electromagnetic fields generated by transmitters penetrate the subsurface without being in contact with the ground surface. A secondary electromagnetic field is produced whenever the primary electromagnetic field strikes a conductor. The generated secondary electromagnetic field is usually out-of-phase with the primary field [28]. The ABEM WADI instrument is developed for receiving secondary electromagnetic field reflected from conductors. The secondary electromagnetic field consists of both horizontal and vertical components.
The ratio of the horizontal component (Hz) to that of the vertical components (Hx) is expressed by [29] as:
where B is the time lag between the primary and the secondary magnetic fields.
B = Hz/Hx,
The ABEM WADI instrument used in the study measures the tangent of the tilt angle and ellipticity; these two properties are influenced by the conductivity of the subsurface geology. The tilt angle and ellipticity are also known as real (tanø × 100%) component and the imaginary (ex 100%) component, and they are usually expressed as a percentage.
The real component is essential for the qualitative interpretation of VLF-EM data in contrast to the imaginary component, which is inconsequential and characterized by noise. However, the inflexion points where the filtered real and imaginary components cross each other on a plot of the recorded amplitude indicate the presence of a conductor in the subsurface.
To determine the areal distribution of clay layers and its thickness around the study area, five profiles were covered. Profile 1 has lateral coverage of 600 m with a spacing of 20 m; profile 2 (720 m and 20 m), profile 3 (420 m and 20 m), profile 4 (410 m and 30 m) and profile 5 (750 m and 20 m). The separation distance used for the acquisition of data was a factor of available space. The transmission station, throughout the period the survey lasted, was used without changing it. The reason for this precaution was to avoid measurement error sometimes associated with changing transmission station. Filtering of VLF data is very pertinent due to noise embedded in raw data at the time of acquisition. Both real and imaginary components were filtered with Fraser numerical filter [30]. The Fraser filter enhances noisy data by converting minimum peaks into maximum amplitude. The filtered real and imaginary components were plotted on the vertical axis against the lateral coverage on the horizontal axis using Microsoft Excel (Figure 2, Figure 3, Figure 4, Figure 5 and Figure 6). Current density pseudo-section (Figure 2, Figure 3, Figure 4, Figure 5 and Figure 6) was produced from the real component data using a linear filter [20] of the KHFILT inversion software [31]. The Karous–Hjelt filter produces a 2D conductive model of the subsurface by converting the secondary magnetic field into current density depth [9,32]. In order to compensate for the reduction of VLF-EM with depth in a conducting medium, the skin depth of the inversion software was used [9].
To confirm the efficacy of using VLF-EM in the delineation of protective capacity of the aquifer from the conductivity of the subsurface geologic material, borehole data and five electrical resistivity soundings (VES) data were acquired at positions indicated on each profile showed on Figure 2, Figure 3, Figure 4, Figure 5 and Figure 6. The array used was Schlumberger and current electrode spacing (AB/2) ranged from 1–250 m. The ABEM SAS 4000 resistivity meter was used for the acquisition of resistivity data. Acquired data were processed by subjecting them to Curves matching [32] and modelled the same with WinResist software (version 1.0 Microsoft, Redmond, WA, USA) [33] and are presented in Figure 7A–E.
4. Results
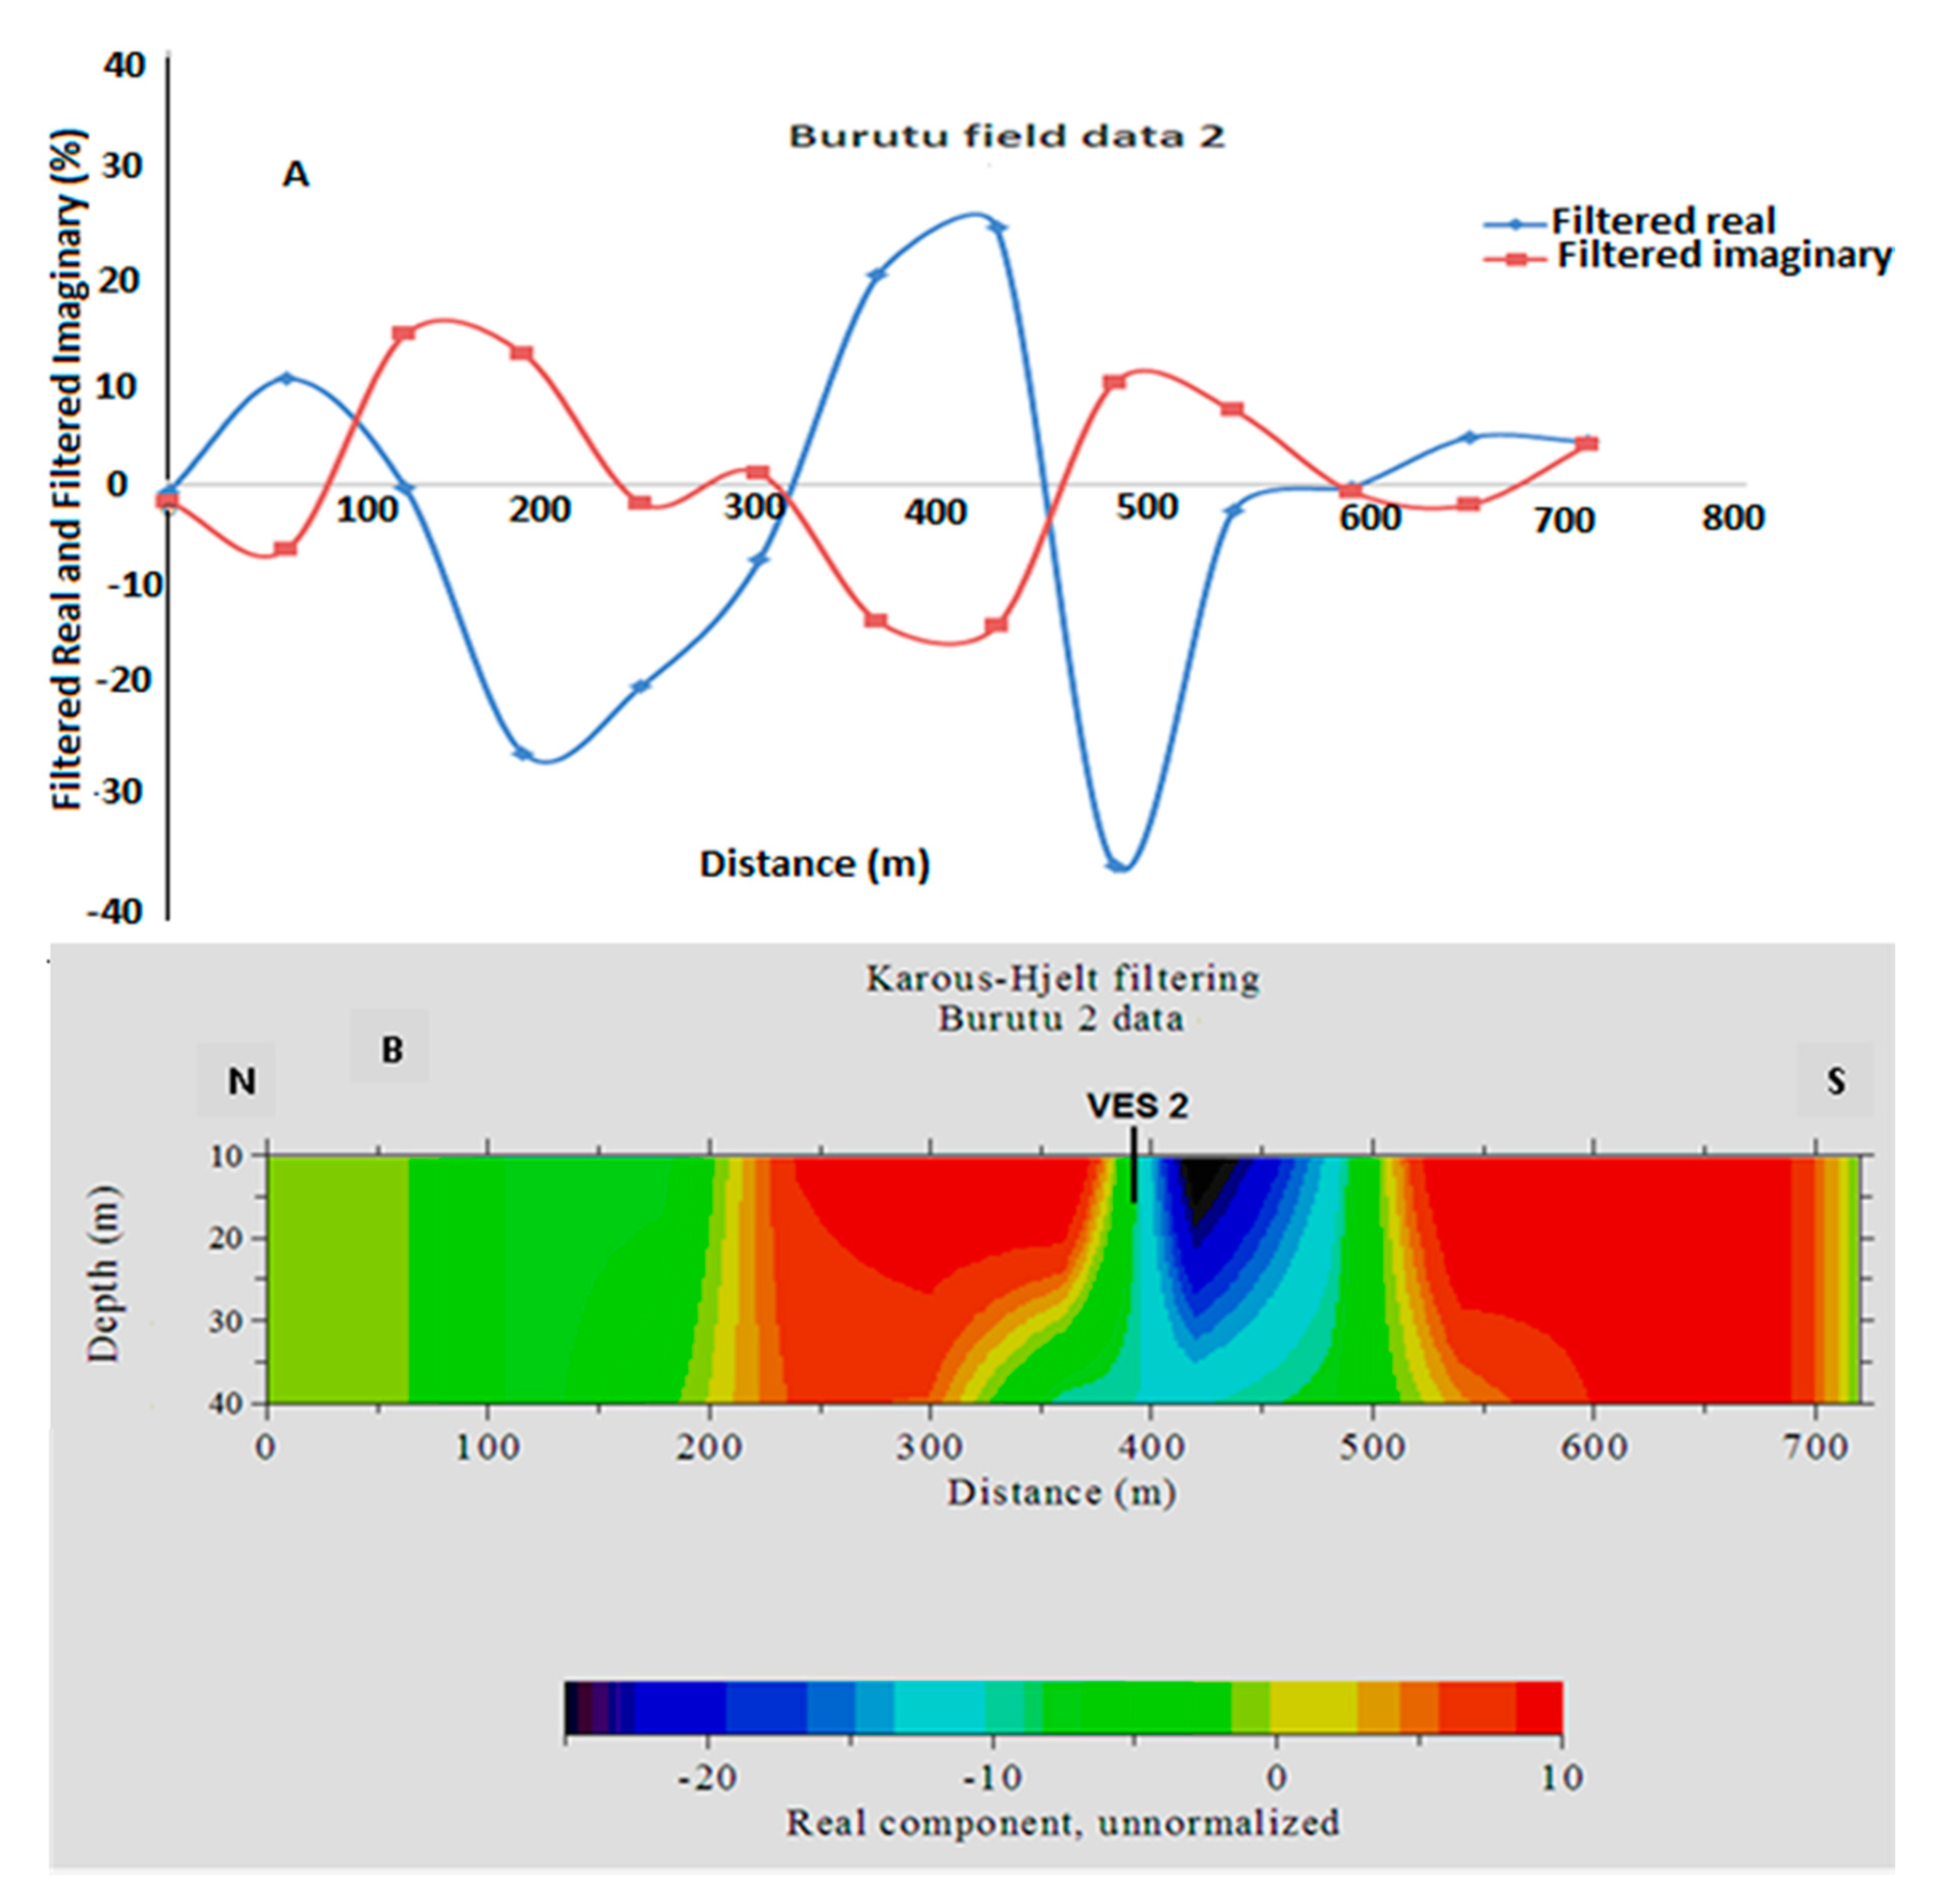
The interpretations of VLF data were quantitatively carried out with critical analysis of the current density pseudo-sections produced from Karous–Hjelt [30] and plots of filtered real and imaginary components. Figure 2, Figure 3, Figure 4, Figure 5 and Figure 6 depict the result of plotting both filtered imaginary and real components along the profile and corresponding current density pseudo-section. An assessment of Figure 2 revealed notably a positive peaked filtered real along the horizontal distance of 100 m–150 m and 550 m–600 m and positive values of 20% and 40%, respectively. Less notable at the distances of 200 m to 450 m, the filtered real has values that are less than 10%, which spread along the remaining part of the profile. At 100 m–150 m and 550 m–600 m, the inflexion of filtered real and imaginary components are noticeable. Juxtaposing the Fraser and the Karous–Hjelt (Figure 2) diagrams, the positive peaks of the filtered real are significantly and adequately depicted in the current density pseudo-section. This probably underscores the effectiveness of the filtered Fraser, and it explains why some studies relied essentially on the filtered real for interpretation of anomalous material in the subsurface. The positive peaked values of the filtered real and the corresponding dark-coloured (red) areas in the current density pseudo-section are probably inferred geologically as anomalous zones, while the light-coloured areas (light green and yellow) in the current density pseudo-section are not. The corresponding values in the Fraser filtered real are zero and negative, respectively.
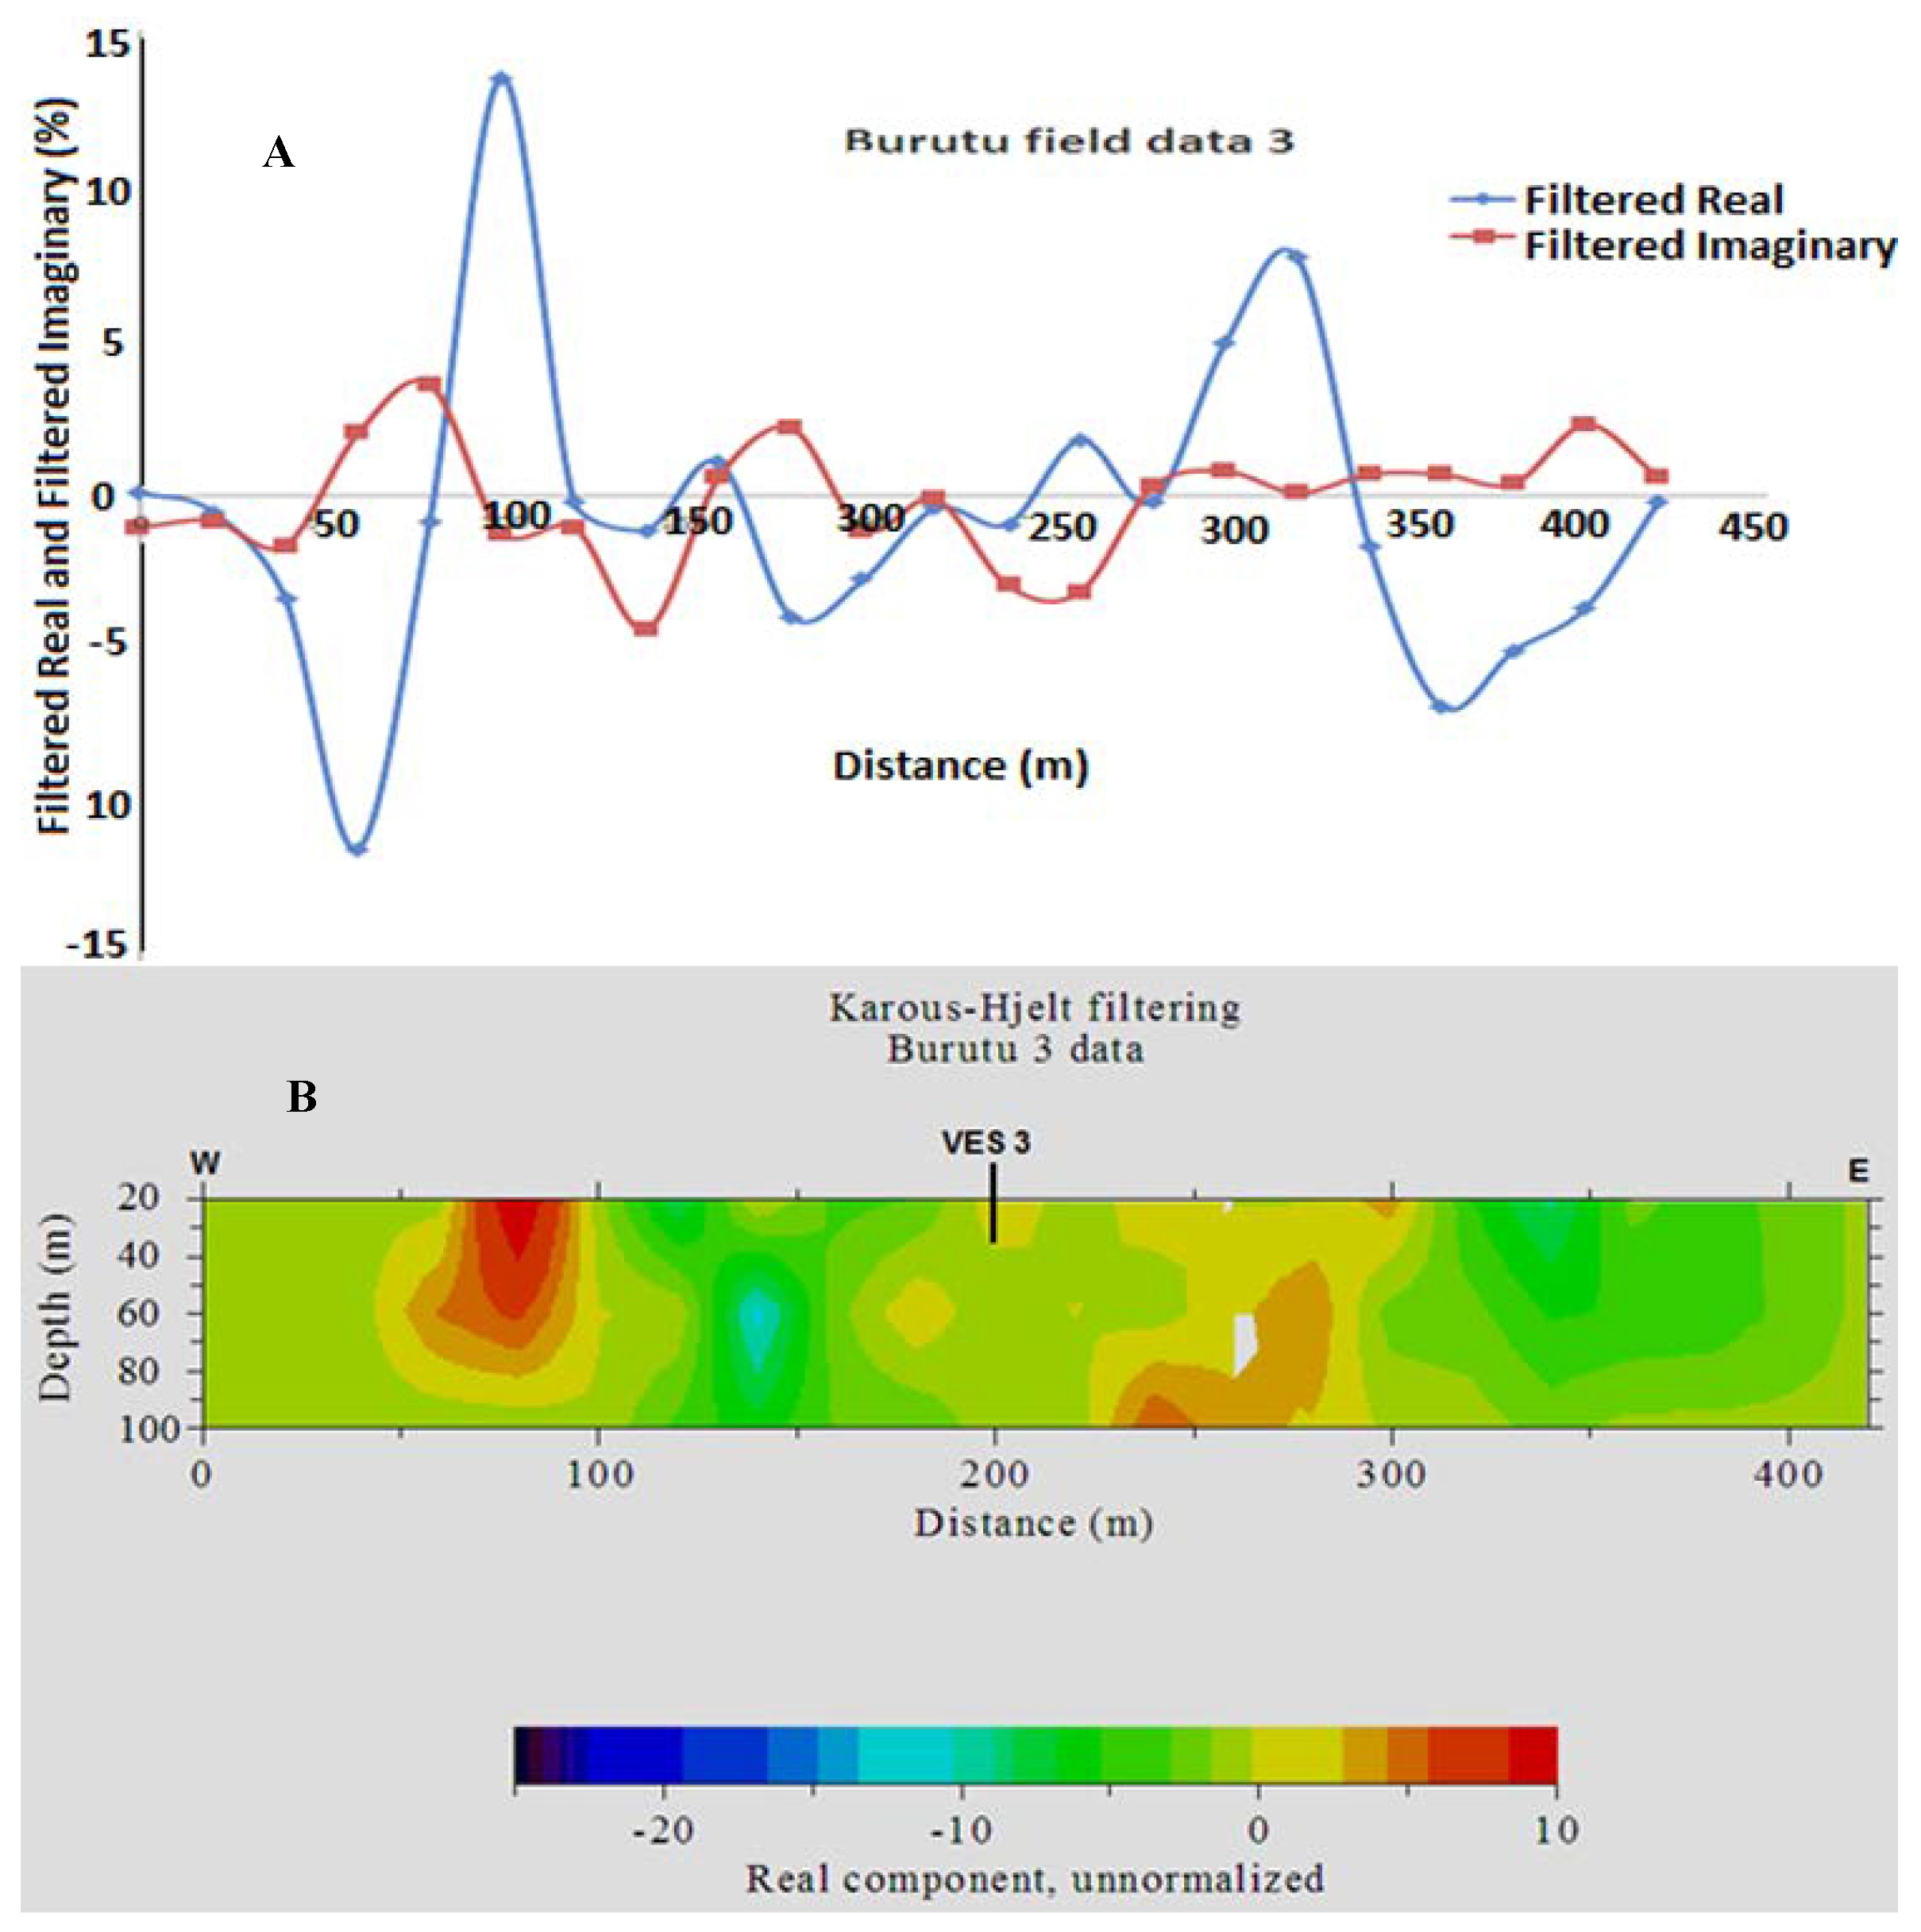
These none-anomalous zones and anomalous zones in profile 1 (Figure 2) suggest the existence of non-conductors and conductors, respectively. The depiction of the anomalous zones with depths buttressed the advantages of the Karous–Hjelt filtering over the Fraser filtering. Similarly, these anomalous zones are conspicuously present in all profiles. Profile 2 (Figure 3) has two anomalous zones—one situated on the western side of the profile, which is more peaked positively than the eastern part. Profile 4 has more anomalous zones with most situated in the middle of the profile (Figure 4).
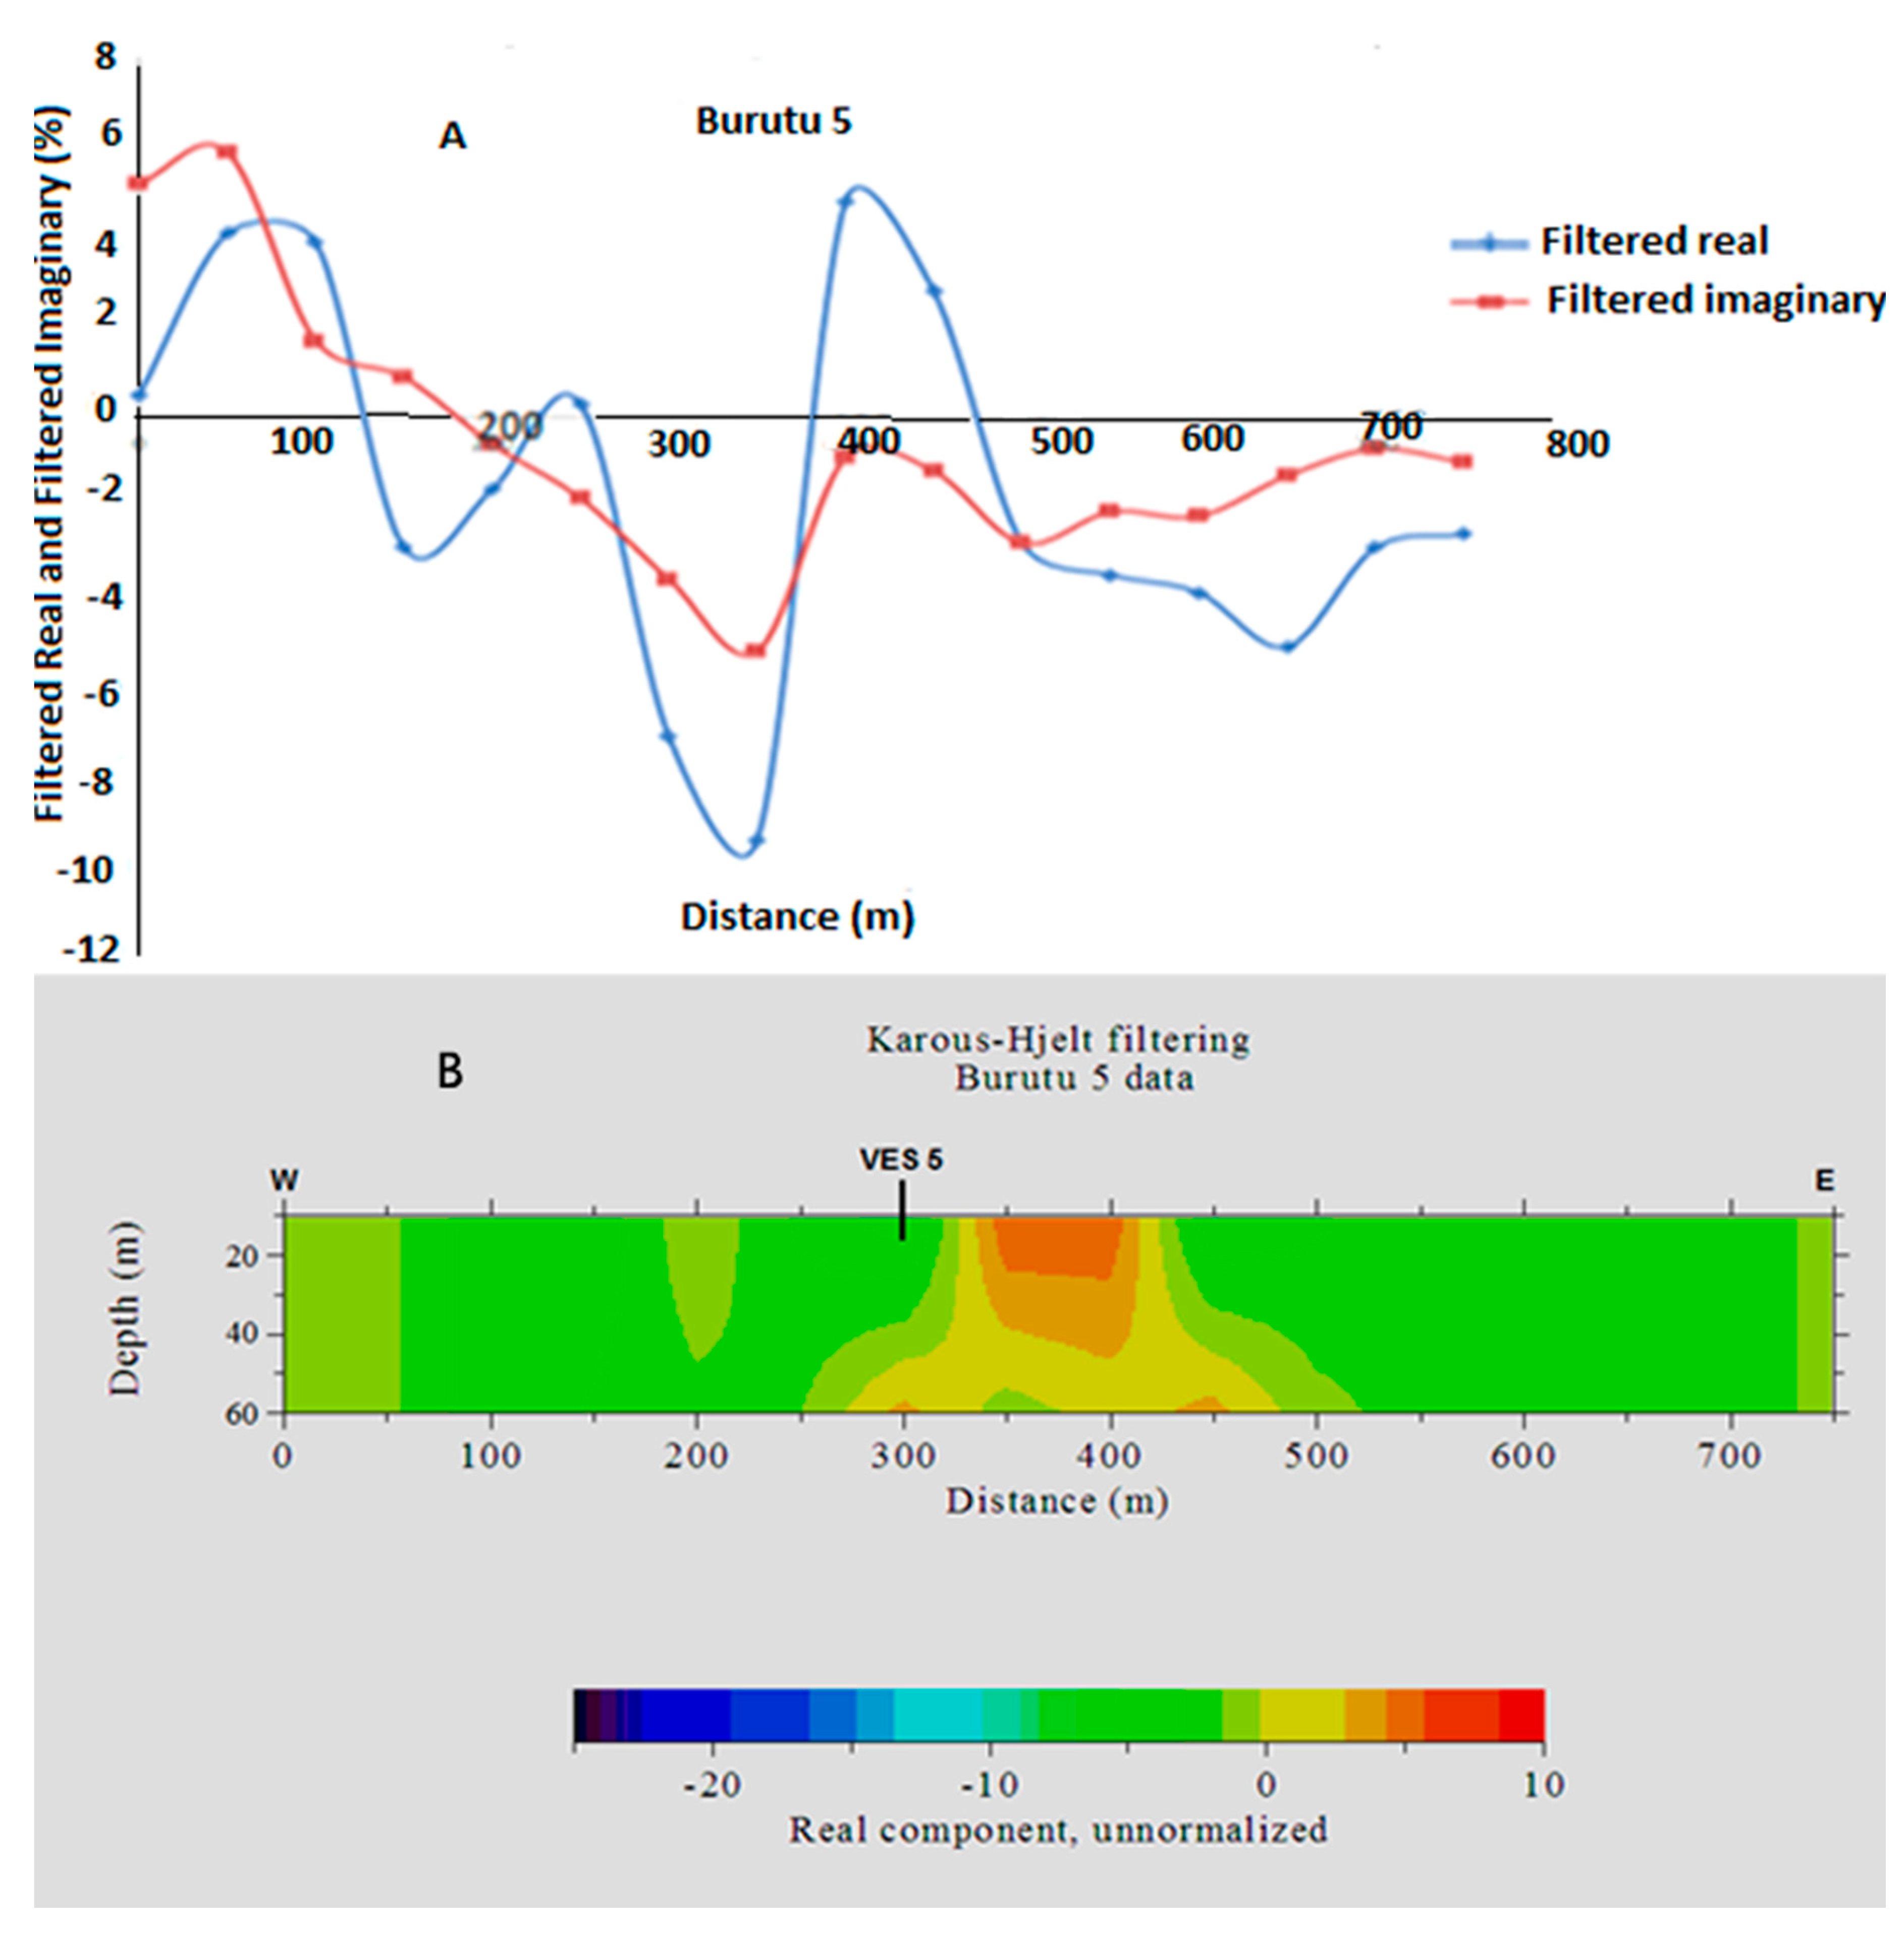
The positive values of 10%, 11% and 22% are observed for the filtered real in profile 4. It is distinctive and different from other profiles in having an inclined anomalous zones at160 m to 220 m along the profile. Profile 5 (Figure 5) has an anomalous zone within the 350 m to 400 m distance along the profile, with a positive filtered real value of 6%.
Borehole and VES
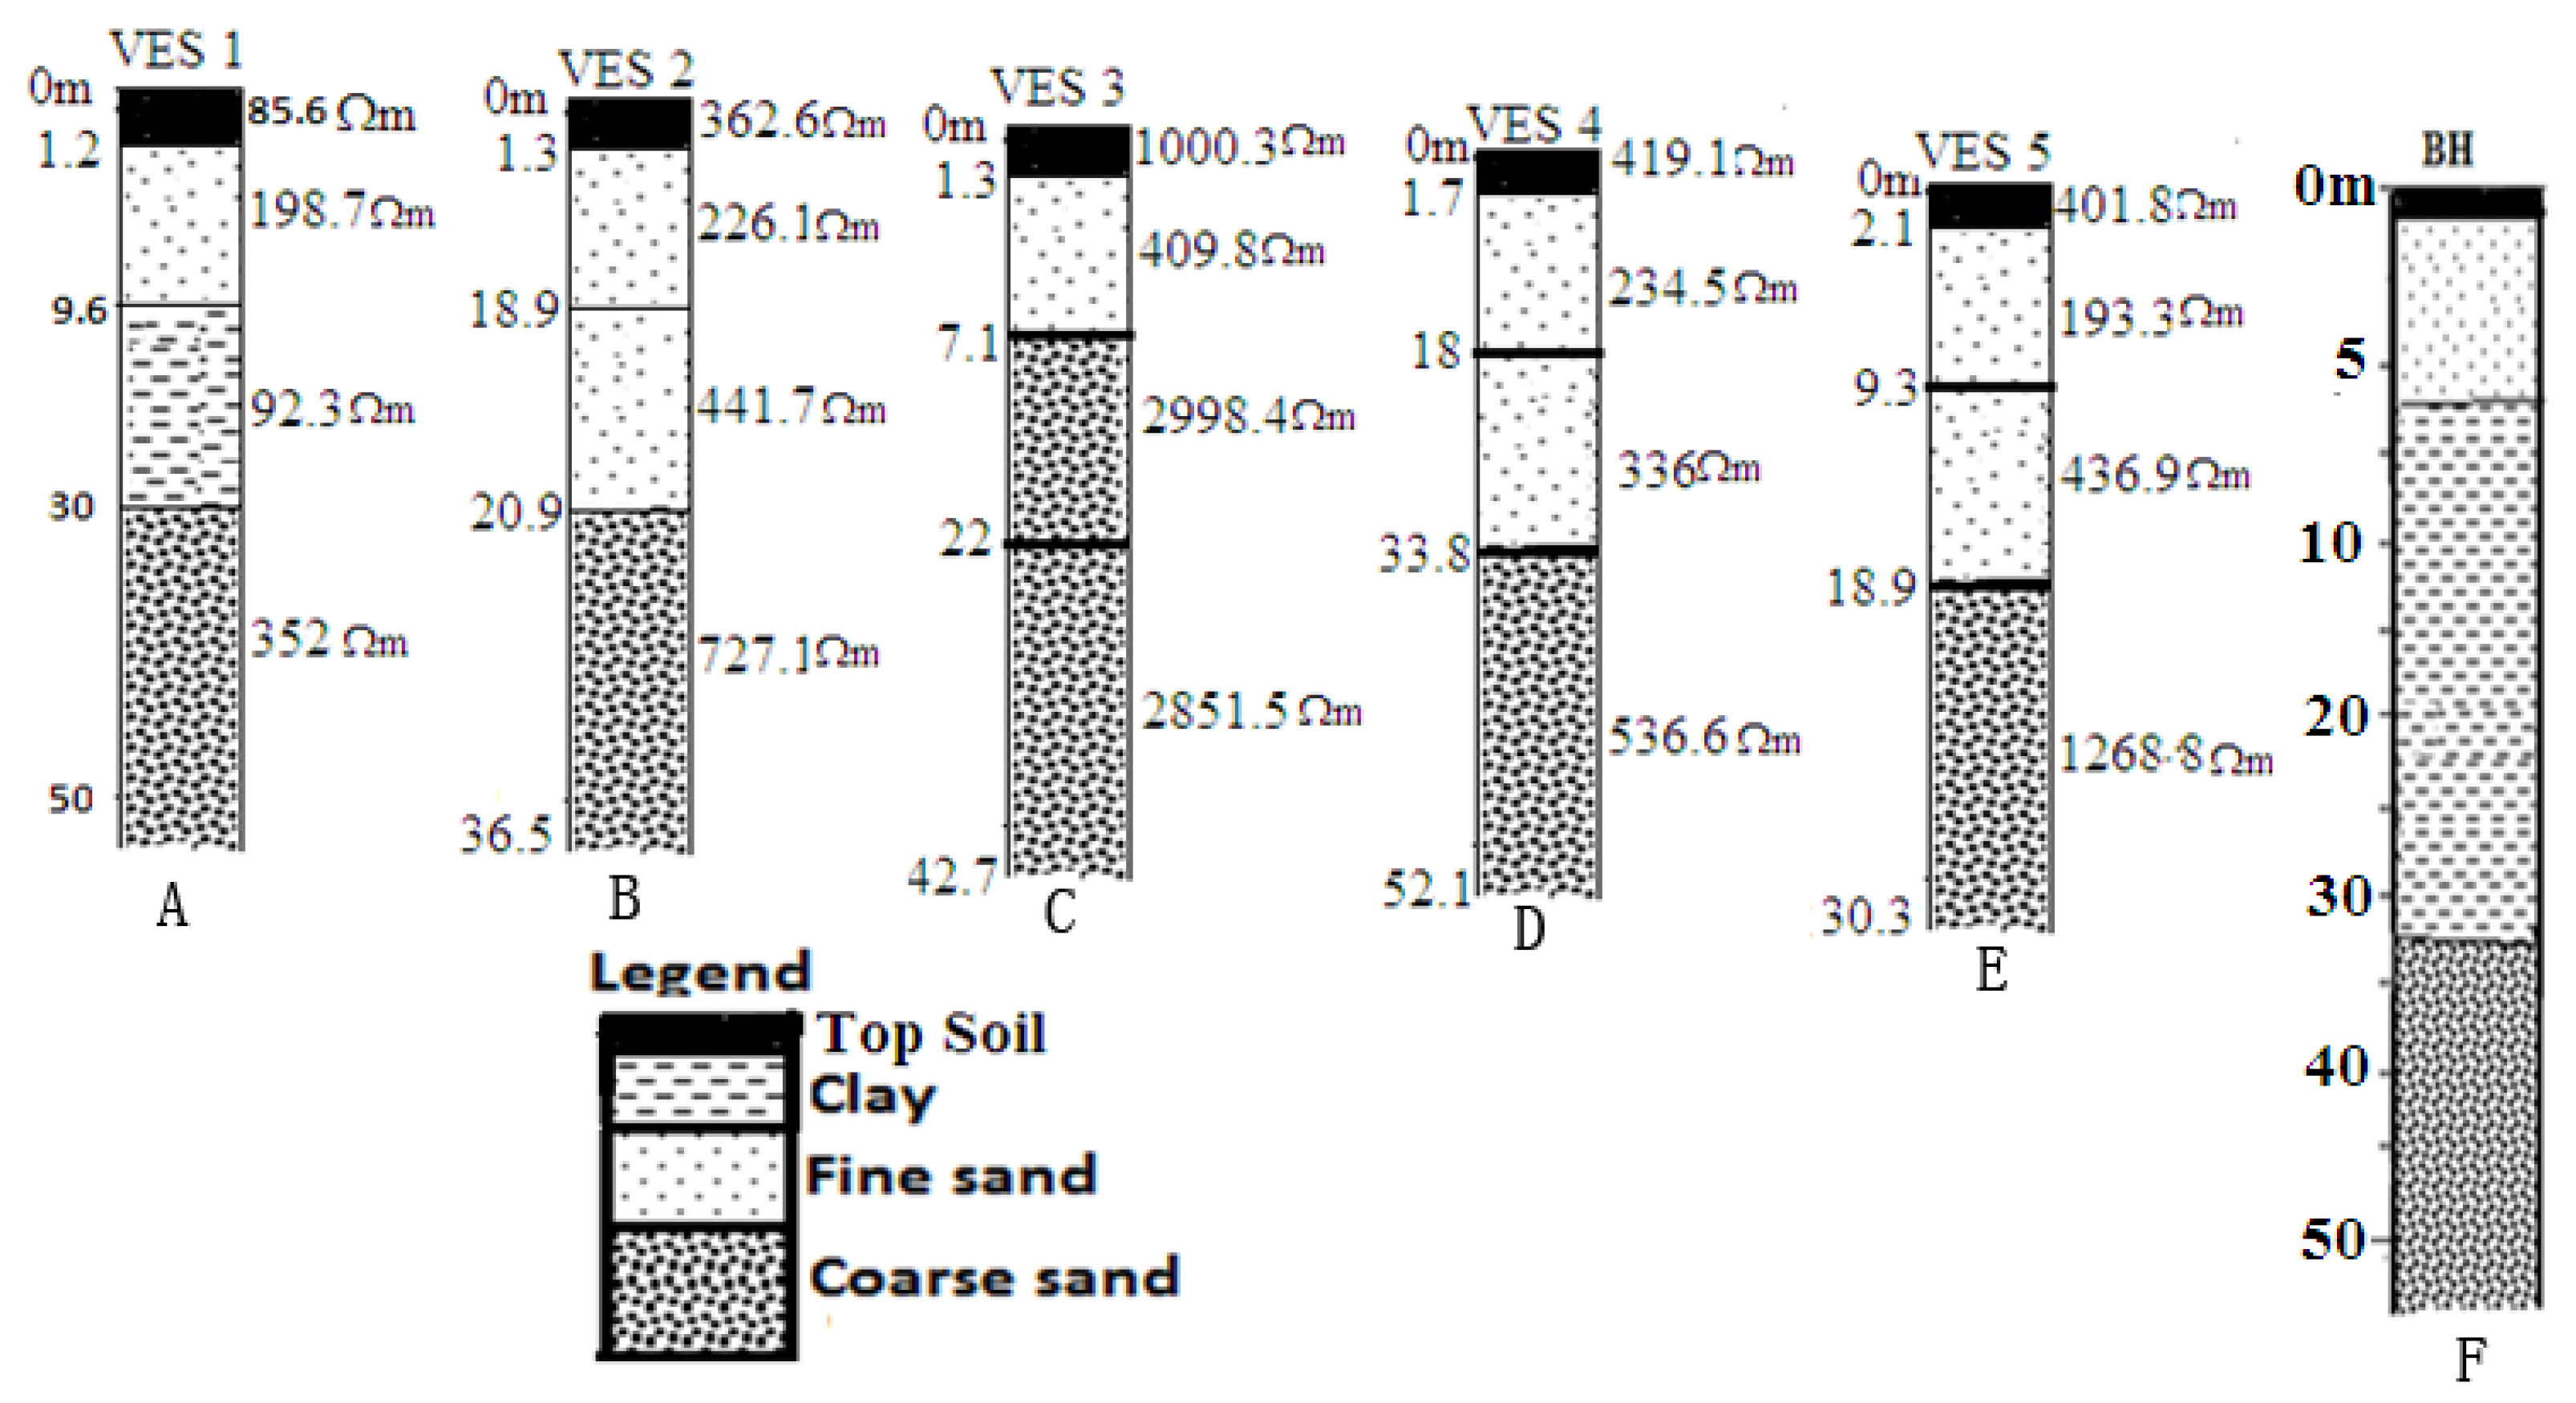
Borehole information remains significant in the provision of true subsurface geology. As a result, a lithology log from a borehole was used for the confirmation of the subsurface geology inferred from VLF-EM. The borehole lithology (Figure 8F matches with the subsurface geology interpreted from VLF-EM at the 45 m position along profile 4 (Figure 5). The position of the clay vertically in the borehole log ranged from 7 m to over 35 m and the same corresponds to 10 m to 30 m depth in the VLF-EM profile of Figure 5. The geology of the subsurface was inferred from VLF-EM substantially and agreed very well with geologic sections interpreted from all five VES (Figure 8A–F) obtained from the interpretations showed in Figure 7A–E. VES 1 has a resistivity that ranged from 92.3 Ωm to 352 Ωm. The layer interpreted as clay has a resistivity of 92.3 Ωm, which corresponds to the conductive subsurface geologic material at 300 m in profile 1. Other VES positions showed evidence of sand as reflected by their resistivity values that ranged from 193.3 Ωm to 1268.8 Ωm. Interestingly, these resistivity values perfectly correspond with non-positive values of the real components and the current density pseudo-section.
5. Discussion
The inadequacy commonly associated with the geophysical exploration of subsurface geology depends on the resolution and multiple possible interpretations; consequently, additional information is often required for comparing acquired data with observed ones. VLF-EM has been known to have good lateral and poor depth resolutions of subsurface geologic materials [6]. Therefore, it is pertinent to enhance VLF-EM data with other forms of geophysical surveys or borehole information for substantiation of geology inferred from such interpretations. Against this background, we used borehole data and five vertical electrical soundings (VES) concomitantly to validate inferred subsurface geology. The specific positions of acquired VES data are depicted in Figure 2, Figure 3, Figure 4, Figure 5 and Figure 6, while borehole data is shown in Figure 8. The geologic sections inferred from the interpretation as well as the lithofacies log from the borehole are shown in Figure 8F. The strong agreement among geologic section from VES data, borehole log data and those inferred from VLF-EM equivalent underpinned the significance of VLF-EM as a tool for the investigation of aquifer protective capacity for groundwater quality. This efficiency revealed from the use of VLF-EM for subsurface geologic exploration is congruent with those of [5,6,8,32,33,34].
Geological materials that are inferred from the interpretation above are conductors or non-conductors. Conductors transmit significant passage of large current density through them. The reverse is common with those without conductive properties. In a sedimentary basin, the fills are usually weakly conductive if not saturated with brackish and saline waters. The conduciveness of sedimentary rocks is basically controlled by the degree of grains packing and salinity of saturation. The more consolidated a rock, the more conductive it is, and the more unconsolidated the rock, the less conductive it is. It may be more difficult for a current to flow through grains when they are loose than when they are compacted and touching one another. Apparently, aquifers in the Quaternary and Benin Formation of the Niger Delta consist of grains that are generally unconsolidated, and, by implication, are less conductive as against the clay materials, which, to a reasonable extent, are naturally conductive if wet. This distinguishing feature favours the use of VLF-EM for this study. The anomalous zones (dark coloured) delineated suggest clays and the non-anomalous zones, sand. The presence of clays is consistent with recent studies involving geochemical and resistivity [23,24]. This strongly implies that conductivity zones observed in the current density pseudo-section and Fraser are not related to aquifers experiencing salinization through saltwater intrusion, at least the shallow aquifers in the area.
The clays are conductors and the sand non-conductors as shown by the current density pseudo-sections being dark and light coloured areas, respectively. The grading of colours from dark to light indicates decreasing grain sizes, which signifies a reduction in the clay and increasing sand in the subsurface. From Figure 2, Figure 3, Figure 4, Figure 5 and Figure 6, clays are not continuous along the profiles but occurred as lenses with no significant lateral and vertical distribution across all profiles. Figure 4 is relatively different in possessing clay that is inclined, which extends to the bottom of profile 4. Since clay has the ability to absorb contaminants from being transported in groundwater, the spatial distribution of clay revealed from the five profiles significantly supports the fact that the aquifers in the areas are poorly protected and vulnerable to migrating contaminants from the surface.
6. Conclusions
The anomalous zones inferred from the quantitative interpretation of current density pseudo-sections and the plotted filtered real and imaginary components are the response of primary magnetic fields to conductors caused by clay materials in the subsurface. The clay materials produced the high positive peak values associated with the filtered real components, while the non-anomalous zones are less positive and negative for filtered real components, which were caused by sand. The non-anomalous zones and the corresponding high resistivity values are areas associated with the freshwater discharge, and they also specify the presence of shallow aquifers that are not being intruded by saltwater intrusion.
The absence of an extensive top covering clay material laterally in all profiles strongly suggests that aquifers are poorly protected and significantly vulnerable to contamination from the ground surface. However, the pockets of clay lenses available may retard migrating contaminants locally within the aquifers, since they are occurring in the aquifers as intercalations.
The degree of compliance of VLF-EM data with borehole log and VES data strongly accentuates the efficacy of VLF-EM when coupled with other geophysical methods and observed borehole data in the determination of the protective capacity of aquifers as well as the provision of subsurface information from sedimentary basin investigation.
Author Contributions
Oghenero Ohwoghere-Asuma conceived and designed the research; Kizito Ejiro Aweto, Felix Iwebunor. Chinyem, and Oghenero Ohwoghere-Asuma acquired the geophysical data; Oghenero Ohwoghere-Asuma and Kizito Ejiro Aweto processed and interpreted VLF data; Felix Iwebunor Chinyem and Hyacinth Ogunka Nwankwoala processed and interpreted the VES data; Oghenero Ohwoghere-Asuma did the write-up.
Acknowledgments
The manuscript has benefitted immensely from the reviewers comments with appreciation.
Conflicts of Interest
The authors declare no conflict of interest.
References
- Lobo-Ferreira, J.P. The European Union Experience on Groundwater Vulnerability Assessment and Mapping. In COASTIN A Coastal Policy Research Newsletter 1; TERI: Panaji, India, 1999; pp. 8–10. [Google Scholar]
- Van Stempvoort, D.; Ewert, L.; Wassenaar, L. AVI: A Method for Groundwater Protection Mapping in the Prairie Provinces of Canada; Prairie Provinces Water Board: Regina, SK, Canada, 1992. [Google Scholar]
- Van Stempvoort, D.; Ewert, L.; Wassenaar, L. Vulnerability index: A GIS-Compatible method for groundwater vulnerability mapping. Can. Water Resour. J. 1993, 18, 25–37. [Google Scholar] [CrossRef]
- Atakpo, E.A. Aquifer Vulnerability Investigation Using Geoelectric Method in Parts of Sapele Local Government Area of Delta State, Nigeria. Niger. J. Basic Appl. Sci. 2013, 21, 11–19. [Google Scholar] [CrossRef]
- Okiongbo, K.S.; Akpofure, E. Determination of Aquifer Properties and Groundwater Vulnerability Mapping Using Geoelectric Method in Yenagoa City and Its Environs in Bayelsa State, South South Nigeria. J. Water Resour. Prot. 2012, 4, 354–362. [Google Scholar] [CrossRef]
- Alvin, K.B.; Kelly, L.P.; Melissa, A.S. Mapping groundwater contamination using dc resistivity and VLF geophysical methods—A case study. Geophysics 1996, 62, 80–86. [Google Scholar]
- Oskooi, B. A Broad View on the Interpretation of Electromagnetic Data (VLF. RMT, MT, CSTMT). Comprehensive Summaries of Uppsala Dissertations from the Faculty of Science and Technology 959 2004. Available online: https://www.diva-portal.org/smash/get/diva2:164334/FULLTEXT01.pdf (accessed on 27 March 2018).
- Ariyo, S.O.; Adeyemi, G.O.; Oyebamiji, A.O. Electromagnetic Vlf Survey for Groundwater Development in a Contact Terrain; A Case Study of Ishara-remo, Southwestern Nigeria. J. Appl. Sci. Res. 2009, 5, 1239–1246. [Google Scholar]
- Raji, W.O.; Adeoye, T.O. Geophysical mapping of contaminant leachate around a reclaimed open dumpsite. J. King Saud Univ.-Sci. 2017, 29, 348–359. [Google Scholar] [CrossRef]
- UNESCO. lntegrated Land-Use Planning and Groundwater Protection in Rural Areas, a Comparative Study of Planning and Management Methodologies; IHP-lll Project 10.6; UNESCO: Paris, France, 1991. [Google Scholar]
- Ohwoghere-Asuma, O.; Adaikpoh, E.O. Assessment of Shallow Aquifers Contamination by Failure of on-Site Sewage Disposal System in Ughelli, Western Niger Delta, Nigeria. J. Environ. Earth Sci. 2013, 3, 208–216. [Google Scholar]
- William, G.R. Septic Tank Impacts on Ground Water Quality and Nearshore Sediment Nutrient Flux. Groundwater 2004, 43, 1079–1089. [Google Scholar]
- World Health Organization. Guidelines for Drinking Water Quality. In WHO Report, Volume 1 (First Addendum to the Third Edition); World Health Organization: Geneva, Switzerland, 2006. [Google Scholar]
- Allen, J.R.L. Late Quaternary Niger delta and Adjacent areas. Am. Assoc. Pet. Geol. Bull. 1965, 49, 547–600. [Google Scholar]
- Oomkens, E. Lithofacies relation in Late Quaternary Niger Delta Complex. Sedimentology 1974, 21, 115–122. [Google Scholar] [CrossRef]
- Evamy, B.D.; Haremboure, J.; Karmerling, P.; Knaap, W.A.; Molloy, F.A.; Rowlands, P.H. Hydrocarbon habitant of the Tertiary Niger Delta. Am. Assoc. Pet. Geol. Bull. 1978, 62, 1–39. [Google Scholar]
- Weber, K.J.; Daukuro, E.S. Petroleum Geology of the Niger Delta. In Proceedings of the 9th Petroleum Geology Congress, Tokyo, Japan, 11–16 May 1975; pp. 209–229. [Google Scholar]
- Ejedawe, J.E. Patterns of Incidence of oil Reserves in Niger Delta Basin. Am. Assoc. Pet. Geol. Bull. 1981, 65, 1574–1585. [Google Scholar]
- Reyment, R.A. Aspects of the Geology of Nigeria; Ibadan University Press: Ibadan, Nigeria, 1965; 145p. [Google Scholar]
- Short, K.C.; Stauble, A.J. Outline of the geology of the Niger Delta. AAPG Bull. 1967, 51, 761–779. [Google Scholar]
- Doust, H.; Omatsola, E. Niger Delta. In Divergent/Passive Margin Basins, AAPG Memoir 48; Edwards, J.D., Santogrossi, P.A., Eds.; American Association of Petroleum Geologists: Tulsa, OK, USA, 1990; pp. 239–248. [Google Scholar]
- Stacher, P. Present Understanding of the Niger Delta Hydrocarbon Habitat. In Geology of Deltas; Oti, M.N., Postma, G., Eds.; Balkema: Rotterdam, The Netherlands, 1995; pp. 257–267. [Google Scholar]
- Reijers, T.J.A. Stratigraphy and Sedimentology of the Niger Delta. Geologos 2011, 17, 133–162. [Google Scholar] [CrossRef]
- Ohwoghere-Asuma, O.; Essi, O.E. Investigation of Seawater Intrusion into Coastal Groundwater Aquifers of Escravos, Western Niger Delta, Nigeria. J. Appl. Sci. Environ. Manag. 2017, 21, 362–369. [Google Scholar] [CrossRef]
- Ohwoghere-Asuma, O.; Chinyem, I.F.; Essi, O.E. Saltwater Intrusion Appraisal of Shallow Aquifer in Burutu Area of the Western Niger Delta with 2D Electrical Resistivity Tomography. J. Appl. Sci. Environ. Manag. 2017, 21, 372–377. [Google Scholar] [CrossRef]
- Oteri, A.U. Electric Logs for Groundwater Exploration in the Niger Delta. In Challenges in African Hydrology and Water Resources (Proceedings of the Harare Symposium, July 1984); Available online: http://hydrologie.org/redbooks/a144/iahs_144_0087.pdf (accessed on 29 November 2017).
- Tóth, J. Groundwater Discharge: A common generator of diverse geologic and morphologic phenomena. Bull. Int. Sci. Hydrol. 1971, 16, 7–24. [Google Scholar] [CrossRef]
- Ohwoghere-Asuma, O.; Aweto, K.E.; Akpoborie, I.A. Investigations of Groundwater Quality and Evolution in an Estuary Environment: A case study of Burutu Island, Western Niger Delta, Nigeria. Environ. Hydrol. 2012, 22, 1–14. [Google Scholar]
- McNeil, J.D.; Labson, V.F. Geological mapping using VLF radio Field. In Electromagnetic Methods in Applied Geophysics, 2(B); Nabighian, M., Ed.; Society of Exploration Grophysicists: Tulsa, OK, USA, 1990; pp. 521–640. [Google Scholar]
- Fraser, D.C. Contouring of VLF-EM data. Geophysics 1969, 34, 958–967. [Google Scholar] [CrossRef]
- Karous, M.; Hjelt, S.E. Linear Filtering of VLF Dip-angle Measurements. Geophys. Prospect. 1983, 31, 782–792. [Google Scholar] [CrossRef]
- Beamish, D. Quantitative VLF data interpretation. J. Appl. Geophys. 2000, 45, 33–47. [Google Scholar] [CrossRef]
- Orellana, E.; Mooney, H.M. Master Tables and Curves for Vertical Electrical Sounding over Layered Structures; Intersciencia: Madrid, Spain, 1996; 34p. [Google Scholar]
- Vander Velpen, B.P.A. WinResist Version 1.0; M.Sc. Research Project; ITC: Deft, The Netherlands, 2004. [Google Scholar]
Figure 1.
Map of the study location showing VLF, VES and borehole locations (incised are maps of Nigeria and Delta State).
Figure 1.
Map of the study location showing VLF, VES and borehole locations (incised are maps of Nigeria and Delta State).

Figure 2.
Plot of filtered Real and Imaginary components (A) and current density pseudo-section (B) for VLF Profile 1.
Figure 2.
Plot of filtered Real and Imaginary components (A) and current density pseudo-section (B) for VLF Profile 1.
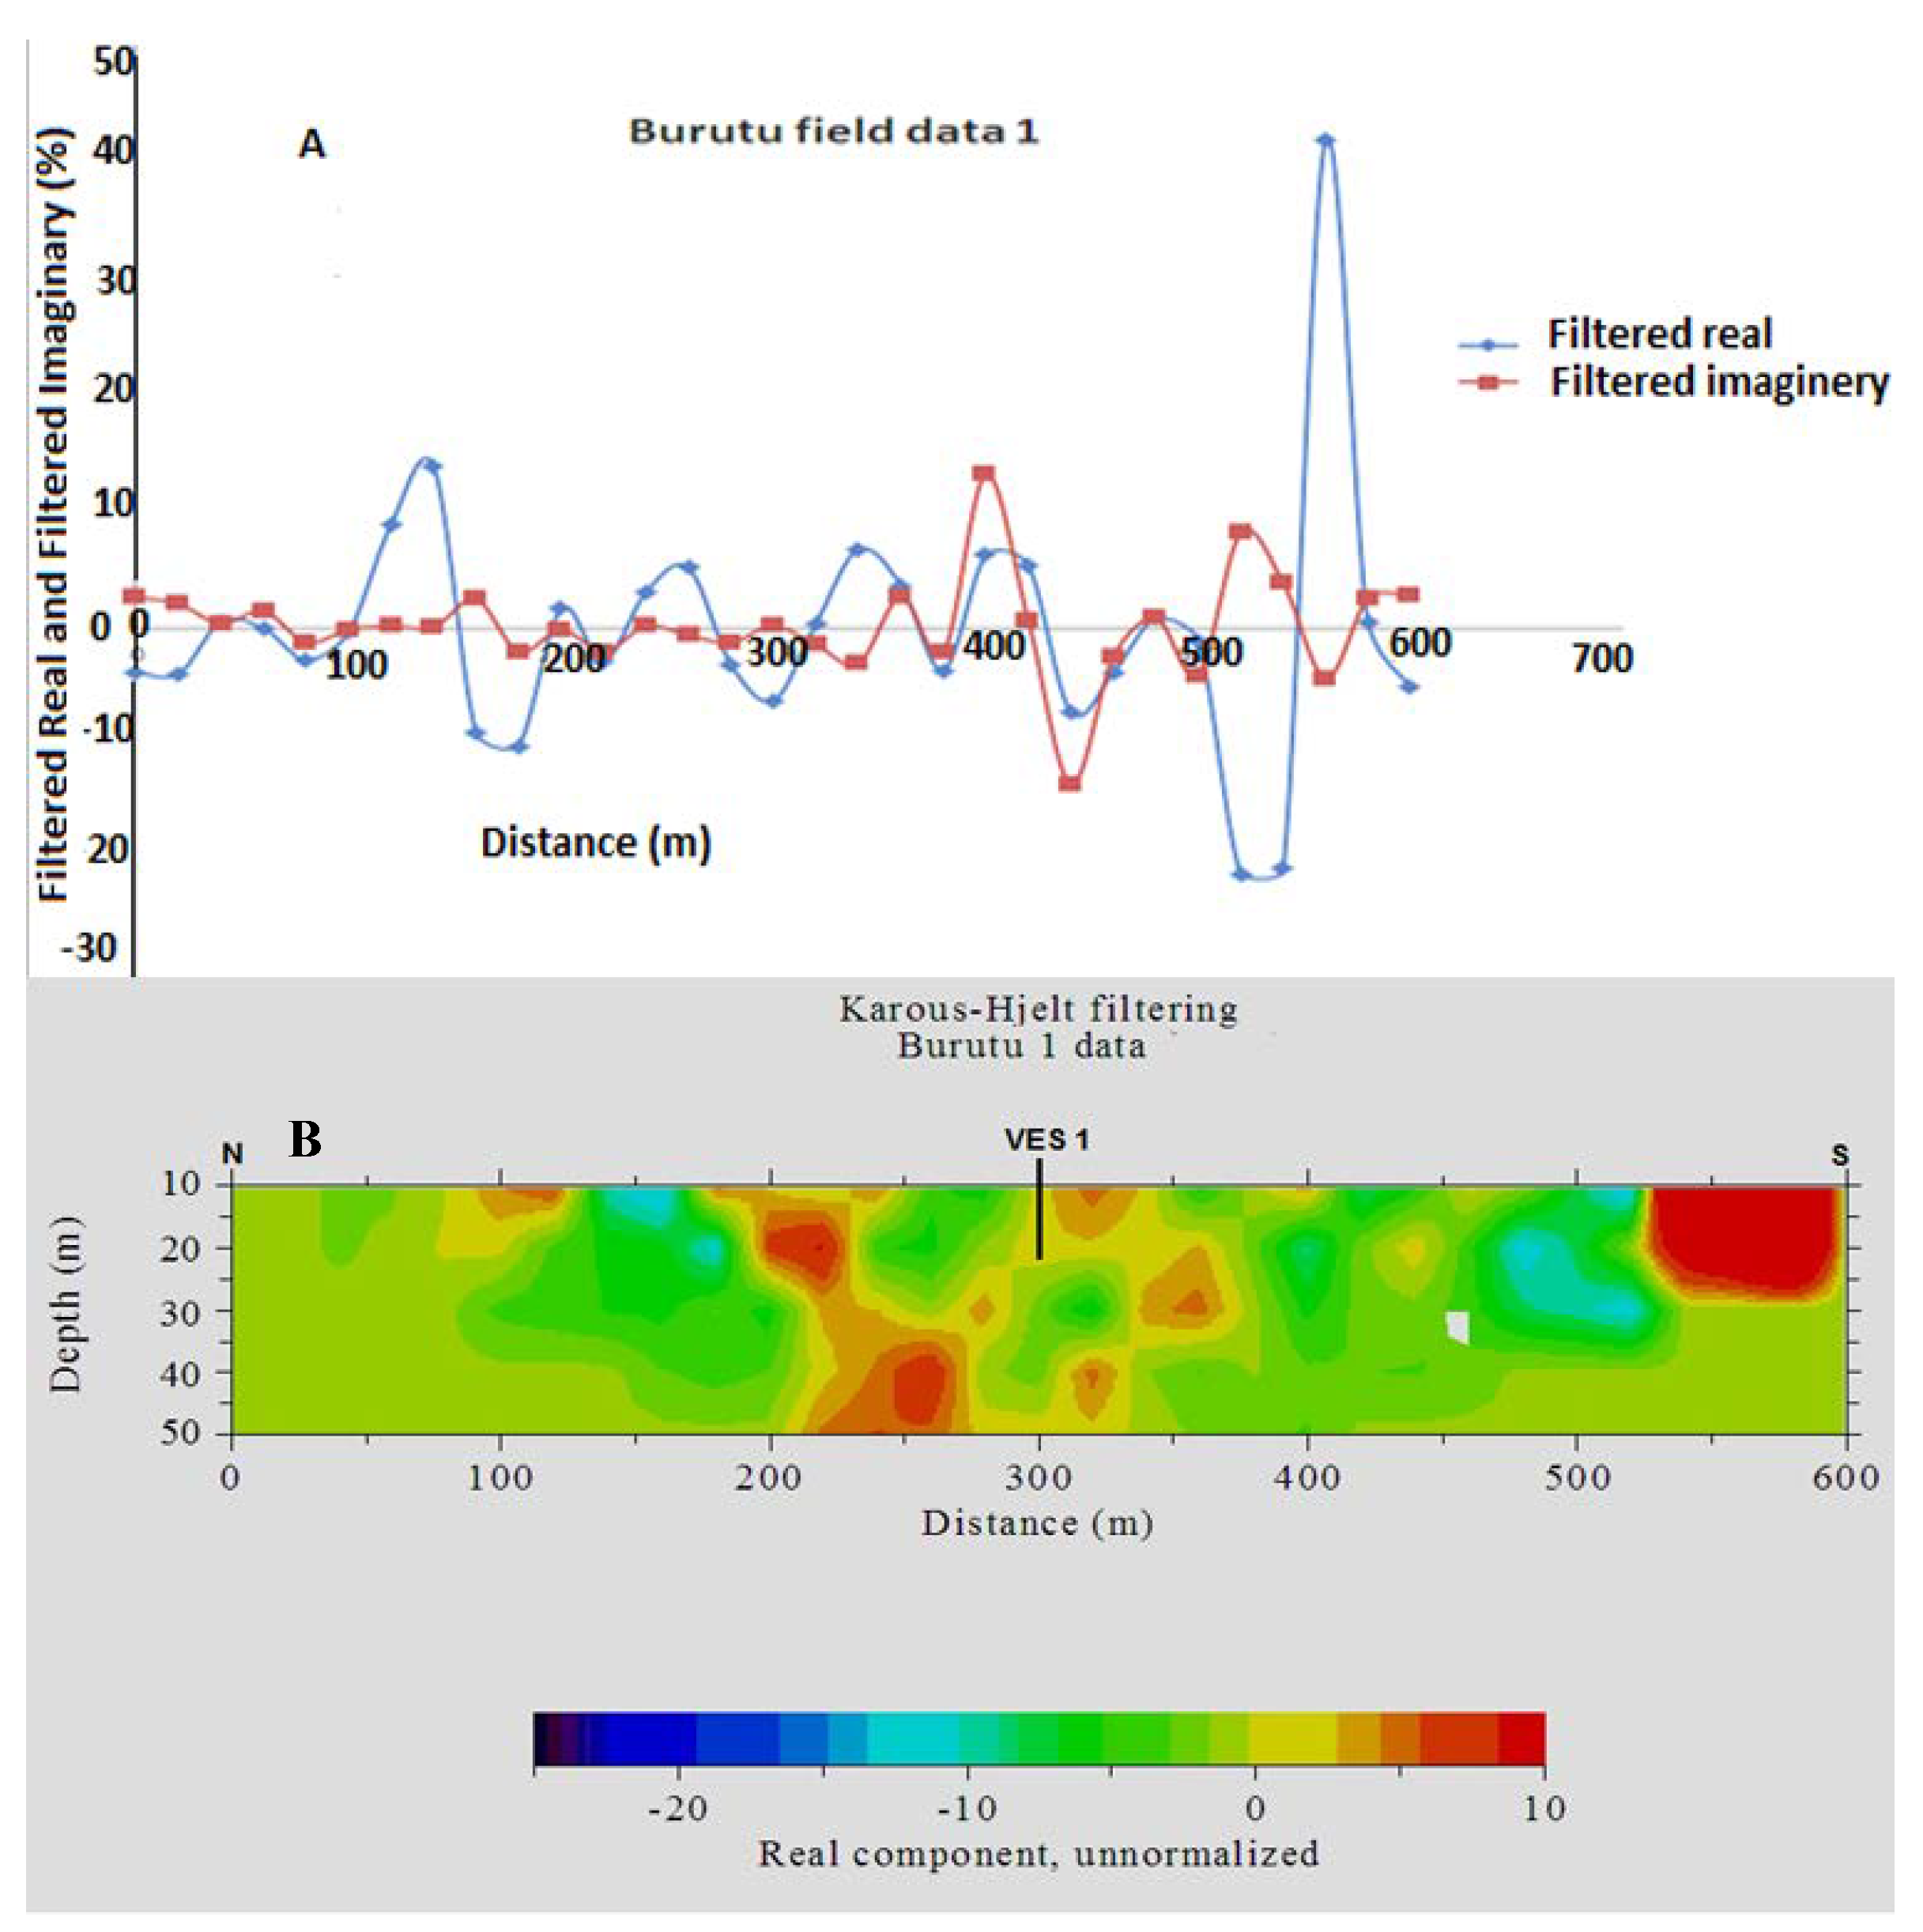
Figure 3.
Plot of filtered Real and Imaginary components (A) and current density pseudo-section (B) for VLF Profile 2.
Figure 3.
Plot of filtered Real and Imaginary components (A) and current density pseudo-section (B) for VLF Profile 2.

Figure 4.
Plot of filtered Real and Imaginary components (A) and current density pseudo-section (B) for VLF Profile 3.
Figure 4.
Plot of filtered Real and Imaginary components (A) and current density pseudo-section (B) for VLF Profile 3.
Figure 5.
Plot of filtered Real and Imaginary components (A) and current density pseudo-section (B) for VLF Profile 4.
Figure 5.
Plot of filtered Real and Imaginary components (A) and current density pseudo-section (B) for VLF Profile 4.
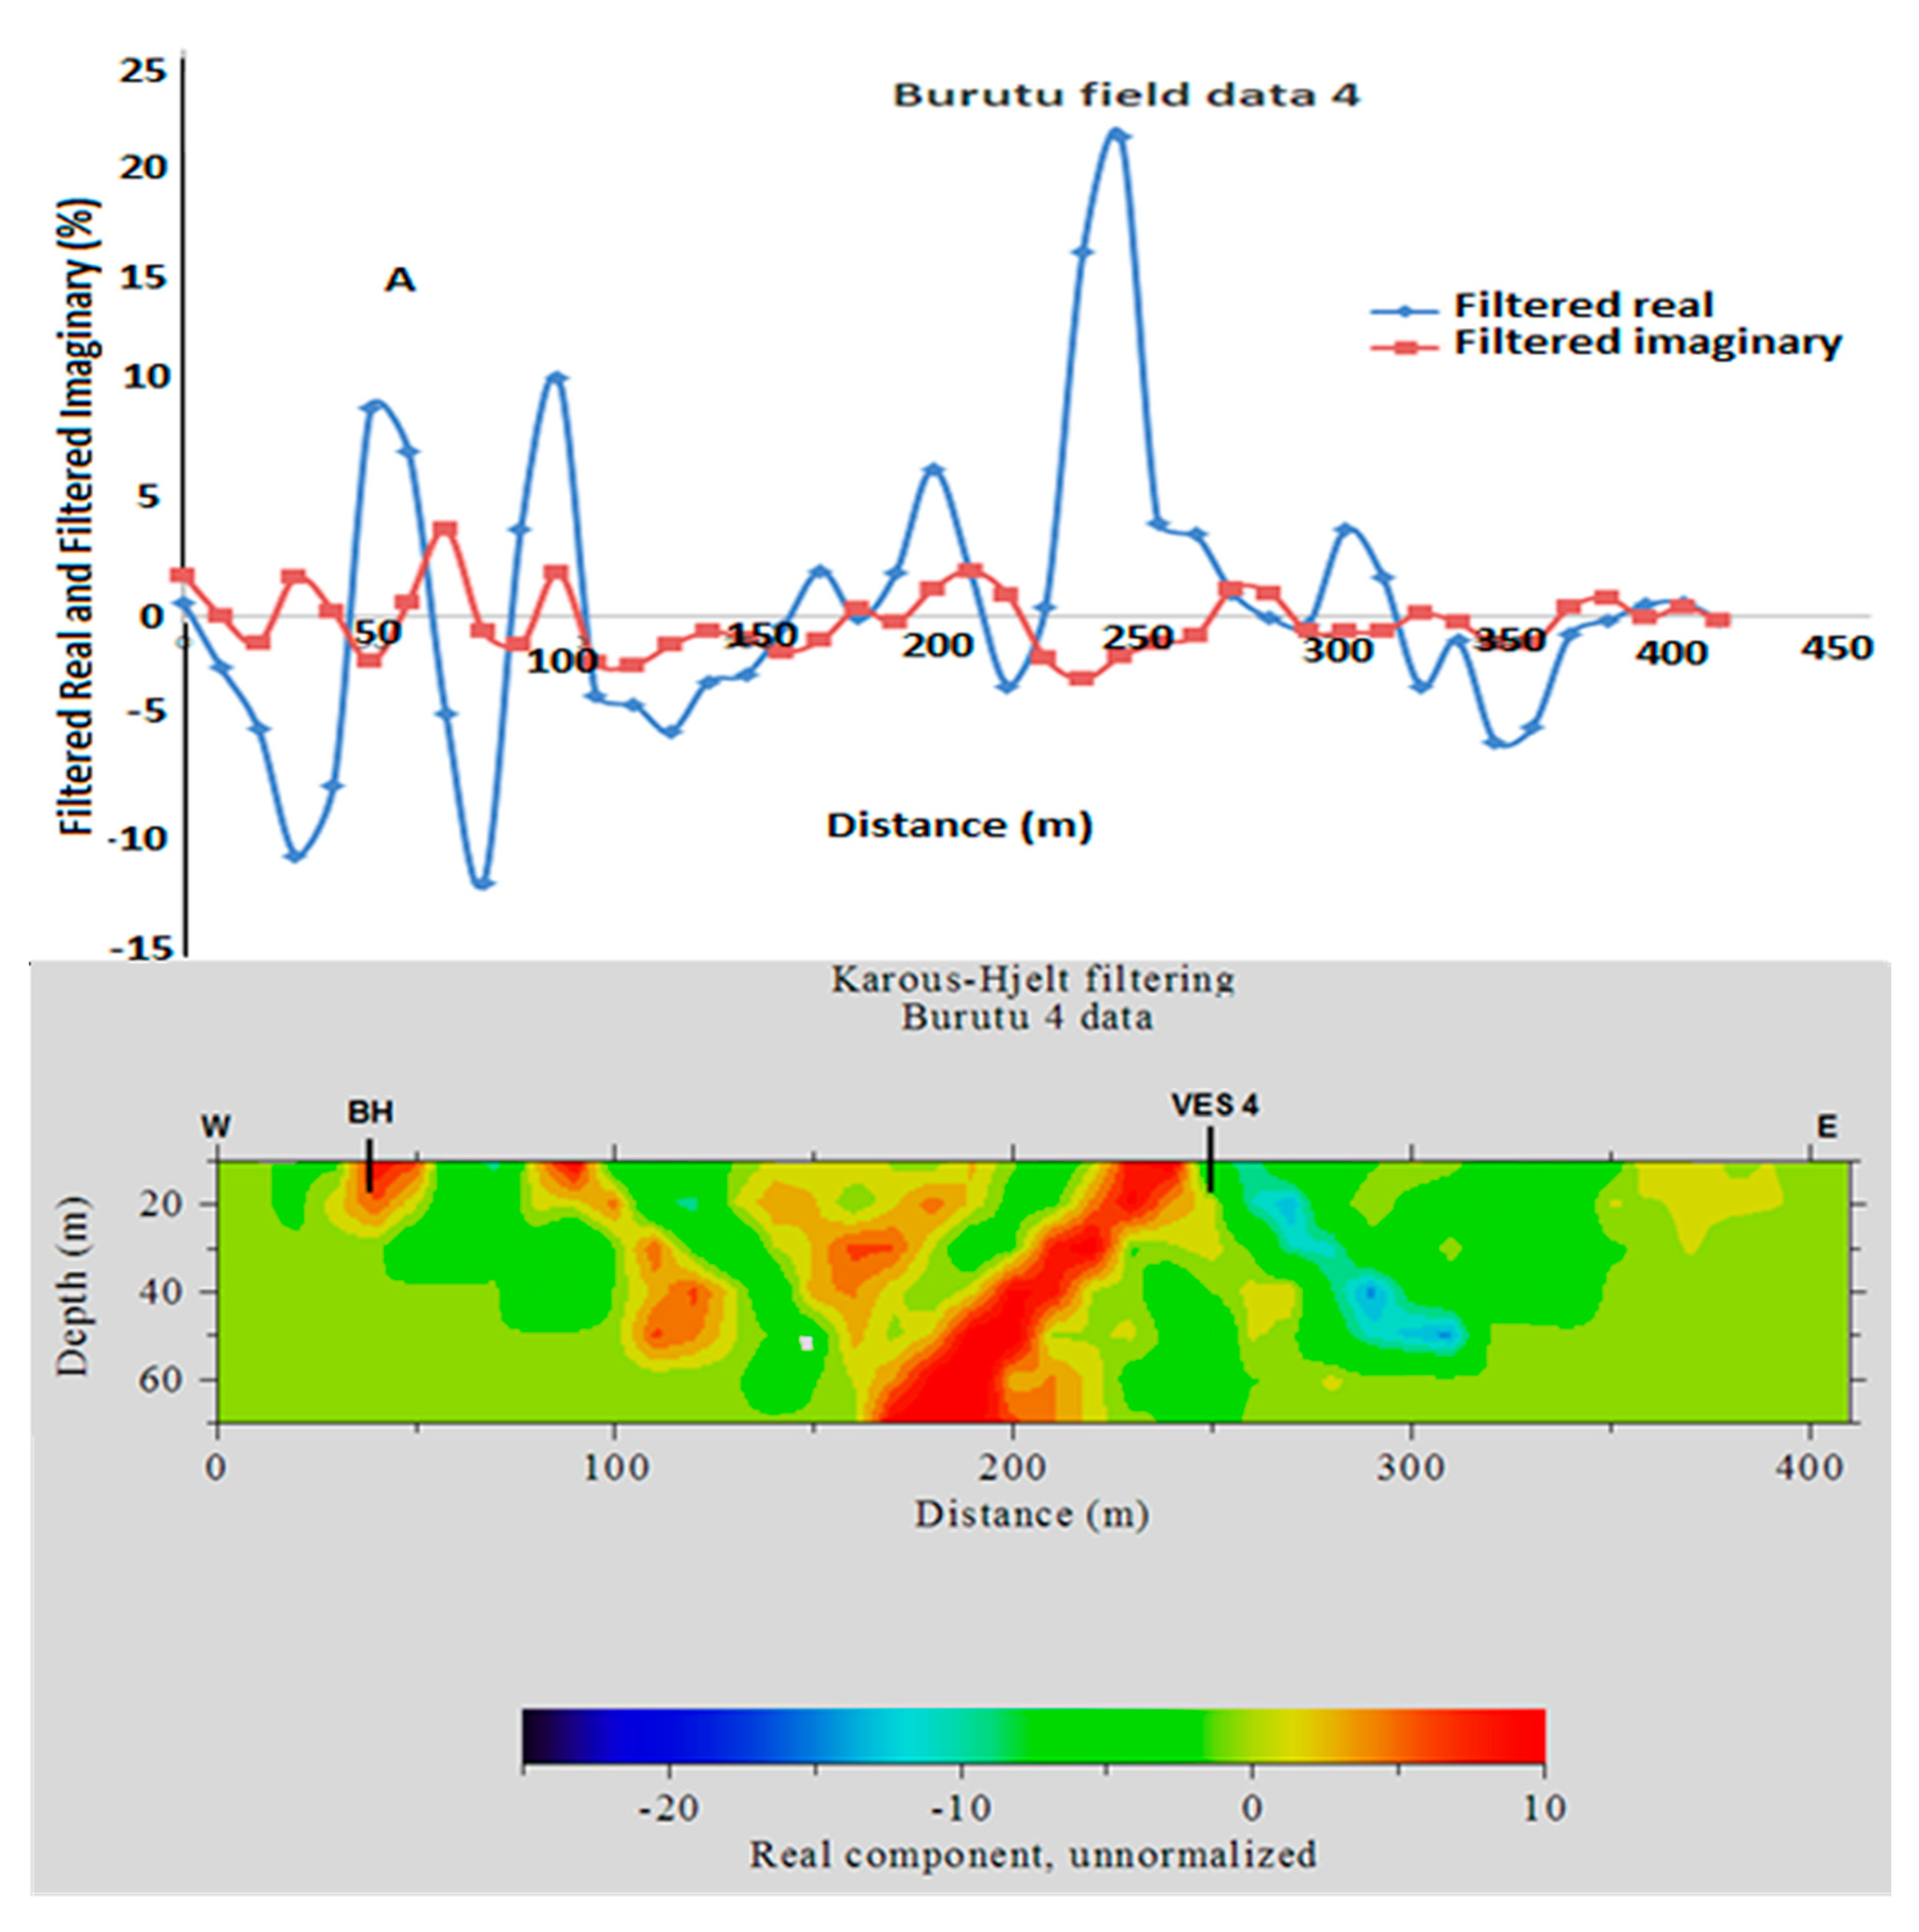
Figure 6.
Plot of filtered Real and Imaginary components (A) and current density pseudo-section (B) for VLF Profile 5.
Figure 6.
Plot of filtered Real and Imaginary components (A) and current density pseudo-section (B) for VLF Profile 5.
Figure 7.
(A–E) Representative samples of computer iterated curves and theirs inverted models depicting resistivity values, geoelectric layers and depths.
Figure 7.
(A–E) Representative samples of computer iterated curves and theirs inverted models depicting resistivity values, geoelectric layers and depths.
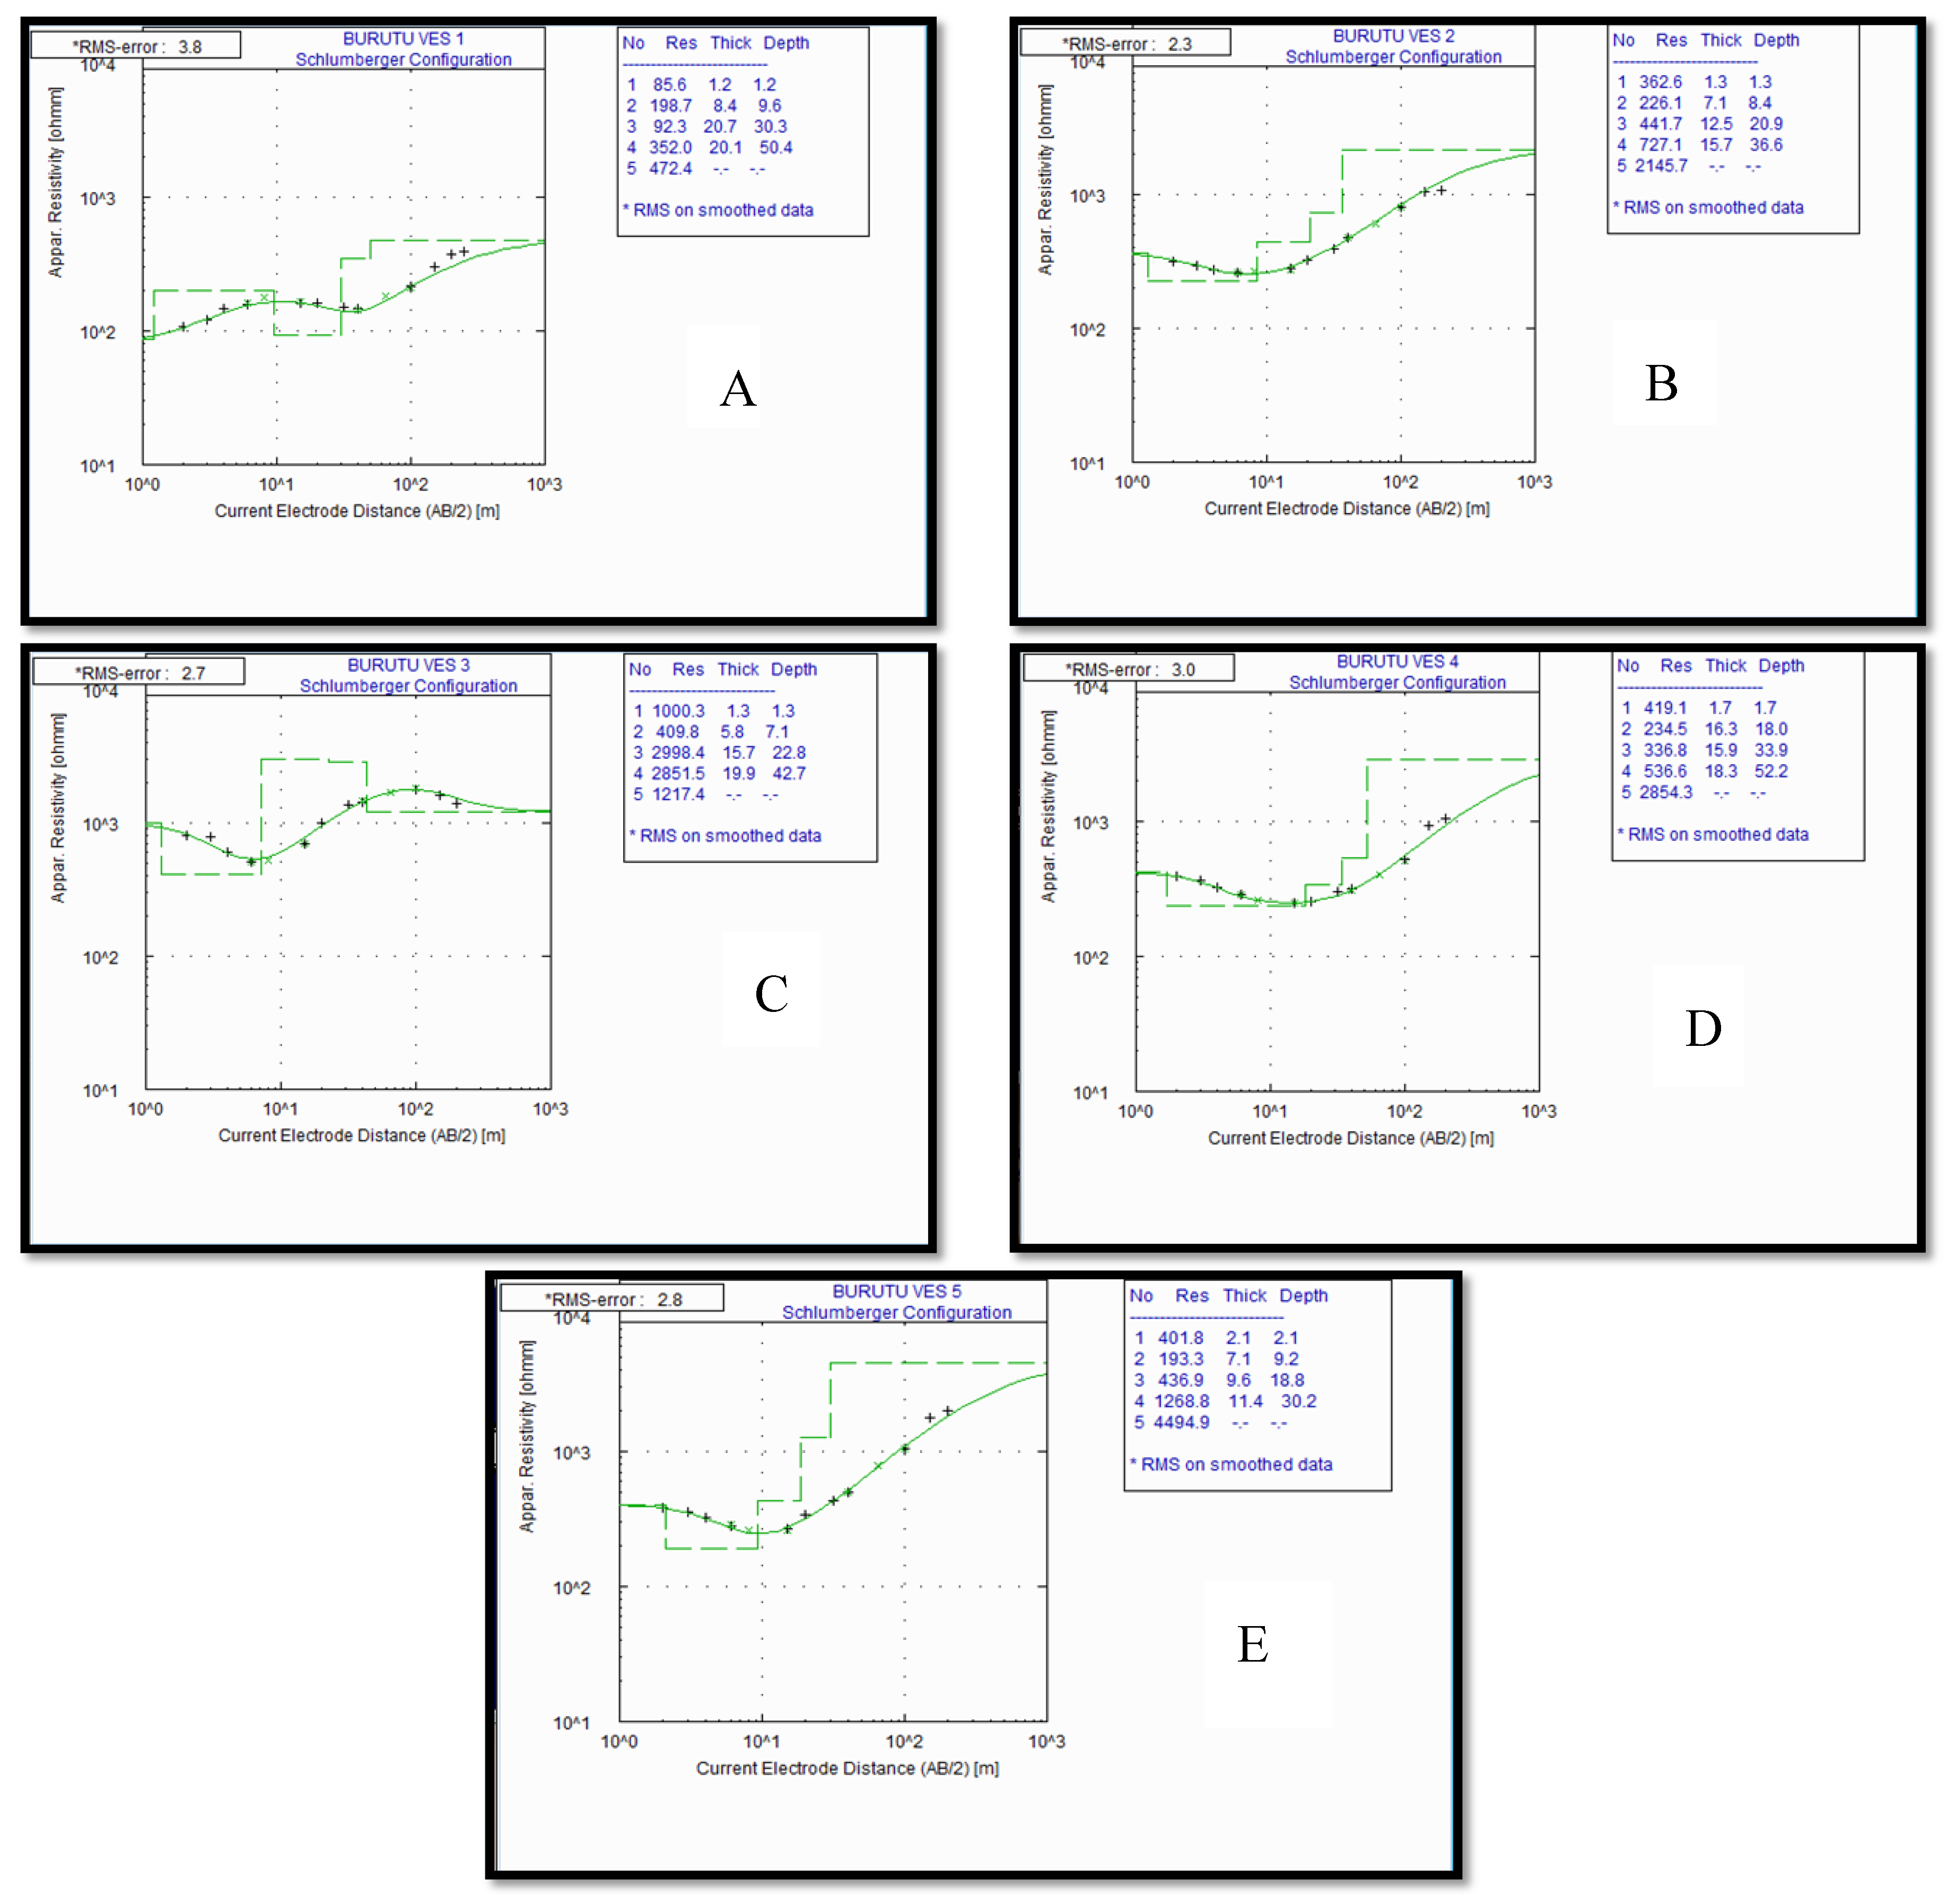
Figure 8.
(A–E) Lithologies inferred from interpretation of VES 1–5 and (F) borehole log located along profile 4.
Figure 8.
(A–E) Lithologies inferred from interpretation of VES 1–5 and (F) borehole log located along profile 4.


Table 1.
Stratigraphic units of the Niger Delta [19].
Table 1.
Stratigraphic units of the Niger Delta [19].
| Outcropping Units | Surface Units | Present-Day Equivalent |
|---|---|---|
| Benin Formation | Benin Formation | Continental (Fluviatile) mainly sandstone |
| Ogwashi-Asaba FormationAmeki Formatio | Agbada Formation | Mixed continental brackish water marine deposits, sandstone and clay |
| Imo shales | Akata Formation | Marine deposits, mainly clays |
© 2018 by the authors. Licensee MDPI, Basel, Switzerland. This article is an open access article distributed under the terms and conditions of the Creative Commons Attribution (CC BY) license (http://creativecommons.org/licenses/by/4.0/).
Share and Cite
MDPI and ACS Style
Ohwoghere-Asuma, O.; Aweto, K.E.; Chinyem, F.I.; Nwankwoala, H.O. Assessing the Protective Capacity of Aquifers Using Very-Low-Frequency Electromagnetic Survey. Geosciences 2018, 8, 150. https://doi.org/10.3390/geosciences8050150
AMA Style
Ohwoghere-Asuma O, Aweto KE, Chinyem FI, Nwankwoala HO. Assessing the Protective Capacity of Aquifers Using Very-Low-Frequency Electromagnetic Survey. Geosciences. 2018; 8(5):150. https://doi.org/10.3390/geosciences8050150
Chicago/Turabian StyleOhwoghere-Asuma, Oghenero, Kizito Ejiro Aweto, Felix I. Chinyem, and Hyacinth O. Nwankwoala. 2018. "Assessing the Protective Capacity of Aquifers Using Very-Low-Frequency Electromagnetic Survey" Geosciences 8, no. 5: 150. https://doi.org/10.3390/geosciences8050150
Note that from the first issue of 2016, this journal uses article numbers instead of page numbers. See further details here.