1. Introduction
Agriculture is a particularly important sector to the country of Peru, accounting for roughly 8% of national GDP and 25% of the labor force [
1]. The 2.2 million farmers of Peru produce one of the most diverse spreads of crop in the world. This indeed is the case in southern Peru, a region composed of four departments (Arequipa, Moquegua, Puno, and Tacna) that produced more than 1.25 million tons of crop in 2014 [
2]. The main crops produced in this region include tree fruits, tubers, alfalfa, and common vegetables. Southern Peru, however, is also home to some of the nation’s richest grapevine fields that are used for Peru’s signature pisco brandy, certain non-traditional agricultural exports, and several endemic crops relied upon for centuries by indigenous groups. The agricultural operations of the region are varied, ranging from groundwater pumping-intensive operations near the coast, to irrigated farms along small seasonal rivers, and also rain-fed fields in the highlands [
3]. While there are some large-scale commercial operations responsible for a large portion of the region’s exports to other parts of the country, more than 60% of farmers in southern Peru cultivate less than 3 hectares of land [
4] and participate in a fairly localized market. Additionally, two-thirds of these farms are rain-fed [
5]. Such factors are quite relevant when considering the impact of meteorological drought on an already semi-arid region participating in an economic activity dependent on water availability.
In general, farmers of the region do not have access to crop insurance products because administrative capacity to implement such a product is limited. This has been the case since at least 1998 in the aftermath of that year’s El Niño (the positive phase of the El Niño–Southern Oscillation, or ENSO, phenomenon) and the drought that followed, when some flurries to create a multi-peril crop insurance product for the region were met with hesitation from the reinsurance community and international entities [
6]. The few products that were designed in coordination with certain private entities eventually lost traction among stakeholders and were fully dissolved after 1999. National companies face further challenges in southern Peru relating to low levels of penetration into the market because of the scattered and diverse population of the region and, in certain cases, the nature of informal farming operations [
4]. While one agricultural insurance product is currently offered by the Peruvian company La Positiva Seguros on a nationwide basis against catastrophic losses [
7], only 8% of farmers in southern Peru have adequate credit to acquire such a product [
5].
Although agriculture insurance has been slow to develop in southern Peru in the recent past, the national outlook as of recent has been one of enthusiastic development and exploration of new insurance products. The Peruvian national government passed Ley N° 28939 in 2006 [
8] as a legislation to support national agricultural and irrigation interests. Among other action items, the law allocated the equivalent of
$14 million USD to the development of crop insurance programs. One approach recently explored is index-based insurance, a relatively new but innovative concept developed as an alternative to traditional crop insurance frameworks [
9,
10]. Index-based insurance uses a measurable variable, such as temperature, precipitation, wind, etc., as an indicator of the magnitude of losses that likely occurred for policyholders in any given growing season [
11].
In addition to reducing administrative costs and providing timely payouts, index-based insurance also minimizes moral hazard (for example, a farmer purposefully letting their crop fail for a payout) and adverse selection (for example, a farmer using information unfairly to their advantage in deciding whether or not to purchase insurance) [
12,
13]. These benefits of index-based insurance are accompanied by some disadvantages, the most challenging being basis risk—when a farmer’s insured loss does not correlate with the indicated index payout. There are also serious concerns regarding the societal aspects of these frameworks, such as communities’ willingness to participate in index-based insurance programs and exactly how funds are distributed in certain social contexts. Other typical disadvantages associated with index-based insurance, such as the need for high quality and extensive datasets as well as enabling policy environments, are currently non-issues in southern Peru [
2,
8].
The utility of index-based insurance products has been demonstrated previously [
14,
15], with numerous Peru-specific examples illustrating the potential to transfer risk from those most vulnerable. Some of these experiences include, but are not limited to: behavioral economic experiments involving area-yield index insurance for cotton in Ica that produced evidence that insurance may help reduce the fear of losing collateral that prevents potential borrowers from taking loans [
16,
17]; crop weather index insurance in Piura relating to the impact of flooding on harvests and the potential posed by micro-lending schemes in mitigating these impacts [
18]; and an ENSO-based index insurance product against floods in northern Peru that demonstrated the skillfulness of ENSO indices in determining payouts in the aftermath of floods [
19]. First noted by fishermen off the Peruvian coast in the 19th century, ENSO has played a crucial role in the history and development of Peru. Depending on the strength/phase of this climate phenomenon, impacts of ENSO may range from notable increases in water supply and agricultural production along the coast, to devastating flooding in the north and drought in the south of the country [
20,
21]. Peruvians thus share a uniquely intimate history with ENSO.
Furthermore, Red Cross Red Crescent of Peru has recently investigated the potential for forecast-based financing, coupling index-based insurance and index prediction, in the specific context of cold temperature and snow events in the mountains, river flooding in the north, and other ENSO-related weather events along the coast. While the policy environment which enabled these success stories still exists, the potential for an index-based insurance product or forecast-based financing framework has yet to be exploited in southern Peru for protection against drought.
This research illustrates that an index-based insurance product is viable for farmers in southern Peru, with a demonstration for one specific crop in a region of interest. The research was guided by the following questions: (1) what levels of endowment and premiums may be expected for an ENSO index-based insurance product specific to southern Peru? (2) how might such products fare over time? (3) can such insurance products be adapted to provide funds in advance of a drought?
2. Materials and Methods
Departmental crop data are collected by the Office of Economic and Statistical Studies (in Spanish, Oficina de Estudios Económicos y Estadísticos, or OEEE) within the Ministry of Agriculture and Irrigation (in Spanish, Ministerio de Agricultura y Riego, or MINAGRI). OEEE maintains a rich collection of production, area, yield (production per area), and commodity prices for hundreds of crops, in some cases spanning all the way back to 1950. For the four departments in question, a total of 42 major crops are considered for candidacy. In general, the dataset tells a story of increasing yields across time, with highly variable and relatively low yields in the early years, increasing and stabilizing over time. All crop yield data are linearly detrended to account for technological and management improvements.
The majority of farmers in the region depend on precipitation, lacking access to irrigation. During the rainy season, many locations receive up to 85% of annual precipitation, based on data from gauging stations maintained by the national hydro-meteorological organization (in Spanish, Servicio Nacional de Meteorología e Hidrología del Perú, or SENAMHI). Based on data from the stations, the rainy season is defined as January-March (JFM), with an average of 315 mm of precipitation, constituting more than two-thirds of the annual total across the region on average. Gradients are evident, however. Windward (i.e., northeastern) portions and higher elevations of the region receive larger magnitudes of precipitation while semi-arid to arid conditions exist in the southwestern portions and lower elevations of southern Peru.
While it is evident that several large-scale climate mechanisms influence the region’s hydrologic cycle [
22,
23], ENSO plays a significant role in modulating regional precipitation during these three months [
24]. The generally accepted relationship is that an El Niño (a La Niña) event produces drier (wetter) than normal conditions [
25,
26,
27,
28,
29]. ENSO thus serves as a potential proxy for precipitation in southern Peru, with several ENSO indices to choose from, including Niño 1+2, Niño 3, Niño 4, Niño 3.4, MEI, ONI, etc. [
30]. All of these indices are based on sea surface temperature (SST) anomalies (and in some cases other large-scale climate variables such as sea level pressure) in the equatorial Pacific.
We opt to select an ENSO index as a potential useful trigger for coverage for a myriad of reasons. First, an index based on SSTs as opposed to a physical rain gauge(s) reduces the potential for moral hazard. Second, the potential longevity of any monitoring station is not always certain. SENAMHI may eventually face capacity or budget cuts, jeopardizing a product conditioned on this data. Thirdly, ENSO is well understood in Peru. Finally, and perhaps principally, an important contribution of the study is to address the potential for forecast-based products. Pacific Ocean SSTs change at a relatively slow rate, thus making SSTs (or indices based on SSTs) appealing from a prediction perspective. Total seasonal precipitation may also be predictable, but notably more complicated [
22].
To determine which ENSO index serves as the best proxy for regional precipitation, correlations are calculated between a concurrent index and regionally (as well as departmentally) station-averaged precipitation. Although all indices correlate well (and significantly) with precipitation, Niño 3.4 displays the highest correlations in all instances, with JFM regionally station-averaged precipitation and JFM Niño 3.4 correlating at r = −0.575 (Arequipa station-averaged r = −0.535, Moquegua station-averaged r = −0.509, Puno station-averaged r = −0.533, Tacna station-averaged r = −0.517). Thus, Niño 3.4 is selected as the proxy precipitation index for this study.
While many crops may be insured under such insurance products, a single crop is selected for demonstration purposes using the following criteria: (1) a strong relationship between crop yield and interannual precipitation; (2) a strong relationship between crop yield and the Niño 3.4 index; and (3) literature documenting the crop as water sensitive and predominantly managed in rain-fed conditions. Additional factors such as societal prevalence and relevance are also implicitly considered in the process of selection.
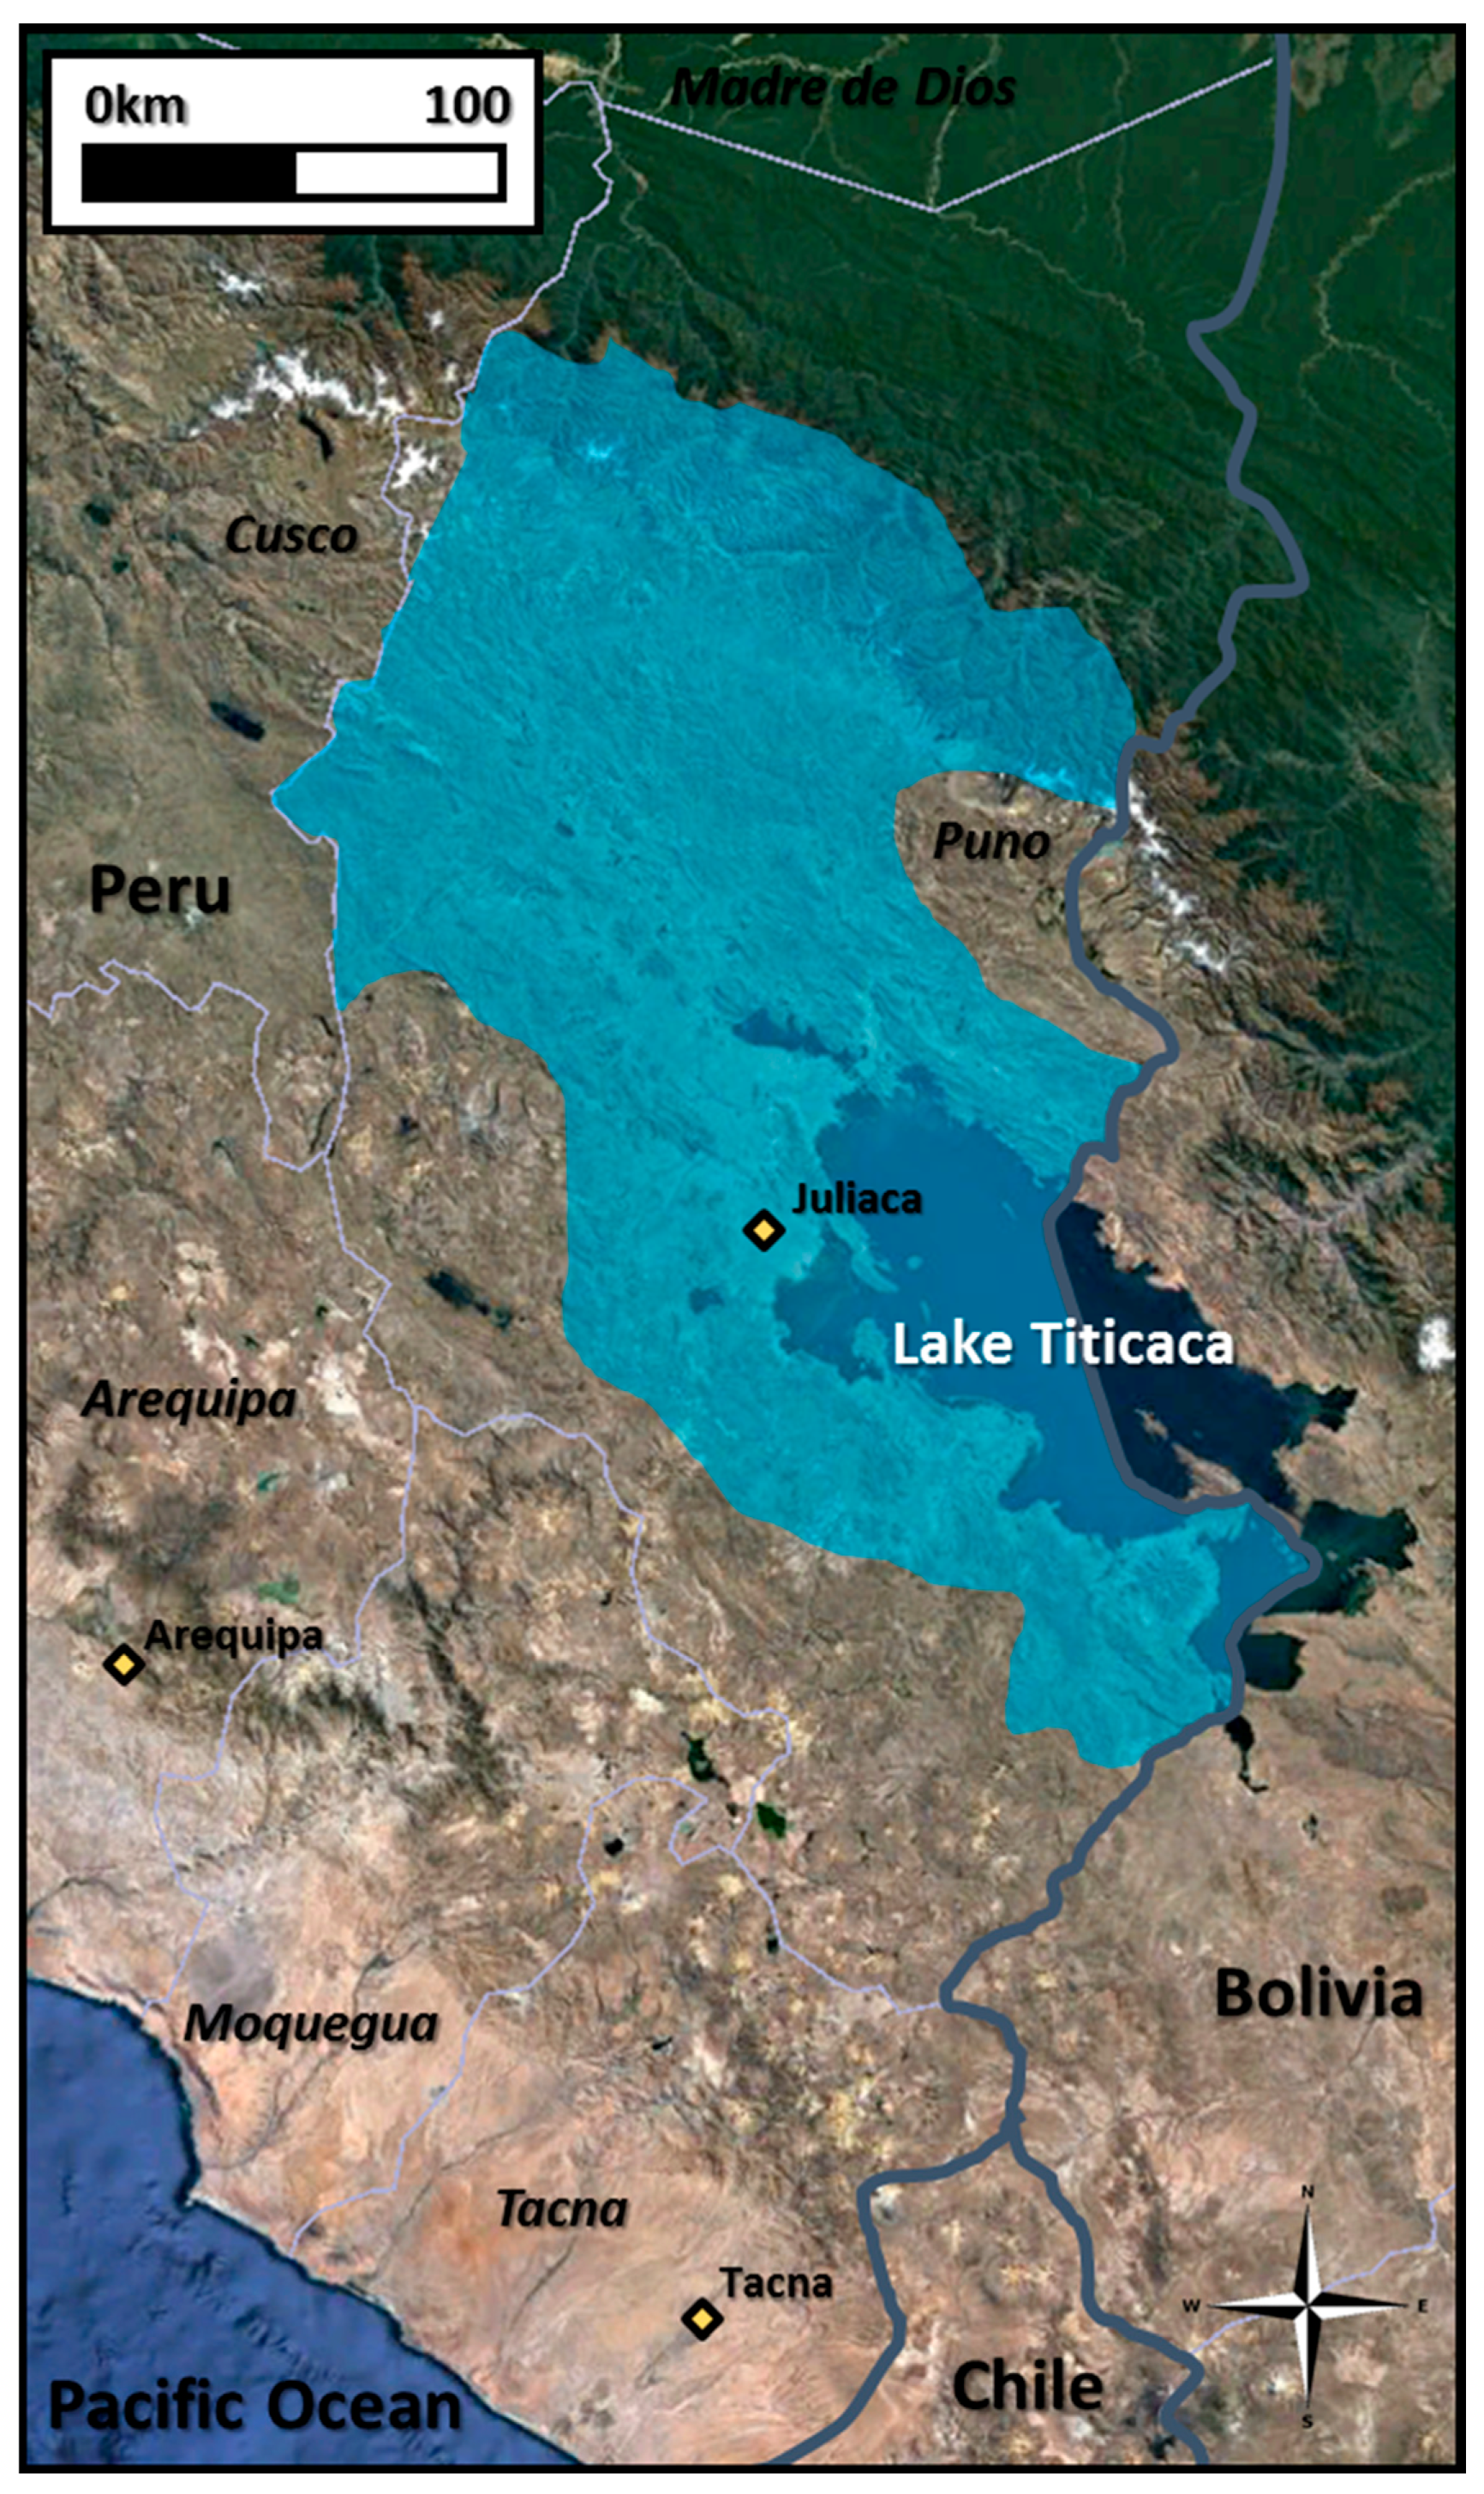
Several crops show potential across the region (e.g., alfalfa and sweet potatoes in Arequipa; onions in Moquegua; peas and onions in Tacna; alfalfa, peas, quinoa, mashua, and lupin in Puno) with regard to the stated criteria. Ultimately, production of
Oxalis tuberosa, or oca, in a sub-departmental extent of Puno (
Figure 1) is selected as the candidate crop for product development. The area evaluated in this study covers an extent of approximately 35,000 km
2 over a relatively small portion of the Altiplano. Other index-based insurance products and pilot studies, for example, have used spatial scales as small as district equivalents (~1000–3000 km
2) and even individual villages. Realistically, different insurance products should be developed for each individual crop at the smallest spatial scale feasible to account for the heterogeneity of precipitation and associated losses in a region [
31,
32]; however, because the period of record is limited at the more refined province and district level, oca yield data at the department level is utilized in this analysis.
Oca is a tuber cultivated in the High Andes and Altiplano regions of southern Peru. Interestingly, oca has been a part of the lives of people in the region for hundreds of years, even in the pre-Columbian era and predating the Incan Empire [
33]. Because of its status as one of the oldest Andean crops cultivated by farmers in the region, it is reasonable to assume in the near term that local people would be hesitant to remove this staple from popular dishes and from diets all together.
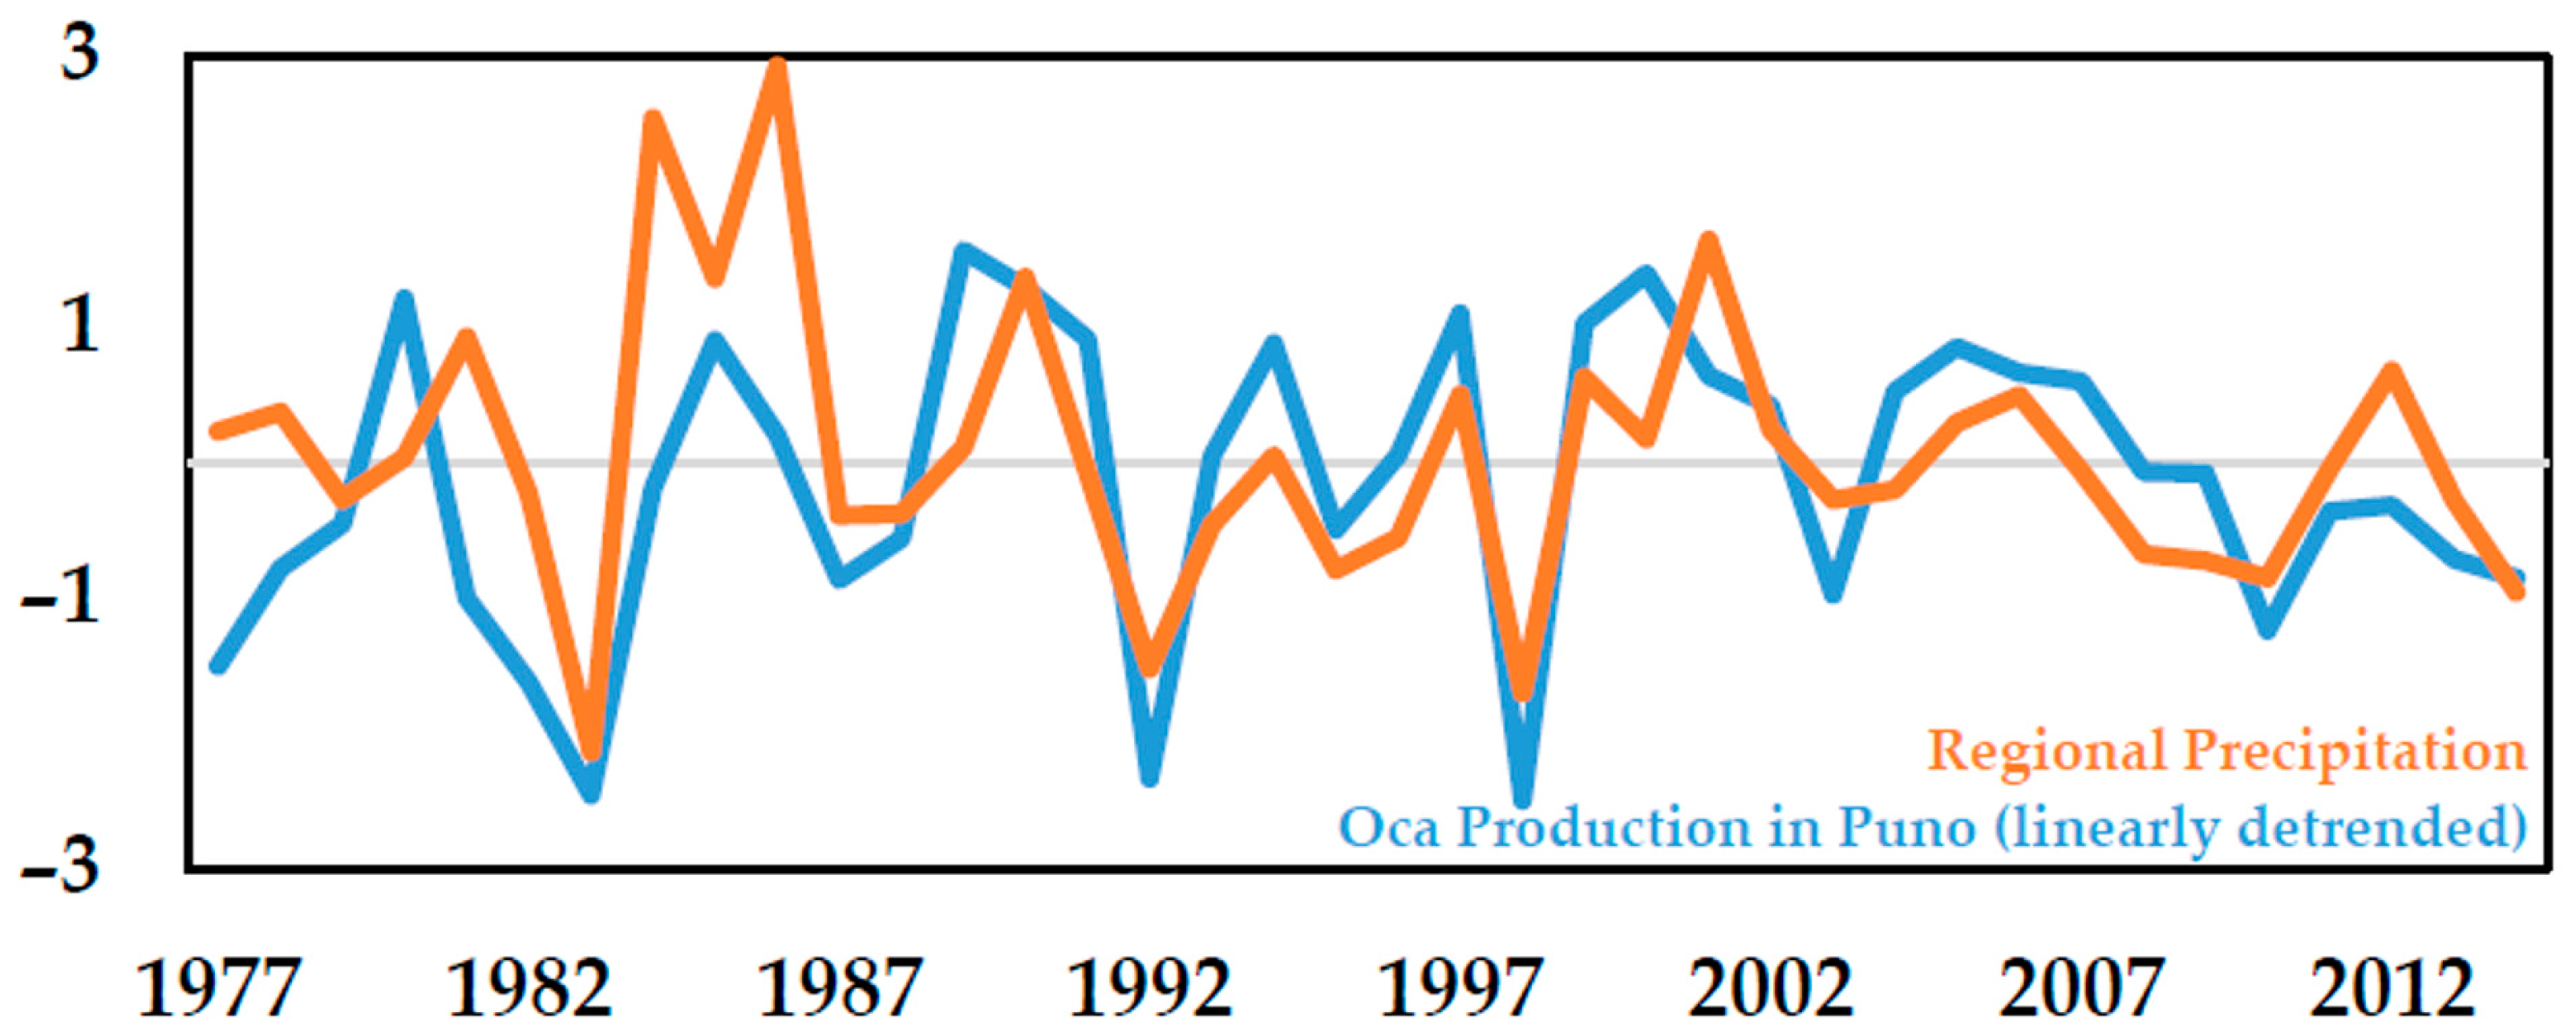
Although observations of oca yields at the department level only extend from 1977 to 2014, oca illustrates lower yields during times of below normal precipitation (1983, 1992, 1998;
Figure 2), correlates with Niño 3.4 at a statistically significant level (r = 0.51), and is noted by academic literature [
34,
35] and the Food and Agriculture Organization [
36] as being highly dependent on water and vulnerable to water stress brought upon by drought. To be clear, the potential for irrigated farmland within the region of interest is not directly addressed in this analysis. Further, it is recommended to focus any study of this scope on rain-fed agriculture only.
While the government of Peru has been moving towards creation of insurance programs in several applications, its resources to do so are still considerably limited [
37]. The reinsurance community has been slow to act in Peru, partially due to the impacts of the 1997–1998 El Niño event and subsequent 1998 drought [
38]. This reality is incorporated into product design by assuming that the program is self-insured, meaning that the product would be fully supported by the entity providing it, i.e., the government of Peru, and self-sustaining after the product’s launch. Ideally, multiple insurance products that pay out at different times may be paired to hedge payouts in any given year; however, this may be challenging for a country such as Peru that faces a diverse array of negative impacts during El Niño conditions [
39].
In designing the framework of a potential insurance product, it is crucial to consider the supply and demand of such products. The demand side (i.e., that of farmers) certainly is a controlling factor as to how an index-based insurance product is designed and utilized [
40,
41,
42]; however, considering the history of catastrophic loss insurance in Peru (and its failure to take root in the country due to both private and governmental organization issues and concerns), it is arguable that an index-based insurance product of this sort must first be one that the government of Peru would be willing to provide to potential policyholders. In making this assumption to design a supply side product, basis risk against the administrator is identified as the type to be minimized. Explicitly, this means calibrating the product such that no historical events without loss are inappropriately covered by the product. Alternatively, basis risks held by both the administrator and policyholder (and, potentially, solely the policyholder) could be minimized. Regardless of which type of basis risk (and how much held by each party) is minimized, the methodology described herein remains largely the same.
An initial minimum endowment is required to establish the self-insured product. The endowment is governed by the inflow and outflow of resources in terms of premiums paid into the endowment by farmers and payouts to farmers during covered loss events, respectively. Specifically, the value of the endowment at any given time is equal to the value of the endowment in the prior period, plus the constant premiums paid into the product and minus the potential payouts of the product during that period.
To evaluate the product, optimal minimum initial endowments are determined. Depending on the case in question, the endowment is forced to be either bankruptcy adverse (i.e., endowment never dips below zero) over its full lifetime or simply to reach the end of the evaluated period at a level above bankruptcy. Here, the premium paid into the product is assumed to be constant across time (i.e., each farmer pays the same amount every year); however, a spatially and temporally diverse premium program may also be warranted in some situations. Premiums are relative to an expected, long-term average percentage of farmers’ yields, up to 7.5%, the maximum a farmer may be realistically expected to contribute [
13].
Although price data exists for oca, this product is initially designed with average expected yield (AEY) as a unit of measure. Instead of describing the value of the endowment, premium payments, and payouts in terms of Peruvian soles or any monetary unit, the flows are described as magnitudes of expected annual average yields for oca farmers in Puno—approximately 7100 kg/ha. With a model described in terms of yield as opposed to monetary terms, the developed product can be applied at a variety of scales for evaluation from the regional level (overall performance of a sector-wide product) down to the individual scale (how one would fare if they adopted a micro self-insuring protocol). Accordingly, economic data can be applied to the derived values of the product post-development to evaluate certain financial criteria.
This assumption largely ignores the intrinsic relationship between supply, demand, and commodity price of oca. For more exact economic insights, an additional model could be developed considering the price point of oca in any given year; however, this prospect is not pursued here. The erratic nature of the Peruvian economy during the mid-1980s and early 1990s resulted in extreme inflation rates, reaching up to over 7000% in certain instances. This trend is reflected in the data and is arguably unresolvable [
43].
Optimization is applied to determine the coverage function for the product. The objective here is to minimize the amount of losses incurred by farmers. Three strict constraints are placed onto the payout scheme optimization problem. First, coverage paid out is equal to zero if losses incurred are less than zero in any given year. Second, coverage paid out in any given year, when appropriate, must be greater than zero but less than or equal to either the actual experienced loss or 45% of AEY (whichever is smaller), as recommended by Dick and Stoppa (2011) [
13]. Finally, to minimize basis risk held by the product administrator, losses are covered only in years when a threshold Niño 3.4 value has been surpassed—set such that historical years with higher Niño 3.4 values all demonstrate actual losses. The final payout scheme is linear, as opposed to a step- or piece-wise function, with payouts increasing proportionally with increasing Niño 3.4 values.
Thus, the two critical product characteristics evaluated—besides the index and trigger—are the level of premium and associated magnitude of initial endowment. The long-term viability of a concurrent-season product is evaluated by bootstrapping (a resampling technique that relies on random sampling with replacement [
44,
45]) the available Niño 3.4 data (1870 to present) [
46] to create 100 new stochastic simulations, each of length 100 years. Here, concurrent products (JFM) under 3% and 7% premium rate scenarios are compared using metrics including average end of life endowment, 30-year bankruptcy rate and end of life bankruptcy rate (i.e., how many scenarios are at a level below zero at year 30 and 100, respectively), and lifetime bankruptcy rate (i.e., how many scenarios at any given time fall below zero).
Under the developed, concurrent framework, payouts could be dispersed as early as April 1. To evaluate the product with differing index lead times, two temporal alternatives are considered, in lieu of concurrent JFM conditions. For the first, observed Niño 3.4 index values are incrementally shifted back, month by month, to potentially take advantage of ENSO’s persistent nature. In the second, predicted JFM Niño 3.4 conditions from varying lead times are investigated. The advantage of a trigger early in time—if sufficiently correlated—could be earlier payouts, perhaps even prior to the JFM season.
3. Results
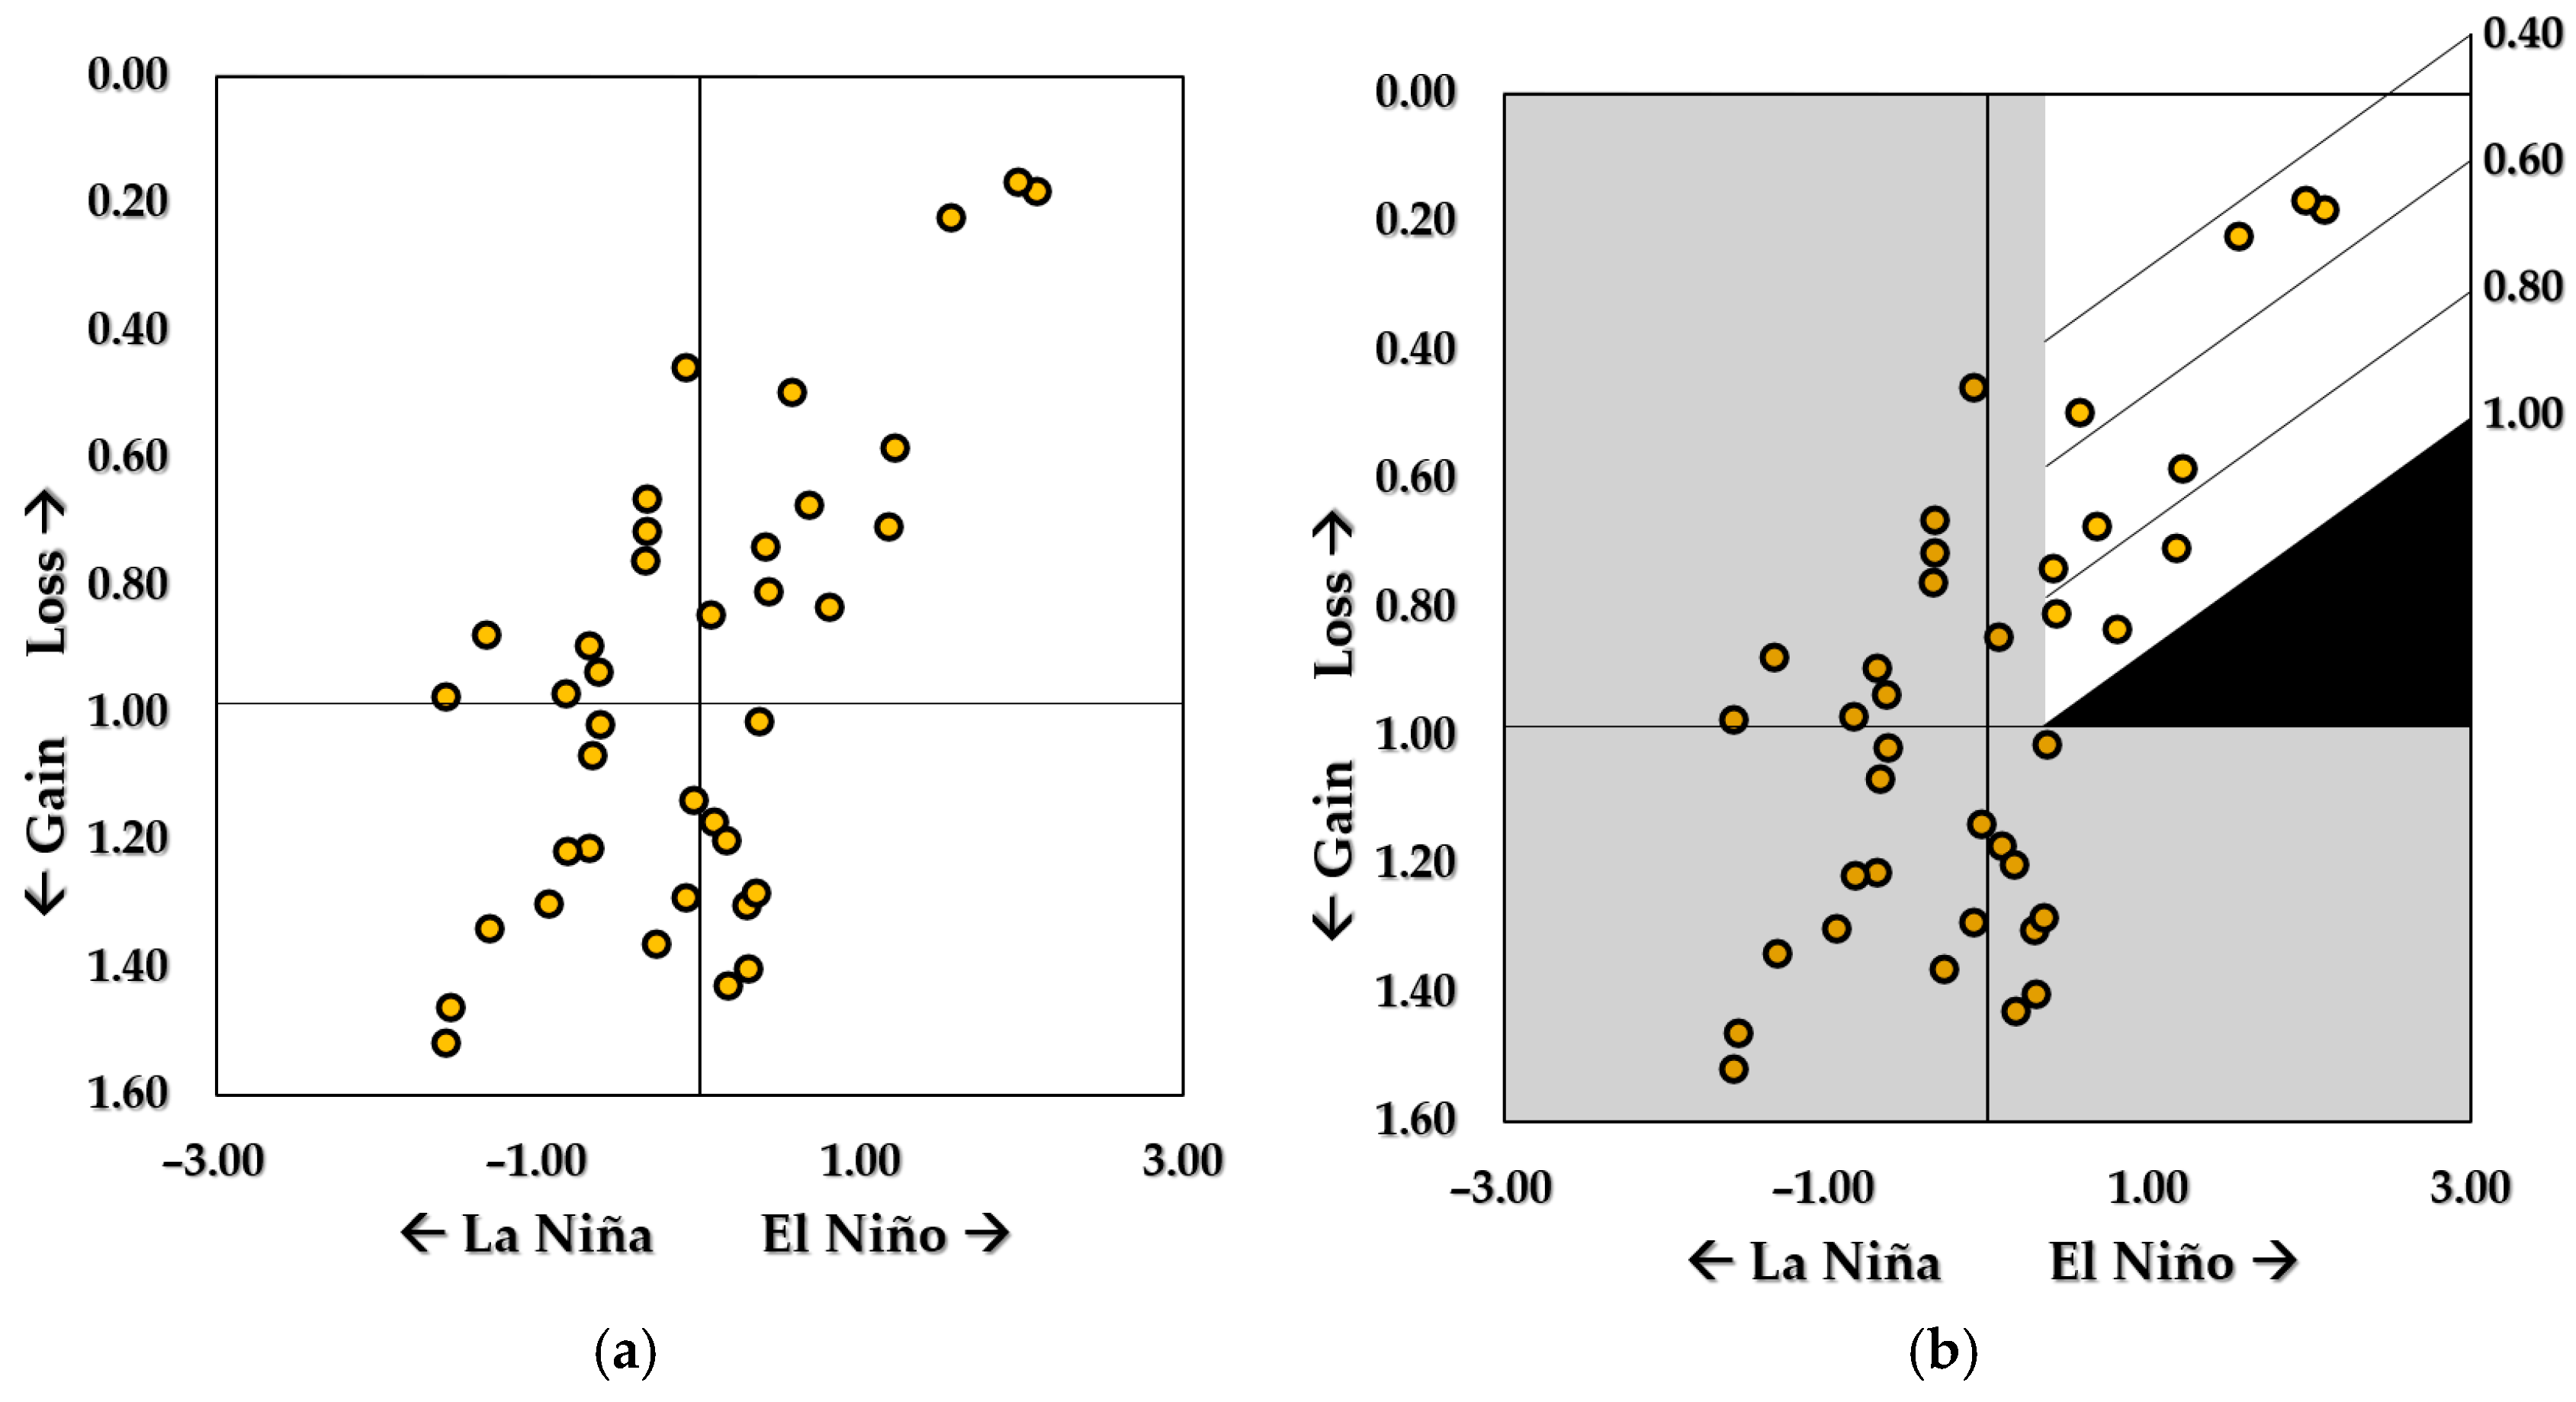
The payout scheme developed protects strictly against basis risk from the viewpoint of the product administrator, such that that no historical events inappropriately trigger a payout (
Figure 3). Subsequently, this results in some instances in which moderate loss events are not covered by the insurance product, particularly those during near-neutral ENSO conditions. Only one historical El Niño event with crop losses is not covered. Because the payout function is linear, a relatively larger portion of losses during moderate El Niño events are covered than during strong events.
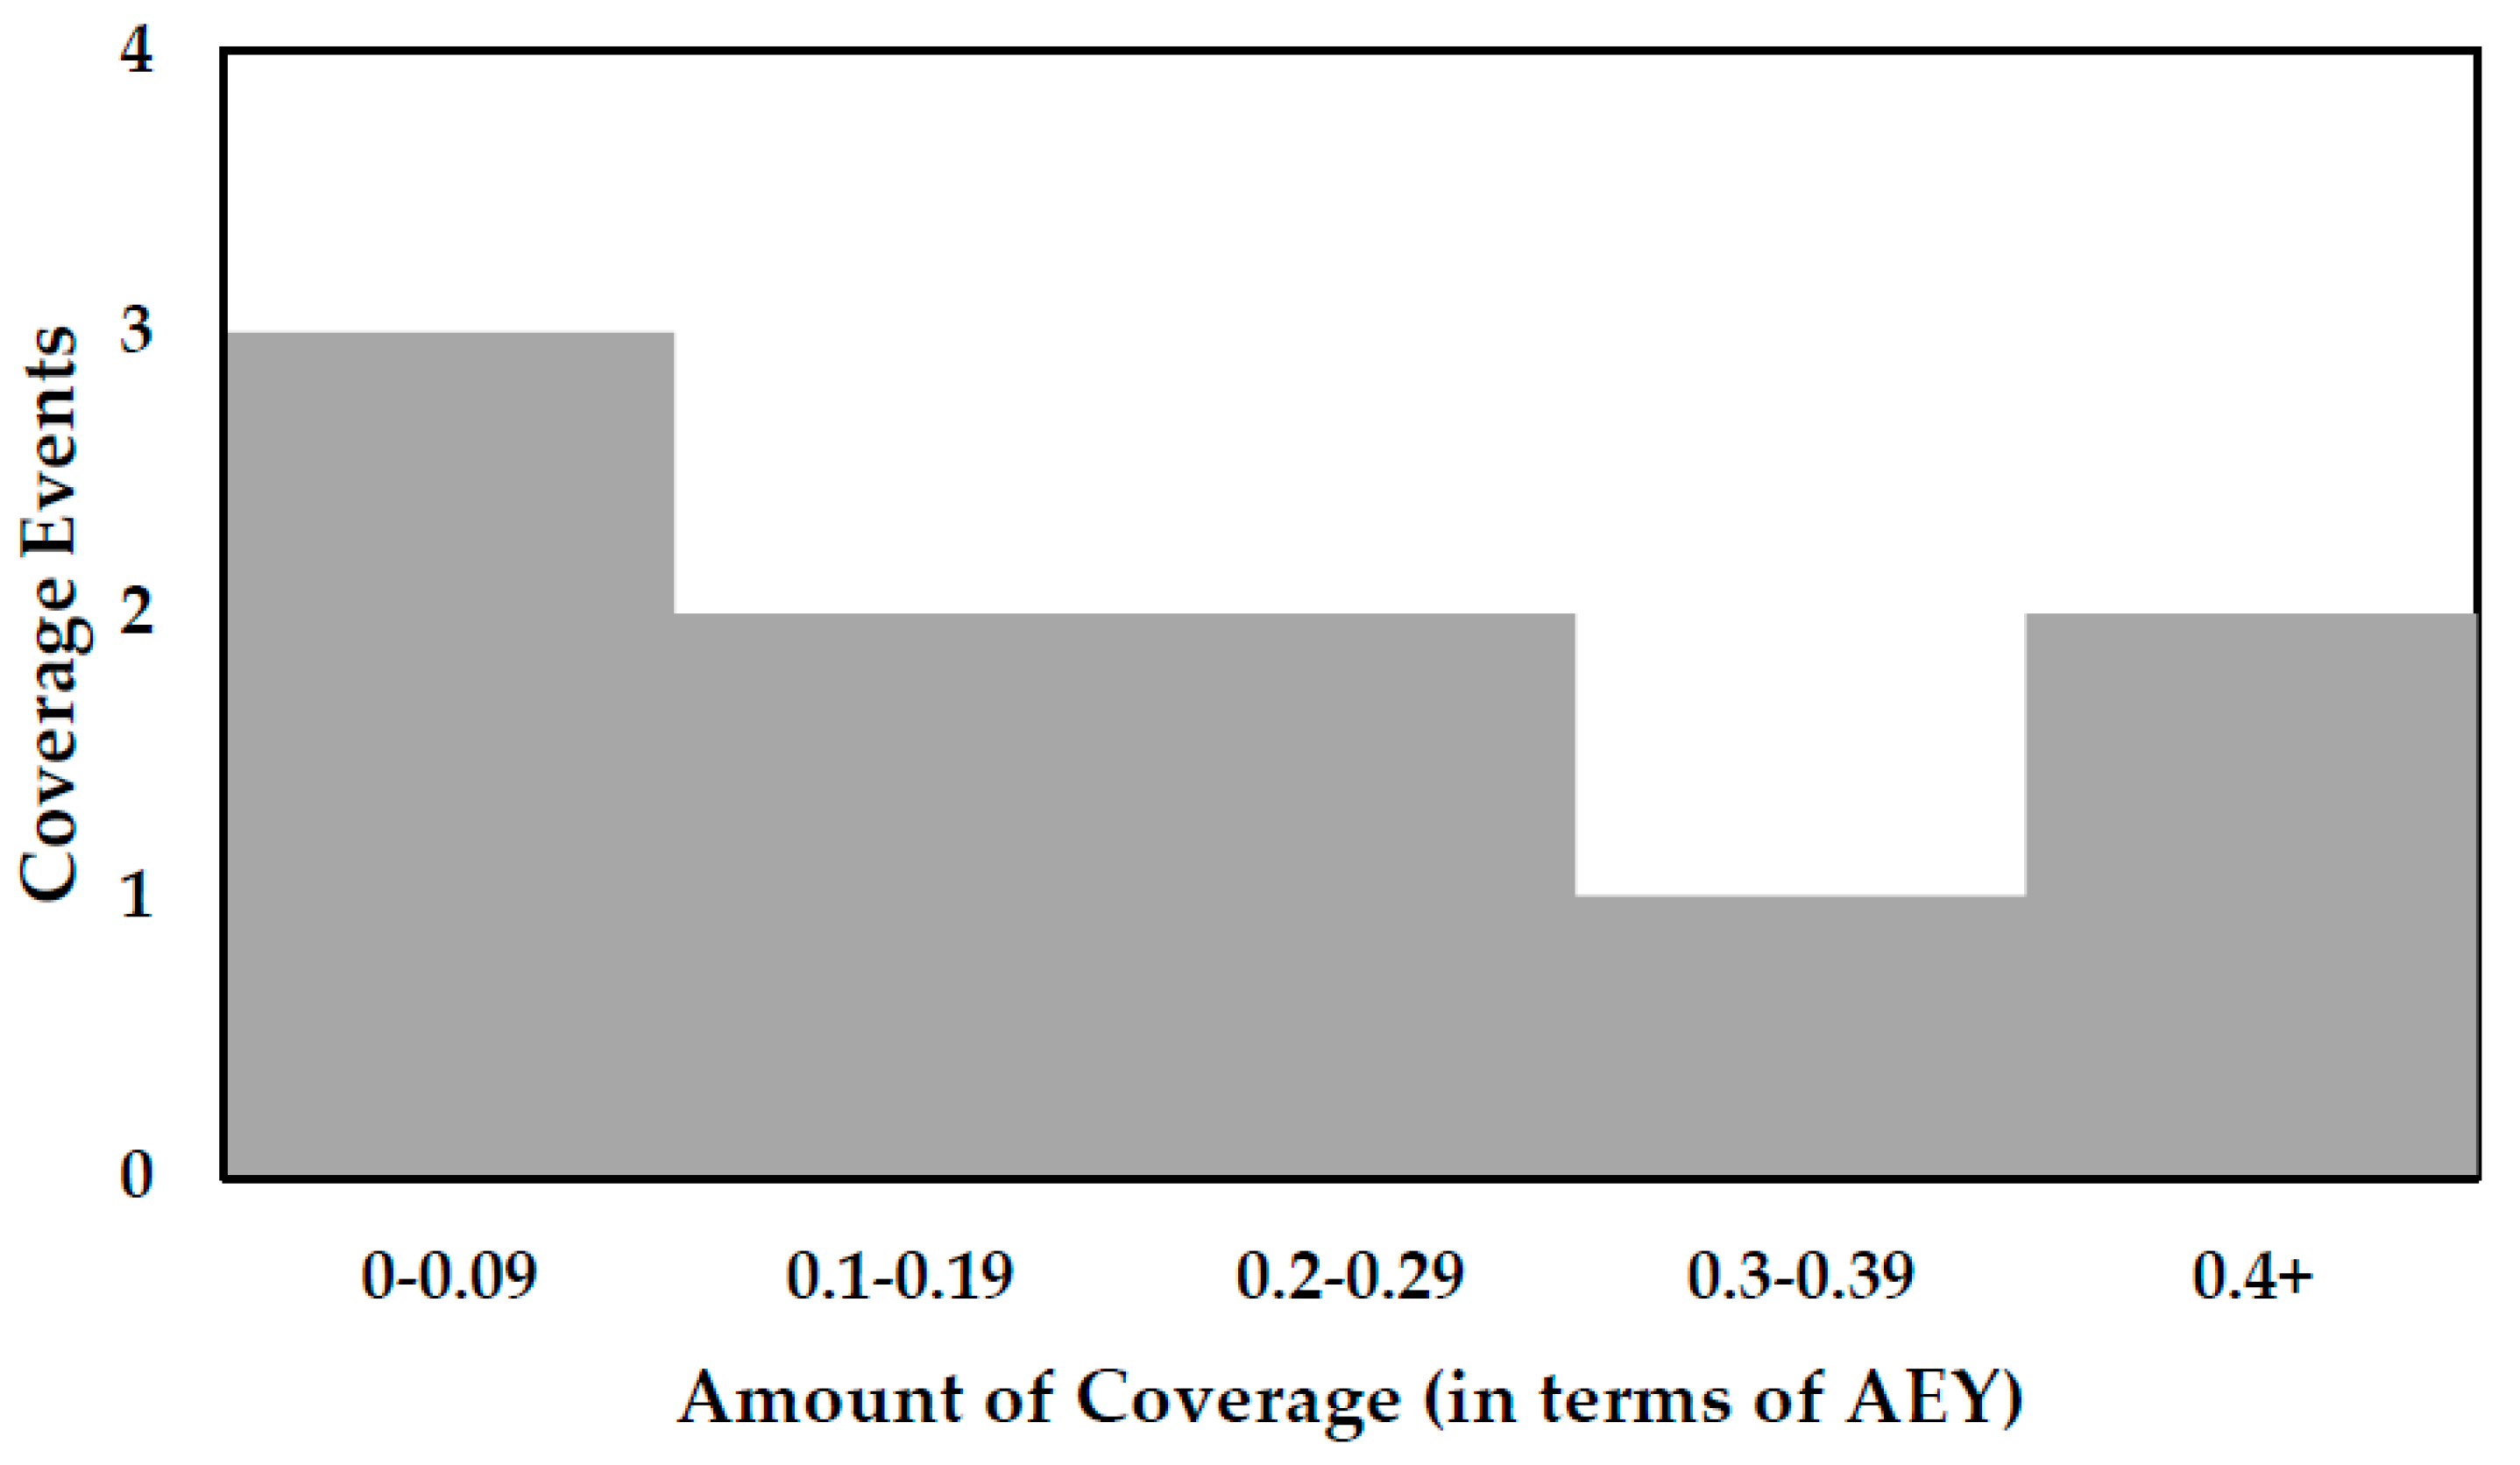
Based on the developed payout scheme, a historical burn analysis can be used to visualize the frequency and size of coverage events (
Figure 4).
For context, the average loss experienced throughout the time series is approximately 0.16, or 16%, of AEY, while the average loss size of covered events is 0.40, or 40%, of AEY. The average amount of coverage provided by the payout scheme is roughly 0.21, or 21%, of AEY. As mentioned, the maximum coverage possible under this scheme is 45% AEY.
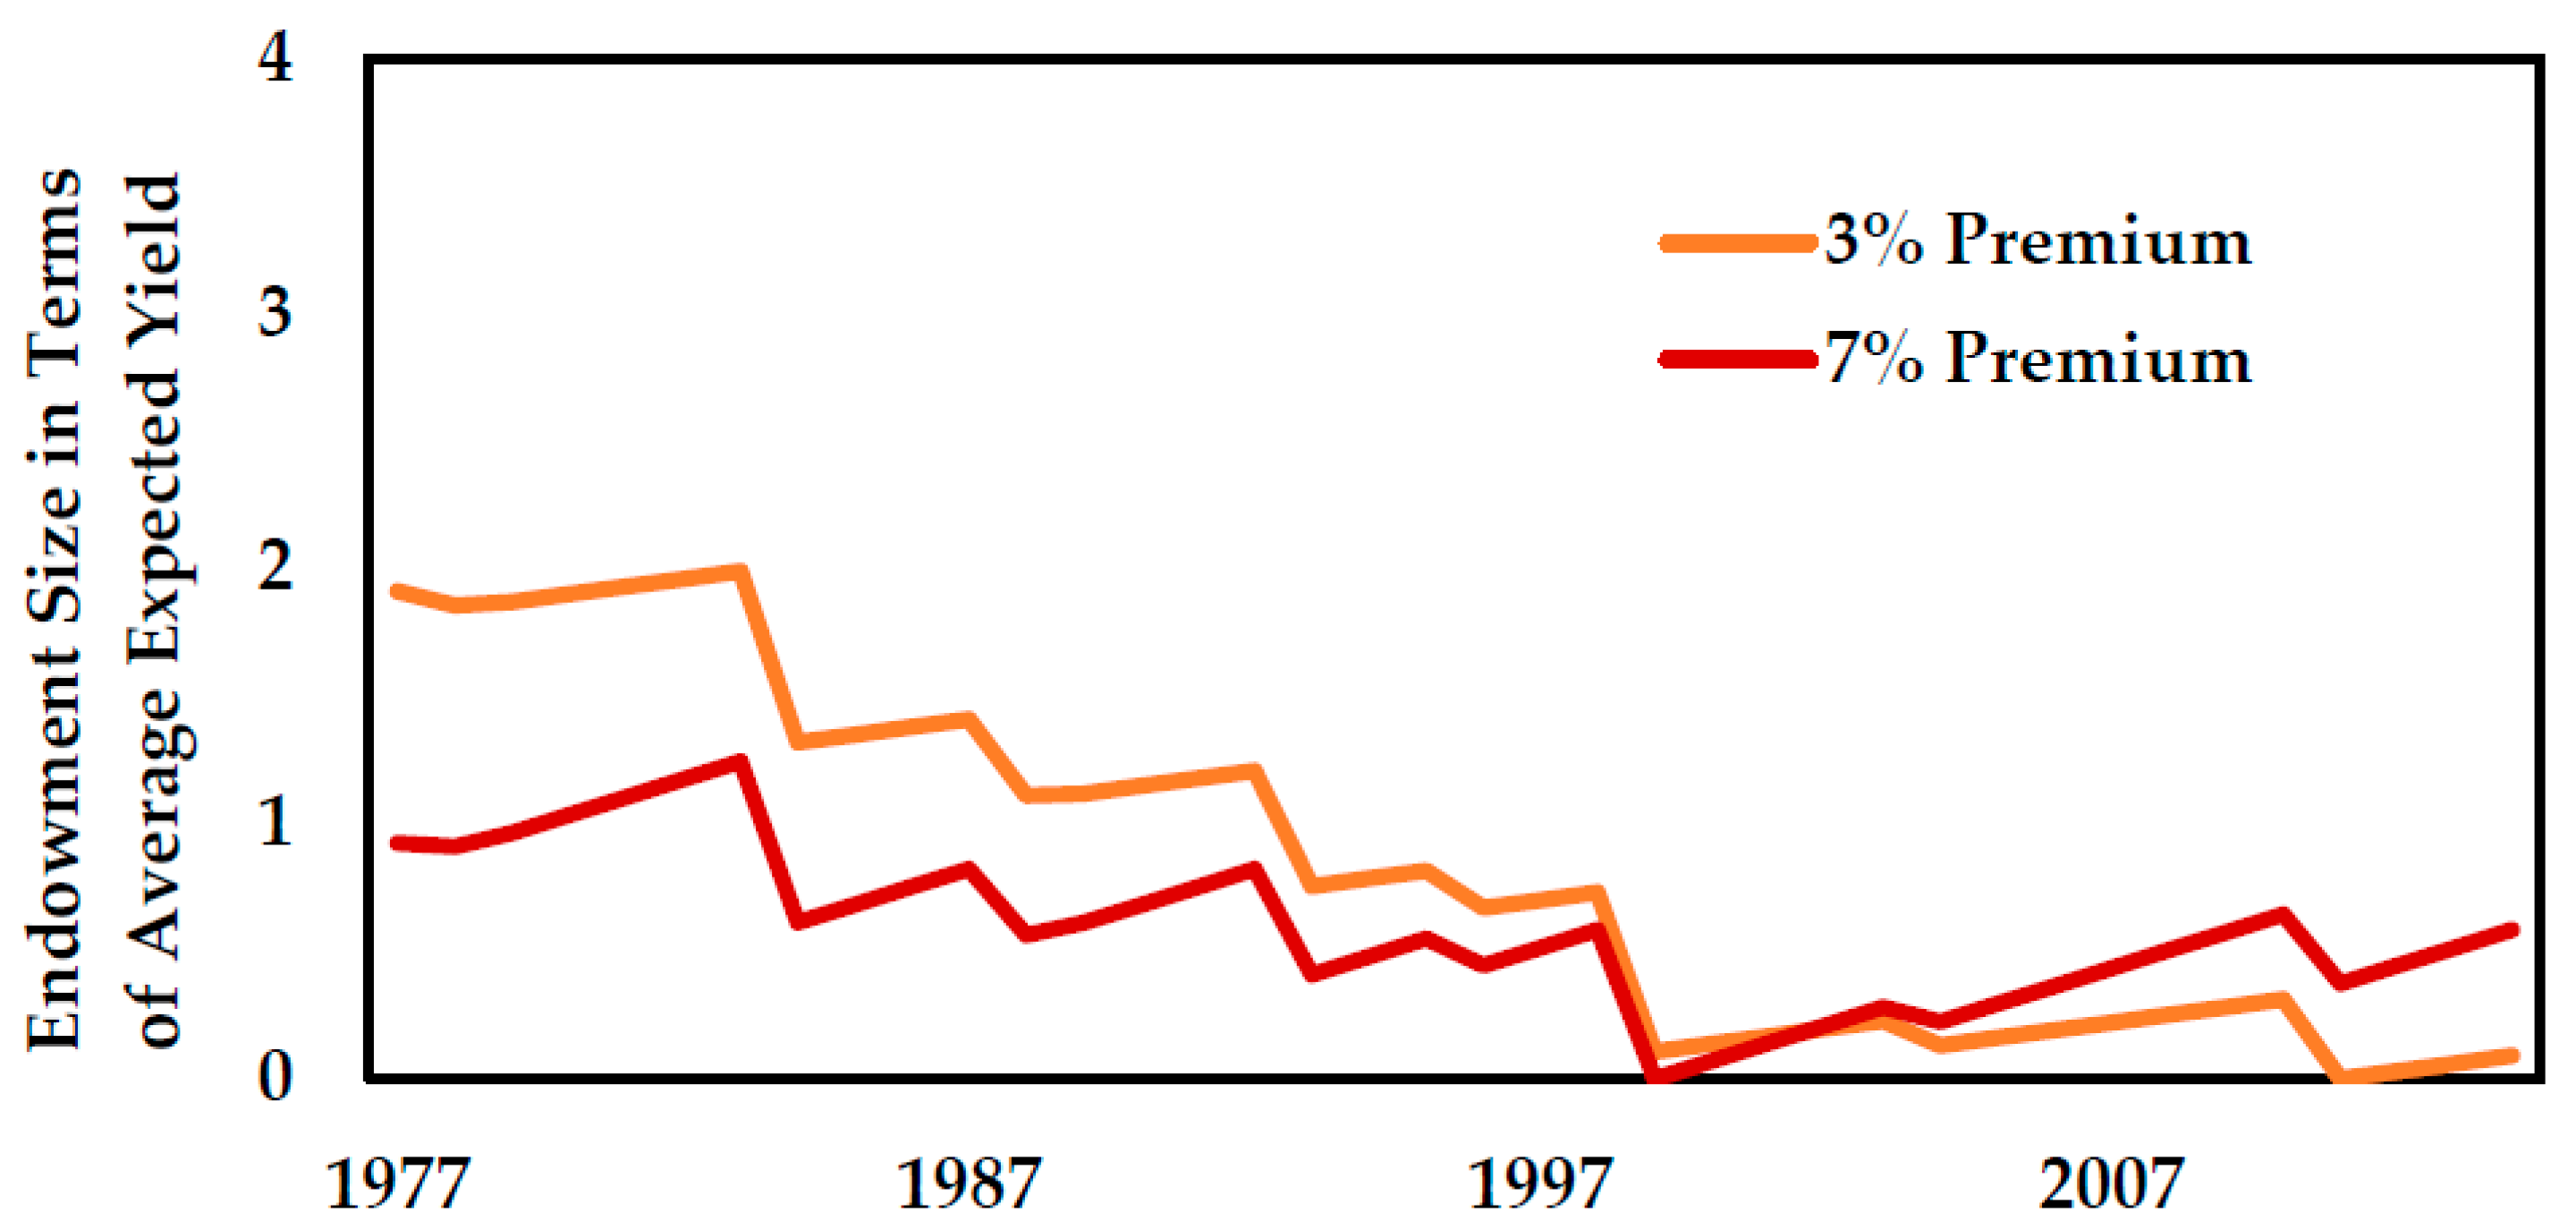
Using this payout scheme, the 7% and 3% premium rates are evaluated to determine the optimal initial endowment size under concurrent (JFM) conditions using historical observations (
Figure 5).
Products with lower premiums consistently illustrate the need for higher initial endowments. For example, an AEY of 1.8 is required for the initial endowment of a 3% premium product, while an AEY of 0.9 suffices for the 7% product. If recent economic data is applied to these figures,
$2080 and
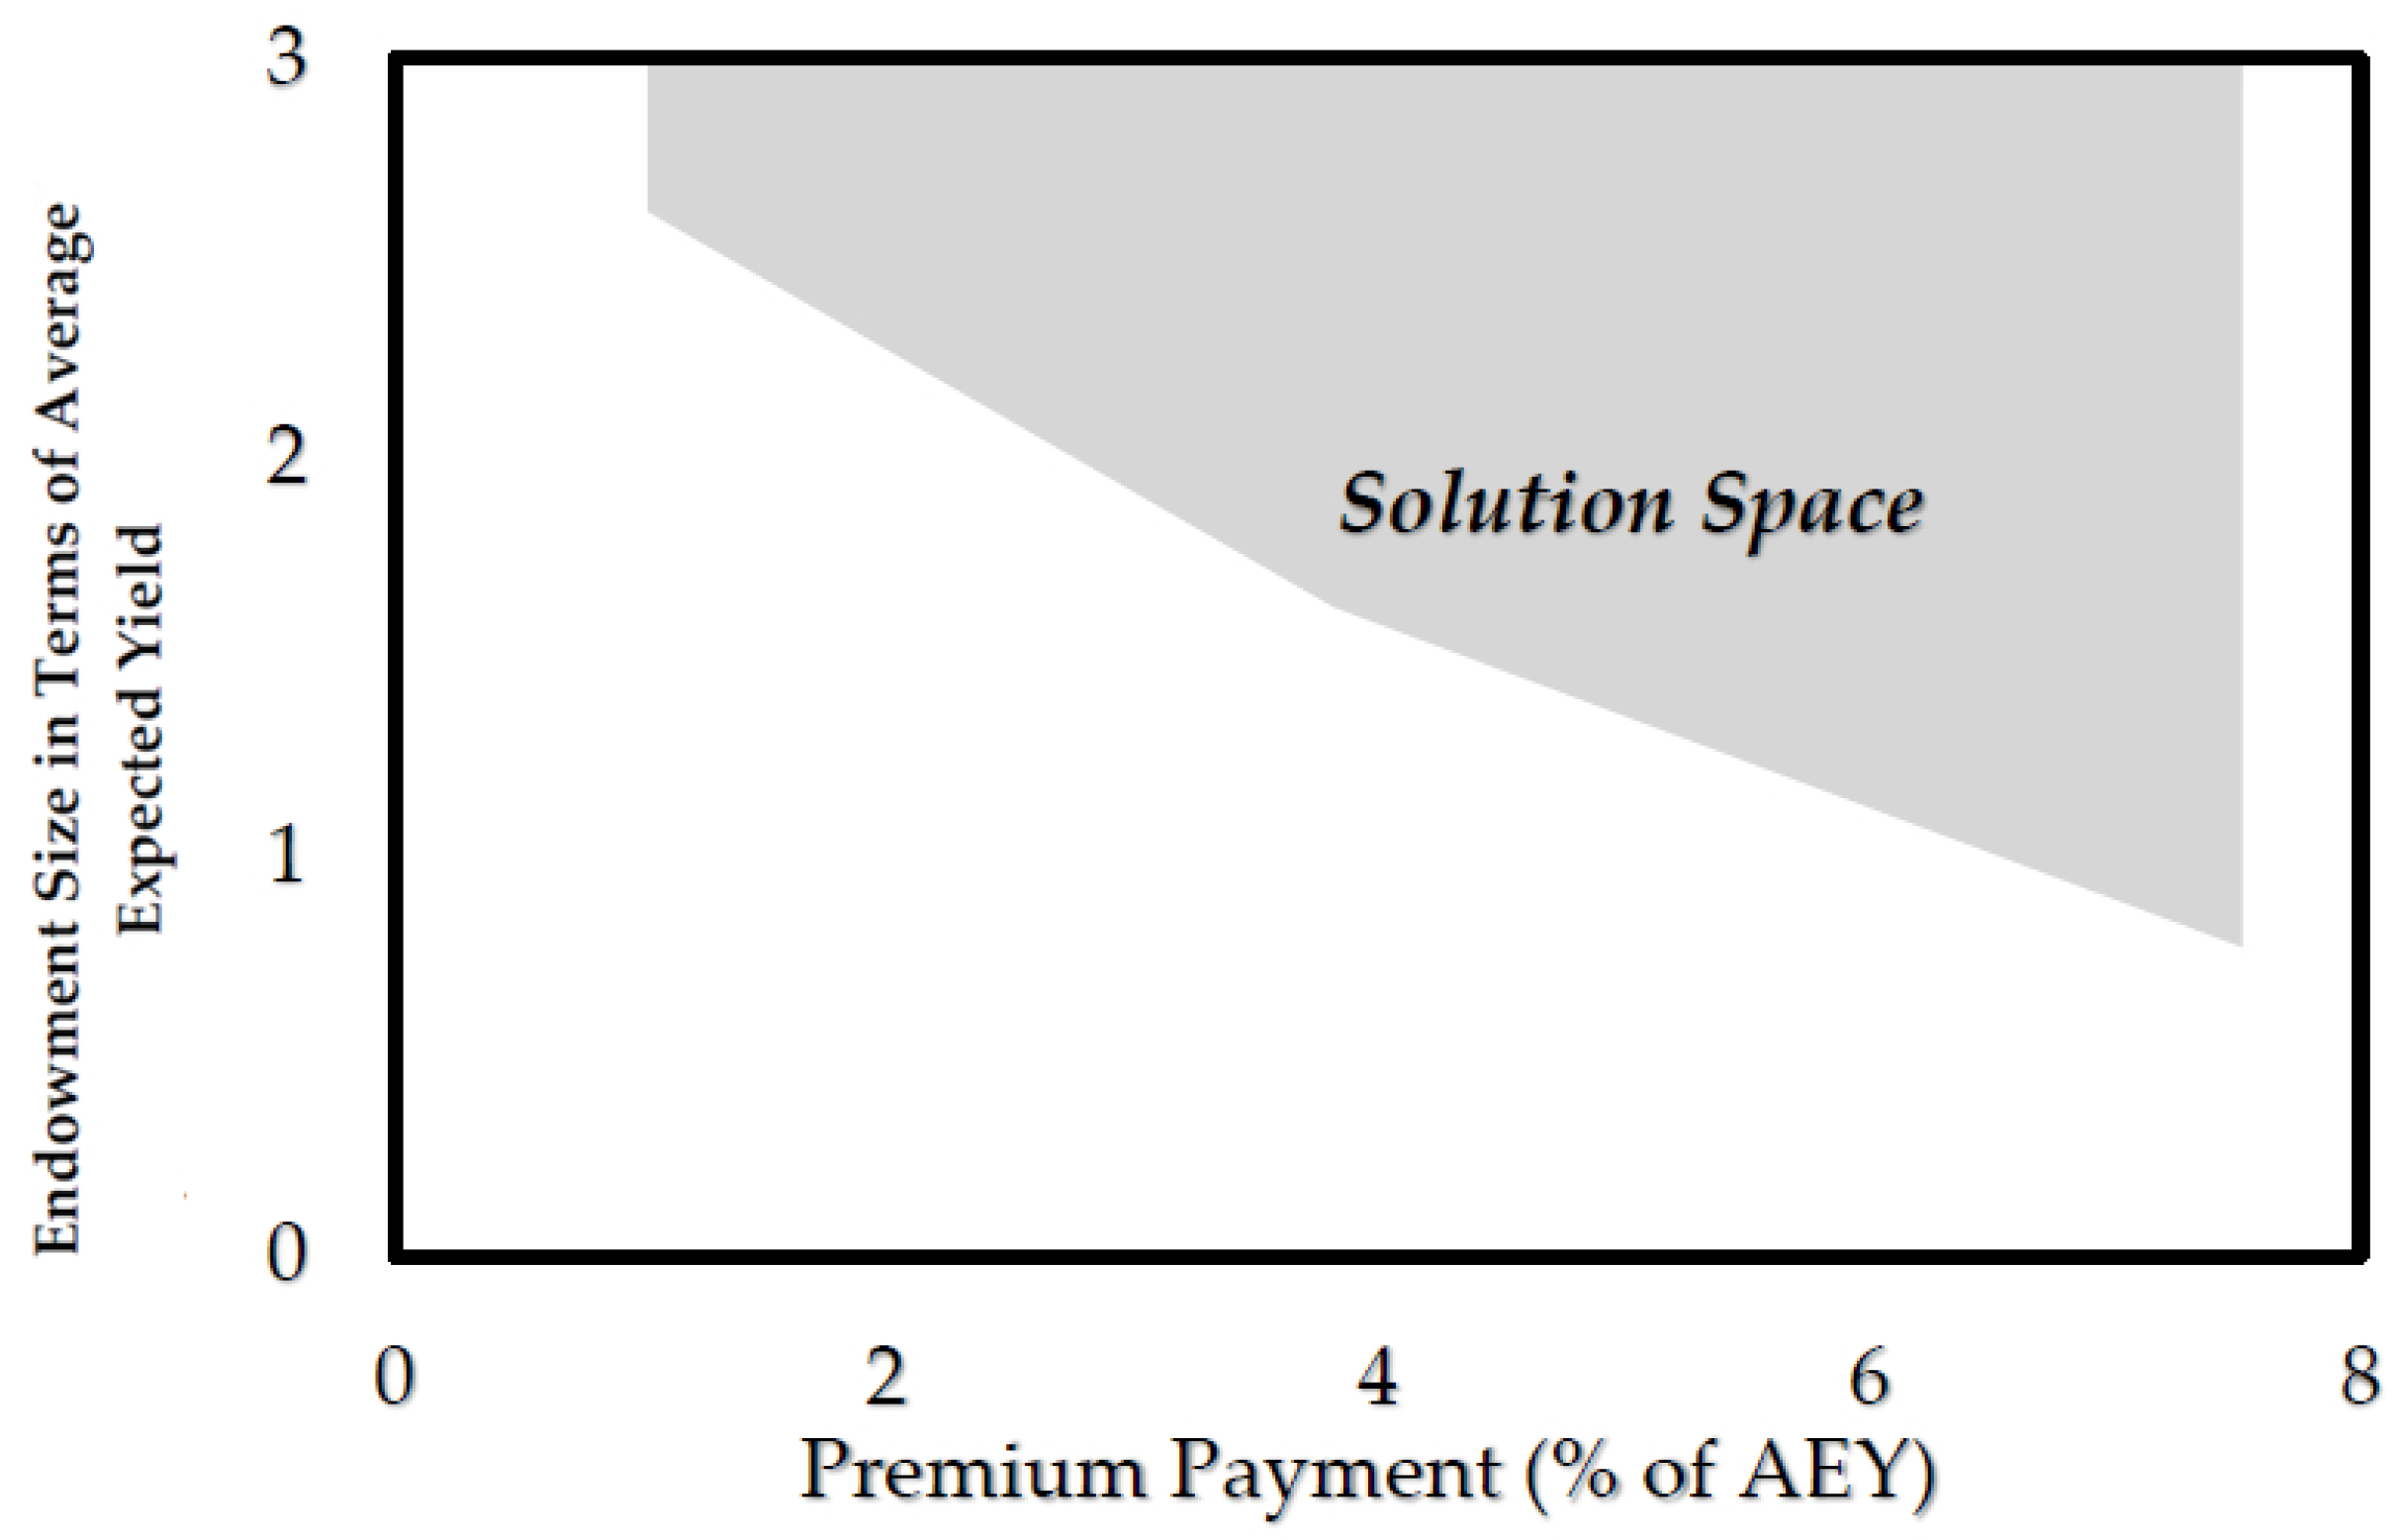
$1040 USD per ha, respectively, would be required for the JFM product’s initial endowment. This analysis is subsequently carried out for premiums ranging from 1% to 7.5% (
Figure 6).
Under the conditions for 1977–2014, the product never erroneously pays out, never goes bankrupt (although does reach zero at some point by design), and never pays more than what is lost. Ten different events trigger payouts for JFM losses in the evaluated period. By minimizing the initial endowment needed, a 1977–2014 hindcast reveals that products reach 2014 with only a fraction of what they possessed in 1977 (in the case of the JFM 3% premium, for example, the ending endowment fund is barely positive at 0.09 AEY).
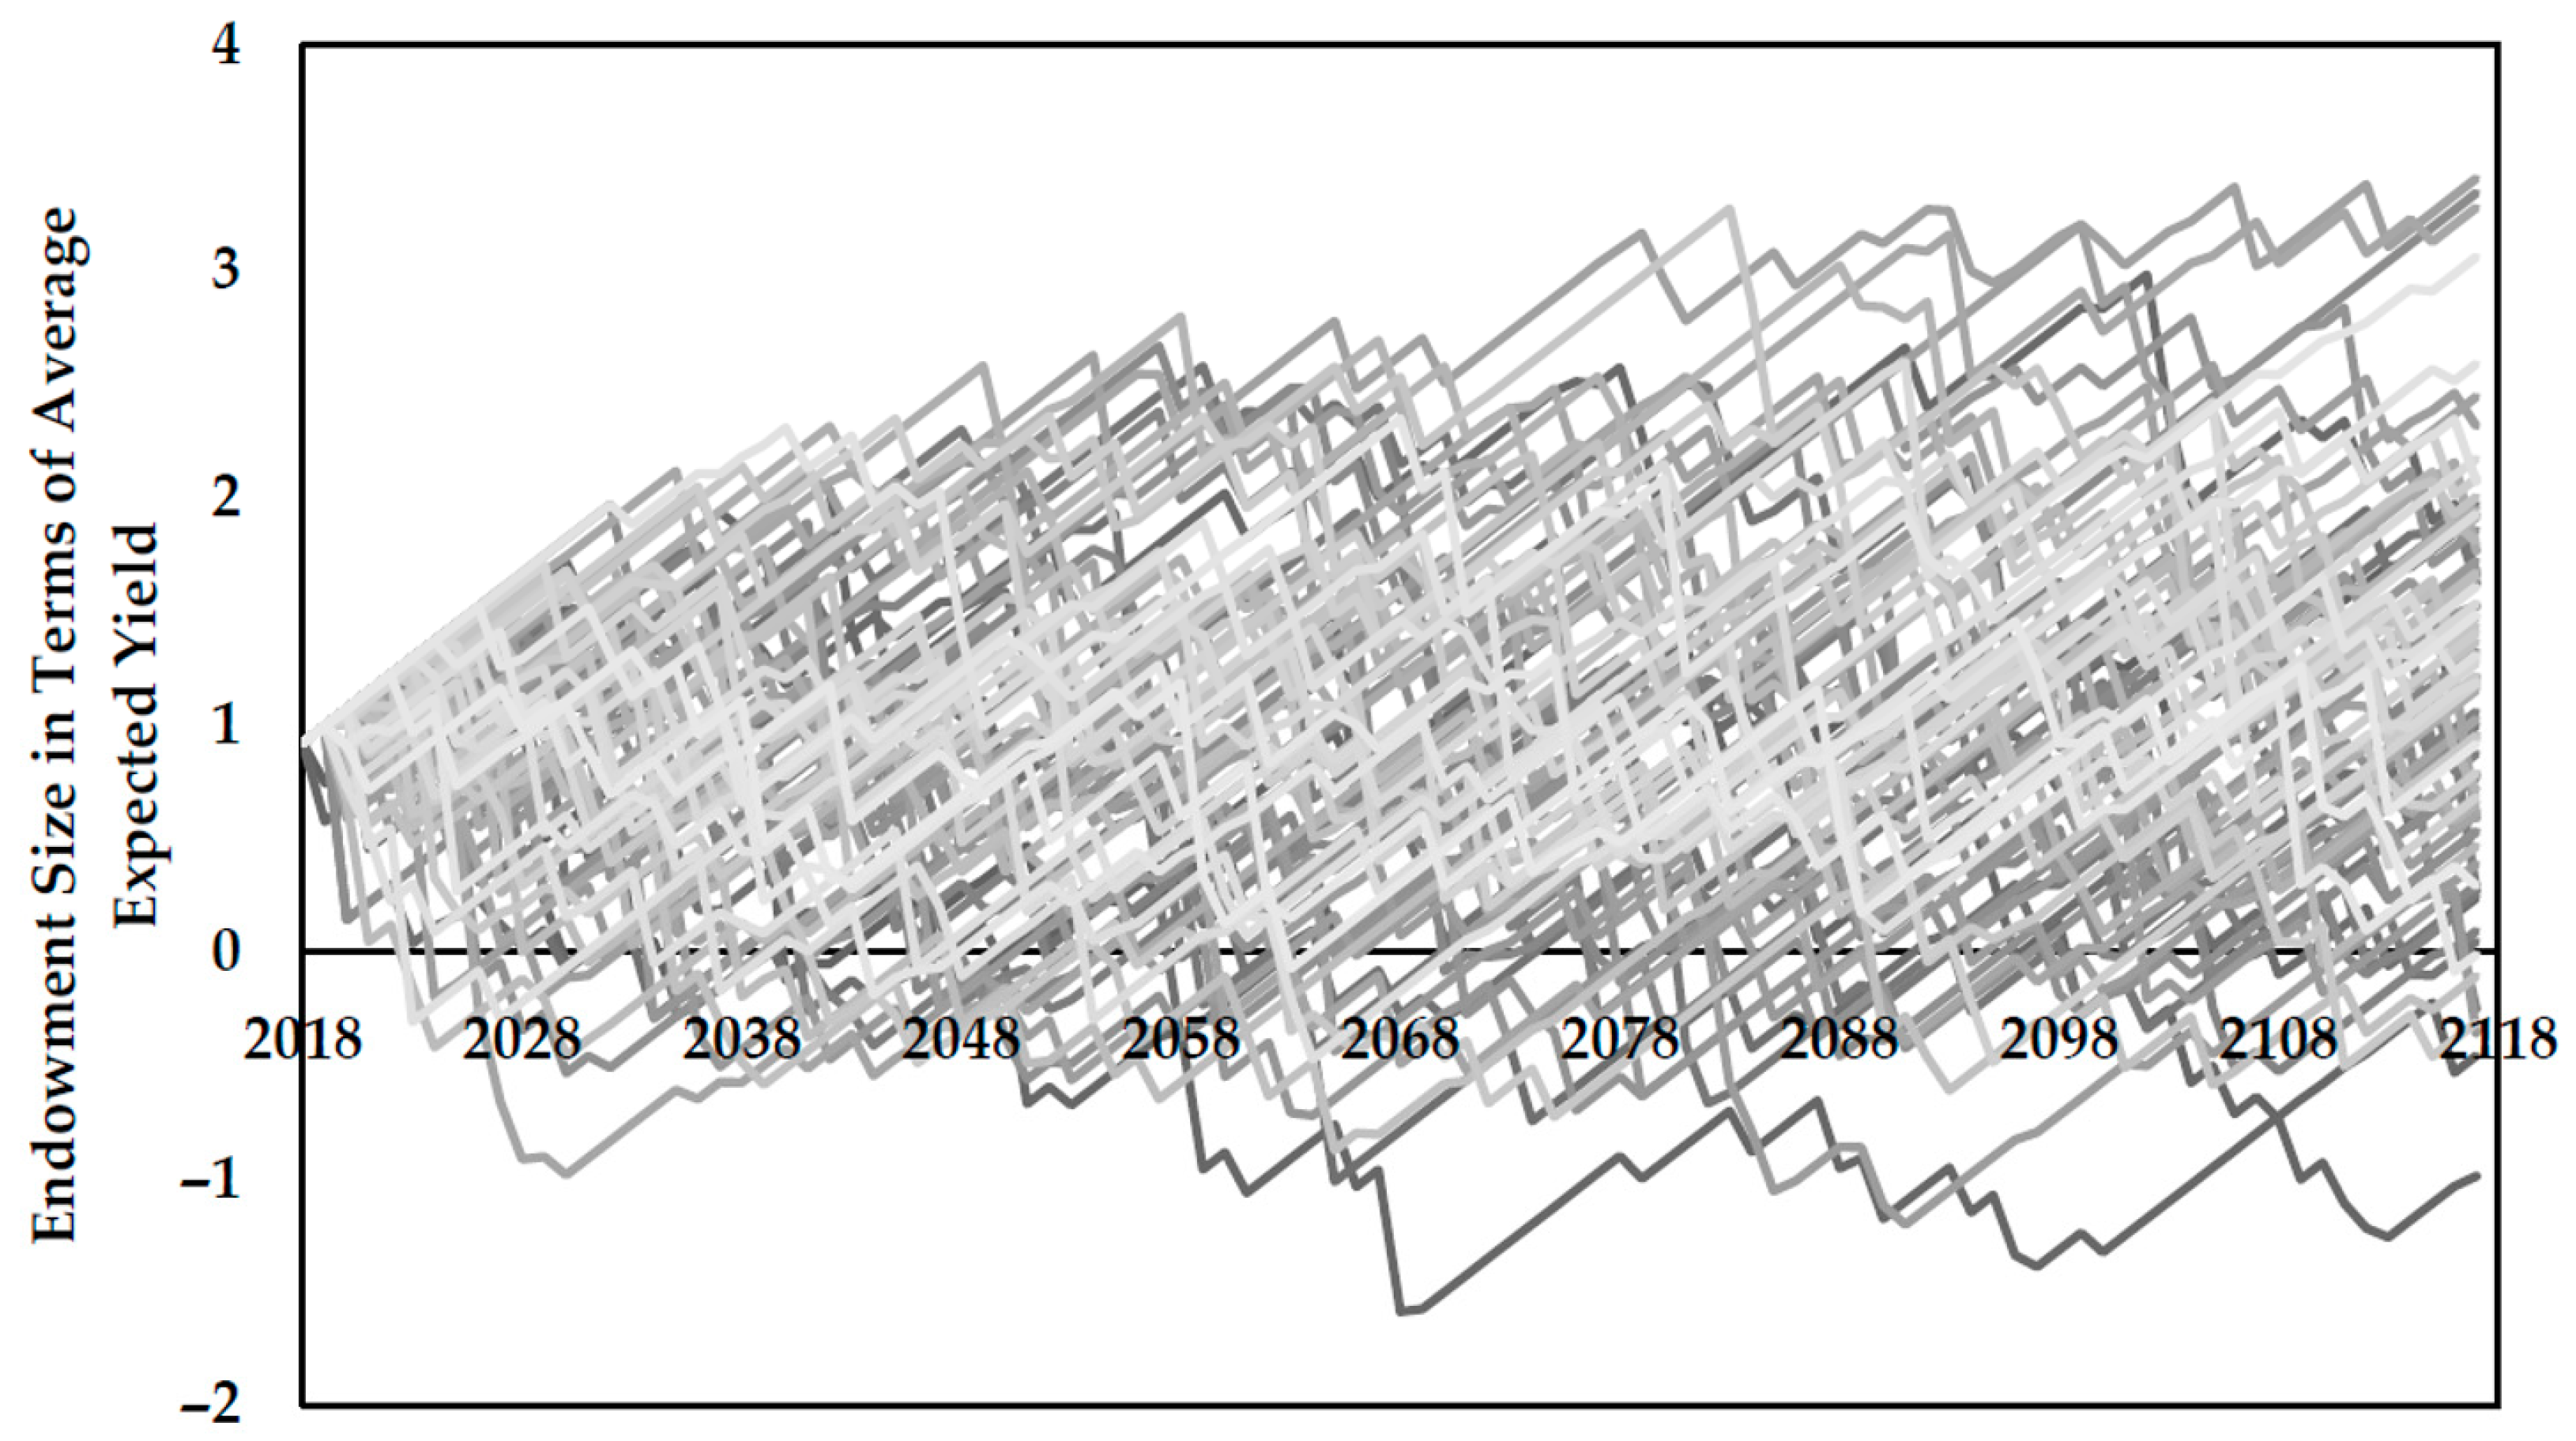
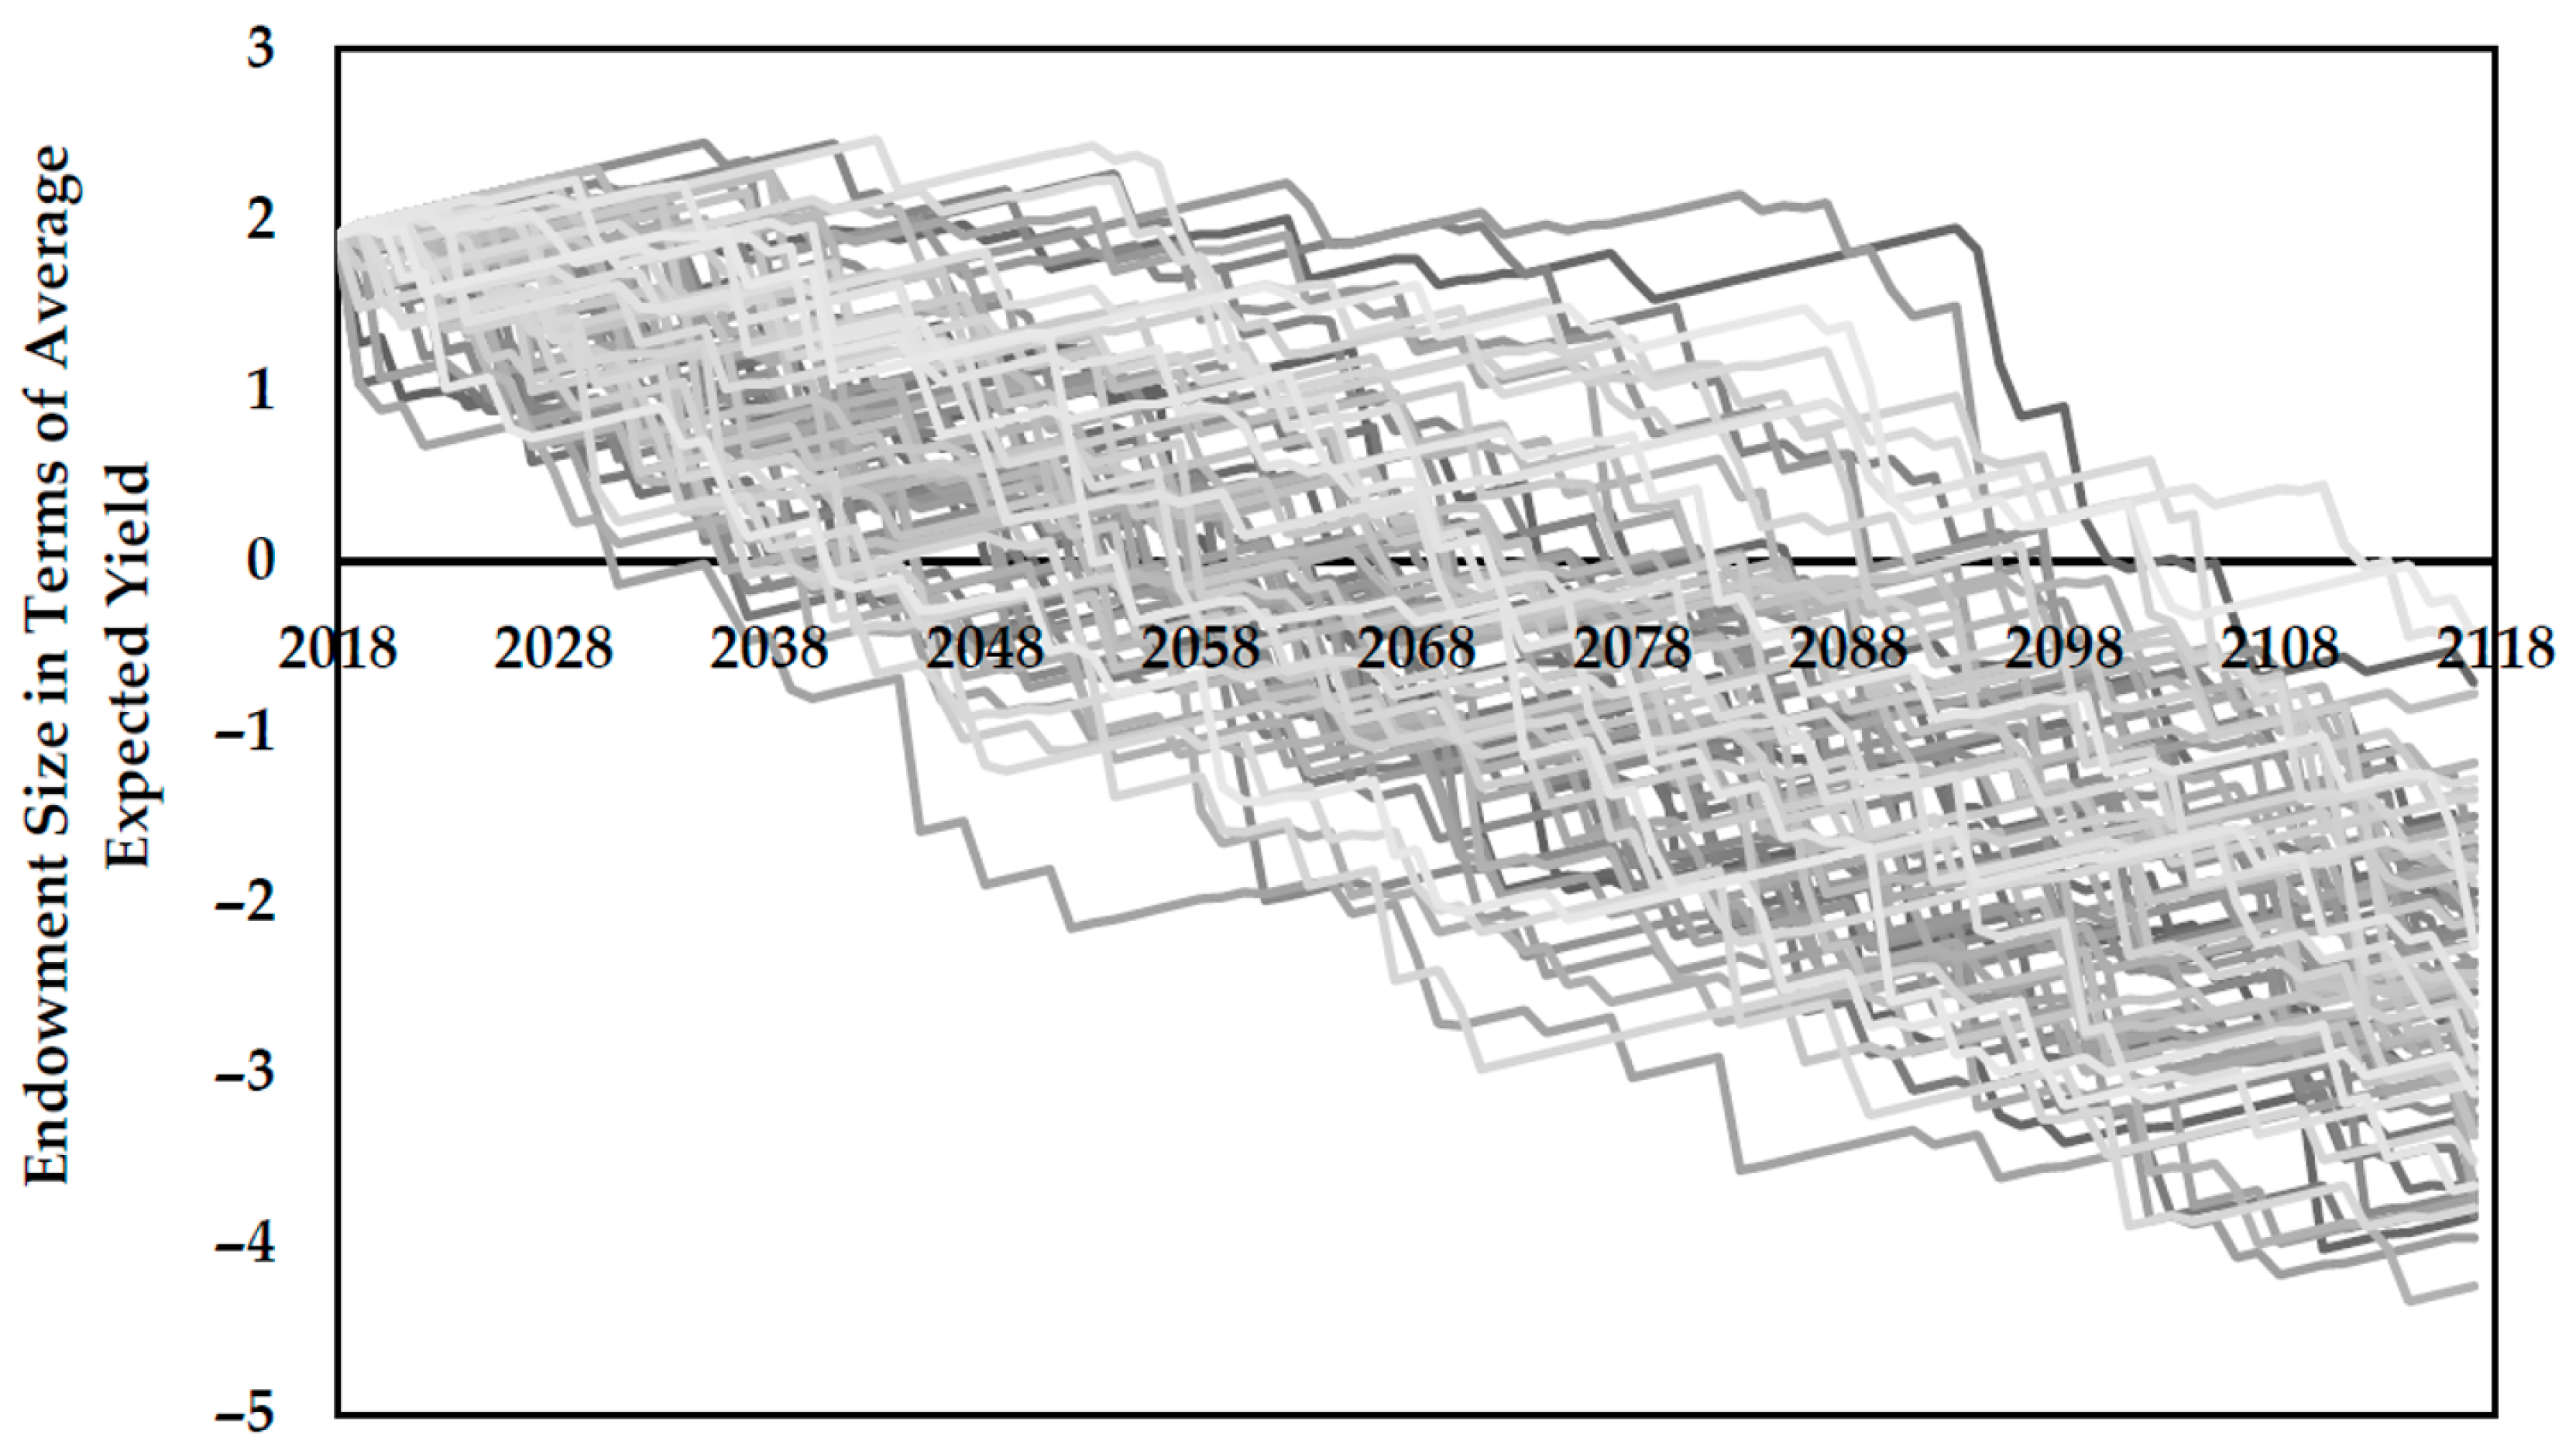
To understand the long-term viability of this product, the analysis may be extended to partially account for longer periods and certain sequencing of years not observed from 1977 to 2014 by running 100 stochastic simulations of 100 years each for the 7% premium (
Figure 7) and 3% premium (
Figure 8) products. The initial endowment sizes determined from the historical hindcast (7% = 0.9 AEY and 3% = 1.8 AEY) are used. Stationary conditions are assumed.
The JFM 7% premium product has an average end of life endowment of 1.19 AEY, 30-year and end of life bankruptcy rates of 14% and 9%, respectively, and a lifetime bankruptcy rate of 49%. The JFM 3% premium product has an average end of life endowment of −2.48 AEY, 30-year and end of life bankruptcy rates of 12% and 100%, respectively, and a lifetime bankruptcy rate of 100%. For both premium products evaluated here, the range between maximum and minimum ending endowments is approximately 4.5 AEY.
Hindcasted products with the Niño 3.4 index conditioned on a three-month window prior to concurrent conditions are quite similar, largely attributable to the persistent nature of ENSO. For example, using an OND Niño 3.4 index, the initial endowment values for the 7% and 3% premium products increase to 1.9 AEY and 3.27 AEY, respectively. The same ten events are covered by the OND product as by the JFM product; however, three additional years are covered by the product. In other words, the Niño 3.4 conditions in OND in those three instances surpassed the threshold, but waned by JFM and fell below the trigger threshold (
Table 1). Additionally, predictions of JFM Niño 3.4 conditions from prior seasons (developed using simple linear regression) are evaluated for the period of record for oca (
Table 2).
The third and fourth columns of the tables represent the two types of basis risk that are possible in this product. In general, as the lead time is increased, the number of false coverage events remains relatively constant; however, the JAS and JJA windows produce time series in which certain years experience losses, but are not covered by the product (four in the observation-based product, three in the prediction-based). The implications of this type of basis risk are critical—in these years of loss, farmers do not receive payouts from the product because the trigger threshold is not surpassed.
4. Discussion
While the concurrent 7% and 3% premium products both appear equivalently viable for certain time scales, such as 30 years, it is clear that long-term aptitude of the 7% product to avoid bankruptcy is much stronger than that of the 3% product. That is not to say that lower premium products are inferior to those with higher premiums. Although a product with a higher premium clearly requires less initial funds from the administering party, the premiums may prove to be too cost-prohibitive for farmers and defeat the purpose of the product. A viable insurance product must meet the goals of both the product administrator and policyholder. In general, though, this product provides notable protection from loss events. Without the product, the coefficient of variation for oca yields is 37%. With the product, the coefficient is reduced to only 27%. In strong El Niño years that trigger coverage (viz., 1983, 1992, and 1998), losses are reduced from over 60% of average expected yield to only 40% of average expected yield
In cases of self-insurance, it is foreseeable that the preferred product would have as small of an initial endowment as possible, which may lead to higher premiums to substantially supplement the endowment, effectively pricing out certain participants. This is especially relevant for small-scale subsistence farmers in impoverished areas of the remote Altiplano. Conversely, while a low premium may allow for a greater segment of producers to participate in the insurance program, a larger initial endowment amount would be required on the part of the government. Even then, these relatively smaller supplements to the endowment may be unable to prevent the ultimate bankruptcy of the fund over the long-term.
The government of Peru has allocated funds to a contingency fund for farmers in the immediate aftermath of recent drought events. While these funds serve as a version of a welfare program, the costs required to distribute such resources without prior planning could prove exorbitantly expensive. To reduce the unforeseen high welfare costs of the current paradigm, the developed index-based insurance framework could be used as a planning tool by the government to build emergency response funds over longer periods of time. With regard to cost, it may be advantageous to draw additional funds from other governmental resources, seek private investments, or use a third-party insurer. These additional funds could serve as a supplement to bolster the initial endowment size, allowing farmers to pay lower premiums, or periodically injected to maintain solvency. Alternatively, the funds could be used to subsidize premiums to encourage farmer participation. Farmers could then pay an additional premium if they desired expanded coverage. Both approaches result in lower contributions by farmers and expand the solution space in which the product might exist.
It is noteworthy that a product conditioned on predicted JFM Niño 3.4 conditions (as opposed to observed JFM conditions) still maintains relatively similar performance for several months prior. For southern Peru oca, a product using predicted JFM conditions based on ASO observations performs similarly to a product conditioned on JFM observations such that farmers receive similar payouts and uncovered loss events are similar in size and frequency. If a product were to payout on November 1, as opposed to April 1, this could allow additional time to proactively manage a crop or at least prepare for reduced yields.
To compare the performance of products conditioned on observed Niño 3.4 and predicted JFM Niño 3.4 conditions, ratios of covered losses and erroneous coverage are computed and presented in
Table 3. For covered losses, the products may be considered equal in utility (i.e., providing equal coverage) if the ratio between the two products is 1. If the ratio is greater than 1, the observed product provides favorable utility, and vice versa. The opposite is true for erroneous coverage ratios.
While a product based on observational Niño 3.4 data has more utility regarding amount of coverage provided during loss events than the predicted JFM Niño 3.4 product, it also provides more coverage erroneously. Depending on the preference of the product administrator, be it to increase total coverage provided or minimize basis risk, either product could potentially be deemed sufficient and preferred.
The time at which farmers must decide whether or not to participate in an index-based insurance program in any given year is also an important consideration. A scheme could be established such that farmers deciding to purchase insurance late or after a forecast is available may be required to pay a higher premium to receive the same level of coverage, thus further addressing adverse selection.
While this product shows potential for oca farmers in Puno broadly, regional production of oca are expectedly heterogeneously distributed throughout. This may elicit further tailoring of products to local scales. Of high relevance is the social structure under which some of these communities, especially indigenous, operate. Depending on the community, it may be necessary to provide coverage to the entire community as opposed to individual participants. In the event of a covered event, the community—and not the individual farmer—would receive the payout and then be responsible for distributing funds to those affected.
5. Conclusions
In general, index-based insurance presents a unique alternative to traditional insurance products, especially in southern Peru, where administrative capacity is low, credit is limited, and relief to past disaster has been delayed. Index-based insurance could play a large role in increasing the resilience of communities. Because of its ability to reduce adverse selection and minimize moral hazard, index-based insurance has had success in other regions of Peru and around the world. In this case, with an enabling policy environment and a relatively rich dataset, development of a product is a tangible reality.
The product we present in this work is developed and evaluated specifically for oca production in a sub-departmental extent of Puno and conditioned on yield data from 1977 to 2014. While the general methodology presented here may be applied to other sectors, regions, etc., the final product itself is highly specified and nontransferable. The operative assumption used in developing this framework finds basis in the statistical relationships between this crop, precipitation, and ENSO. Further, it may be that ENSO and other climate phenomena are directly correlated with price mechanisms of the crop (not explored here). Not surprisingly, these relationships are crop dependent and vary across different physical characteristics. Therefore, it is imperative that any index-based insurance product is as finely tailored as possible to the given circumstance.
Additional research opportunities include developing a multi-index-based product as well as a pilot study to gauge effectiveness and uptake.
The ENSO index-based insurance product developed here effectively reduces losses during major El Niño events; however, drought-related losses during neutral years or La Niña events presently go largely unprotected. These droughts may be the result of other global or regional climate forcings. To further reduce this basis risk, another index, such as a large-scale climate index, an observational time series, or a remotely-sensed index (e.g., Normalized Difference Vegetation Index), could be paired with Niño 3.4 to form a multi-index-based insurance product that may better capture expected extreme conditions resulting from a variety of climate drivers. Such multi-index products may be advantageous to single index products if they are able to appropriately cover more years with extreme conditions (drought in the case presented here). Ideally, the indices used in this multi-index framework should be readily accessible and consumable.
A pilot study, or a small-scale trial of the product, could be conducted to understand the nuances of offering such products, rates of uptake, and overall effectiveness in reducing vulnerability to precipitation variability. Several technical guides (e.g., Dick and Stoppa, 2011 [
13]) provide guidance on conducting pilot studies and methods for scaling-up results to create an effective product for a larger market. Additional factors to consider include product evaluation, effective communication, and community engagement, necessitating a significant on-ground presence and solid relationships between participants and those offering the product. Other topics to be explored in the pilot study may include determining farmers’ willingness to participate in such a product, conditioned on individual risk preferences. Willingness to participate could be modeled using a number of tools, such as a risk averse utility function, to provide decision makers more detailed information regarding participant preferences.
As illustrated by this work, maintaining a self-insured, self-sufficient insurance product is nontrivial. An insurance product that a farmer needs but is unable to pay for is a poorly designed product. Perhaps with modification, as outlined previously, it may be possible for this product to be improved in a way such that a sustainable and affordable insurance product indeed can be achieved. Moreover, the utility provided by such products may be enhanced by increasing the lead time at which resources are distributed. As drought continues to deleteriously impact water supply and access in southern Peru, index-based insurance may become more instrumental in facilitating proactive drought response in this semi-arid region of the world.


