Article

Combining Spherical-Cap and Taylor Bubble Fluid Dynamics with Plume Measurements to Characterize Basaltic Degassing

by
Tom D. Pering
1,* and
Andrew J. S. McGonigle
1,2,3
1
Department of Geography, University of Sheffield, Winter Street, Sheffield S10 2TN, UK
2
Istituto Nazionale di Geofisica e Vulcanologia, Sezione di Palermo, Via Ugo La Malfa, 90146 Palermo, Italy
3
School of Geosciences, The University of Sydney, Sydney, NSW 2006, Australia
*
Author to whom correspondence should be addressed.
Geosciences 2018, 8(2), 42; https://doi.org/10.3390/geosciences8020042
Submission received: 11 October 2017 / Revised: 21 January 2018 / Accepted: 22 January 2018 / Published: 26 January 2018

Abstract

:
Basaltic activity is the most common class of volcanism on Earth, characterized by magmas of sufficiently low viscosities such that bubbles can move independently of the melt. Following exsolution, spherical bubbles can then expand and/or coalesce to generate larger bubbles of spherical-cap or Taylor bubble (slug) morphologies. Puffing and strombolian explosive activity are driven by the bursting of these larger bubbles at the surface. Here, we present the first combined model classification of spherical-cap and Taylor bubble driven puffing and strombolian activity modes on volcanoes. Furthermore, we incorporate the possibility that neighboring bubbles might coalesce, leading to elevated strombolian explosivity. The model categorizes the behavior in terms of the temporal separation between the arrival of successive bubbles at the surface and bubble gas volume or length, with the output presented on visually-intuitive two-dimensional plots. The categorized behavior is grouped into the following regimes: puffing from (a) cap bubbles; and (b) non-overpressurized Taylor bubbles; and (c) Taylor bubble driven strombolian explosions. Each of these regimes is further subdivided into scenarios whereby inter-bubble interaction does/does not occur. The model performance is corroborated using field data from Stromboli (Aeolian Islands, Italy), Etna (Sicily, Italy), and Yasur (Vanuatu), representing one of the very first studies, focused on combining high temporal resolution degassing data with fluid dynamics as a means of deepening our understanding of the processes which drive basaltic volcanism.

1. Introduction

Basaltic volcanism is characterized by magmas of low viscosity, ranging from 101–104 Pa·s [1], which enable the free flow of gas bubbles within the melt, in contrast to the behavior of more viscous silicic systems [2]. In basaltic magmas spherical bubbles are generated following exsolution of gas from the melt [3]. These bubbles grow via diffusion, decompression-based expansion, or coalesce to form non-spherical bubbles, e.g., of spherical-cap morphology [4,5,6], which can transition into Taylor bubbles (also called gas slugs), which nearly span the conduit width, and are of a length greater than, or equal to, the conduit diameter (see Figure 1 for further details on the morphological characteristics of spherical-cap and Taylor bubbles) [4,7,8]. These distinct bubble morphologies give rise to a variety of potential classes of surface degassing activity, specifically, passive degassing of spherical bubbles [2]; puffing, from bursting of non-spherical bubbles or non-over-pressurized Taylor bubbles [9,10,11]; and explosions from over-pressurized Taylor bubbles [12,13,14]. The latter scenario is associated with strombolian volcanism, as manifested on the eponymous Stromboli volcano, e.g., [9,15], where the activity has been well characterized through measurements of the erupted gas masses, e.g., [11,16,17,18], and studies into the explosive dynamics, e.g., [19,20,21].
A number of other targets worldwide also exhibit strombolian volcanism, e.g., Yasur [22], Villarica [23], Etna [24], and Pacaya [25]. Similarly, puffing activity on volcanoes has been well studied using video, thermal imagery, and gas measurement approaches, particularly on Stromboli, e.g., [10,11,26,27].
Hitherto, considerable attention has been devoted to the fluid dynamics of discrete aspects of slug flow in volcanoes, via mathematical, numerical, and laboratory modelling approaches. In particular, James et al. [13] investigated the evolution of Taylor bubble pressure and length during the ascent process. Furthermore, James et al. [28] developed a criterion to quantify the transition between puffing and explosive bursting, and Del Bello et al. [14] developed a static-pressure model for bursting Taylor bubbles. However, to date, there has been very little consideration of the fluid dynamics of spherical-cap bubbles in a volcanic scenario, bar the work of Bouche et al. [29]. Spherical-cap bubbles can be considered a transitionary morphology with characteristic shape (see Figure 1), prior to the formation of Taylor bubbles. These bubbles are characterized by a quasi-hemispherical nose and horizontal base and, unlike slugs, have lengths less than, or equal to, the conduit width, and have yet to develop a full falling film, as is the case with Taylor bubbles. There has also been very little attention devoted to resolving the implications of inter-bubble interactions within these volcanic bubble flow regimes. Recently, we have highlighted the importance of coalescence between multiple rising Taylor bubbles, in modulating the timing and intensity of high temporal resolution strombolian explosions, based on field observations on Mt. Etna [24], and laboratory experiments [30]; the potential importance of this phenomenon has also been highlighted by Gaudin et al. [26,27].
Here we present, for the first time, a combined model description of the fluid dynamics of puffing and strombolian volcanism driven by spherical-cap and Taylor bubbles. This has been achieved by: (a) bringing together prior model treatments of individual aspects of Taylor bubble flow from the volcanic and fluid dynamics literature; (b) considering, for the first time, spherical-cap bubbles in a volcanic scenario; and (c) including the previously little-considered (with notable exceptions, including [31,32]) possibility that bubbles might interact with one another to coalesce and generate larger, e.g., more explosive, masses. The model is also compared against degassing field data from Stromboli [11,17,18], Etna [24], and Yasur [33] volcanoes. This is one of the very first attempts to study volcanic degassing dynamics using a combination of modelling and gas flux time series [18], expedited by the advent of ≈1 Hz time resolution UV imaging of volcanic SO2 fluxes, which enables the capture of rapid degassing phenomena in unprecedented detail [34,35,36]. This work is also one of only a few in recent years, focused on defining transitions between basaltic degassing modes, building on pioneering work performed in this area a number of decades ago, e.g., [37], that of Palma et al. [38] who identified the relationship between bubble bursting strength and the duration of the styles of basaltic volcanic activity relevant to this study, and the more recent work of Gaudin et al. [26], who categorized explosions based on bubble sizes and eruptive properties.

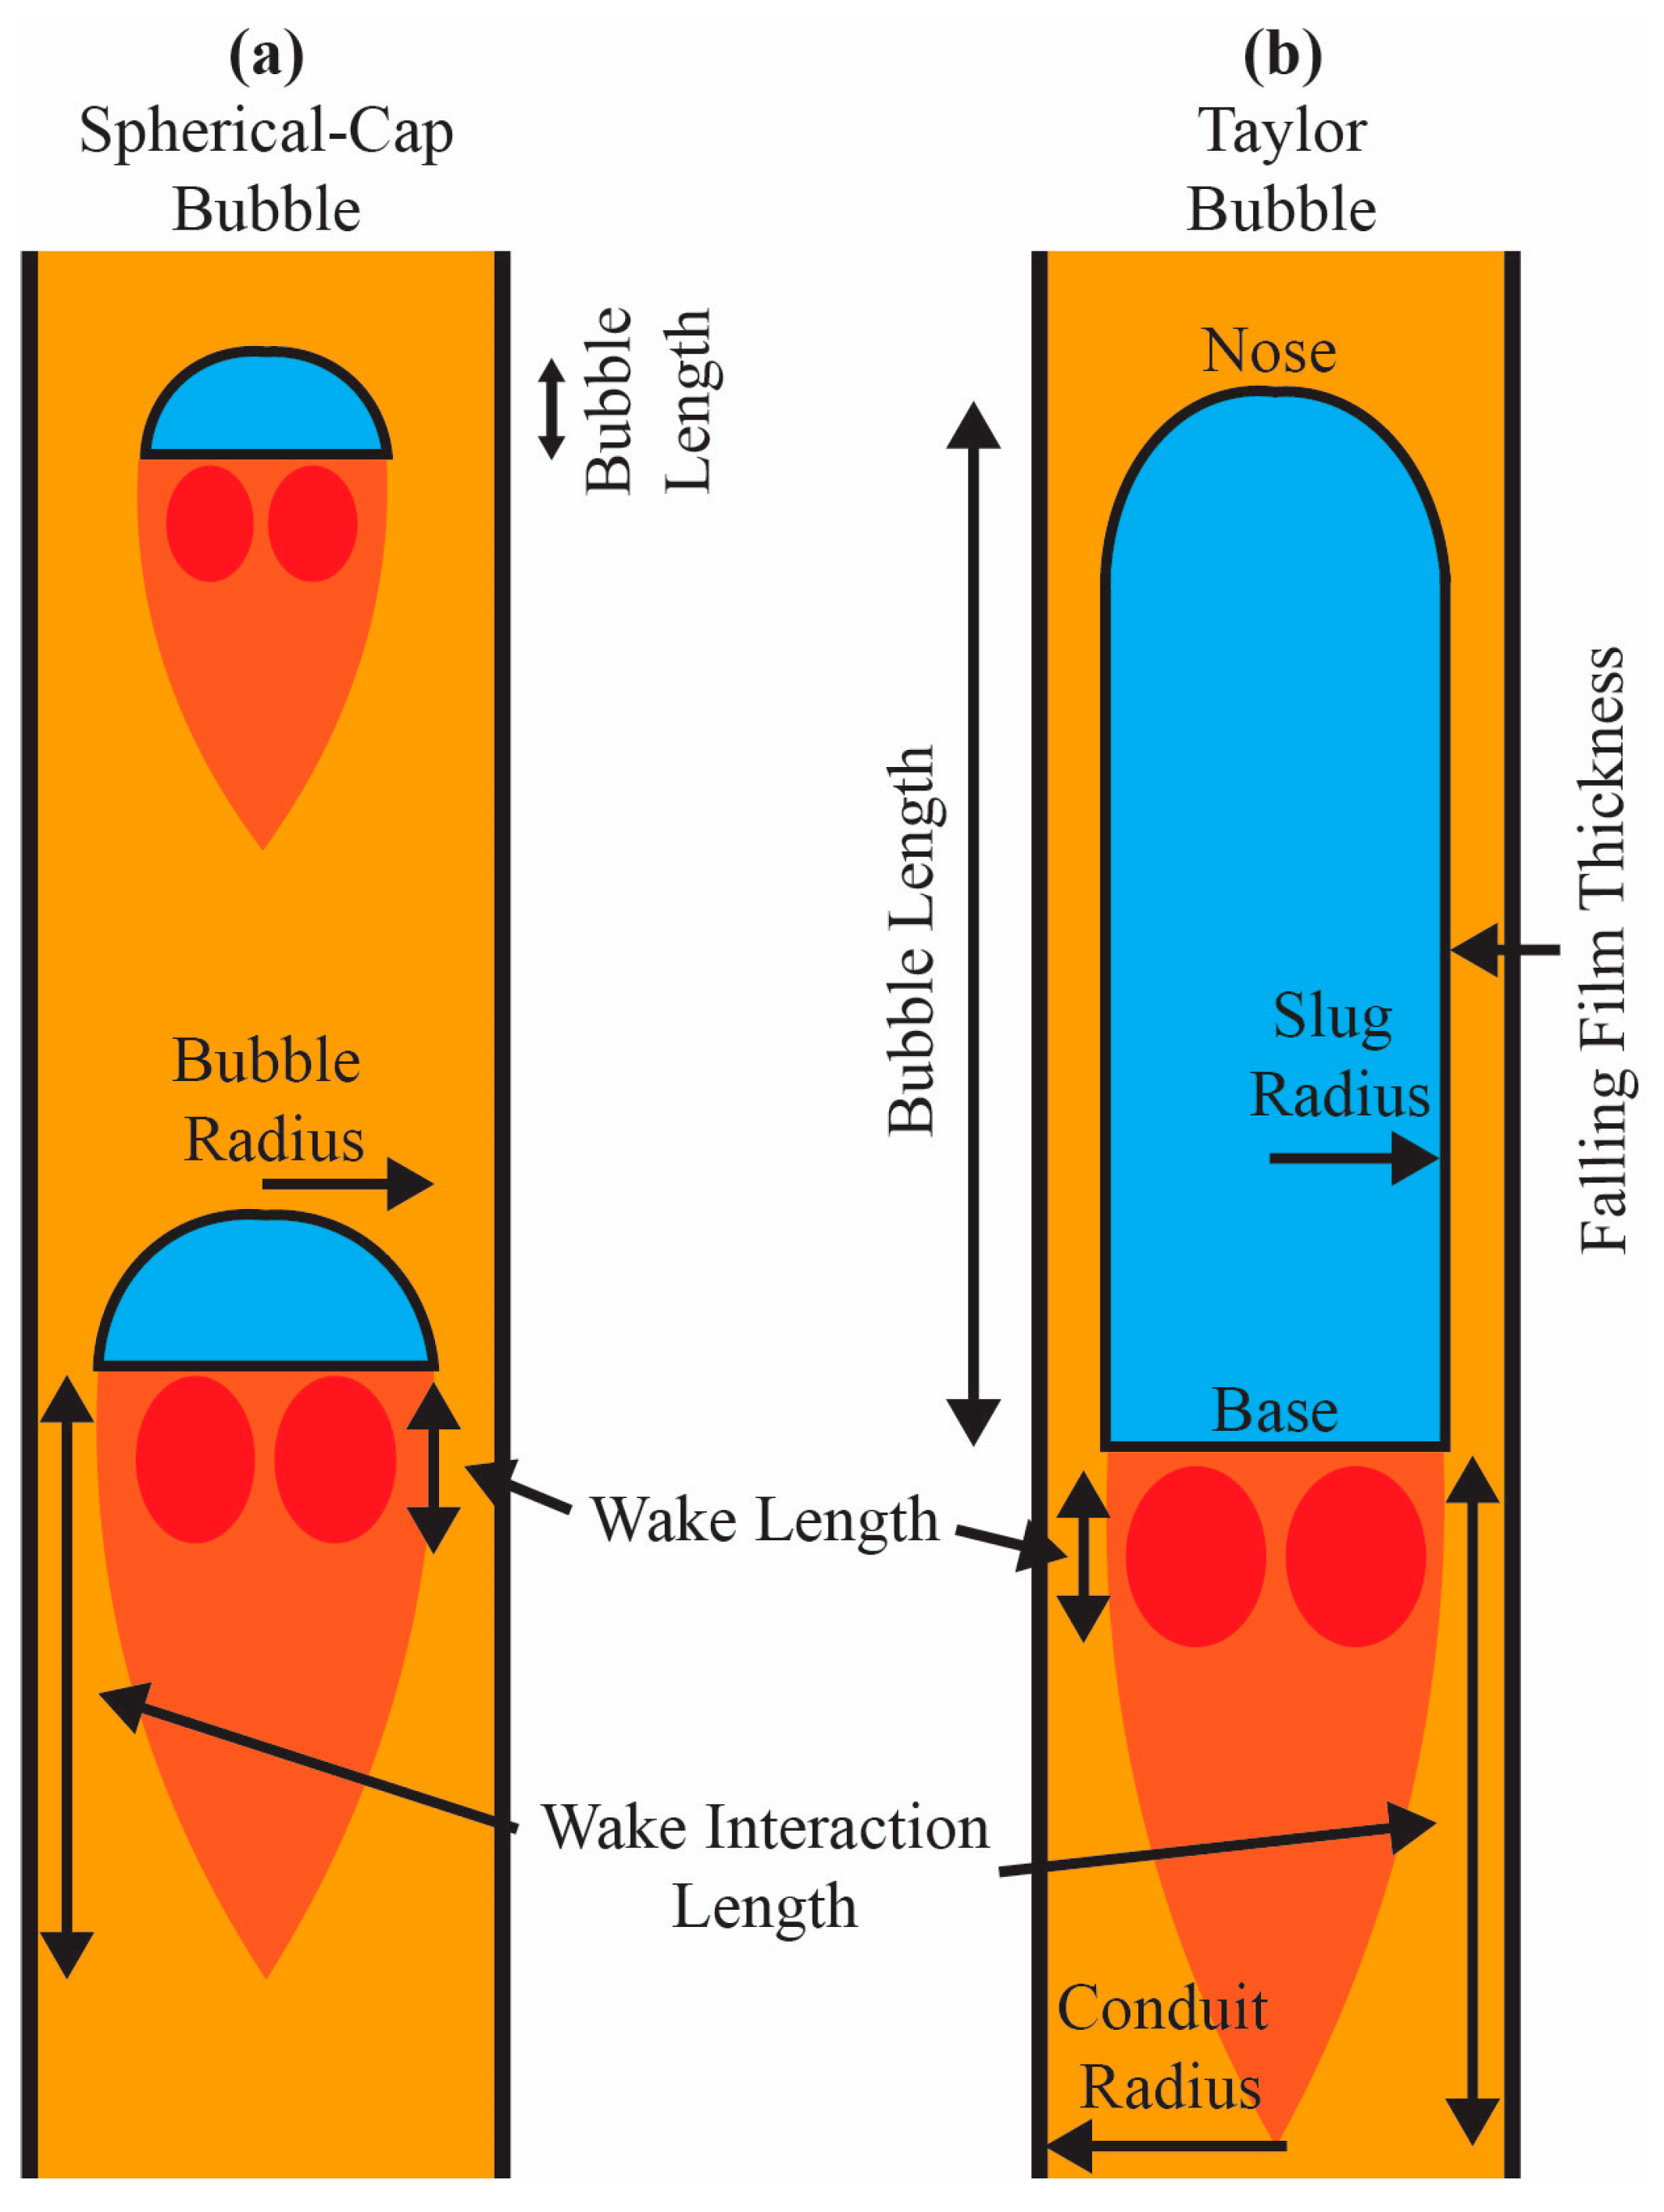
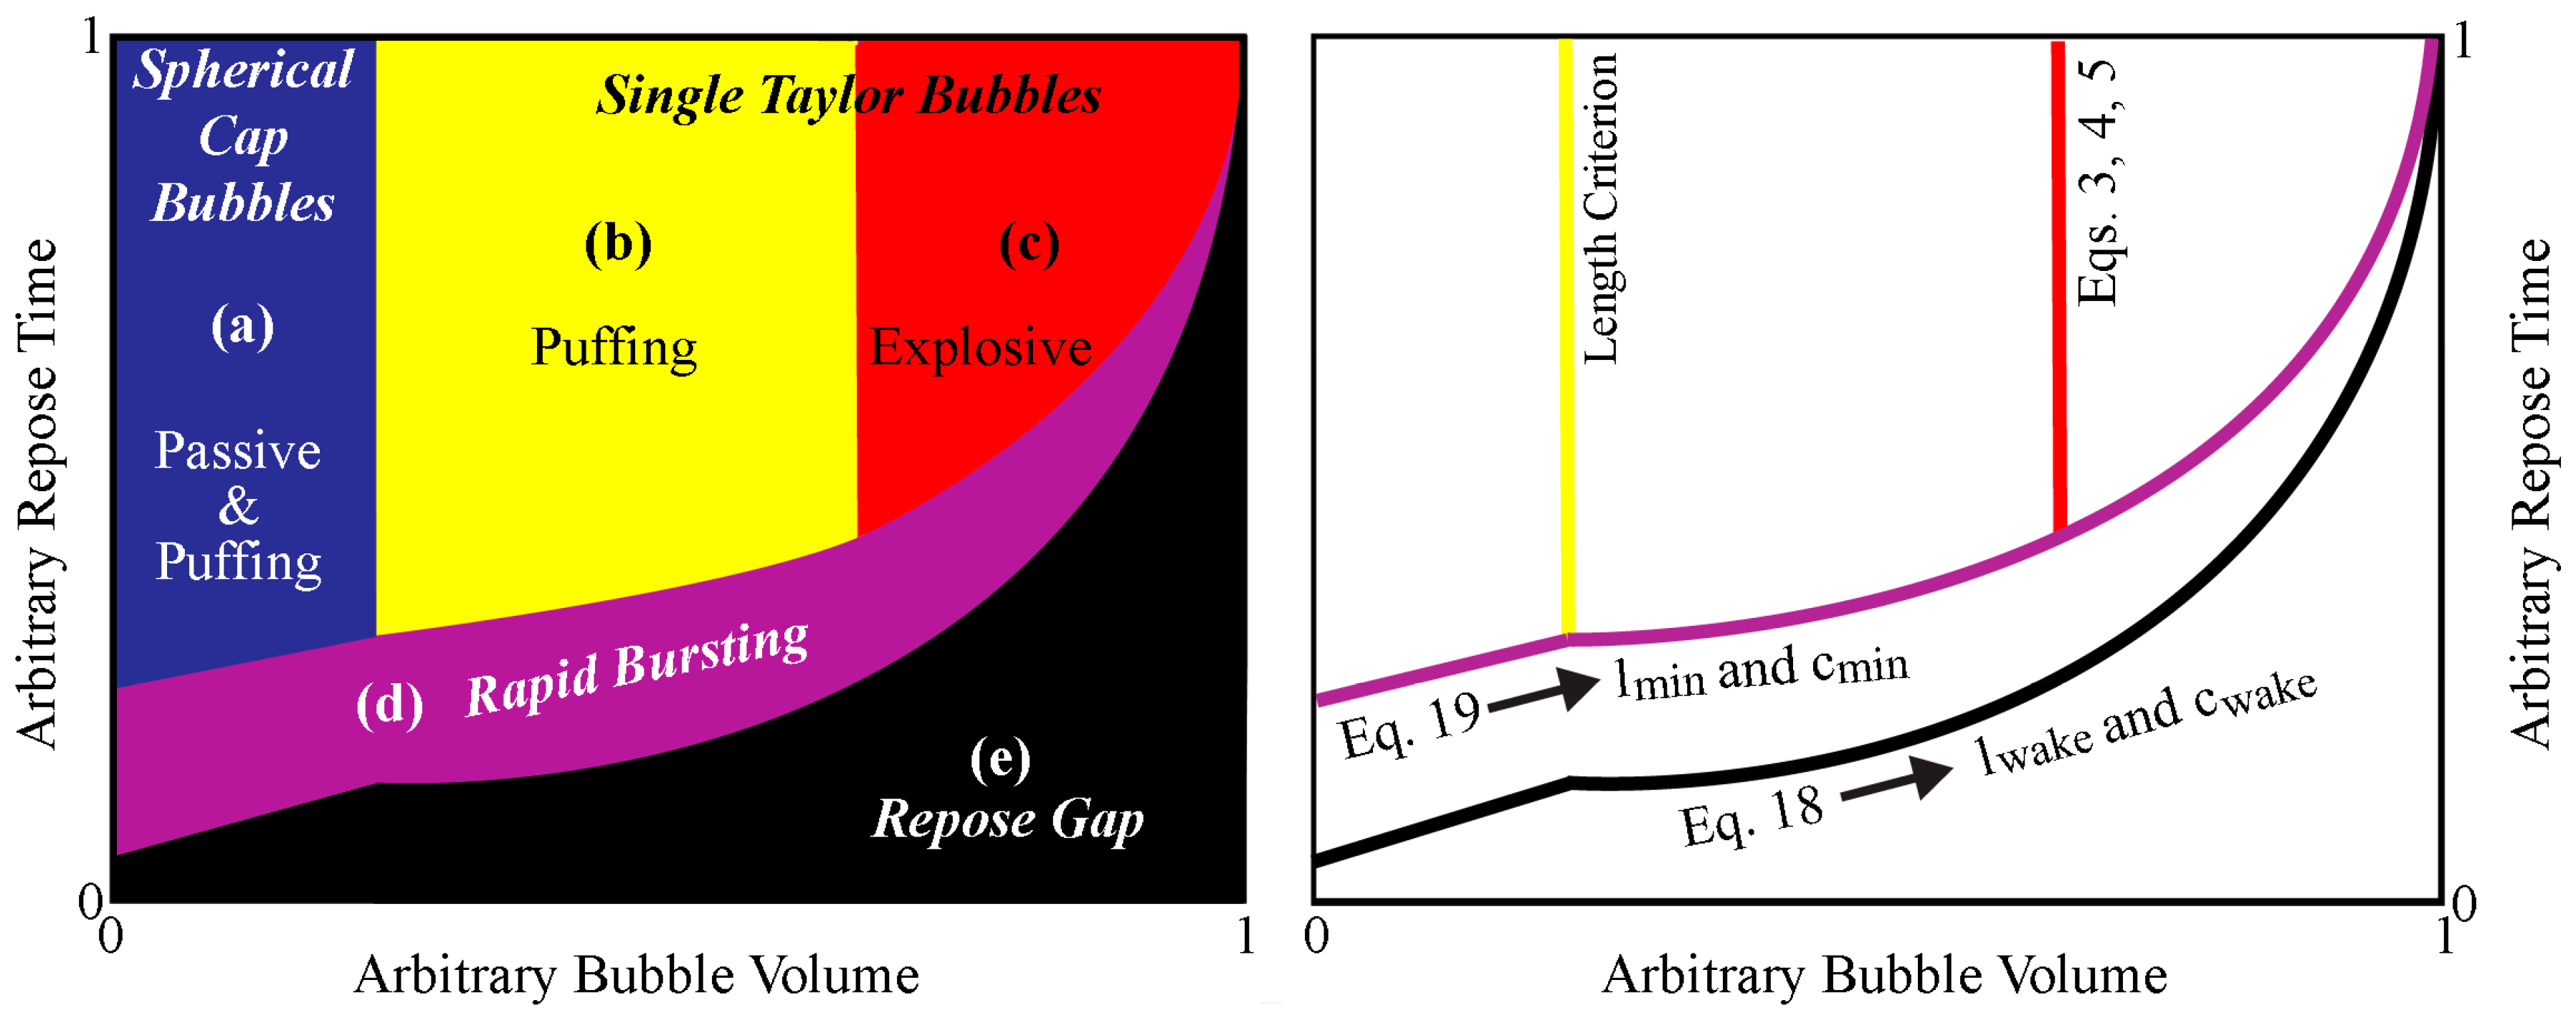
2. Modelling Transitions between Spherical, Non-Spherical and Taylor Bubble Flow Regimes

The model classifies strombolian and puffing degassing regimes as distinct areas on plots of inter-bubble burst spacing vs. bubble volume; this is illustrated schematically in Figure 2. In particular, the activity is categorized within the following classes: puffing from spherical-cap bubbles; and puffing from Taylor bubbles; and Taylor bubble-driven strombolian explosions. There is also a further subdivision of these classes into scenarios whereby the bubbles can/cannot interact with one another, i.e., “single” and “rapid” bursting regimes, and a region where bubble coalescence would inhibit the presence of independent bubbles. The model (available as an Excel spreadsheet) is contained within the supplementary material, with the underlying mathematics detailed below. In this section, transitions between bubble morphologies will be considered, i.e., the zonation with respect to bubble volume and length. In the following sections, the categorization in terms of inter-bubble spacing will be covered, specifically in terms of when inter-bubble interactions may occur.
Firstly, the degassing regimes are classified according to bubble volume (note that volume and length here are interchangeable using the formula for the volume of a cylinder, assuming a quasi-cylindrical geometry, and that data on bubble volume are often more readily acquirable than bubble lengths). Bubbles in basalts cease to act as spherical bubbles (e.g., following Stokes law) at low Reynolds numbers ( R e b ), <0.3 [39], such that:
R e b = ρ m u s b l μ
where ρ m is the melt density, μ the melt viscosity, l the bubble length, and u s b is the spherical bubble rise speed, from Stokes law:
u s b = 2 ( ρ m ρ g ) g ( l 2 ) 2 μ
where ρ g is the density of the gas phase and g gravitational acceleration. The l at which a bubble ceases to be spherical can, therefore, be defined, enabling demarcation of the length (i.e., bubble volume) at which non-spherical bubbles form in Figure 2. Any bubbles smaller than this size would lead to passive degassing and effusive activity, for example from lava flows [40,41,42].
The non-spherical bubble regime is dominated by spherical-cap and Taylor bubbles, particularly at targets such as Stromboli; therefore, our attention here will be focused on these bubble classes [5]. Spherical-cap bubbles burst passively at the magma surface or, as observed on Stromboli, can generate puffing, e.g., [10,11,19,26,27]. At larger bubble dimensions, spherical-cap bubbles transition into Taylor bubbles, when the bubble length exceeds that of the conduit diameter, e.g., [7]. Hence, areas are defined to the right of Figure 2 relating to Taylor bubble-driven activity involving puffing or strombolian explosions, depending on whether overpressure develops at the nose, e.g., [13]. This boundary has been defined by James et al. [28], who used the term, P s l i m * , which characterizes burst vigor, and is ≥1 for explosive gas release. Here, we adopt Equation (13) from [28] to define this transition, for a Taylor bubble reaching the magma surface at a pressure equal to surface atmospheric pressure, P s u r f , giving:
P s l i m * = ρ m g A l P s u r f P s u r f
where:
A = 1 ( r T B r c ) 2
such that: r T B is the Taylor bubble radius, which is the conduit radius, e.g., r c minus λ , where λ is the thickness of falling film surrounding the Taylor bubble. The falling film thickness is found, as per Llewellin et al. [43], from:
λ = 0.204 + 0.123 tanh ( 2.66 1.15 log 10 N f )
where the dimensionless inverse viscosity, N f [7] is defined as:
N f = ρ m μ g ( 2 r c ) 3
Hence, following Equation (3), the length, (and volume) at which slugs transition to explosive activity can be determined. The second element of the model is to consider the significance of inter-bubble spacing, in terms of determining whether bubbles rise independently of one another or whether interaction, which might lead to coalescence, could occur. This is considered in the following sections.

2.1. Interactions between Taylor Bubbles

The ascent velocity of a Taylor bubble base u T B is determined using the Froude Number, e.g., [43,44]:
F r = 0.34 [ 1 + ( 31.08 N f ) 1.45 ] 0.71
such that:
u T B = F r 2 g r c
This speed is taken to be the average bulk rise velocity of a Taylor bubble [44] during ascent in a volcanic conduit, as expansion, which causes acceleration of the nose, occurs closer to the surface [13].
Other properties of Taylor bubbles are also important here, in particular, the wake length l w a k e , and the wake interaction length l m i n . The wake and wake interaction lengths are key features of a bubble during the coalescence process. Bubbles will begin to coalesce on meeting certain separation criteria. The wake length, which is typically around four times shorter than the wake interaction length, defines an area within which any trailing bubble will undergo near-instantaneous coalescence with the leading Taylor bubble, i.e., a rapid acceleration of the trailing bubble into the leading bubble as per [45]:
l w a k e = 2 r c ( 0.30 + 1.22 × 10 3 N f )
The wake interaction length defines an area of fluidic disturbance beneath the Taylor bubble, within which any following bubble will be affected by the leading Taylor bubble through an increase in velocity, such that the trailing bubble will no longer act independently [46]:
l m i n = 2 r c ( 1.46 + 4.75 × 10 3 N f )

2.2. Interactions between Spherical-Cap Bubbles

Spherical-cap bubbles can also be characterized in terms of Reynolds number, in this case appropriate to the length scale of these bubbles. This scale is determined by the equivalent diameter, d e for bubbles of volume V b [46]:
d e = ( 6 V b π ) 1 3
Such that the Reynolds number in this case is defined as follows [46]:
R e = ρ m d e u μ
For u we use the ascent velocity of the Taylor bubble base (e.g., u T B , to estimate the Re characteristics of the system using a known velocity including effects of pipe diameter). The bubble drag coefficient ( C d ) is then calculated following [46]:
C d = ( 2.67 0.9 + 16 R e 0.9 ) 1 . 1 ˙
This relationship is applicable for regimes with Morton numbers >4 × 10⁻³, a condition satisfied in volcanic scenarios, e.g., [14]. The spherical-cap bubble rise velocity ( u C B ) can then be calculated using the following relationship, rearranged from Joseph [47], Equation (2.1):
u C B 2 = ( g d e C d ) 4 / 3
Coalescence between two spherical-cap bubbles occurs in the same manner as for Taylor bubbles [6,48]. To consider this, d e is firstly converted to bubble diameter ( d b ) using the constant 0.57 [4], which accounts for the non-spherical morphology of these bubbles:
d b = d e 0.57
The wake length of spherical-cap bubbles, c w a k e , applicable for Re < 200 (e.g., appropriate to basaltic systems) is then determined as per Komasawa et al. [48]. Firstly, using bubble volume, V b , we can calculate the volume of the wake [48]:
V w = V b R e 0.66
which is then used to determine the wake length, c w a k e from the following relationship:
V w = ( π d w 2 4 ) × ( c w a k e l C B )
where d w is the maximum wake diameter, which is taken as d b , and l C B is the length of the cap bubble (taken as db/2) [48]. For spherical-cap interaction length ( c m i n ), there is no available prior modelling literature to refer to here, hence, we take this to be four times greater than c w a k e , as this is the approximate scaling between the wake and wake interaction lengths in the Taylor bubble case, although, as spherical-cap bubble volume decreases, the influence of the interaction length will also decrease.

2.3. Bubble Interactions

Using the theory presented in Section 2.1 and in Section 2.2 a temporal inter-bubble separation, tmin, can be defined as a function of bubble volume (i.e., length) below which it would be highly improbable for an independent trailing bubble to burst at the surface. In this case, any following bubble would be travelling within the leading bubble’s wake, hence, would be liable for imminent coalescence; tmin was, therefore, taken to be equal to the rise time of the trailing bubble (i.e., the ascent velocity of the spherical-cap or Taylor bubble) through a column of liquid of thickness equal to that of the leading wake length ( l w a k e or c w a k e ) plus the height of fluid ( l f i l m ), arising from complete drainage of the film surrounding the leading bubble, following each burst. The latter was constrained, in the case of Taylor bubbles, from the film volume, as a function of the slug volume, i.e., height, with knowledge of the film thickness, as per Equation (5). For spherical-cap bubbles, this was constrained from the bubble volume and conduit volume around the bubble (i.e., applying the formula for the volume of a cylinder, for given conduit and/or bubble radii):
t m i n = l f i l m + l w a k e u T B   or   t m i n = l f i l m + c w a k e u C B
This, therefore, defines a region on Figure 2e where bubble bursts are significantly less likely to occur, i.e., within this region, all trailing bubbles are likely to undergo near-instantaneous coalescence with the leading bubble. This area is termed the “repose gap” region, following the terminology of Pering et al. [24], who, in a study of rapid bursting events on Mt. Etna, noted an absence of large mass, low repose time events, hypothesizing that this behavior was due to coalescence; this region is also discussed in a modelling framework in Pering et al. [30].
We can also define the time, t t r a n s i t i o n , below which adjacent rising bubbles cannot be considered to behave independently (e.g., bubbles are located within the wake areas of those ahead of them), such that:
t t r a n s i t i o n = l f i l m + l m i n u T B   or   t t r a n s i t i o n = l f i l m + c m i n u C B
These durations correspond to the time taken for a Taylor or spherical-cap bubble to rise through a column of melt of height equal to that of the drained film plus the wake interaction length, l m i n or c m i n , of the leading bubble (Figure 2), and are based on the lengths or volumes of bubble in question. Hence, this line subdivides the non-spherical bubble degassing classes in Figure 2, into categories where the bubbles can/cannot be considered as rising independently of one another, respectively. Note that a single area is used to denote non-independent (i.e., rapidly-bursting) Taylor and spherical-cap bubbles (Figure 2d), without segregation between explosive and non-explosive cases for Taylor bubbles, as complexities associated with pressure differences in this regime could lead to cases where the P s l i m * parameter would not apply.

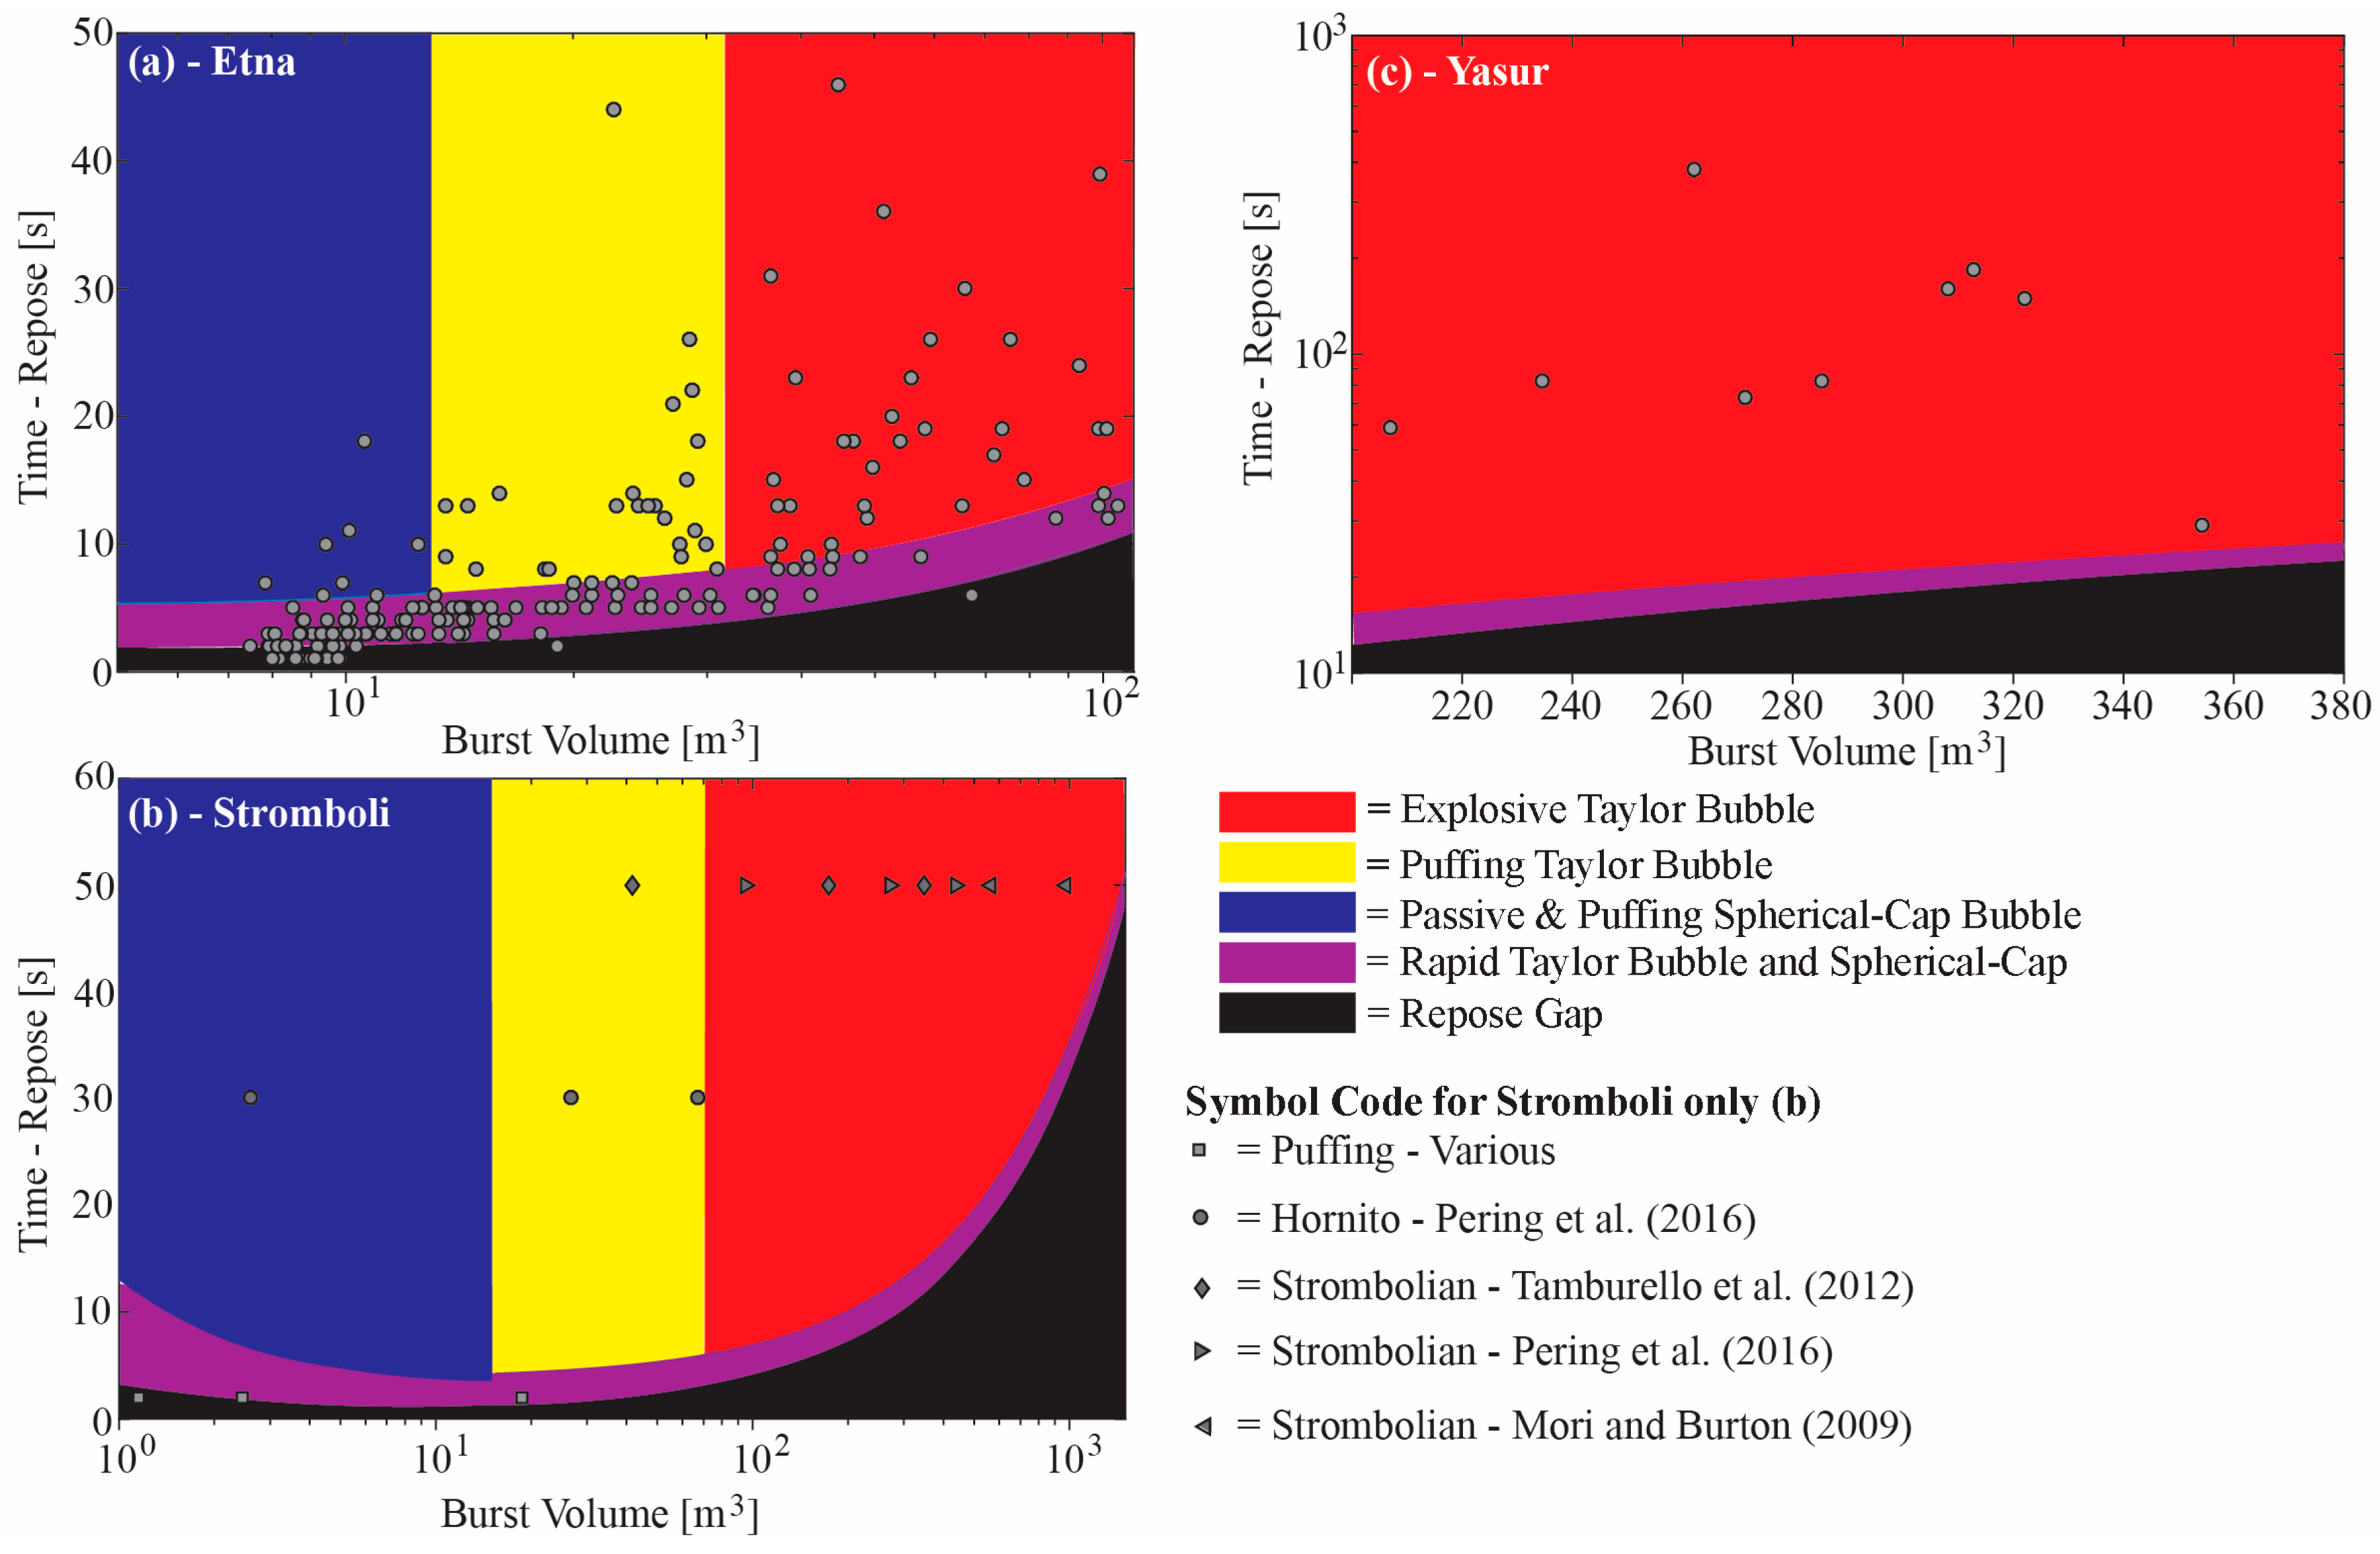
3. Model Application to Target Volcanoes and Comparison with Field Data

The model was initiated with a range of Taylor and spherical-cap bubble volumes relevant to the volcano scale, e.g., with corresponding bubble lengths ranging from the centimeter scale for spherical-cap bubbles, to the order of meters for Taylor bubbles. We apply the model for conditions appropriate to three target volcanoes: Stromboli, Etna, and Yasur, where field data concerning puffing/strombolian explosive behavior are available with inter-event repose intervals on the order of seconds to minutes. The model outputs, with field data overlain, are shown in Figure 3. During bubble ascent, the overlying viscous magma acts to retard expansion, i.e., creating a gas overpressure. To account for this phenomenon we applied the model of Del Bello et al. [14] for Taylor bubble data for Etna and Stromboli, which provides estimates of gas overpressure at burst and the resulting bubble lengths as a function of magmatic and conduit parameters, from which burst volumes can be extracted.
The schematic representation of the model in Figure 2 necessarily applies sharp definitions to the boundaries between defined degassing areas. In reality, there will be a degree of fuzziness around these, as the model provides a mathematical simplification of the ‘real world’ conditions in volcanic conduits.
Firstly, we considered the case of Mt. Etna (Figure 3a). Here we took UV camera field data from Pering et al. [24], captured during a period of very rapid bubble-bursting activity (modal inter-burst period ≈ 4 s) observed at the Bocca Nuova crater. Here, observed masses were converted to in-conduit volumes, using a pressure value of ≈65 kPa (i.e., for Mt. Etna’s summit craters’ altitude ≈3300 m) within the Del Bello et al. [14] model. The parameters applied within our model were: magma density of 2600 kg·m−3, viscosity of 2000 Pa·s, and conduit radius of 1.5 m, e.g., [49]. In general, the field data clearly fall above the repose gap area, affirming the model suggestion from Pering et al. [24] that independently-bursting, large-volume, low repose time events would be improbable, due to inter-bubble coalescence in the conduit. The majority of bursts (62%) fall within the rapid bursting Taylor and spherical-cap bubble area, with 15% contained in the single Taylor bubble explosive area, 12% in the single Taylor bubble puffing area, and most of the remainder in the single puffing area, indicative of activity spanning the strombolian explosive-puffing spectrum. In the case of this rapid bursting scenario, the model points towards bubble interaction playing a key role in the fluid dynamics, as previously suggested by Pering et al. [24].
Secondly, for Stromboli (Figure 3b), we ran the model with density, viscosity, and conduit radius values of 2700 kg·m−3 [50,51], 300 Pa·s [52], and 1.5 m, respectively [53,54]. Figure 3b also includes a range of field data points, based on literature-derived main vent burst volumes [11,17,18]. These data generally fall within the single explosive Taylor bubble region, in line with the classical strombolian activity associated with this target. However, the very smallest bursts from the Tamburello et al. [11] dataset fall within the single Taylor bubble puffing region, capturing the spectrum of activity exhibited at the volcano. For the specifically-described ‘puffing’ events from Tamburello et al. [11], all the data points are located away from the rapid Taylor bubble bursting area. Note that in all the above cases, minimum repose times from the literature have been assigned, e.g., 50 s from Ripepe et al. [10] for puffing. Hence, even for these rather extreme prescriptions of inter-burst temporal resolution, the model points towards clearly independent bubble flow behavior.
In addition, Pering et al. [18] reported on non-explosive puffing events, from a hornito adjacent to the southeast crater, with a minimum repose interval of 30 s. These data fall within the single puffing areas for Taylor and spherical-cap bubbles. Even smaller decimeter-sized bubbles have also been associated with puffing activity from smaller vent openings at Stromboli with repose intervals of ≈0.5–2 s [9,10]. When plotted on Figure 3b, these events mostly lie in the rapid puffing area of the model, in view of their rather smaller inter-event durations than those puffing events reported in Pering et al. [18].
Thirdly, the model was run for the Yasur volcano (Figure 3c). Here, Kremers et al. [33] reported on infrasonic observations of Taylor bubble bursting, quoting slug lengths and inter-event intervals for a number of events. Here, we applied magma density and viscosity values of 2600 kg·m−3 and 1000 Pa·s, with a conduit radius of 1.5 m [22] within the model. In particular, we converted the Kremers et al. [33] data to the volume (see Table 1) using the formula for the volume of a cylinder (the infrasound derived length data in Kremers et al. [33] already account for pressure and viscous effects), and plot against repose time in Figure 3c. In this case all data fall within the single explosive Taylor bubble region, in line with the existent strombolian activity, and indicating independent bubble flow, well outside the repose gap region.

4. Discussion and Limitations

Here, we present the first unified fluid dynamic treatment of spherical-cap and Taylor bubble-driven puffing and strombolian explosive activity in basaltic volcanism, the most ubiquitous class of activity on Earth. This involves concatenation of discrete modelled aspects of Taylor bubble flow in volcanic scenarios, the consideration of spherical-cap bubble fluid dynamics in volcanology (building on the considerations of [29]), and incorporation of the possibility of inter-bubble interaction, which has been little considered, hitherto. We also compared the model against field data from Etna, Stromboli, and Yasur volcanoes, resulting in the field data falling, as would be expected within the areal zonation of activity regimes, e.g., in respect of whether strombolian activity or puffing was manifested. In particular, the general absence of data points in the repose gap region of the plots, affirmed the expectation that bubble-coalescence would mitigate against independent bubble bursting in this area. A further model success is the seamless flow between the c m i n and l m i n traces, i.e., the transition between Taylor and spherical-cap regions. Hence, the mathematical treatments presented here appear not to break down close to this regime shift. The flow between c w a k e and l w a k e for the Etna data (Figure 3a) demonstrates similar seamlessness, however, there is a slight mismatch for the Stromboli data (Figure 3b), highlighting a need for further study into interaction lengths of spherical-cap bubbles. In this treatment, we assume that rapid strombolian activity, such as that observed at Etna, are driven by trains of fully-formed gas slugs, with associated fluid dynamic features, for the duration of ascent from depth prior to burst.
Whilst a few data fell slightly within the repose gap region of Figure 3a,b, this is likely explicable by the following: (a) The repose gap region refers to an area where bursting is improbable, rather than impossible, and is based on the assumption that a bubble cannot exist independently within the wake of another bubble; in reality such a bubble would have a very short, yet finite, lifetime which could account for the slight overlap of some data into the repose gap region, and is commensurate with the close proximity of all such events to the transition line; (b) for the Etna data, all such events are within a second of the repose gap line, which is likely at least partially a result of the margin of error of the inter-event durations, given the quantized camera acquisition time stamp and finite exposure times (100 s of ms); (c) for the Stromboli data, the very smallest puffing events from Ripepe et al. [10] fall within the repose gap, potentially indicating that this activity is associated with somewhat different magmatic and rheological properties than those reported in the literature for the bulk conduit conditions of Stromboli, and assigned to the model; alternately, this could indicate that our assumption that c m i n is four times c w a k e , based on the behaviour of Taylor bubbles, could be an overestimate; and (d) a final issue is that the model does not include complexities associated with the flow of bubble trains. Here, all bubble ascent velocities have been based on models associated with the flow of single bubbles in vertical conduits. In fact, in bubble trains, the rise velocities are higher than in the single bubble case [55,56,57], and there is also the issue of near-surface expansion of trailing bubbles, e.g., [13]. Both of these effects will act to lower the c m i n , c w a k e , l m i n , and l w a k e traces in Figure 2 and Figure 3, plausibly also accounting for the very few data points that fell within the repose areas of the Etna and Stromboli plots. Future model development could take into consideration these effects, in addition to inclusion of more complex and realistic conduit conditions, e.g., [12], such as inclination [58,59] and formation of viscous caps at the top of the conduit [26,60], both of which are possibilities on Stromboli.

5. Conclusions

Here, we present the first unified model treatment of cap bubble and slug-based puffing and strombolian explosive degassing behavior in volcanoes. This model illustrates the exciting new scientific frontiers expedited by the recent advent of high speed imaging of volcanic gas plumes, such that models for subterranean fluid dynamics can be corroborated with surface degassing observations [61] in far more detail than previously possible with then-available temporally-coarser degassing data. Indeed, this work is one of the very first to exploit this opportunity, following from Pering et al. [18,24]. In particular, this framework offers the possibility of diagnosing underground fluid dynamic, conduit, or magmatic conditions, based on surface observations of burst masses and timings. Future work could focus on augmenting this combined UV camera to model a development framework with contemporaneous in situ gas composition data [62,63], and infrasound measurements [25]. In addition, future work will focus on validating the model using numerical and laboratory models, building on the recent work of Pering et al. [30].
This work is also focused on defining fluid dynamic transitions between disparate basaltic degassing classes, highlighting the key role played by inter-bubble separation and coalescence during such activity. There has been very little work in this area since seminal research, e.g., [37] a number of decades ago. This new capacity to develop models, informed by high time resolution UV camera observations offers exciting promise to provide step change advances in this field, extending to a wider range of basaltic styles, e.g., covering Hawaiian activity. In particular, at basaltic volcanoes such as Mt. Etna, where activity styles can transition rapidly between puffing and passive degassing through single strombolian explosions to more rapid bursting events and, finally, to Hawaiian lava fountaining [64,65], the model could be of utility in eruption forecasting.

Supplementary Materials

The following are available online at https://www.mdpi.com/2076-3263/8/2/42/s1, Table S1: Basaltic degassing model.

Acknowledgments

Andrew J. S. McGonigle acknowledges a Leverhulme Trust Research Fellowship (RF-2016-580), funding from the Rolex Institute, EPSRC GCRF institutional quick spend funds, a Google Faculty Research Award and NERC grant (NE/M021084/1). Tom D. Pering acknowledges the support of a NERC studentship (NE/K500914/1), the Royal Society (RG170226), the University of Sheffield, and ESRC Impact Acceleration funding. We thank three anonymous reviewers for their comments, which have improved the quality of the manuscript.

Author Contributions

Tom D. Pering designed and implemented the described model. Tom D. Pering and Andrew J. S. McGonigle wrote the manuscript.

Conflicts of Interest

The authors declare no conflict of interest.

Notation and Greek Letters

This section contains the notation and Greek letters used throughout this manuscript (listed in appearance order). Units used, where applicable, are included in brackets.
R e b Bubble Reynolds number
ρ m Magma density (kg·m−3)
u s b Ascent velocity of a spherical bubble (m·s−1)
l Bubble length (m)
μ Magma viscosity (Pa·s)
ρ g Gas density (kg·m−3)
g Gravitational acceleration (m·s−2)
P s l i m * Dimensionless burst vigour
A Ratio of bubble radius to pipe radius
P s u r f Atmospheric pressure at the surface (Pa)
r T B Taylor bubble radius (m)
r c Conduit radius (m)
λ Falling film thickness (m)
N f Dimensionless inverse viscosity
F r Froude number
u T B Taylor bubble base ascent velocity (m·s−1)
l w a k e Taylor bubble wake length (m)
l m i n Taylor bubble interaction length (m)
d e Equivalent diameter (m)
V b Bubble volume (m3)
R e Reynolds number
C d Bubble drag coefficient
u C B Spherical cap bubble base ascent velocity (m·s−1)
d b Bubble diameter (m)
V w Volume of spherical cap bubble wake (m3)
c w a k e Spherical cap bubble wake length (m)
l C B Cap bubble length (m)
c m i n Spherical cap bubble interaction length (m)
t m i n Minimum repose time (s)
t t r a n s i t i o n Transition time (s)

References

  1. Shaw, H.R.; Wright, T.L.; Peck, D.L.; Okamura, R.R. The viscosity of basaltic magma; an analysis of field measruements in Makaophui lava lake, Hawaii. Am. J. Sci. 1968, 266, 225–264. [Google Scholar] [CrossRef]
  2. Parfitt, E.A. A discussion of the mechanisms of explosive basaltic eruptions. J. Volcanol. Geotherm. Res. 2004, 134, 77–107. [Google Scholar] [CrossRef]
  3. Sparks, R.S.J. The dynamics of bubble formation and growth in magmas: A review and analysis. J. Volcanl. Geotherm. Res. 1978, 3, 1–37. [Google Scholar] [CrossRef]
  4. Davies, R.M.; Taylor, G.I. The mechanics of large bubbles rising through extended liquids and through liquids in tubes. Proc. R. Soc. Lond. A 1950, 200, 375–390. [Google Scholar] [CrossRef]
  5. Wegener, P.P.; Parlange, J. Spherical-cap bubbles. Annu. Rev. Fluid Mech. 1973, 5, 79–100. [Google Scholar] [CrossRef]
  6. Bhaga, D.; Weber, M.E. Bubbles in viscous liquids: Shapes, wakes, and velocities. J. Fluid Mech. 1981, 105, 61–85. [Google Scholar] [CrossRef]
  7. Wallis, G.B. One-Dimensional Two-Phase Flow; McGraw-Hill: New York, NY, USA, 1969. [Google Scholar]
  8. Morgado, A.O.; Miranda, J.M.; Araújo, J.D.P.; Campos, J.B.L.M. Review on vertical gas-liquid slug flow. Int. J. Multiph. Flow 2016, 85, 348–368. [Google Scholar] [CrossRef]
  9. Ripepe, M.; Gordeev, E. Gas bubble dynamics model for shallow volcanic tremor at Stromboli. J. Geophys. Res. 1999, 104, 10639–10654. [Google Scholar] [CrossRef]
  10. Ripepe, M.; Harris, A.J.L.; Carniel, R. Thermal, seismic and infrasonic evidences of variable degassing rates at Stromboli volcano. J. Volcanol. Geotherm. Res. 2002, 118, 285–297. [Google Scholar] [CrossRef]
  11. Tamburello, G.; Aiuppa, A.; Kantzas, E.P.; McGonigle, A.J.S.; Ripepe, M. Passive vs. active degassing modes at an open-vent volcano (Stromboli, Italy). Earth Planet. Sci. Lett. 2012, 359–360, 106–116. [Google Scholar] [CrossRef] [Green Version]
  12. Seyfried, R.; Freundt, A. Experiments on conduit flow and eruption behaviour of basaltic volcanic eruptions. J. Geophys. Res. 2000, 105, 23727–23740. [Google Scholar] [CrossRef]
  13. James, M.R.; Lane, S.J.; Corder, S.B. Modelling the rapid near-surface expansion of gas slugs in low-viscosity magmas. Geol. Soc. Spec. Publ. 2008, 307, 147–167. [Google Scholar] [CrossRef]
  14. Del Bello, E.; Llewellin, E.W.; Taddeucci, J.; Scarlato, P.; Lane, S.J. An analytical model for gas overpressure in slug-drive explosions: Insights into Strombolian volcanic eruptions. J. Geophys. Res. Solid Earth 2012, 117, B02206. [Google Scholar] [CrossRef]
  15. Chouet, B.; Hamisevi, N.; McGetchi, T.R. Photoballistics of volcanic jet activity at Stromboli, Italy. J. Geophys. Res. 1974, 79, 4961–4976. [Google Scholar] [CrossRef]
  16. McGonigle, A.J.S.; Aiuppa, A.; Ripepe, M.; Kantzas, E.P.; Tamburello, G. Spectroscopic capture of 1 Hz volcanic SO2 fluxes and integration with volcano geophysical data. Geophys. Res. Lett. 2009, 36. [Google Scholar] [CrossRef]
  17. Mori, T.; Burton, M. Quantification of the gas mass emitted during single explosions on Stromboli with the SO2 imaging camera. J. Volcanol. Geotherm. Res. 2009, 188, 395–400. [Google Scholar] [CrossRef]
  18. Pering, T.D.; McGonigle, A.J.S.; James, M.R.; Tamburello, G.; Aiuppa, A.; Delle Donne, D.; Ripepe, M. Conduit dynamics and post-explosion degassing on Stromboli: A combined UV camera and numerical modelling treatment. Geophys. Res. Lett. 2016, 43, 5009–5016. [Google Scholar] [CrossRef] [PubMed]
  19. Taddeucci, J.; Scarlato, P.; Capponi, A.; Del Bello, E.; Cimarelli, C.; Palladino, D.M.; Kueppers, U. High-speed imaging of Strombolian explosions: The ejection velocity of pyroclasts. Geophys. Res. Lett. 2012, 39, L02301. [Google Scholar] [CrossRef]
  20. Taddeucci, J.; Alatorre-Ibarguengoitia, M.A.; Palladino, D.M.; Scarlato, P.; Camaldo, C. High-speed imaging of Strombolian eruptions: Gas-pyroclast dynamics in initial volcanic jets. Geophys. Res. Lett. 2015, 42, 6253–6260. [Google Scholar] [CrossRef]
  21. Delle Donne, D.; Ripepe, M.; Lacanna, G.; Tamburello, G.; Bitetto, M.; Aiuppa, A. Gas mass derived by infrasound and UV cameras: Implications for mass flow rate. J. Volcanol. Geotherm. Res. 2016, 325, 169–178. [Google Scholar] [CrossRef]
  22. Kremers, S.; Lavallée, Y.; Hanson, J.; Hess, K.-U.; Chevrel, O.; Wassermann, J.; Dingwell, D.B. Shallow magma-mingling-driven Strombolian eruptions at Mt. Yasur volcano, Vanuatu. Geophys. Res. Lett. 2012, 39, L21304. [Google Scholar] [CrossRef]
  23. Shinohara, H.; Witter, J.B. Volcanic gases emitted during mild Strombolian activity of Villarrica volcano, Chile. Geophys. Res. Lett. 2005, 32, L20308. [Google Scholar] [CrossRef]
  24. Pering, T.D.; Tamburello, G.; McGonigle, A.J.S.; Aiuppa, A.; James, M.R.; Lane, S.J.; Sciotto, M.; Cannata, A.; Patane, D. Dynamics of mild strombolian activity on Mt. Etna. J. Volcanol. Geotherm. Res. 2015, 300, 103–111. [Google Scholar] [CrossRef] [Green Version]
  25. Dalton, M.P.; Waite, G.P.; Watson, I.M.; Nadeau, P.A. Multiparameter quantification of gas release during weak Strombolian eruptions at Pacaya volcano, Guatemala. Geophys. Res. Lett. 2010, 37, L09303. [Google Scholar] [CrossRef]
  26. Gaudin, D.; Taddeucci, J.; Scarlato, P.; Del Bello, E.; Ricci, T.; Orr, T.; Houghton, B.; Harris, A.; Rao, S.; Bucci, A. Integrating puffing and explosions in a general scheme for Strombolian-style activity. J. Geophys. Res. Solid Earth 2017, 122, 1860–1875. [Google Scholar] [CrossRef]
  27. Gaudin, D.; Taddeucci, J.; Scarlato, P.; Harris, A.; Bombrun, M.; Del Bello, E.; Ricci, T. Characteristics of puffing activity revealed by ground-based, thermal infrared imaging: The example of Stromboli Volcano (Italy). Bull. Volcanol. 2017, 79. [Google Scholar] [CrossRef]
  28. James, M.R.; Lane, S.J.; Wilson, L.; Corder, S.B. Degassing at low magma-viscosity volcanoes: Quantifying the transition between passive bubble-burst and Strombolian eruption. J. Volcanol. Geotherm. Res. 2009, 180, 81–88. [Google Scholar] [CrossRef]
  29. Bouche, E.; Vergniolle, S.; Staudacher, T.; Nercessian, A.; Delmont, J.-C.; Frogneux, M.; Cartault, F.; Le Pichon, A. The role of large bubbles detected from acoustic measurements on the dynamics of Erta ‘Ale lava lake (Ethiopia). Earth Planet. Sci. Lett. 2010, 295, 37–48. [Google Scholar] [CrossRef]
  30. Pering, T.D.; McGonigle, A.J.S.; James, M.R.; Capponi, A.; Lane, S.J.; Tamburello, G.; Aiuppa, A. The dynamics of slug trains in volcanic conduits: Evidence for expansion driven slug coalescence. J. Volcanol. Geotherm. Res. 2017, 348, 26–35. [Google Scholar] [CrossRef]
  31. Llewellin, E.; Del bello, E.; Lane, S.J.; Capponi, A.; Mathias, S.; Taddeucci, J. Cyclicity in slug-driven basaltic eruptions: Insights from large-scale analogue experiments. In Proceedings of the EGU General Assembly; 2013, Vienna, Austria, 7–12 April 2013. [Google Scholar]
  32. Llewellin, E.W.; Burton, M.R.; Mader, H.M.; Polacci, M. Conduit speed limit promotes formation of explosive ‘super slugs’. In Proceedings of the AGU Fall Meeting 2014, San Francisco, CA, USA, 15–19 December 2014. [Google Scholar]
  33. Kremers, S.; Wassermann, J.; Meier, K.; Pelties, C.; van Driel, M.; Vasseur, J.; Hort, M. Inverting the source mechanism of Strombolian explosions at Mt. Yasur, Vanuatu, using a multi-parameter dataset. J. Volcanol. Geotherm. Res. 2013, 262, 104–122. [Google Scholar] [CrossRef]
  34. Mori, T.; Burton, M. The SO2 camera: A simple, fast and cheap method for ground-based imaging of SO2 in volcanic plumes. Geophys. Res. Lett. 2006, 33, L24804. [Google Scholar] [CrossRef]
  35. Bluth, G.J.S.; Shannon, J.M.; Watson, I.M.; Prata, A.J.; Realmuto, V.J. Development of an ultra-violet digital camera for volcanic SO2 imaging. J. Volcanol. Geotherm. Res. 2007, 161, 47–56. [Google Scholar] [CrossRef]
  36. Kantzas, E.P.; McGonigle, A.J.S.; Tamburello, G.; Aiuppa, A.; Bryant, R.G. Protocols for UV camera volcanic SO2 measurements. J. Volcanol. Geotherm. Res. 2010, 194, 55–60. [Google Scholar] [CrossRef] [Green Version]
  37. Parfitt, E.A.; Wilson, L. Explosive volcanic eruptions—IX. The transition between Hawaiian-style lava fountaining and Strombolian explosive activity. Geophys. J. Int. 1995, 121, 226–232. [Google Scholar] [CrossRef]
  38. Palma, J.L.; Calder, E.S.; Basualto, D.; Blake, S.; Rothery, D.A. Correlations between SO2 flux, seismicity, and outgassing activity at the open vent of Villarrica volcano, Chile. J. Geophys. Res. Solid Earth 2008, 113, B10201. [Google Scholar] [CrossRef]
  39. James, M.R.; Lane, S.J.; Houghton, B.F. Unsteady Explosive Activity: Strombolian Eruptions. In Modeling Volcanic Processes: The Physics and Mathematics of Volcanism; Fagents, S.A., Gregg, T.K.P., Lopes, R.M.C., Eds.; Cambridge University Press: Cambridge, UK, 2013; pp. 107–129. [Google Scholar]
  40. Manga, M. Waves of bubbles in basaltic magmas and lavas. J. Geophys. Res. 1996, 101, 17457–17465. [Google Scholar] [CrossRef]
  41. Herd, R.A.; Pinkerton, H. Bubble coalescence in basaltic lava: Its impact on the evolution of bubble populations. J. Volcanol. Geotherm. Res. 1997, 75, 137–157. [Google Scholar] [CrossRef]
  42. Harris, A.J.L.; Dehn, J.; Calvari, S. Lava effusion rate definition and measurement: A review. Bull. Volcanol. 2007, 70. [Google Scholar] [CrossRef]
  43. Llewellin, E.W.; Del Bello, E.; Taddeucci, J.; Scarlato, P.; Lane, S.J. The thickness of the falling film of liquid around a Taylor bubble. Proc. R. Soc. A 2012, 468. [Google Scholar] [CrossRef]
  44. Viana, F.; Pardo, R.; Yánez, R.; Trallero, J.L.; Joseph, D.D. Universal correlation for the rise velocity of long gas bubbles in round pipes. J. Fluid Mech. 2003, 494, 379–398. [Google Scholar] [CrossRef]
  45. Campos, J.B.L.M.; Guedes de Carvalho, J.R.F.G. An experimental study of the wake of gas slugs rising in liquids. J. Fluid Mech. 1988, 196, 27–37. [Google Scholar] [CrossRef]
  46. Pinto, A.M.F.R.; Campos, J.B.L.M. Coalescence of two gas slugs rising in a vertical column of liquid. Chem. Eng. Sci. 1996, 51, 45–54. [Google Scholar] [CrossRef]
  47. Joseph, D.D. Rise velocity of a spherical cap bubble. J. Fluid Mech. 2003, 488, 213–223. [Google Scholar] [CrossRef]
  48. Komasawa, I.; Otake, T.; Kamojima, M. Wake behaviour and its effect on interaction between spherical-cap bubbles. J. Chem. Eng. Japan 1980, 13, 103–109. [Google Scholar] [CrossRef]
  49. Corsaro, R.A.; Pompilio, M. Dynamics of Magmas at Mount Etna, in Mt. Etna: Volcano Laboratory; Bonaccorso, A., Calvari, S., Coltelli, M., del Negro, C., Falsaperla, S., Eds.; American Geophysical Union: Washington, DC, USA, 2004. [Google Scholar]
  50. Vergniolle, S.; Brandeis, G. Strombolian explosions: 1. A large bubble breaking at the surface of a lava column as a source of sound. J. Geophys. Res. 1996, 101, 20433–20447. [Google Scholar] [CrossRef]
  51. Métrich, N.; Bertagnini, A.; Landi, P.; Rosi, M. Crystallization driven by decompression and water loss at Stromboli volcano (Aeolian Islands, Italy). J. Petrol. 2001, 42, 1471–1490. [Google Scholar] [CrossRef]
  52. Vergniolle, S.; Brandeis, G.; Mareschal, J.C. Strombolian explosions 2. Eruption dynamics determined from acoustic measurements. J. Geophys. Res. 1996, 101, 20449–20466. [Google Scholar] [CrossRef]
  53. Harris, A.J.L.; Stevenson, D.S. Thermal observations of degassing open conduits and fumaroles at Stromboli and Vulcano using remotely sensed data. J. Volcanol. Geotherm. Res. 1997, 76, 175–198. [Google Scholar] [CrossRef]
  54. Delle Donne, D.; Ripepe, M. High-frame rate thermal imagery of Strombolian explosions: Implications for explosive and infrasonic source dynamics. J. Geophys. Res. Solid Earth 2012, 117, B09206. [Google Scholar] [CrossRef]
  55. Krishna, R.; Urseanu, M.I.; van Baten, J.M.; Ellenberger, J. Rise velocity of a swarm of large gas bubbles in liquid. Chem. Eng. Sci. 1999, 54, 171–183. [Google Scholar] [CrossRef]
  56. Mayor, T.S.; Pinto, A.M.F.R.; Campos, J.B.L.M. Vertical slug flow in laminar regime in the liquid and turbulent regime in the bubble wake—Comparison with fully turbulent and fully laminar regimes. Chem. Eng. Sci. 2008, 63, 3614–3631. [Google Scholar] [CrossRef]
  57. Mayor, T.S.; Pinto, A.M.F.R.; Campos, J.B.L.M. On the gas expansion and gas hold-up in vertical slugging columns—A simulation study. Chem. Eng. Prog. 2008, 47, 799–815. [Google Scholar] [CrossRef]
  58. Chouet, B.; Dawson, P.; Ohminato, T.; Martini, M.; Saccorotti, G.; Giudicpietro, F.; De Luca, G.; Milana, G.; Scarpa, R. Source mechanisms of explosions at Stromboli Volcano, Italy, determined from moment-tensor inversions of very-long period data. J. Geophys. Res. 2003, 108, ESE 7-1–ESE 7-25. [Google Scholar] [CrossRef]
  59. James, M.R.; Lane, S.J.; Chouet, B.; Gilbert, J.S. Pressure changes associated with the ascent and bursting of gas slugs in liquid-filled vertical and inclined conduits. J. Volcanol. Geotherm. Res. 2004, 129, 61–82. [Google Scholar] [CrossRef]
  60. Capponi, A.; James, M.R.; Lane, S.J. Gas slug ascent in a stratified magma: Implications of lfow organisation and instability for Strombolian eruption dynamics. Earth Planet. Sci. Lett. 2016, 435, 159–170. [Google Scholar] [CrossRef]
  61. McGonigle, A.J.S.; Pering, T.D.; Wilkes, T.C.; Tamburello, G.; D’Aleo, R.; Bitetto, M.; Aiuppa, A. Ultraviolet imaging of volcanic plumes: A new paradigm in volcanology. Geosciences 2017, 7, 68. [Google Scholar] [CrossRef]
  62. Aiuppa, A.; Federico, C.; Paonita, A.; Giudice, G.; Valenza, M. Chemical mapping of a fumarolic field: La Fossa Crater, Vulcano Island (Aeolian Islands, Italy). Geophys. Res. Lett. 2005, 32, L13309. [Google Scholar] [CrossRef]
  63. Shinohara, H. A new technique to estimate volcanic gas composition: Plume measurements with a portable multi-sensor system. J. Volcano Geotherm. Res. 2005, 143, 319–333. [Google Scholar] [CrossRef]
  64. Allard, P.; Burton, M.; Muré, F. Spectroscopic evidence for a lava fountain driven by previously accumulated magmatic gas. Nature 2005, 433, 407–410. [Google Scholar] [CrossRef] [PubMed]
  65. Aiuppa, A.; Moretti, R.; Federico, C.; Giudice, G.; Gurrieri, S.; Liuzzo, M.; Papale, P.; Shinohara, H.; Valenza, M. Forecasting Etna eruptions by real-time observation of volcanic gas composition. Geology 2007, 35, 1115–1118. [Google Scholar] [CrossRef]
Figure 1. An illustration of (a) spherical-cap and (b) Taylor bubble morphologies including the bubble features relevant to the model described here. Any bubble falling within the wake length of the bubble ahead of it is considered liable for imminent coalescence. Any bubble beyond the interaction length would be considered to flow independently (e.g., in the single regions of the model outputs shown in Figure 2 and Figure 3). Bubbles within the interaction length are affected by the leading bubble (e.g., falling within the rapid regions of Figure 2 and Figure 3).
Geosciences 08 00042 g001
Figure 2. Left—an illustrative example of the zonation between activity classes associated with the model, plotted on arbitrary inter-bubble repose time vs. bubble volume axes. Within area (a) are spherical-cap bubbles, which produce passive activity or light puffing, (b,c) are Taylor bubble flow scenarios resulting in non-explosive and explosively-bursting scenarios, respectively. Area (d) represents cases where bubbles rise in sufficient proximity to one another to affect one another’s fluid dynamics, while (e) corresponds to a region in which independent bubble bursting is unlikely due to coalescence between neighboring bubbles. Right—a further illustrative example with only defining lines between sections of the model. Important equations and bubble features are highlighted. Please see the text for full details on these.
Geosciences 08 00042 g002
Figure 3. Outputs from the model run with input conduit and fluid dynamic parameters appropriate to: (a) Mt. Etna; (b) Stromboli; and (c) and Yasur volcanoes. Overlain on the plots are data points derived from field measurements on these targets, for Etna from Pering et al. [24], and Yasur from Kremers et al. [33]. In the Stromboli case, a number of literature sources are referred to, as detailed above. In each case a single repose interval is applied, which is a minimum for the observed activity. Figure 3b also just shows the maximum, mean, and minimum burst volumes from each of the Stromboli papers to simplify the graphic.
Geosciences 08 00042 g003
Table 1. Slug length and repose time data associated with rapid strombolian activity in the Yasur volcano (Kremers et al. [33] Table 2, note, only bursts with defined repose times are taken and this is then taken as the time between bursts) in addition to calculated explosive gas volumes.
Length (m) Volume (m3)Repose (s)
118.5 28582
174.9 35429
138.5 308160
68.6 20759
109.7 27173
149.5 322149
142.1 313185
102.6 262380
83.7 23582

