Article

Geochemical Characteristics of Soils on Ellis Island, New York-New Jersey, Sixty Years after the Abandonment of the Hospital Complex

by
Kaixuan Bu
1,2,*,
Deborah Freile
1,
James V. Cizdziel
3,
Jena Richards
1,
Virinder Sidhu
1,4 and
Nurdan S. Duzgoren-Aydin
1,5
1
Department of Earth and Environmental Sciences, New Jersey City University, Jersey City, NJ 07305, USA
2
Department of Marine and Coastal Sciences, Rutgers University, New Brunswick, NJ 08901, USA
3
Department of Chemistry and Biochemistry, University of Mississippi, University, MS 38677, USA
4
Department of Civil, Environmental and Ocean Engineering, Stevens Institute of Technology, Hoboken, NJ 07030, USA
5
Office of The Provost, New Jersey City University, Jersey City, NJ 07305, USA
*
Author to whom correspondence should be addressed.
Geosciences 2018, 8(1), 13; https://doi.org/10.3390/geosciences8010013
Submission received: 1 September 2017 / Revised: 18 December 2017 / Accepted: 22 December 2017 / Published: 4 January 2018
(This article belongs to the Special Issue Urban Environmental and Medical Geochemistry)

Abstract

:
Soil plays many critical roles in ecosystem health. As urbanization expands into once industrial and commercial lands, there is increased potential for human exposure to soil contaminants, including heavy metals introduced by past anthropogenic activities. Thus, it is important to assess soil contamination in such areas for public health concerns. In this study, we investigated the physico-chemical characteristics of soils from an abandoned hospital complex on Ellis Island, New York (NY) – New Jersey (NJ) to assess the geochemical conditions of the local soil environment and metal contamination from historical activities, including coal-burning and use of lead arsenate insecticide and lead paint. The soil texture, nutrient content and heavy metal (As, Pb, Cr, Cd, Cu and Hg) concentrations were determined and their impact was evaluated. Soils were mostly sandy loam with C:N ratios of about 20:1. Heavy metals were elevated compared to background soils. Concentrations of acid extractable As and Pb ranged from 8.12 to 26.3 mg·kg−1 and 257 to 1008 mg·kg−1, respectively. Total-Hg concentrations varied from 0.191 to 0.899 mg·kg−1, with the higher levels likely from local coal-burning and deposition from the prevailing westerly winds. Overall, we find that even after 60 years of abandonment, the impact to Ellis Island soil from past human activities can still be observed.

1. Introduction

Soils play many critical roles in the ecosystem, such as food production, biochemical transformation, element cycling, water filtration and waste decomposition [1]. In the modern age, rapid urbanization processes have unavoidably introduced increasing amount of contaminants, including heavy metals, into soils through various sources such as industrial wastes, agricultural fertilizer and pesticide application, as well as sewage sludge discharge [2,3,4]. Urban soil is strongly influenced by anthropogenic activities and exhibits distinct characteristics from background soils, including greater vertical and spatial variability, interrupted nutrient cycling, modified biological community and relatively high levels of metal contaminants [5,6,7]. Encroachment into abandoned industrial or commercial lands containing contamination is an increasing public concern because it increases the risk of human exposure to the contaminants through ingestion, inhalation and dermal contact [8].
Heavy metals are a major contaminant in the soil environment [9]. These toxic metals pose risk to humans and the ecosystem through multiple pathways, such as direct contact, ingestion of contaminated water, biomagnification in the food chain, phytotoxicity and generally reducing the soil quality by influencing or altering soil microorganism activities [10,11]. Furthermore, heavy metals are resistant to biodegradation, making their accumulation in the soil environment extremely persistent [12,13]. Several heavy metals, including Ni, Cu and Zn, are essential nutrients of bio-importance to many physiological and biochemical processes, and serve as constituents of key enzymes and participants in oxidation-reduction reactions [14,15]. Whereas other heavy metals such as As, Cd, Pb and Hg have no known biological function and exhibit toxicity even at low concentrations [16]. Once adsorbed by the soil, heavy metals have different bioavailability, toxicity and mobility depending on the strength of metal-soil interactions; such interactions may include adsorption-desorption, ion exchange, dissolution-mineralization and biological immobilization-mobilization [11,17]. Heavy metals can affect plant growth by decreasing photosynthetic rate and chlorophyll concentrations [18,19]. Heavy metals in edible plants can enter and magnify in the food chain, increasing the risk of human or animal exposure [20]. Several studies have shown high concentrations of heavy metals in soil could also negatively affect the diversity, population and overall activity of soil microorganism communities [4,21,22]. These metals exert toxicities within the cell by interfering with normal physiological processes often replacing essential nutrient metal cations due to their structural similarity [23]. According to multiple governmental agencies, As, Cd, Cr, Pb and Hg are the metals with the most public health concern because of their wide-spread use in human activities and their toxic and carcinogenic effects [24,25,26]. Thus, understanding the physico-chemical characteristics of urban soils is critical to determine bioavailability of heavy metal contaminants and assess potential impacts to the local ecosystem and public health.
The aim of this study is to, for the first time, carry out a survey of geochemical characteristics and heavy metal contamination in the soils around the abandoned Immigration Hospital complex on Ellis Island, NY-NJ. From 1892 to 1954, Ellis Island served as the US Government’s primary immigration inspection station, with over 12 million immigrants passing through its gates [27,28]. The Ellis Island Immigrant Hospital served as the detention, quarantine and treatment facility for immigrants diagnosed with health issues upon arrival to the US [29]. During its fully functional years from 1902 through the 1930s, the hospital treated about 1.2 million patients from over 75 countries. The hospital complex was officially abandoned in 1954 and since then the entire south side of Ellis Island has had limited public access. Because of the potential use of heavy metals during the operation of the hospital and because the future for the site is being considered by the National Park Service, it is important to assess soil contaminants at the site. This study constitutes the first large-scale study of metal contamination in the soil on Ellis Island. The soil geo-chemical information is of particular interest as it may reflect potential long term influences brought by anthropogenic activities to the isolated soil environment.

2. Material and Methods

Ellis Island is located in Upper New York Bay; the original natural island (1.4 hectares) is in New York while most of the remaining man-made island is in Jersey City, New Jersey. By 1906 the island had been expanded to 10.9 hectares with the addition of landfill sediments from the excavation of New York City’s subway system and other debris. The south side of the island, including the decommissioned Ellis Island Immigrant Hospital has been closed to the general public, while the renovated north side has been open to visitors since 2001. Ellis Island used to consist of three smaller islands, namely Island 1, 2 and 3 from north to south (Figure 1). The General Hospital was built on Island 2 and the Contagious Disease Hospital was built on Island 3, together they comprise the Ellis Island Hospital Complex. The powerhouse with a coal-burning furnace was located in the southwest corner of Island 3, next to an office building and hospital morgue. There is also a kitchen facility in the center of Island 3. Later Island 2 and 3 were combined into a single landmass with landfill sediment (Figure 2).

2.1. Soil Sampling

We used archival maps of the Ellis Island Hospital Complex and the assistance of the National Park Service museum technicians to identify sectors within the south side of the hospital complex for sampling. Soil samples were collected using stratified random sampling, which relies primarily on historical information and prior analytical results to divide the area of concern into smaller sampling areas [31]. The samples were collected following EPA standard field protocols (EPA/600/R-92/128), which call for the collection of samples from near-surface soil with tools such as spades, spoons, shovels and scoops [32,33,34]. The surface debris and vegetation were removed and soil samples were collected at a depth of 15 cm by using a stainless steel trowel [32]. The first sampling event was carried out in the spring of 2016 followed by a second sampling event in spring of 2017. A total of 21 samples including replicates from various areas on the Ellis Island Immigration Hospital were collected. Additional sampling information are presented in Figure 2 and Table 1. Initial field and laboratory survey scans of soil samples were carried out using a portable XRF analyzer (Thermo Niton XL3t, Thermo Electron North America LLC, West Palm Beach, FL, USA) in order to obtain preliminary metal concentrations for the soils. The pH of soil samples were measured using standard method described by Sparks [35], with an average of 7.1 ± 0.5. All soil samples collected were stored in a refrigerator at 4 °C before processing.

2.2. Particle Size Analysis

Approximately 120 g of the samples were weighed and dried in an oven at 60 ℃ and re-weighed to obtain soil moisture content. The samples were then split using the cone and quartering method [36] and approximately 50–70 g was introduced into a series of US Standard Certified A.S.T.M. E-11 stainless steel sieves (2 mm to 63 µm). The sieves were placed in a Tyler Ro-Tap (W.S. Tyler Co., Cleveland, OH, USA) for 15 minutes, whereby size fractionation was achieved. The above procedure followed the methodology outlined by Krumbein and Pettijohn and by Folk, which yielded good accuracy (±5%) [36,37]. The rest of the dried sample was labelled as “dry bulk” for further analysis. The gravel (>2 mm), sand (2–0.063 mm) and mud [silt (63–2 µm) and clay (<2 µm)] fractions were weighed. Additionally, enough (~3 g) of the finest fraction (<63 µm) was suspended in 0.2% sodium hexametaphosphate in an 80 mL beaker for dispersal and admixed with an ultrasonic probe (Sonics & Materials, Inc., Newtown, CT, USA) for 5 minutes. This mixture was introduced into a particle size analyzer (SediGraph III Plus, Micromeritics Instrument Corporation, Norcross, GA, USA) to determine the nature of the <63 µm fraction (i.e., to quantify the amount of silt and clay necessary for soil texture determination). The particle size analyzer uses an X-ray sedimentation technique for determining the relative mass distribution of a sample by particle size [38]. Together the mechanical sieving and the particle size analyzer data allowed to identify the soil textural classification, which is a function of the relative percent of sand, silt and clay. This was accomplished by using the NRCS soil texture calculator from the NRCS website [39].
Soil particles play an important roles in a variety of soil interactions, such as ion adsorption-desorption, water retention and heavy metal immobilization [40]. While metal transport in soil partially depends on the physicochemical properties of the metal, it is more controlled by the characteristics of soil, such as clay content and organic matter content [41]. The clay fraction in the soil is the most dynamic and active phase due to its high surface area and negative surface charge, which are very important for its adsorption capacity [41,42]. As for the soil ecosystem, the clay-sized soil particles are also important because they have the highest interaction with the microbial community. This is due to the enormous surface area available for microorganisms to cluster as well as providing a reactive surface that attracts cations (i.e., nutrient rich elements, such as K+) and organics [43]. Therefore, we selected the fine-grained fraction of the soil samples (<63 µm) for all element analysis in this study except for Hg, where we analyzed both bulk sample and individual size fractions.

2.3. Carbon Nitrogen Sulfur Analysis

The composition of CNS in the soil samples was determined by using a Thermo Flash 2000 elemental analyzer (Thermo Electron North America LLC, West Palm Beach, FL, USA) which operates according to the dynamic flash combustion technique. About 10 mg of vanadium pentoxide was mixed in a tin cup with approximately 10 mg of the <63 µm soil sample to ensure complete combustion of sulfur. The prepared soil samples were introduced into the reactor kept at 950 °C for complete combustion with the addition of oxygen; the nitrogen, carbon and sulfur were converted to N2, CO2 and SO2, respectively. The three gases were then separated through a GC column (HayeSep®, 60–80 mesh, 2 m) and detected by a thermal conductivity detector. All samples were run in duplicates and 2,5-Bis(5-tert-butyl-2-benzoxazolyl) thiophene (BBOT, CE Elantech Inc., Lakewood, NJ, USA) was run as a calibration standard and also as an accuracy check standard every 5 samples. The correlation between carbon and nitrogen, as well as carbon and sulfur, were determined by using Person correlation analysis.

2.4. Acid Extractable Metal Analysis

The acid extraction was performed following EPA 3051 [44]. For each soil sample, about 0.25 g of the fine grained soil fraction was digested with 10 mL concentrated nitric acid (TraceMetalTM Grade, Fisher Scientific Company, LLC, Hanover Park, IL, USA) in a microwave digestion system (Mars 3, CEM Microwave Technology Ltd., Buckingham, UK). NIST 2711a (Montana Soil II) standard reference material was used to check for the accuracy of the analytical procedure. Each microwave digestion batch consisted of two blanks, two NIST 2711a, seven soil samples and one duplicate. Following EPA 3051, the digestion solutions were ramped to 175 °C in 4.5 min and maintained at that temperature for 5.5 min. The cooled digests were filtered and diluted before being analyzed by quadrupole inductively coupled plasma mass spectrometry (ICPMS, X-series II, Thermo Electron North America LLC, West Palm Beach, FL, USA). Potentially toxic heavy metal elements that are most commonly found in contaminated soil (Pb, Cr, As, Cd and Cu) [45] together with a few major elements (Ca and Mg) were quantified with external calibration using 115In as an internal standard. The instrument parameters used for the analysis are present in Table 2.
The relative percent difference of the NIST 2711a duplicates ranged from 1.8% to 4.7%, while the range for duplicate samples is 1.2% to 10.9%, showing good reproducibility and consistency of the analytical procedure. The acid extractable concentrations of all measured elements in NIST 2711a were within the NIST certified concentration ranges for the acid extraction method [46]. The mean recoveries values were the averaged metal recoveries achieved by acid extraction method (Table 3). In fact, except for Cr, all other heavy metals showed recoveries greater than 95%, suggesting acid extraction method is nearly as efficient as total digestion method for these elements.

2.5. Mercury Analysis

Bulk soil samples for Hg analysis were passed through a stainless steel screen to remove pebbles and other debris larger than 1-mm in diameter. Total-Hg concentrations in the soils were determined following US EPA Method 7473 using a direct Hg analyzer (DMA-80; Milestone Inc., Shelton, CT, USA). The method is based on thermal decomposition, amalgamation and atomic absorption spectrometry. About 0.02 g of each dried sample was accurately weighed and analyzed in the DMA. Operating times for drying, decomposition and post-combustion flushing periods were 60 s (200 °C), 180 s (650 °C) and 45 s, respectively.
The instrument was calibrated (0–40 ng range) using a series of liquid standards prepared from a stock Hg standard solution (Spex CertiPrep, Metuchen, NJ, USA). MESS-4 and PACS-3 (marine sediment reference material, NRC Canada) as well as an in-house reference soil were analyzed about every 15 samples with recoveries within ±15% of expected values. About 25% of the total samples were run in duplicate, with the average relative percent difference being 9.2%.
Loss on Ignition (LOI) was used as an estimate of total organic carbon. LOI was calculated by reweighing the sample boats after the Hg analyses. To determine the concentration of Hg in different soil particle size fractions, select bulk soil samples were passed through sieves with mesh sizes of 1000, 500, 250 and 125 µm. The weight percentage of each fraction was calculated, and Hg concentrations were determined in each fraction as before.

2.6. Statistical Analysis

The linear correlations between C and N as well as C and S were determined by using Person’s correlation analysis, the Pearson’s r was presented as a measure of the linearity. Student’s t-test and calculated p-value were used to assess the significance of dissimilarity in metal concentrations between two groups of samples: samples from powerhouse (furnace) area and samples from the rest areas. Discriminant analysis (DA) is an Eigen-based statistical technique that maximizes the among-group variations by determining the optimum linear combination of the quantitative variables (canonical variables) [47]. DA was performed by using the linear covariance method in JMP® 9.0 to further assess the among group difference between the furnace and non-furnace samples. Metal concentrations determined by acid extraction were used in the statistical analysis (Mg, Ca, Pb, Cr, As, Cr and Cu).

3. Results and Discussion

3.1. Ellis Island Soil Particle Size

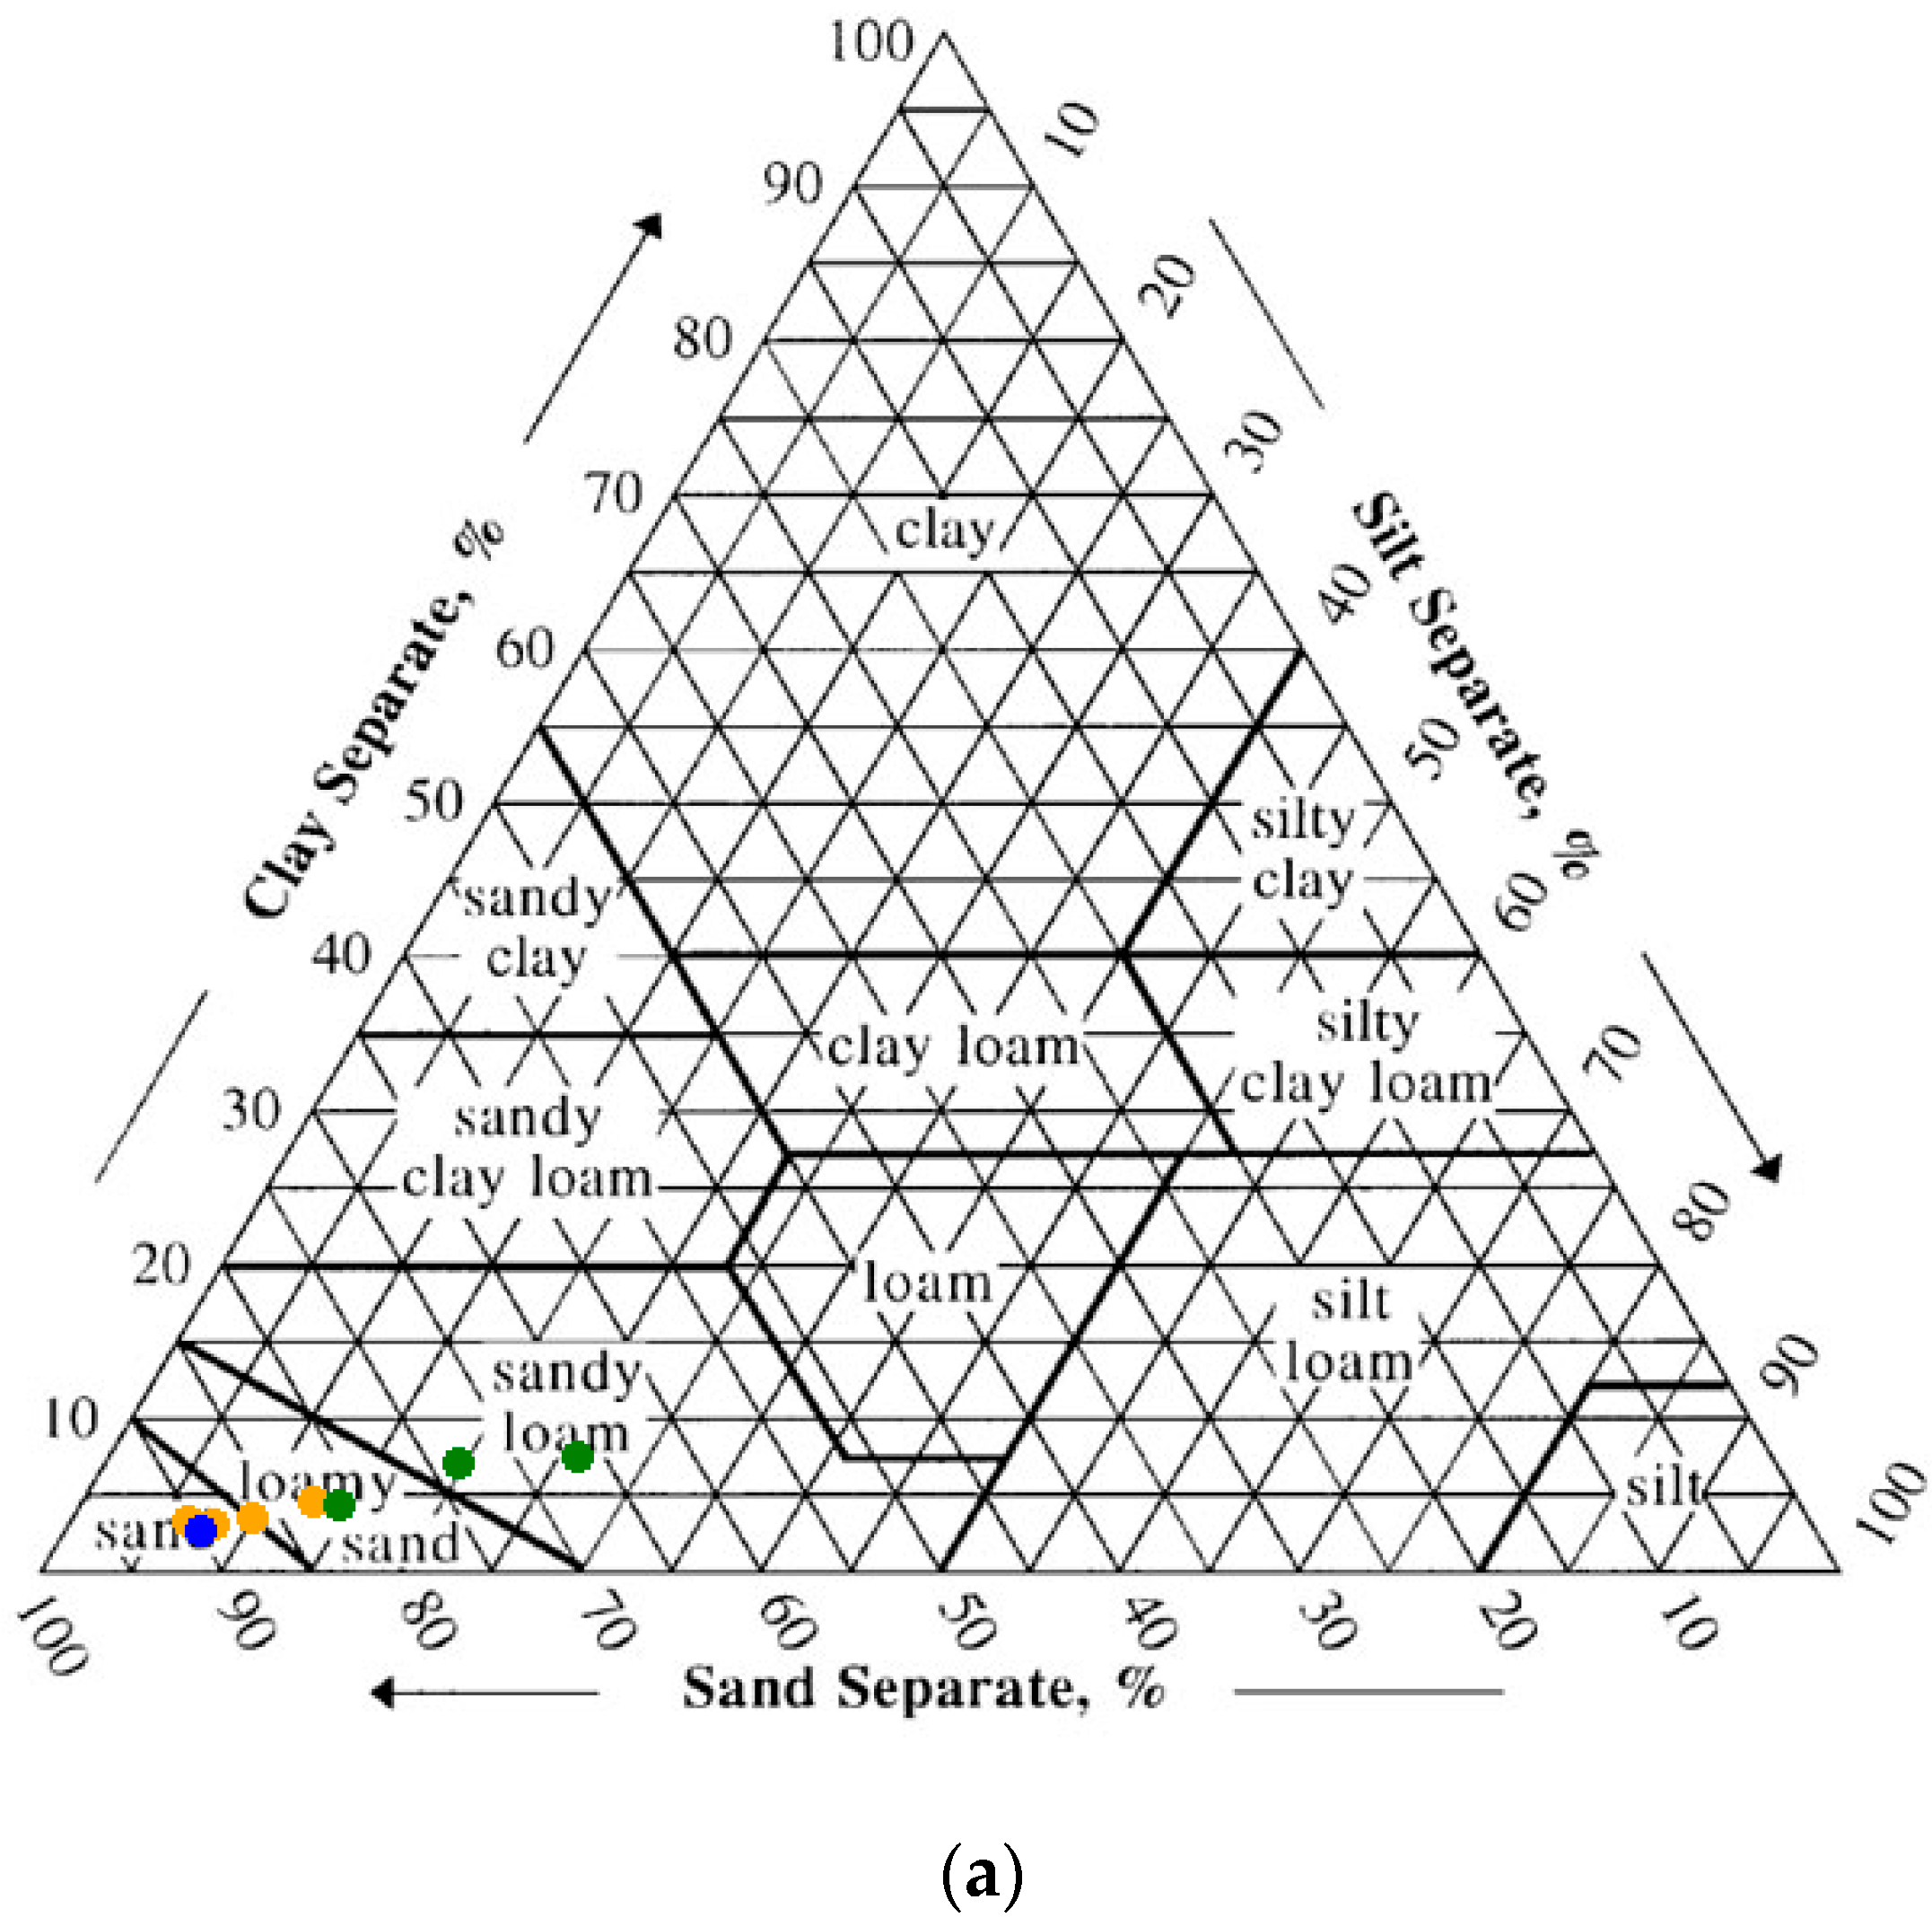
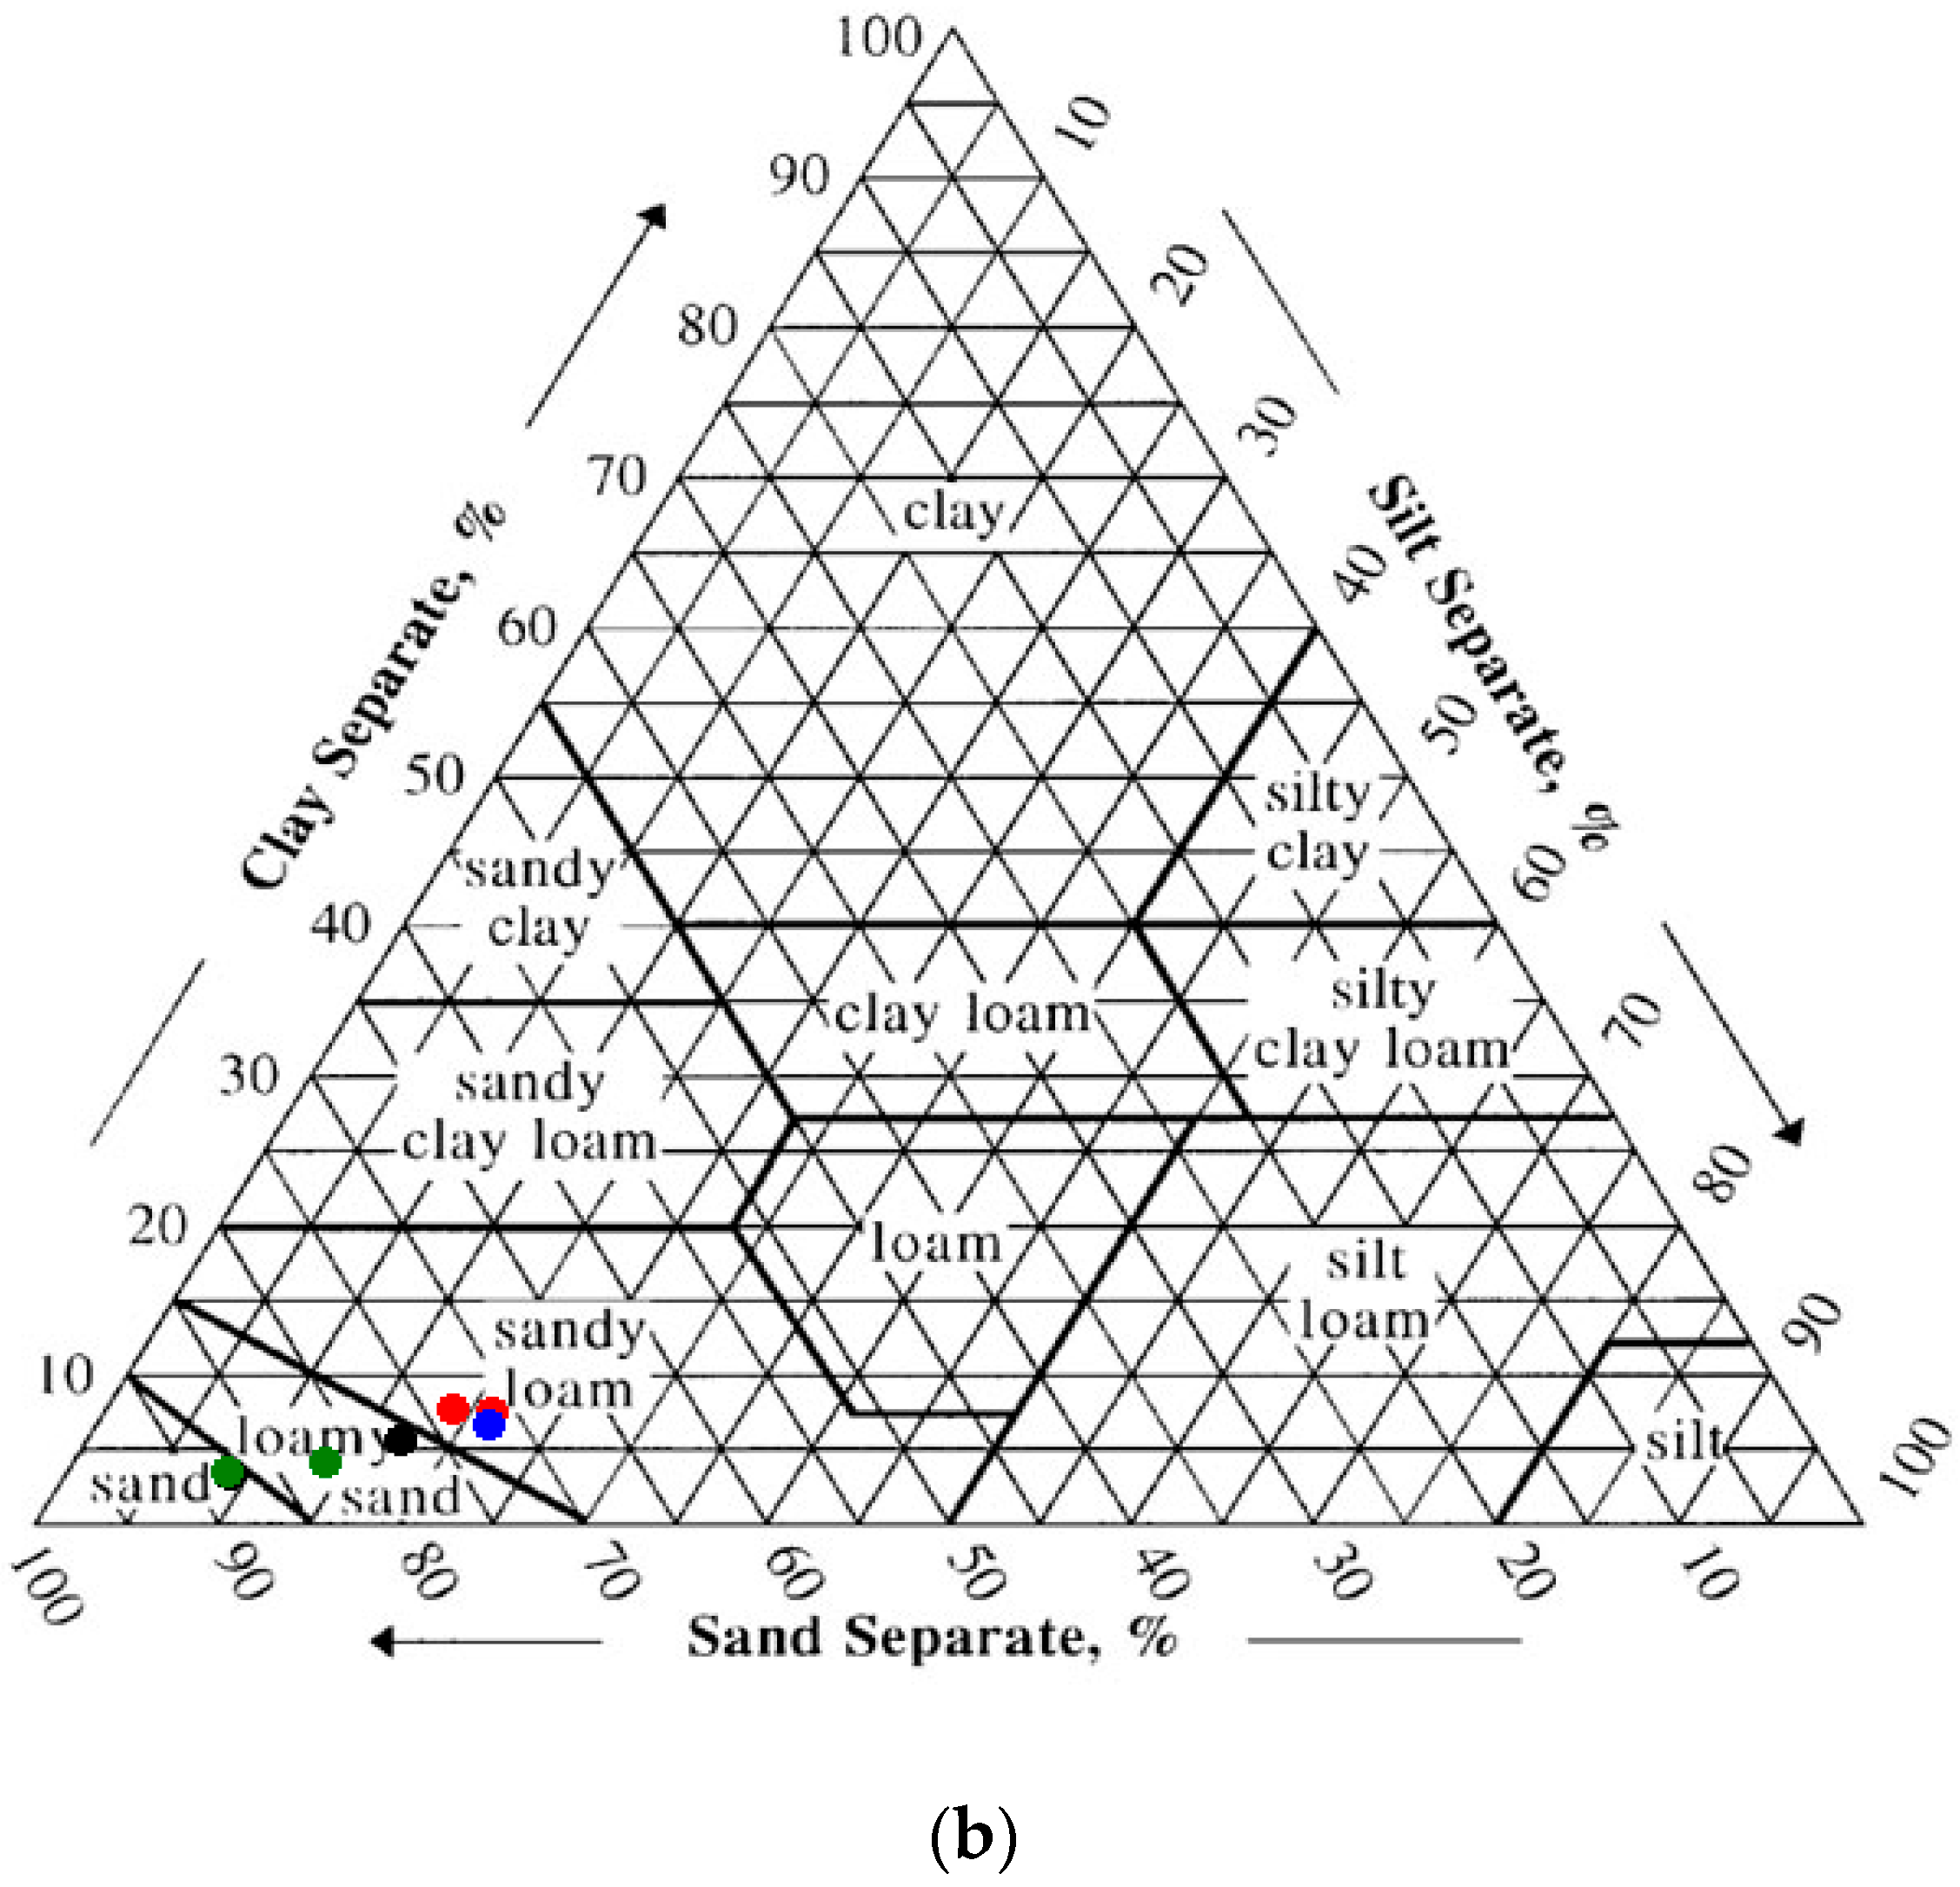
The sieving results showed gravel (>2 mm) fraction ranging from 3% to 36%. Depending on location, the >2 mm fraction was either true gravel (quartz and feldspar and lithic fragments) or anthropogenic debris (coal, brick and the like). The hospital complex on Ellis Island is built upon landfill sediments, therefore texturally most of the samples were poorly-sorted. The clay content of the soils ranged from 2.2 to 7.1%, with the vast majority of the samples containing around 4.5% clay (average 4.6 ± 1.8%). Using the NRCS soil texture calculator [39], 40% of the samples were classified as “sand”, 27% as “loamy sand” and 33% as “sandy loam” (
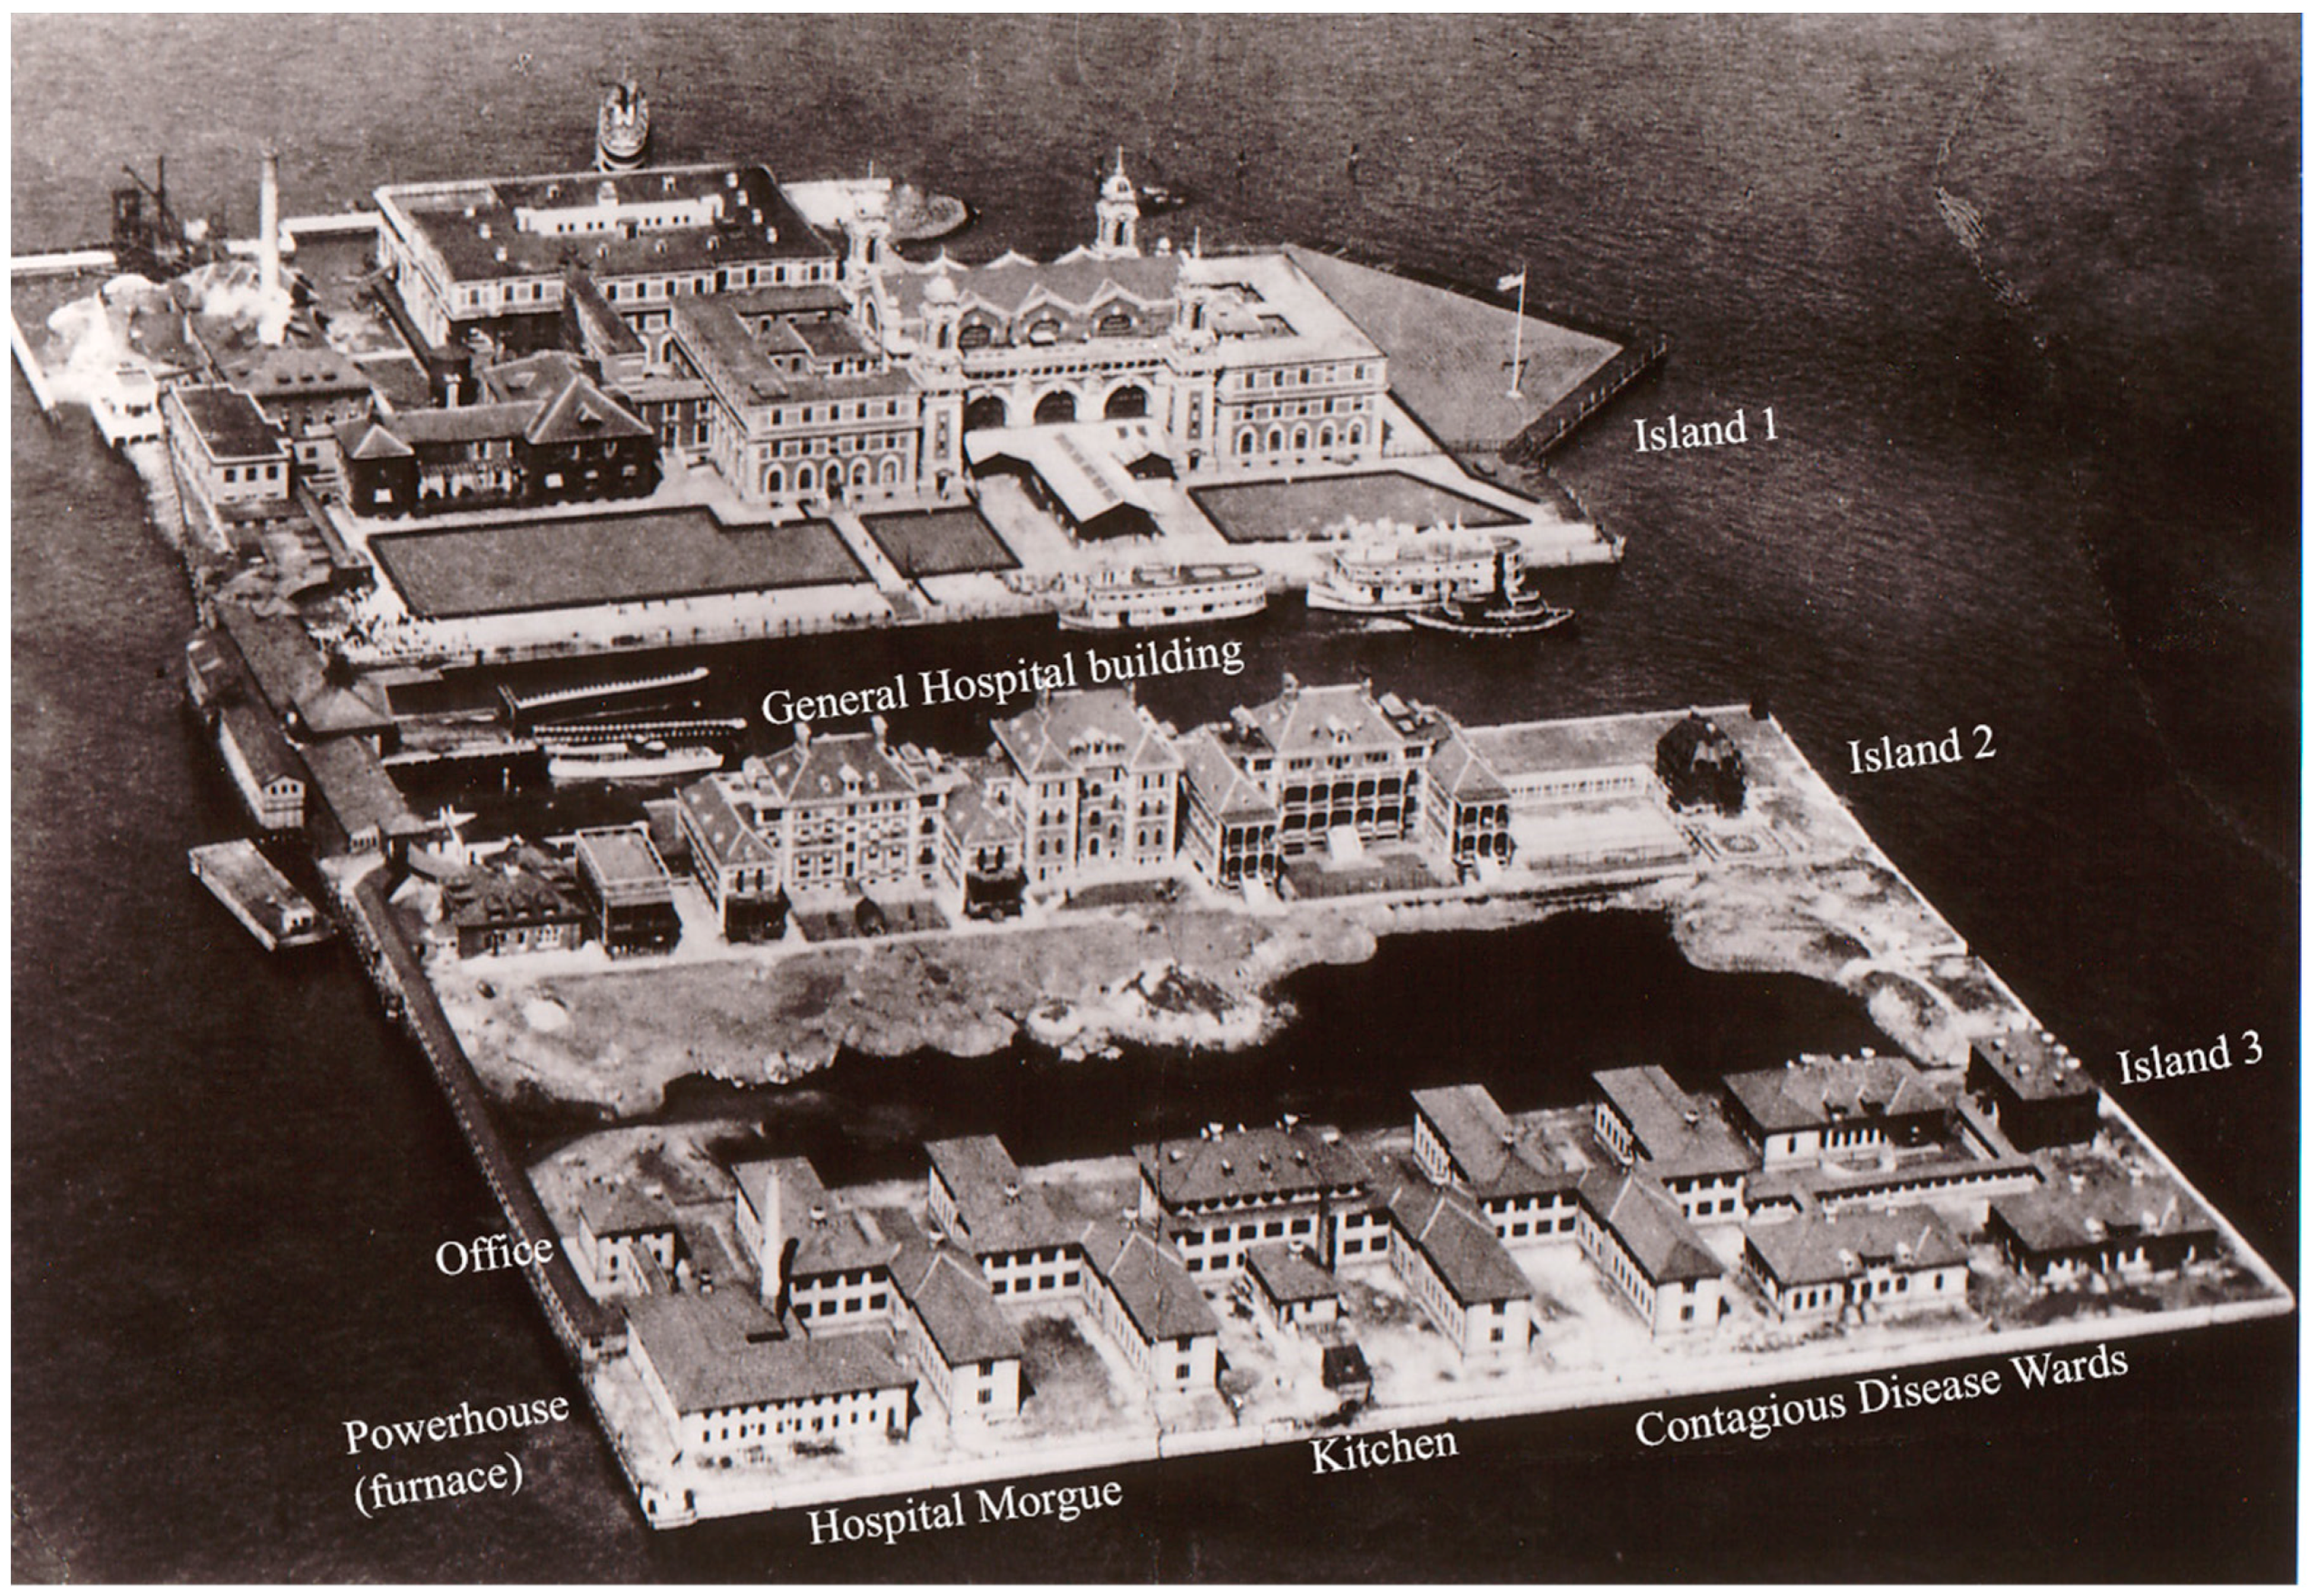
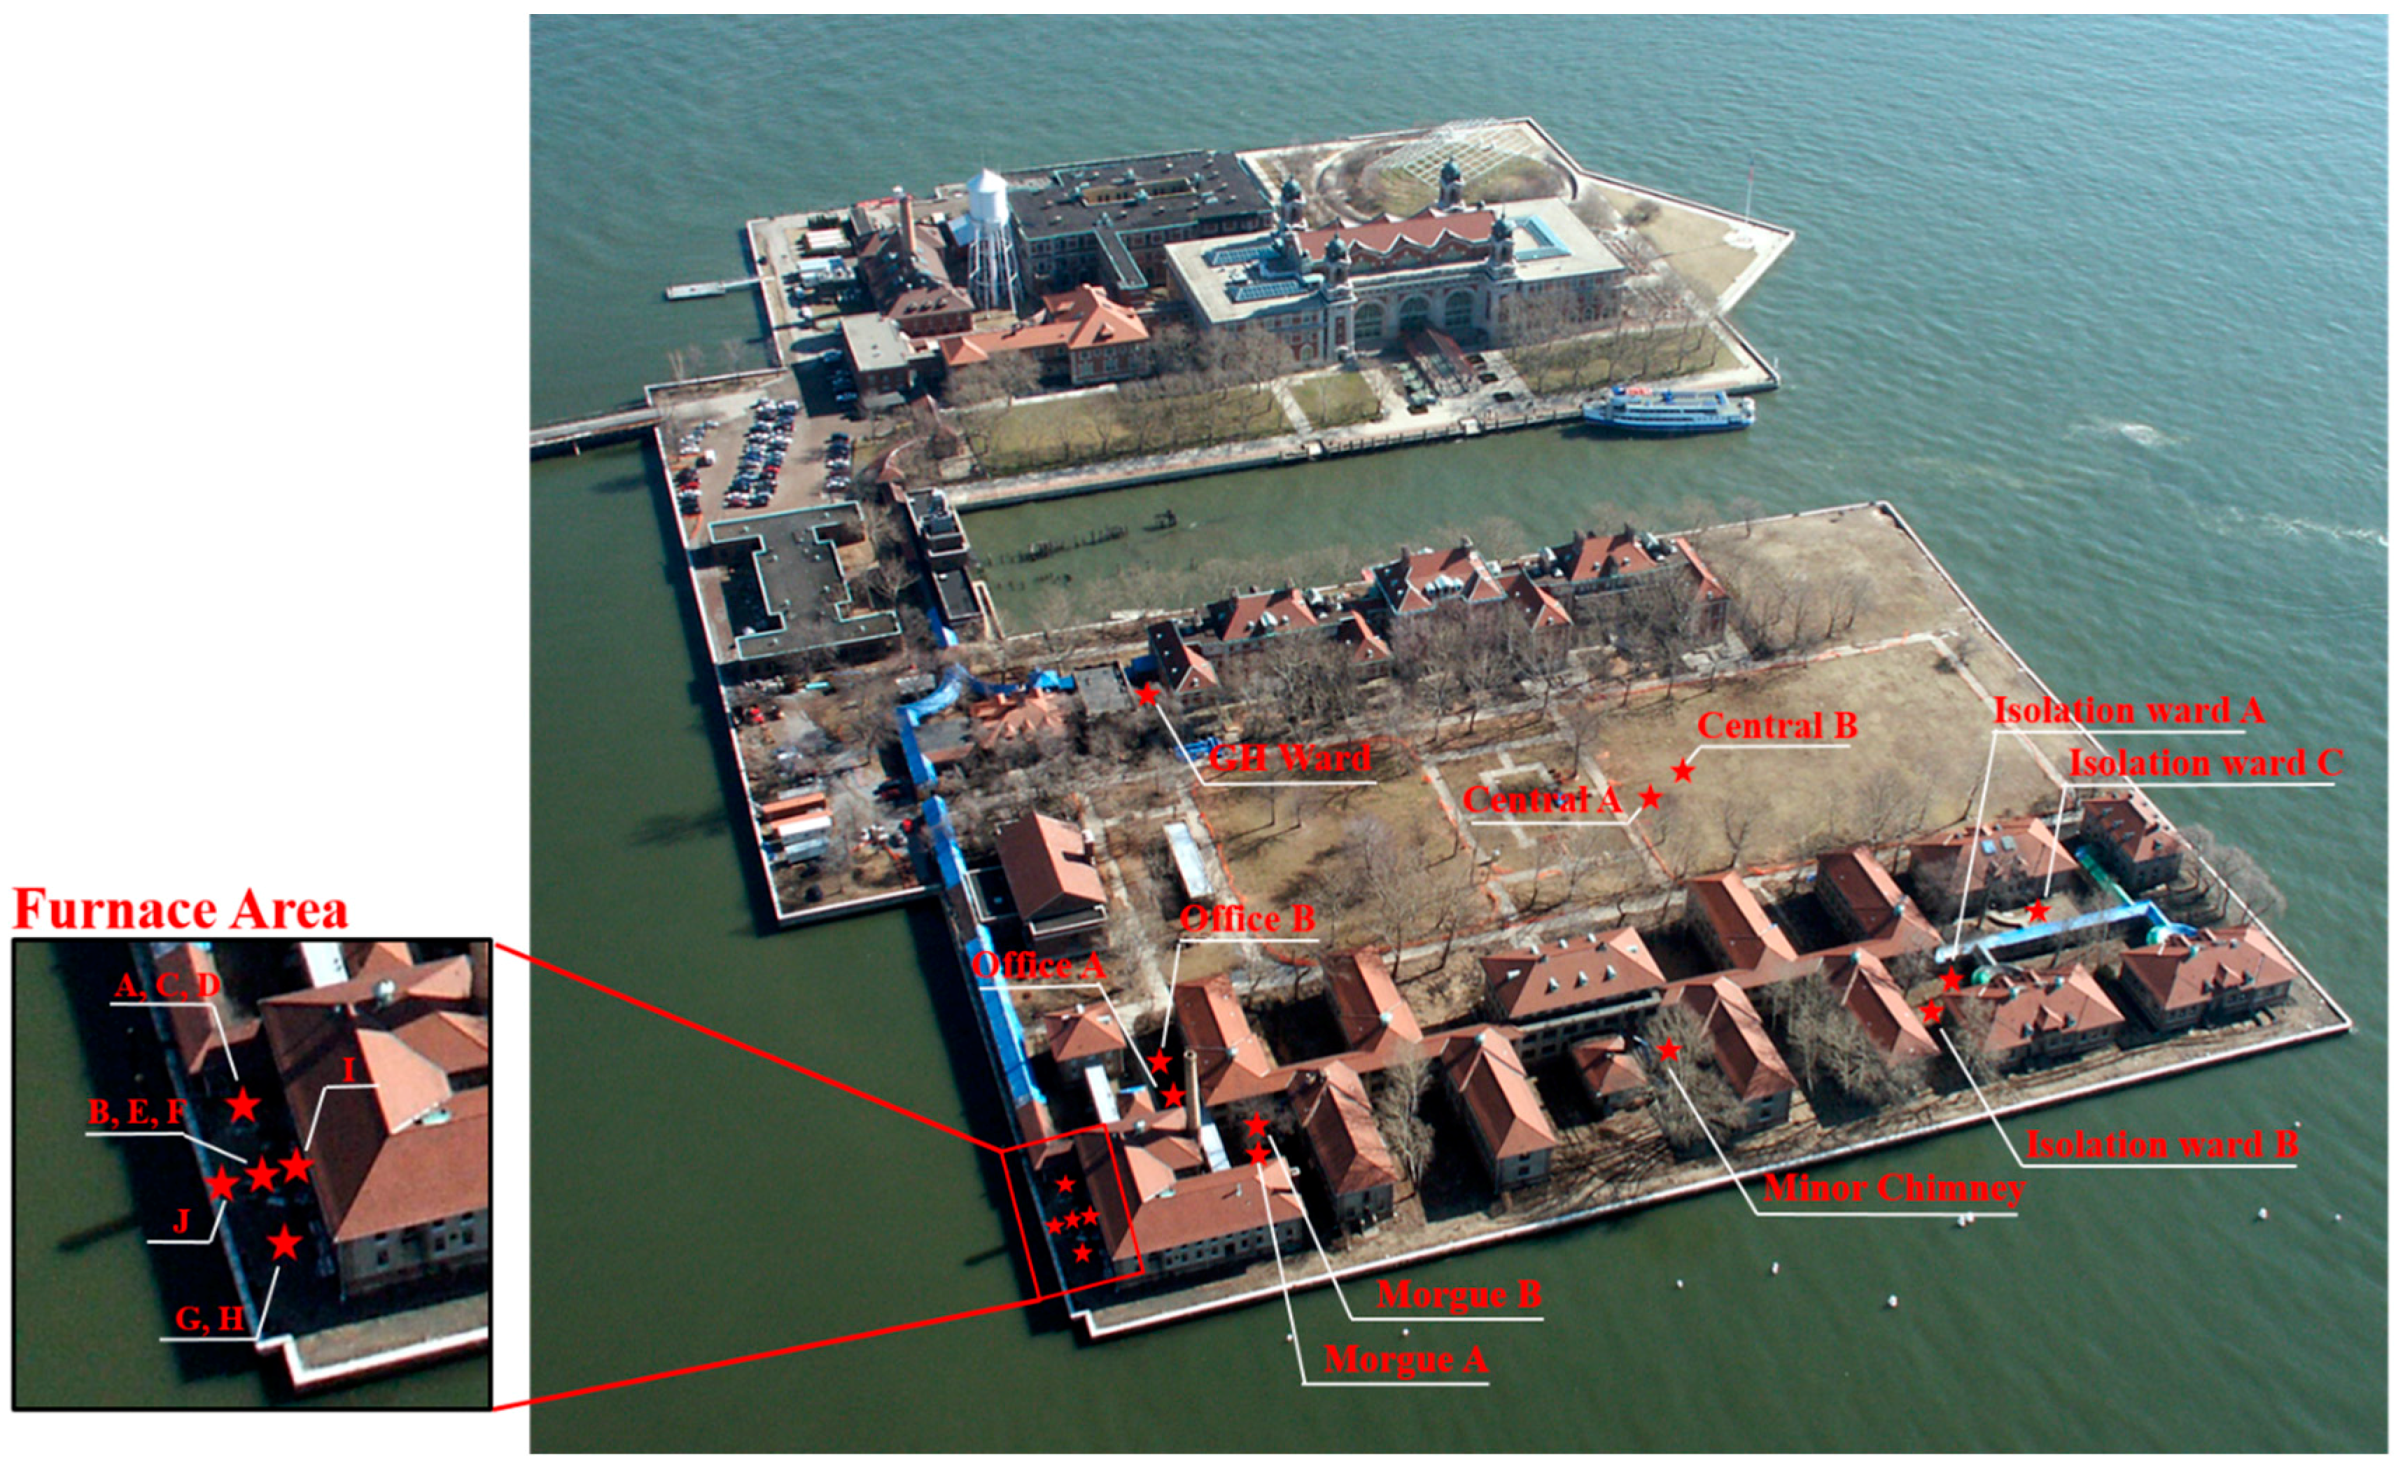
Figure 3a,b). The NRCS Web Soil Survey indicates that the Ellis Island Hospital Complex is underlain by “URWETB” or urban land, wet substratum, with a 0–8% slope [48]. The NRCS describes this soil as “asphalt over human-transported material and a coarse sandy loam” [48]. Nominally the depth to water table is approximately 50.8 cm. Soil texture and type affects surface area and particle size distribution, which in turn can affect soil chemical and biological activity.
The heavy metal dynamics in soil is intricate, and the bioavailability, mobility and toxicity of metals in the soil fractions are influenced by a multiplicity of factors, including the properties of both the soil and the metal. The affinity of Pb and other metals to clay fraction is stronger than silt and sand [49]. The presence of clays and hydrous Fe and Mn oxides in soils tend to increase metal adsorption and thus reduce soluble metal contents [50]. The downward migration of Pb and Zn in soil is slowed by the attenuative properties of clays, cracks in the soil peds as well as the biopores in the clays, which might be the main routes of the migration of these metals [51]. Clays as well as organic matter is the dominant soil constituent influencing adsorption of Pb [52]. Upon studying soil texture in relation to extractable concentrations of Pb and Cu, Qian and others found that metals were generally enriched in the clay fraction; whereas relatively large amounts of available Cu and Pb were noted in the fine sand fraction, they also noted that available Pb concentrations were also high in the clay fraction [53]. Al-Oud and others found that Cd mobility decreases with increasing amounts of iron oxide fractions; silt content and exchangeable Mg2+ in the soils; and showed that Cd mobility is higher in those soils with a high percentage of sand [54]. Additionally, Bloomfield has found that microbial action has also been observed to mobilize Pb, Zn and Cu from the carbonate and oxide residuals within soils [55] and Ernst established that solubility of metals was also enhanced by the acidification of the soil by bacteria [56].

3.2. Carbon, Nitrogen and Sulfur Composition in Ellis Island Soil

Carbon, nitrogen and sulfur are important nutrients for plants and microbes in the soil environment. The concentration of C, N and S are given in Table 4. All samples were run in duplicate with averaged relative percent difference of 0.9%, 2.0% and 3.7% for C, N and S, respectively. Soil total carbon, organic carbon and total nitrogen are some of the most importance factors that affect soil productivity and soil ecosystem functions [57].
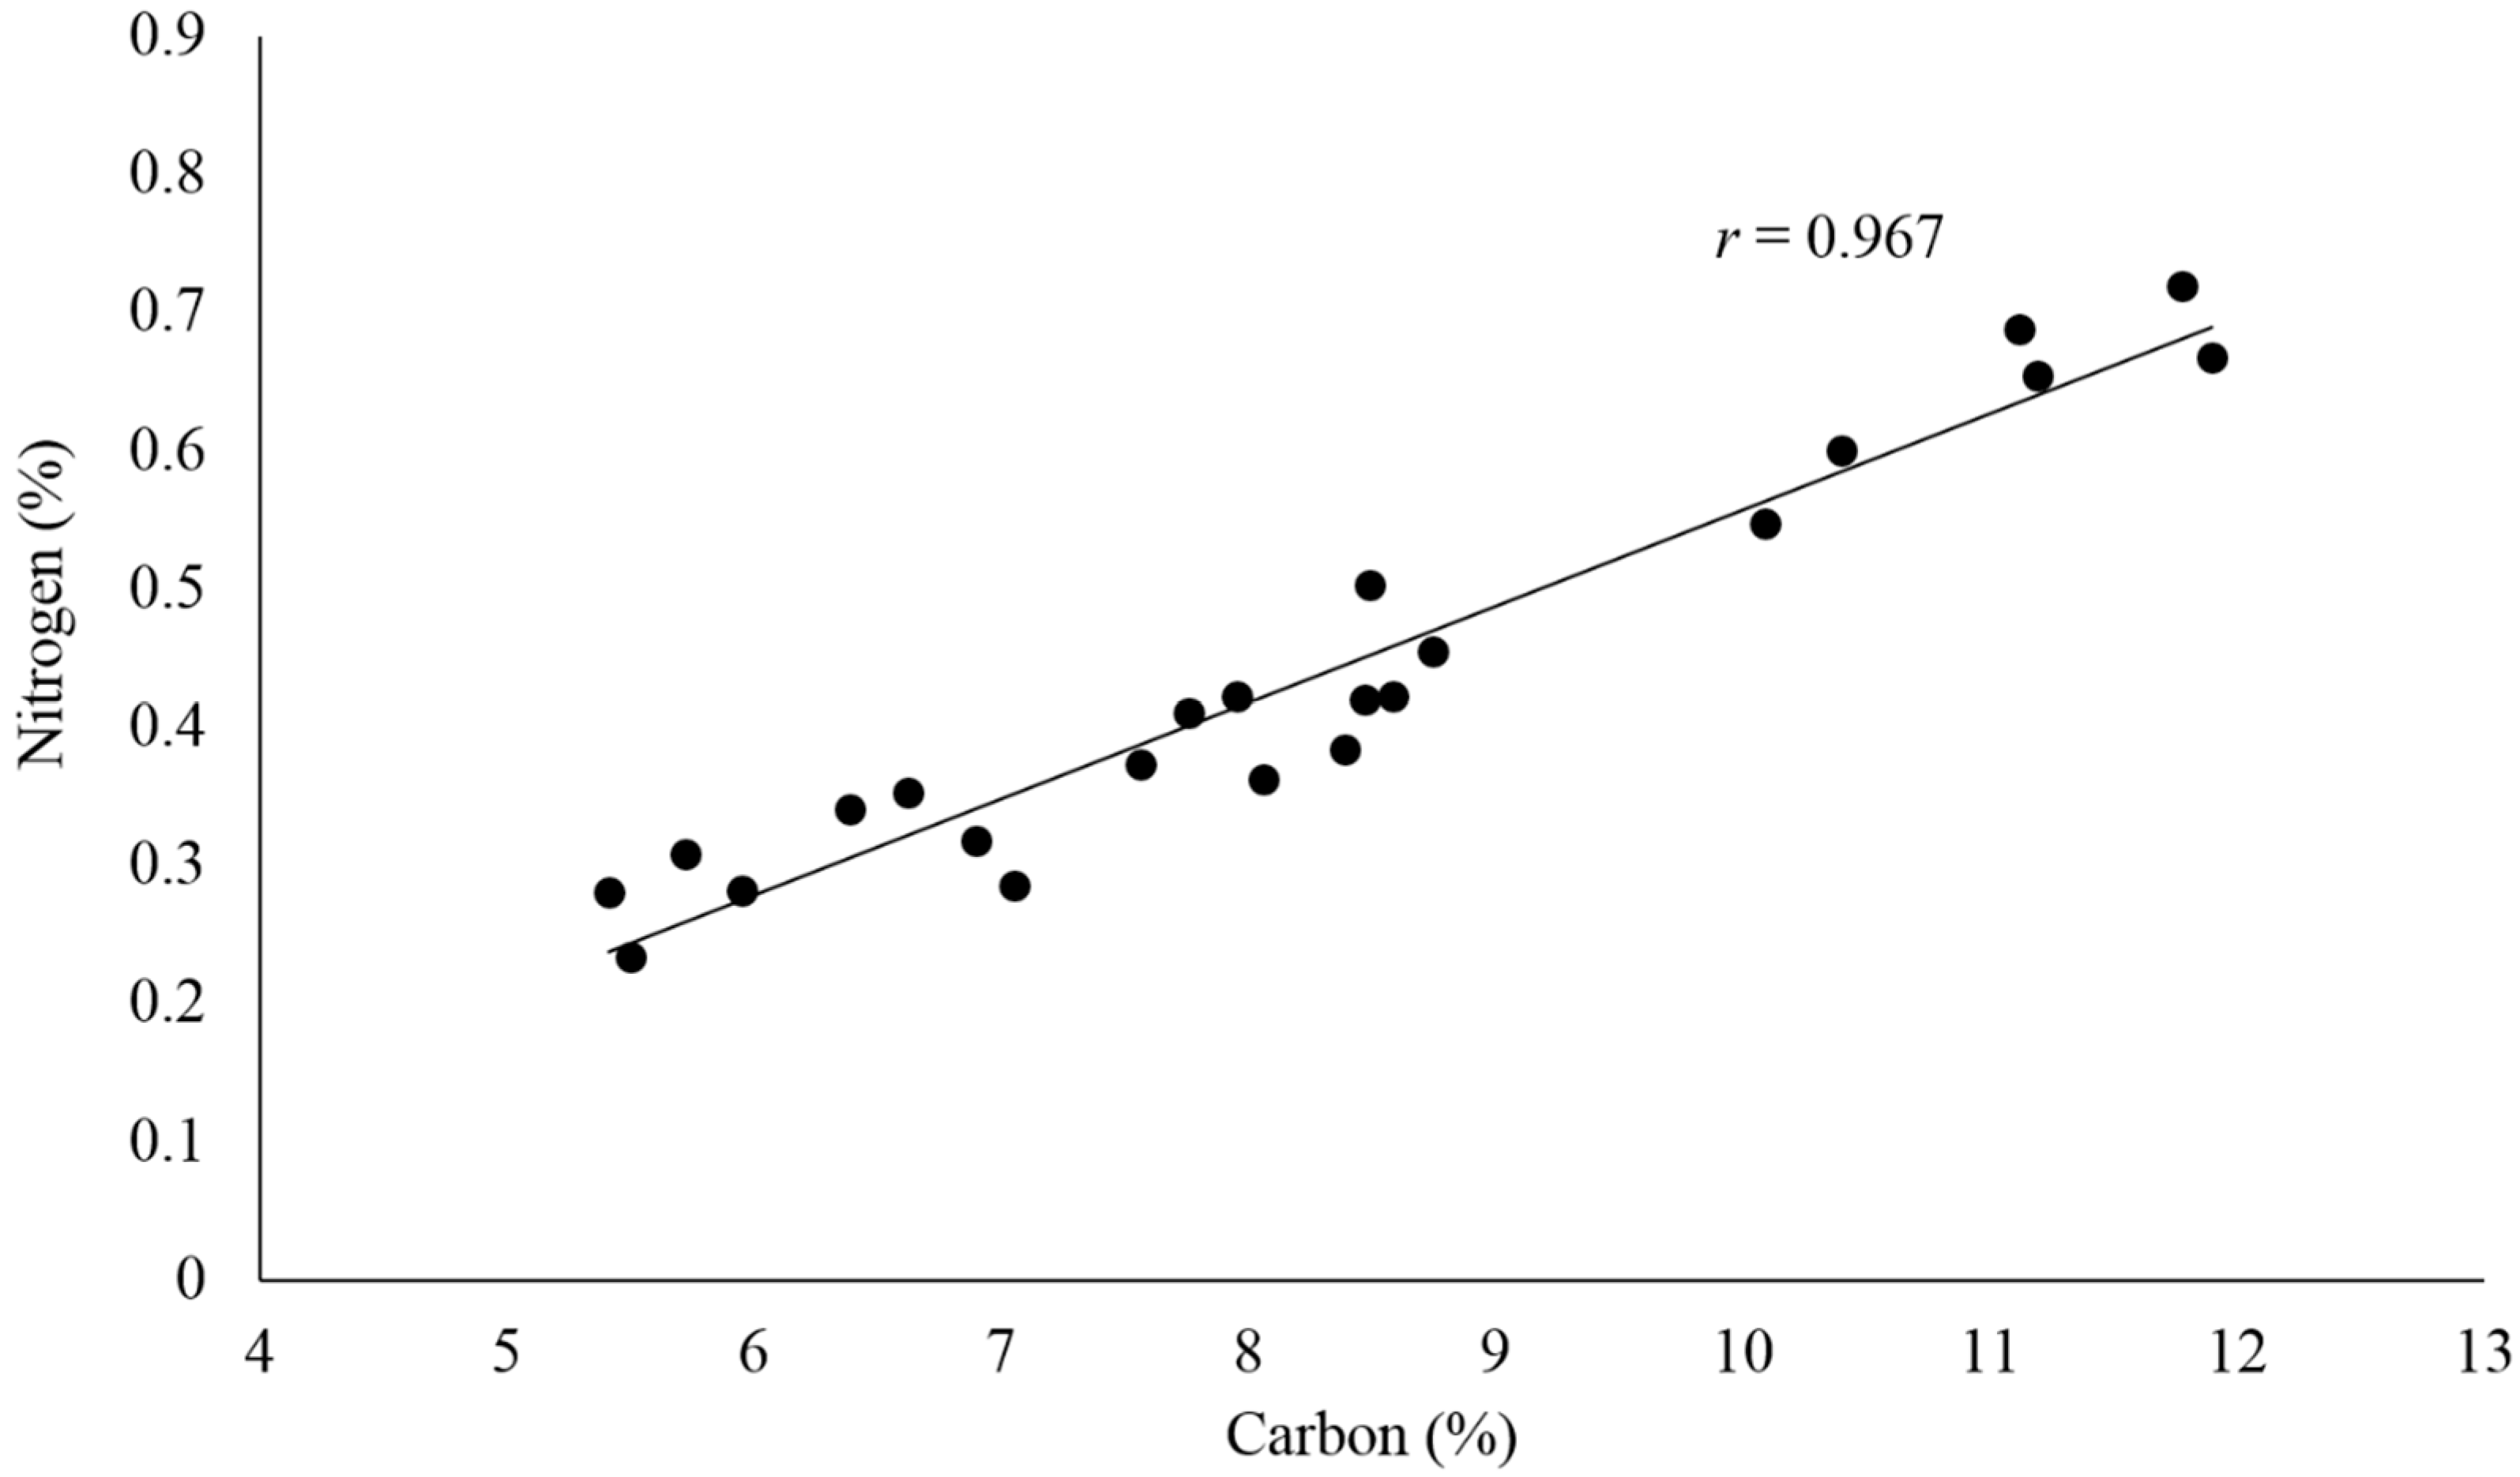
The total carbon content in the soil samples varied from 5.41% to 11.90%, with the highest values from an area that included the coal-burning furnace. The higher soil carbon may be the result of years of coal deposition and storage within the furnace area where the additional carbon could have entered the soil environment through runoff or combustion fallout. Assuming that the inorganic carbon in the soil was solely in the form of calcium carbonate, then the relative abundance of soil inorganic carbon was estimated based on the Ca concentration measured with acid extraction (see Section 3.3). The acid extraction efficiency for Ca was estimated to be 60% based on NIST 2711a. The inorganic carbon is thus calculated to contain up to 18% of total carbon in Ellis Island soil, with an average of 6%. The inorganic carbon content was significantly higher in the furnace area than other sampling areas (p < 0.01), which is consistent with the area being a coal deposition and burning locality.
From the above estimation, the carbon in Ellis Island soil was mainly organic (>82% of the total carbon). There was a significant linear correlation (r = 0.967) between the total nitrogen and carbon in the soil samples (Figure 4). This agreed with earlier studies [58,59] and further suggests that organic matter decomposition was the main source of carbon and nitrogen in Ellis Island soil. Soil organic matter provides energy and essential nutrients to the soil ecosystem through the decomposition process, which is mainly regulated by soil microbes that utilize both organic carbon and nitrogen [60,61]. The C/N ratios for most of the Ellis Island soil samples were measured to be around 20:1, slightly lower than the optimum value of 24:1 that microbes need for metabolic processes. This suggests that the microbial mineralization of nitrogen may be prevalent in the soil environment, which will facilitate the conversion of inorganic nitrogen from its organic form and make it readily available to plants [62,63].
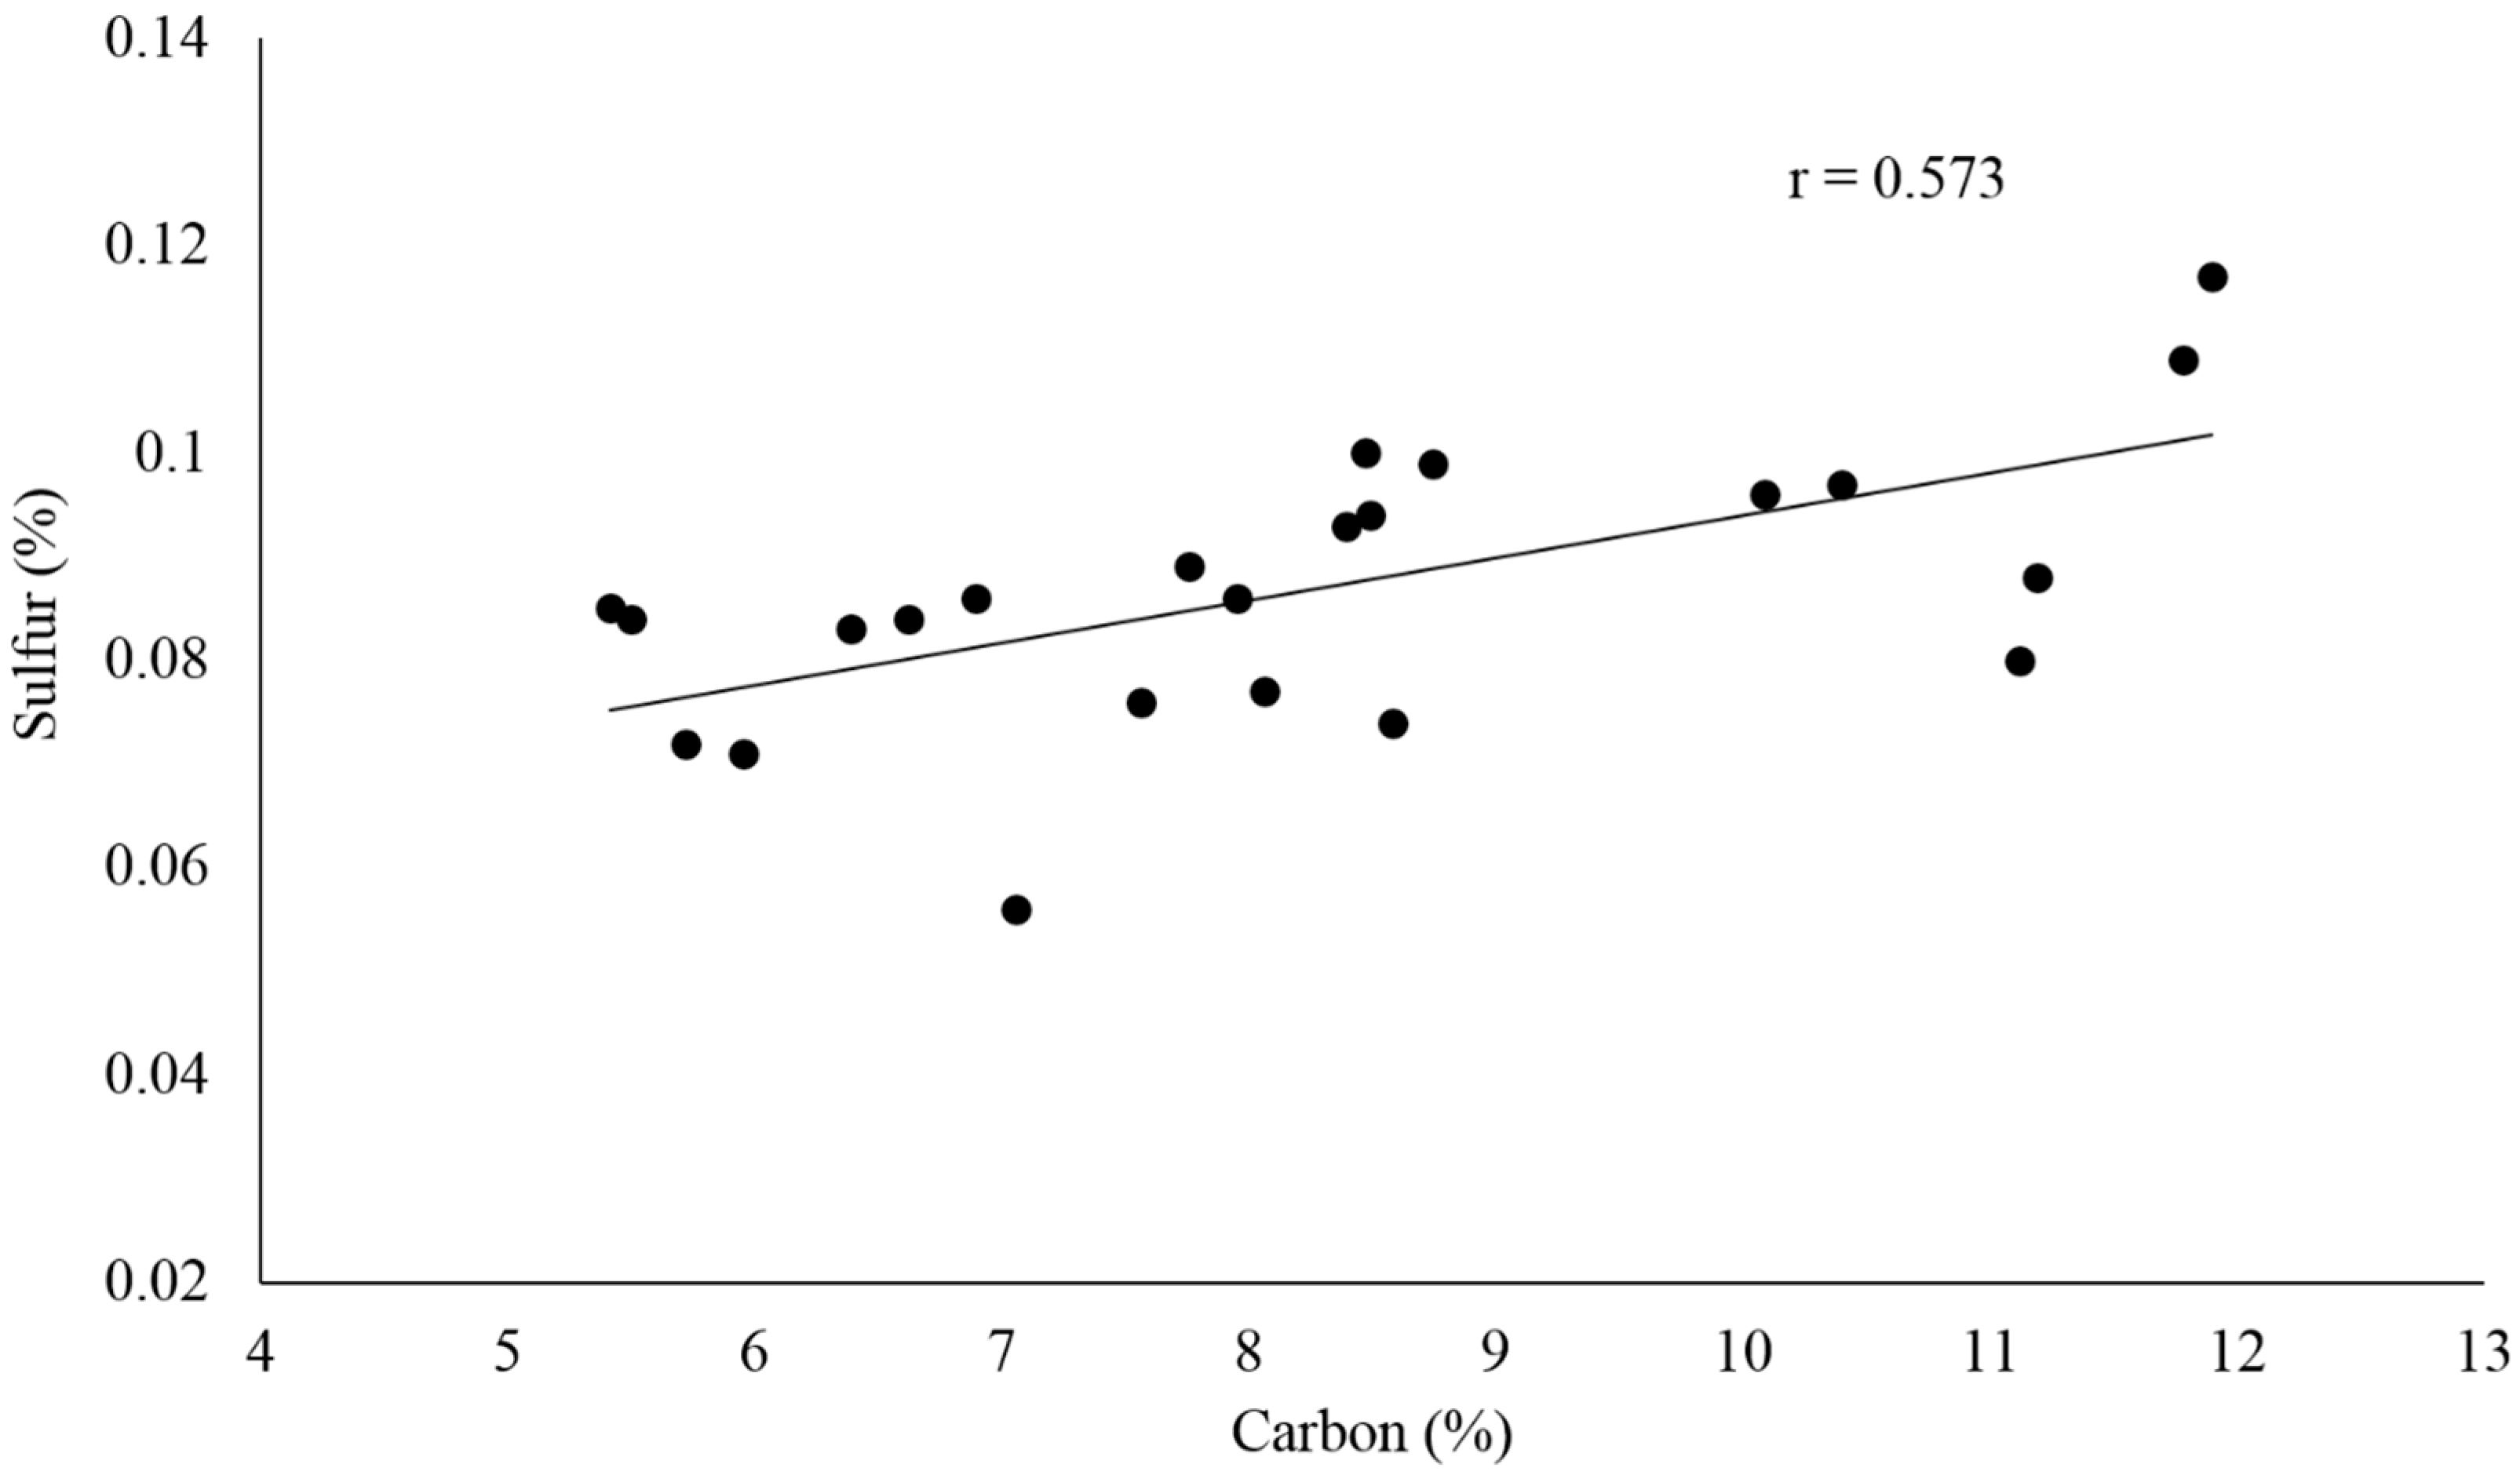
Sulfur is an essential element for plants and microorganisms. Typically, approximately 95% of sulfur in soil is found in the organic matter and thus sulfur tends to be highly correlated with organic carbon and total nitrogen [64,65]. Sulfur becomes bioavailable as sulfate when the organic matter breaks down through the mineralization process, which is affected by the C/S ratio of the organic matter, temperature and moisture. Whereas C/S ratios < 200:1 favor the sulfur mineralization which makes sulfur bioavailable, C/S ratio > 400:1 favor the immobilization process [66]. The distribution of sulfur in Ellis Island soil samples ranged between 0.056% and 0.117% with an average of 0.087% ± 0.013%. Its weaker linear correlation with carbon (r = 0.573) suggested that the source of sulfur in Ellis Island soil could be organic matter with possible mixing with inorganic carbon (Figure 5). The C/S ratios in all soil samples averaged at 94:1 with the lowest value found in Central B (C/S = 64:1) and the highest near the hospital powerhouse in Furnace D (C/S = 127:1), possibly due to inorganic carbon addition from coal. Assuming the majority of carbon in Ellis Island soil was in the form of organic carbon, the relative low C/S ratio would indicate the soil environment favors the sulfur mineralization process, which provided bioavailable sulfate to the essential life processes of plants and microbial communities [66].

3.3. Acid Extractable Major and Heavy Metals in Ellis Island Soil

EPA Method 3051 was designed to maximally release the acid extractable phase of the metals without dissolving the refractory portion of the sample [67]. The method provides a rapid and efficient way to assess the mobility and bioavailability of trace metals in environmental samples while largely reduces the matrix effect in the digest [68]. In this study, NIST standard reference material 2711a was analyzed as a recovery check. The acid extractable metal concentrations of 21 soil samples are shown in Table 5.
As major elements in soil, the average concentrations of Mg and Ca were considerably higher in the furnace area soil samples (0.85 ± 0.29%, 1.69 ± 0.49%, respectively) compared to other locations (0.39 ± 0.16%, 0.47 ± 0.35%; p < 0.005). The coal-burning activities during the functional years of the powerhouse might explain the higher Ca and Mg levels in the surrounding soil. The major source of coal supply to New Jersey in the early 1900s were Pennsylvania, West Virginia and Virginia [69,70,71]. Coal production in West Virginia and Pennsylvania was from the Late Pennsylvanian age Monongahela Group, specifically the Pittsburgh Coal Seam, the most laterally extensive and the largest seam in the Appalachian basin [70,71]. The soil Ca and Mg near the furnace might have come from coal balls and other concretions that are associated with these Carboniferous age coal deposits, which contain high concentrations of calcite and dolomite [72]. Additionally, both elements are in greater proportion than other trace metals in coal itself as well as in combustion products (fly and bottom ash) [73,74].
The acid extractable heavy metal concentration reflects the portion in soil that can be mobilized and become bioavailable, they also provide useful information regarding the chemical partitioning of elements in soil matrix. High acid extractable heavy metal concentration in soil can be concerning as it poses potential risk to plants, soil microorganisms and humans. In this study, Ecological Soil Screening Levels (Eco-SSL) for plants and microbes from the NOAA Screening Quick Reference Tables (SQuiRTs) were used to evaluate the acid extracted heavy metal concentrations in Ellis Island soil samples [75]. Eco-SSL values are the safe limits of concentration of contaminants that ecological receptors commonly come into contact within soil or ingest through biota that live in or on soil [76]. Although the Eco-SSLs are not purposed to provide a guideline for contaminant cleanup, these values are useful for the assessment of potential ecological risk from the contaminants. New Jersey background metal concentration in soil as well as soil cleanup criteria from New Jersey Department of Environmental Protection (NJ DEP) were also incorporated in the discussion to assess the ecological impact of the metal concentrations in soil [77,
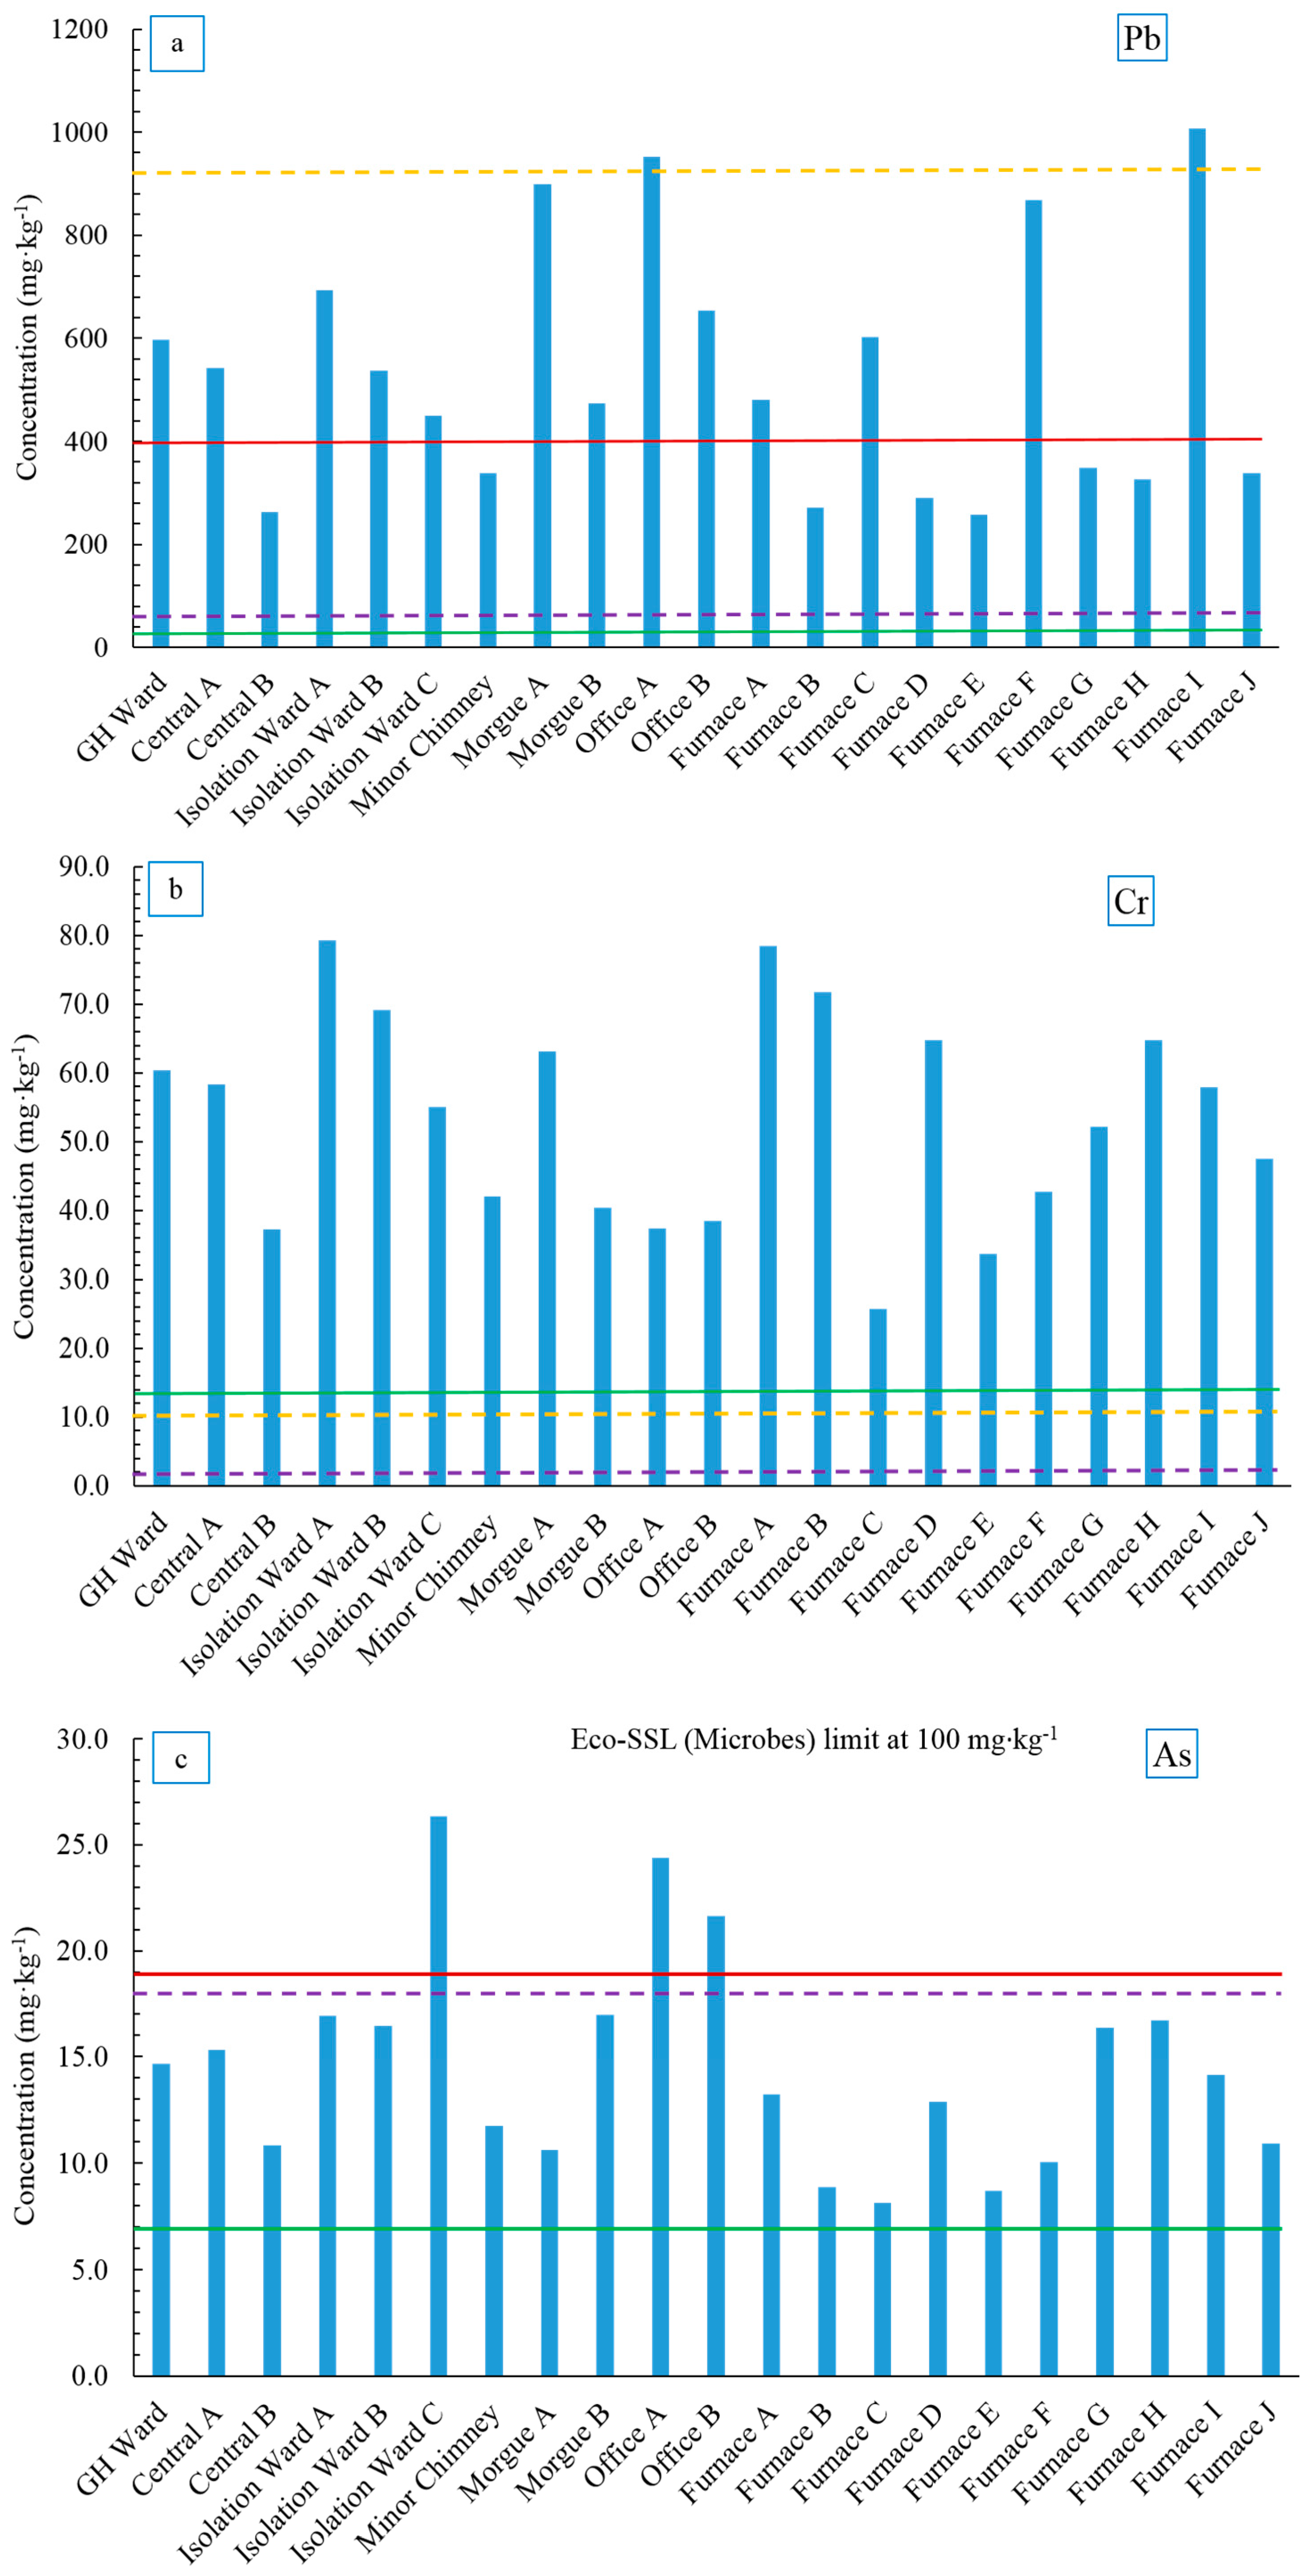
78]. Note that although the Eco-SSLs are based on total soil metal concentration, with the exception of Cr, all heavy metals extracted with EPA 3051 method showed good recovery from 95% to 100% (Cu, As, Cd and Pb). Concentration profiles for these heavy metals are compared to Eco-SSLs (Plants and Microbes) and NJ background values are shown in Figure 6a–e. The NJ DEP soil cleanup criteria are summarized in Table 6, as can be seen except for As and Pb, the guidelines levels are well above the amounts of heavy metals found in all Ellis Island soil samples.
Lead is a toxic heavy metal that persistently accumulates in the soil environment. The average Pb concentration in the Ellis Island soil samples was above the NJ Pb soil background level (533 ± 239 mg·kg−1 vs. 35 mg·kg−1). There was much variation in the concentrations observed between the samples (Figure 6a). Lead concentration in all samples exceeded the Eco-SSL value for plants (50 mg·kg−1) but was within the value for microbes (900 mg·kg−1) except for Office A and Furnace I (952 mg·kg−1 and 1008 mg·kg−1, respectively). Thirteen out of 21 soil samples had Pb concentrations higher than the NJ soil cleanup guideline. As noted earlier, lead arsenate insecticide was used on the island prior to being abandoned, which may account for the high Pb levels. Another possibility was the use of leaded paint in the past, which contained lead acetate prior to about 1977. Flakes of paint have likely contributed Pb to the soil, particularly near the buildings. Lead has low mobility in soil as it tends to complex with soil organic matter, Fe and Mn oxides or precipitate with phosphates, sulfates and carbonates [79,80]. When in soil, Pb from lead arsenate is likely converted to more insoluble compounds, such as lead hydroxide and lead phosphate, which then become immobilized in the soil [81]. Therefore, the heterogeneous Pb distribution in Ellis Island soil could be the combined results of insecticide application, use of leaded paint and low Pb mobility in soil.
Chromium is considered a micronutrient element to humans as it involves in the action of insulin, however higher level of Cr, especially Cr (VI) exerts toxicity and carcinogenicity to humans [82]. In the soil ecosystem, Cr is phytotoxic to plants and adversely affects enzyme activities in soil microorganisms [83,84]. Chromium continues to increase in the environment due to anthropogenic inputs, such as disposal of Cr-containing products, coal fly ash, bottom ash and emissions from metal processing facilities [85]. The acid extractable Cr concentrations in Ellis Island soil were higher than NJ background soils (13.9 mg·kg−1, Figure 6b) and were also significantly higher than the Eco-SSLs for both plants and microbes (1 mg·kg−1 and 10 mg·kg−1). The highest Cr concentration was found in Isolation Ward A (79.3 mg·kg−1) and the lowest was found in one of the Furnace samples (Furnace C, 25.7 mg·kg−1), although the rest of the furnace soil samples showed similar Cr levels as other areas (33.7–78.5 mg·kg−1) in the complex. The low extraction efficiency for Cr (~31%) might due to the presence of insoluble Cr minerals such as chromospinels and chromites [86], which further indicated the majority of the Cr in Ellis Island soil was not bioavailable. Though the source of overall high Cr on Ellis Island soil is not yet clear, it is possible that it could be from the disposal of fly ash and bottom ash from the coal-burning furnace in the powerhouse, which would contain high levels of Cr. In fact, fly ash and bottom ash disposal is the second largest anthropogenic source of Cr to the environment [85]. Another possible source could be the landfill materials that were used to form the southern part of Ellis Island. Landfill sediments could have contained a higher Cr concentration , since Jersey City and its environs around Hudson County was, between 1905 and 1976, a center for chromate and dichromate chemical manufacturing, which received chromite ore from around the world [87]. Over 2 million tons of residue from chromite ore processing was generated during that period and was disposed across Hudson County, NJ [88]. The toxicity of Cr in the soil environment largely depends on the mobility and solubility of the presenting Cr species (Cr0, Cr3+ and Cr6+), in neutral or basic soil environment, Cr predominantly present in the tetravalent form as Cr(OH)3, which has very little mobility and solubility in water, hence limited bioavailability [85,89]. Therefore, Ellis Island soil might not pose a risk to the plants and microbes even with observed high Cr levels. However, further speciation analysis is needed to determine the fraction of Cr (III) and Cr (VI) in the Ellis Island soils to achieve a full evaluation of Cr risk to the Ellis Island soil environment.
Arsenic is a well-known non-threshold carcinogen to humans and can largely affect soil quality by influencing the nutrient cycling and soil biodiversity [90]. Ellis Island soil samples generally contained twice the amount of As found in NJ soil background (14.6 ± 5.0 mg·kg−1 vs. 7 mg·kg−1), though the average was still below the Eco-SSL value for plants (17 mg·kg−1, Figure 6c). Three soil samples (Isolation Ward C, Office A and Office B) showed As concentrations higher than NJ cleanup criteria of 20 mg·kg−1 (21.6, 24.4 and 21.6 mg·kg−1, respectively). The source of As is not clear; however, it is reasonable to speculate that As might have originated from anthropogenic sources such as coal combustion products emitted during the years when the hospital was functional and lead arsenate insecticides, which were introduced to Ellis Island in 1894 for the purpose of controlling gypsy moths [91,92]. Arsenate is the dominant As species in most soil environments, it can be immobilized by Fe, Al and Mg oxides in the soil or by bacterial interaction [93,94]. The nearly neutral soil pH also tends to limit As mobility, which might also account for the higher As level in Ellis Island soils [95,96]. The fact that the Eco-SSL value for microbes is at 100 mg·kg−1 is also a good indication that the microorganisms have a higher As tolerance than other species.
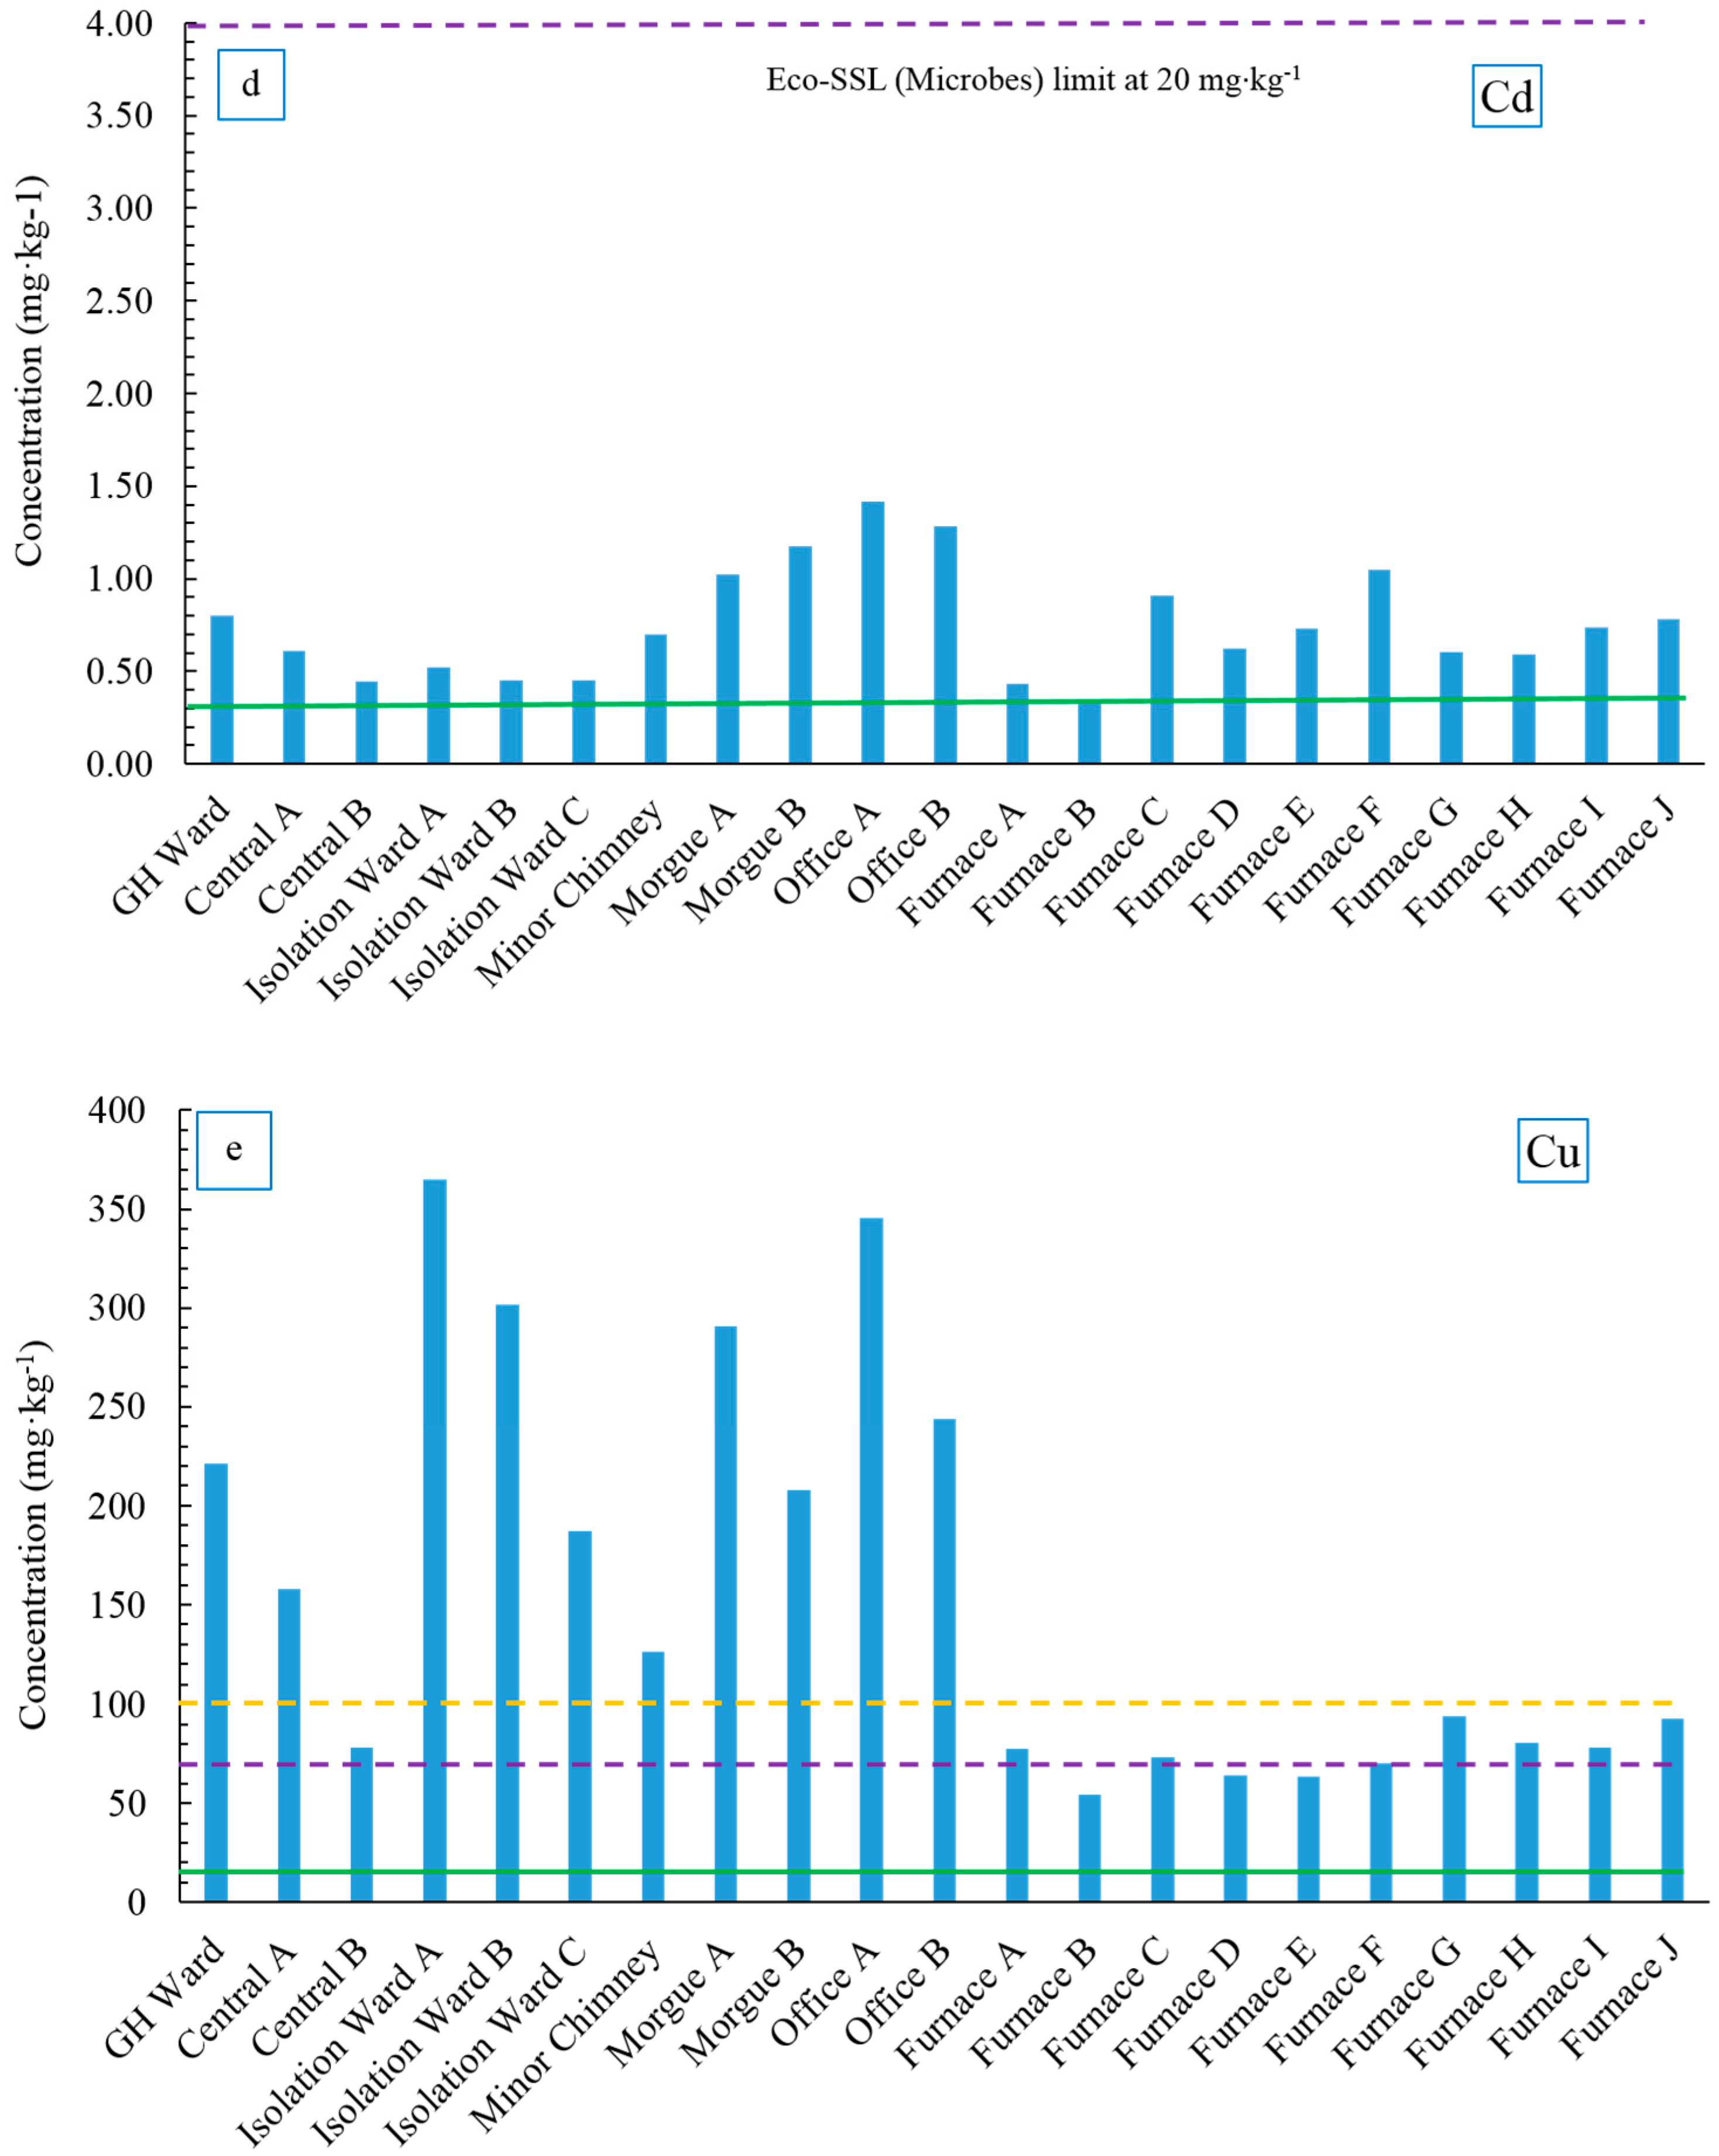
Cadmium negatively interferes with the uptake and transport of Fe, P and Mn in plants, causing stunting and chlorosis [97]. The toxicity of Cd can also influence the soil microorganisms and microbial processes, affecting their population and activities [98]. All acid extractable Cd concentrations in Ellis Island soil samples were well below Eco-SSLs for both plants and microbes (4 mg·kg−1 and 20 mg·kg−1, respectively, Figure 6d). Additionally, most soil Cd concentrations were close to the NJ Cd soil background value (0.3 mg·kg−1) with samples from the Office-Morgue area being slightly higher, which varied from 1.02 to 1.42 mg·kg−1. Cadmium has high solubility in water and therefore high mobility in the soil environment [99]. The sandy texture of Ellis Island soil could also result in close-to-background level Cd in the soil, since Cd mobility is higher in those soils with a high percentage of sand [54].
As a nutrient element, Cu shows toxicity to both plant and microbes at higher levels. Copper can adversely affect plant root growth and inhibit Fe uptake and cause stunting [100]. It could also adversely affect soil microbial biomass, activity and diversity because of its antimicrobial properties [101,102]. Copper concentrations were significantly lower in the furnace samples with an average concentration of 74.8 ± 12.5 mg·kg−1, whereas samples from other locations averaged at 230 ± 91 mg·kg−1 (p < 0.001) (Figure 6e). The average Cu concentration from the furnace area fell between the Eco-SSL values for plants and microbes (70 mg·kg−1 and 100 mg·kg−1, respectively), suggesting the soil near the furnace might provide a more hospitable environment for microbes to thrive; whereas the Cu concentration in most of the other areas exceeded the Eco-SSL for microbes. The cause of low Cu in the soil near the furnace area is unknown, as there is no obvious source altering the soil Cu concentration on the Island presently or even decades ago. However, certain soil bacteria might be the potential contributor to the Cu removal in soils that enhance the Cu mobility, bioavailability and the Cu accumulation in plants [103]. With further studies of the soil bacteria diversity and the Cu levels in plants from the area, the cause of low Cu in the furnace area might be determined.
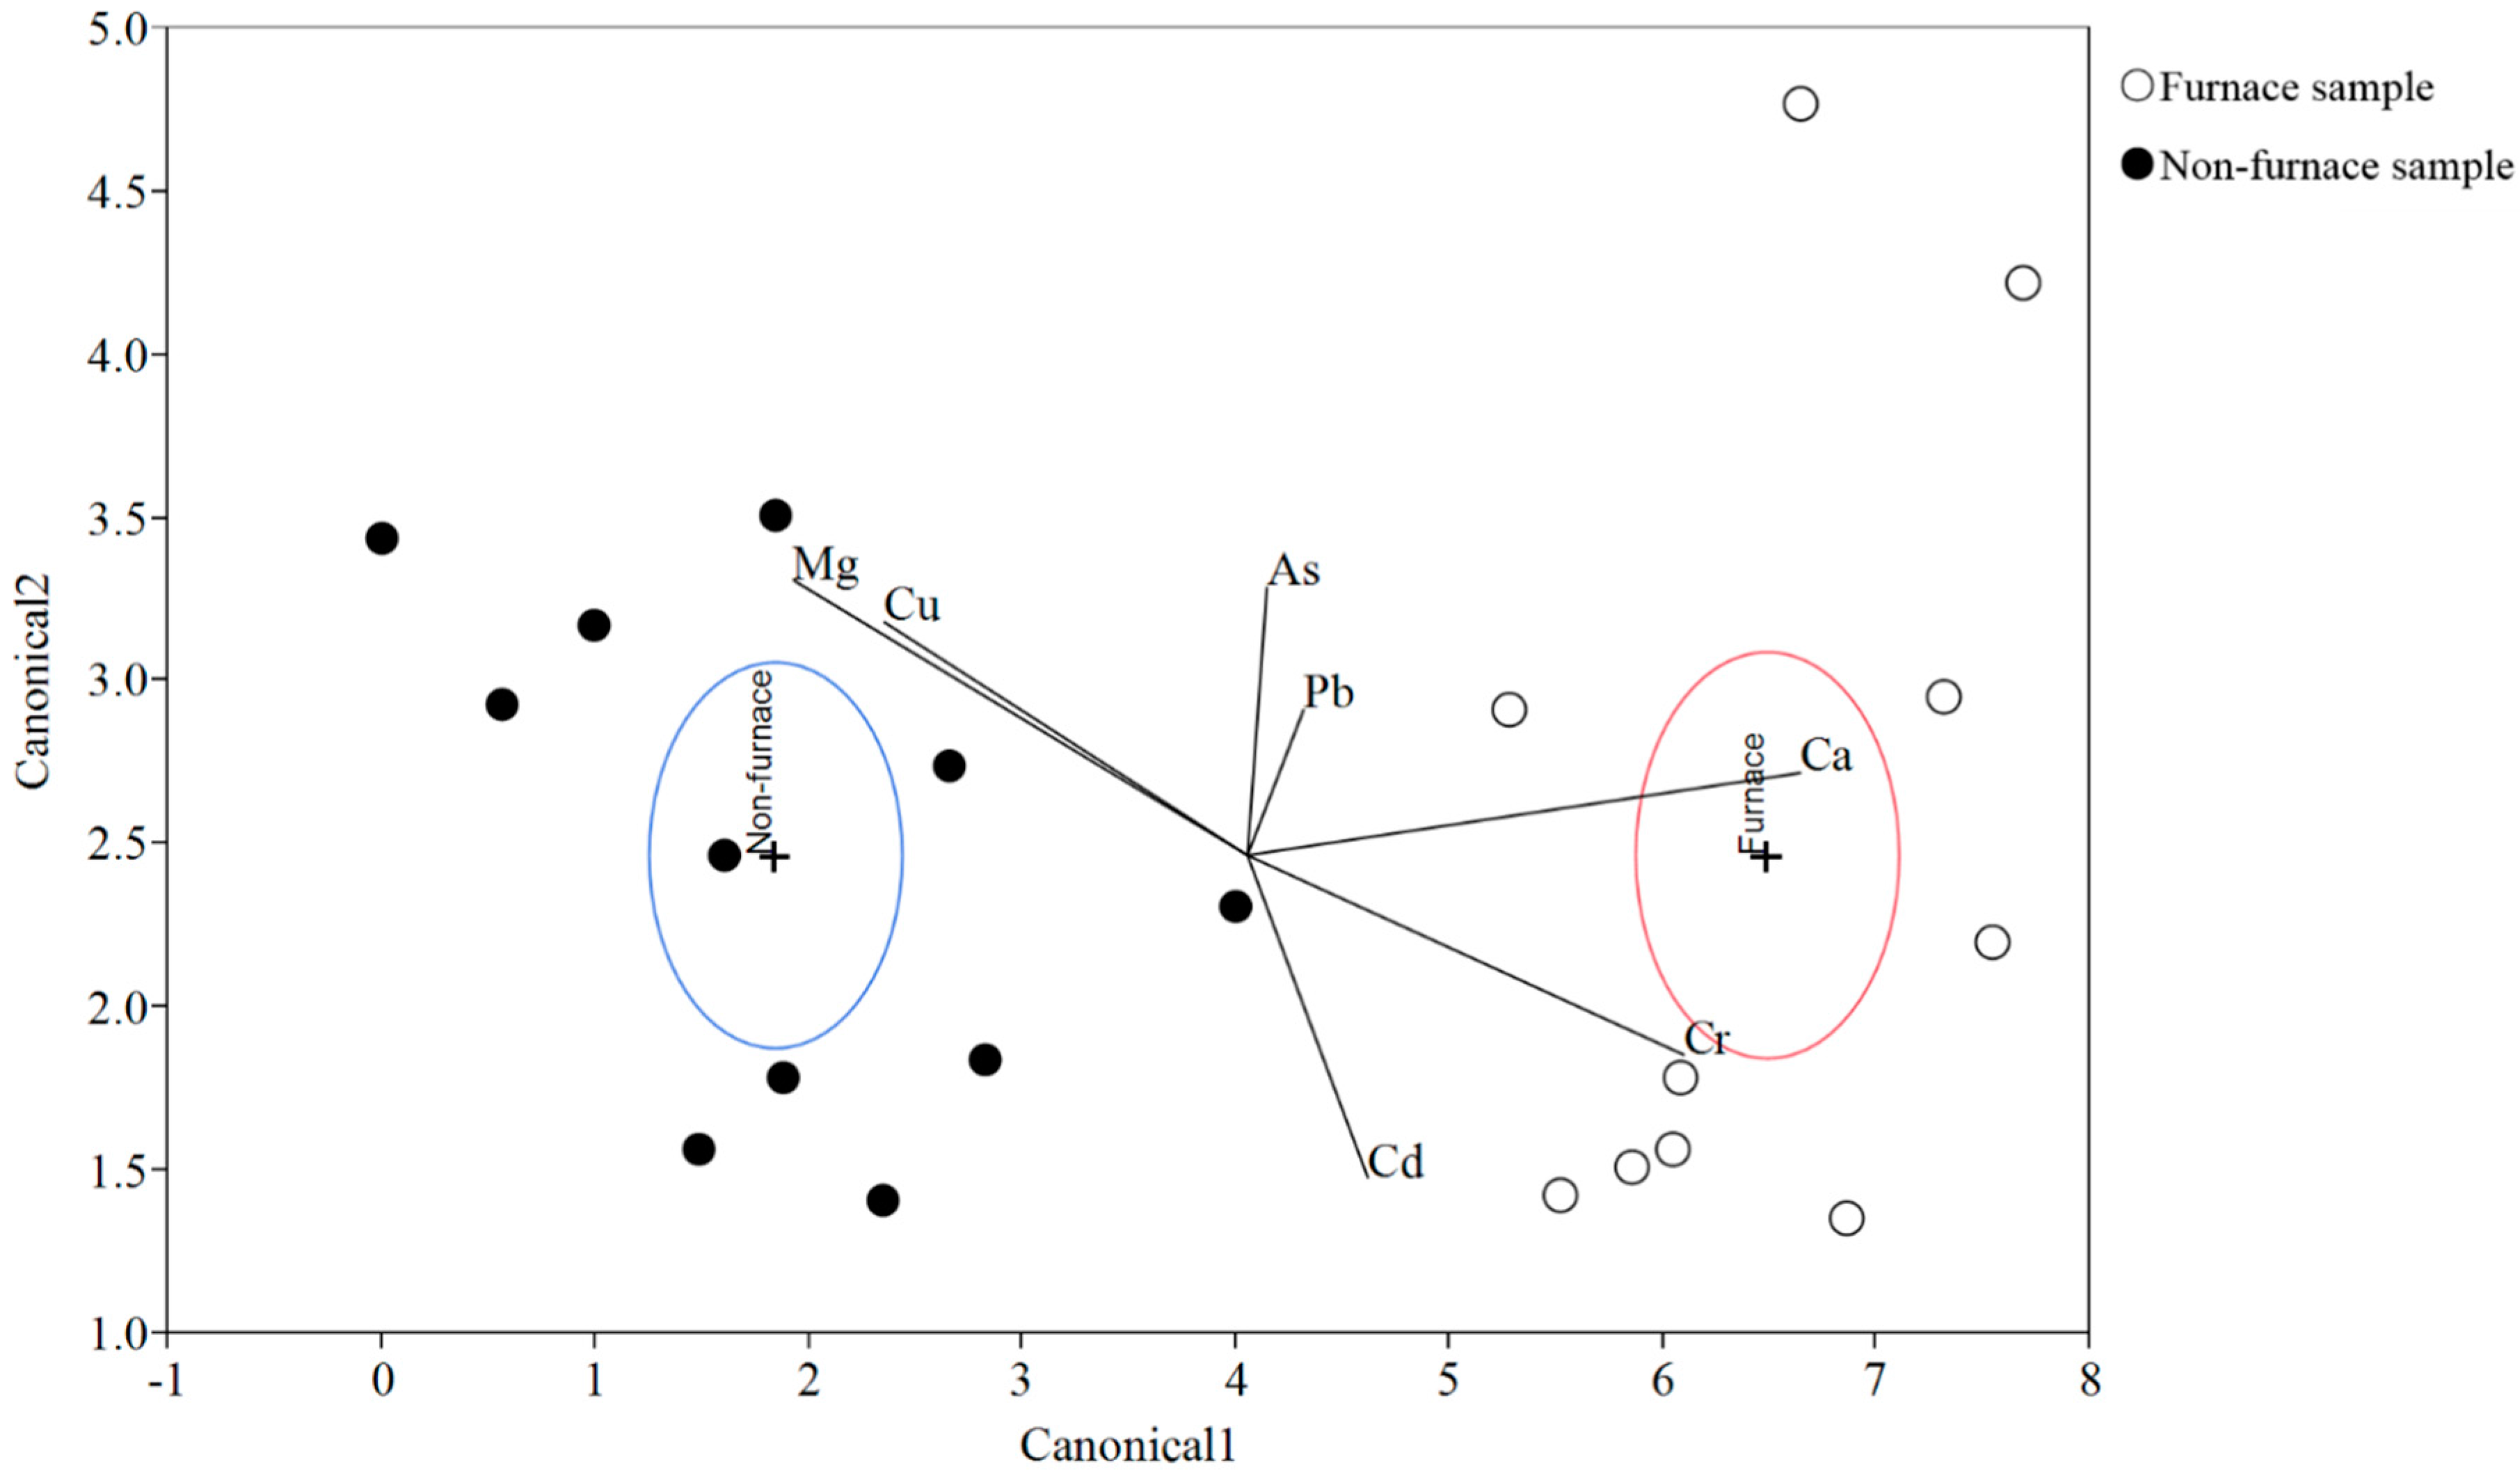
Discriminant analysis (DA) is a routine statistical technique which uses a set of linear combinations of quantitative variables to reveal the among-group differences. DA was performed in this study because the soil samples from furnace area had shown distinct metal profiles from those non-furnace samples. The DA results (Figure 7) suggested that wthin a 95% confidence level, the means of the two groups, furnace samples and non-furnace samples, were statistically different. No sample was misclassified. The biplot rays further showed that the two groups were mainly discriminated along the first canonical variables (canonical 1), in which Ca, Mg and Cu were the dominant elements. Arsenic and Pb, Cu and Mg were strongly correlated, respectively, which indicated possible similar sources for both pairs of elements. Based on previous discussions, the unique environmental conditions around the furnace area (coal deposition and burning) might contribute to its significant different soil metal profiles.

3.4. Mercury in Ellis Island Soil

We determined total-Hg concentrations in the Ellis Island soil samples because coal burning was active in the powerhouse during the functional years of the Ellis Island Immigration Hospital. Coal combustion is one of the largest anthropogenic sources of atmospheric Hg [104]. Mercury concentrations in US coal range from about 80 to 200 mg·kg−1 [105]. The concentration of Hg in soils in the US has a geometric mean of 0.058 mg·kg−1 (SQuiRTs) while in New Jersey Hg background concentrations in soil have been reported from <0.01 to 2.71 mg·kg−1 [106]. Total Hg concentrations in Ellis Island soil ranged from 0.191 to 0.899 mg·kg−1, which were higher than national mean, but within the range for New Jersey soil (Figure 8). Concentrations of Hg were lower near the furnace area compared to other sampling locations (0.319 ± 0.141 mg·kg−1 vs. 0.684 ± 0.126 mg·kg−1). This may be due to high temperatures at the furnace area. The heat generated by the burning furnace might have depleted Hg in the surrounding soil by vaporizing the volatile element. The Hg concentrations in the soil near the furnace were similar to concentrations found in coal itself, so unburnt coal particles may be the dominate source of Hg in that soil. Examining the historical year-around wind pattern near the Ellis Island further indicated that the higher soil Hg concentrations in other areas might be the result of atmospheric deposition [107]. The prevailing wind directions around Ellis Island are from the west, northwest and southwest, depending on the time of year. Since the powerhouse is located at the furthermost western side of the island, the prevailing winds would then assist the transport of Hg-containing fly ash to the rest part of the island, resulting in elevated soil Hg concentration as fly ash settled.
Mercury concentrations in the different soil size fractions revealed that particle size played an important role in the distribution of Hg (Figure 9). In general, Hg concentrations increased as particle size decreased. Within the same particle size fraction, Hg concentrations are lower in samples collected near the furnace compared to other locations. A number of factors allow smaller particles to contain more Hg relative to larger particles, including greater overall surface area of adsorption of Hg. Moreover, the finest fraction often contains more clay minerals and/or organic coatings, both with high adsorption capacity. The relationship with organic matter and Hg is well known. Loss-on-ignition (LOI) provides an estimate of the organic matter content. Here organic matter (LOI) tended to be higher in the fine fraction. The LOI was highest in <125 µm fraction, except for Furnace F, which had the highest LOI in 500–1000 µm fraction (23%) followed by the <125 µm fraction (17%) (Table 7). LOI was lowest in 250–500 µm fractions in each sample. The estimated organic matter concentration varies from 6% to 14% among the three samples.

4. Conclusions

Soil samples from the abandoned Ellis Island Hospital Complex were geochemically characterized, and the levels and distribution of nutrient and heavy metal elements were assessed. We found C/N and C/S ratios that favor the mineralization process making the nitrogen and sulfur bioavailable to plants and soil microorganisms. The heavy metal concentrations in the soil indicate the lasting impact of human activities, even after the site was abandoned for more than 60 years. The concentrations of As and Pb in the Ellis Island soils were significantly higher than both New Jersey background soil and the Eco-SSL criteria for plants, likely a result of past anthropogenic inputs such as the use of lead arsenate pesticides and lead paint. However, most of the concentrations were below the Eco-SSL value for microbes, suggesting that As and Pb are not restricting microorganism growth. The furnace area showed distinct characteristics from other locations: the acid extractable Ca and Mg concentrations were significantly higher, while the Cu and Hg concentrations were significantly lower. We attribute the high Ca and Mg to coal balls and other concretions associated with the coal seams. The lower Hg levels may result from a combination of factors, including dilution with coal particles that contain lower levels of Hg, and dispersal of fly ash with prevailing wind patterns over the rest of the island and beyond. Elevated Cr may also come from fly ash deposition or from the disposal of residue from chromite ore processing. Additional study is needed to determine whether the low Cu levels near the furnace are the consequence of microbial activity that assist in the mobilization and removal of Cu.

5. Future Work

A follow up study is in progress examining how microbial communities, especially those that produce antibiotics, interact with the physico-chemical soil environment. Preliminary results and results from a prior study [108] suggest that microbes in the furnace and non-furnace area differ and that the soil environment is influencing the microbial communities differently. The interplay between antibiotic producing microbes and specific soil conditions similar to the furnace area might yield important new information for bioprospecting. Discovering new effective antibiotics is imperative for future biomedicine development. In response, platforms have re-emerged that encourage the search for new antibiotics from soil, a natural reservoir of antibiotic producing microorganisms. The abandoned hospital complex on Ellis Island, NY-NJ is an ideal locality for this work.

Acknowledgements

We thank Cindy Arrigo for requesting the sampling permit on Ellis Island and her participation, thoughts and inputs during the preparation of the manuscript. We thank the National Park Service for allowing us to access the hospital complex for research purposes, in particularly Diana Pardue and her staff at Ellis Island (Permits: ELIS-2016-SCI-0002, ELIS-2017-SCI-0001). We thank our students researchers—Jena Richards, Diana Mejia, Jake Severini, Loraine Mendez and Luis Aguayo, for their assistance in particle size analysis and soil digestion, and our laboratory technician, Mark Zdziarski, for this assistance in equipment maintenance. The work was carried out on instrumentation supported by NSF (TUES) grant #NSF-1245631; NSF (LSAMP) NSF-0902132; US Department of Education Title V HSI-STEM grant #P031C110067, NIH-GMS IRACDA subaward to C J Arrigo K12GM093854-06#93859.

Author Contributions

Deborah Freile, Kaixuan Bu, Virinder Sidhu conducted the soil sampling; Deborah Freile performed particle size analysis and data analysis; Kaixuan Bu and Virinder Sidhu performed the microwave digestion; Kaixuan Bu performed the CNS analysis and ICPMS analysis. Kaixuan Bu analyzed the CNS and ICPMS data. Virinder Sidhu performed the soil pH measurement; James V. Cizdziel performed the Hg analysis and analyzed the data; Kaixuan Bu, Deborah Freile, James V. Cizdziel and Nurdan S. Duzgoren-Aydin contributed in the writing and editing the manuscript.

Conflicts of Interest

The authors declare no conflict of interest.

References

  1. Stroganova, M.N.; Myagkova, A.D.; Prokof’eva, T.V. The role of soils in urban ecosystems. Eurasian Soil Sci. 1997, 30, 82–86. [Google Scholar]
  2. Chai, Y.; Guo, J.; Chai, S.; Cai, J.; Xue, L.; Zhang, Q. Source identification of eight heavy metals in grassland soils by multivariate analysis from the Baicheng-Songyuan area, Jilin Province, Northeast China. Chemosphere 2015, 134, 67–75. [Google Scholar] [CrossRef] [PubMed]
  3. Teng, Y.; Wu, J.; Lu, S.; Wang, Y.; Jiao, X.; Song, L. Soil and soil environmental quality monitoring in China: A review. Environ. Int. 2014, 69, 177–199. [Google Scholar] [CrossRef] [PubMed]
  4. Kouchou, A.; Rais, N.; Elsass, F.; Duplay, J.; Fahli, N.; Ghachtouli, N.E.L. Effects of long-term heavy metals contamination on soil microbial characteristics in calcareous agricultural lands (Saiss plain, North Morocco). J. Mater. Environ. Sci. 2017, 8, 691–695. [Google Scholar]
  5. Cheng, H.; Li, M.; Zhao, C.; Li, K.; Peng, M.; Qin, A.; Cheng, X. Overview of trace metals in the urban soil of 31 metropolises in China. J. Geochem. Explor. 2014, 139, 31–52. [Google Scholar] [CrossRef]
  6. Craul, P.J. A description of urban soils and their desired characteristics. J. Arboric. 1985, 11, 330–339. [Google Scholar]
  7. Craul, P.J. Urban soils. Metria 1985, 5, 45–61. [Google Scholar]
  8. Ajmone-Marsan, F.; Biasioli, M. Trace elements in soils of urban areas. Water Air Soil Pollut. 2010, 213, 121–143. [Google Scholar] [CrossRef]
  9. Jiwan, S. Effects of heavy metals on soil, plants, human health and aquatic life. IJRCE 2011, 1, 15–21. [Google Scholar]
  10. McLaughlin, M.J.; Zarcinas, B.A.; Stevens, D.P.; Cook, N. Soil testing for heavy metals. Commun. Soil Sci. Plant Anal. 2000, 31, 1661–1700. [Google Scholar] [CrossRef]
  11. Wuana, R.A.; Okieimen, F.E. Heavy metals in contaminated soils: A review of sources, chemistry, risks and best available strategies for remediation. ISRN Ecol. 2011, 2011, 1–20. [Google Scholar] [CrossRef]
  12. Sharma, R.K.; Agrawal, M.; Marshall, F. Heavy metal contamination of soil and vegetables in suburban areas of Varanasi, India. Ecotoxicol. Environ. Saf. 2007, 66, 258–266. [Google Scholar] [CrossRef] [PubMed]
  13. Bolan, N.; Kunhikrishnan, A.; Thangarajan, R.; Kumpiene, J.; Park, J.; Makino, T.; Kirkham, M.B.; Scheckel, K. Remediation of heavy metal (loid) s contaminated soils—To mobilize or to immobilize? J. Hazard. Mater. 2014, 266, 141–166. [Google Scholar] [CrossRef] [PubMed]
  14. World Health Organization. Trace Elements in Human Nutrition and Health; World Health Organization: Geneva, Switzerland, 1996; ISBN 92 4 156173 4. [Google Scholar]
  15. Sarwar, N.; Imran, M.; Shaheen, M.R.; Ishaq, W.; Kamran, A.; Matloob, A.; Rehim, A.; Hussain, S. Phytoremediation strategies for soils contaminated with heavy metals: Modifications and future perspectives. Chemosphere 2016, 171, 710–720. [Google Scholar] [CrossRef] [PubMed]
  16. Duruibe, J.O.; Ogwuegbu, M.O.C.; Egwurugwu, J.N. Heavy metal pollution and human biotoxic effects. Int. J. Phys. Sci. 2007, 2, 112–118. [Google Scholar]
  17. Levy, D.B.; Barbarick, K.A.; Siemer, E.G.; Sommers, L.E. Distribution and partitioning of trace metals in contaminated soils near Leadville, Colorado. J. Environ. Qual. 1992, 21, 185–195. [Google Scholar] [CrossRef]
  18. Salt, D.E.; Rauser, W.E. MgATP-dependent transport of phytochelatins across the tonoplast of oat roots. Plant Physiol. 1995, 107, 1293–1301. [Google Scholar] [CrossRef] [PubMed]
  19. Sarwar, N.; Ishaq, W.; Farid, G.; Shaheen, M.R.; Imran, M.; Geng, M.; Hussain, S. Zinc-cadmium interactions: Impact on wheat physiology and mineral acquisition. Ecotoxicol. Environ. Saf. 2015, 122, 528–536. [Google Scholar] [CrossRef] [PubMed]
  20. Sidhu, G.P.S. Heavy metal toxicity in soils: Sources, remediation technologies and challenges. Adv. Plants Agric. Res. 2016, 5. [Google Scholar] [CrossRef]
  21. Šmejkalová, M.; Mikanová, O.; Borůvka, L. Effects of heavy metal concentrations on biological activity of soil micro-organisms. Plant Soil Environ. 2003, 49, 321–326. [Google Scholar]
  22. Hattori, H. Decomposition of organic matter with previous cadmium adsorption in soils. Soil Sci. Plant Nutr. 1996, 42, 745–752. [Google Scholar] [CrossRef]
  23. Olaniran, A.O.; Balgobind, A.; Pillay, B. Bioavailability of heavy metals in soil: Impact on microbial biodegradation of organic compounds and possible improvement strategies. Int. J. Mol. Sci. 2013, 14, 10197–10228. [Google Scholar] [CrossRef] [PubMed]
  24. Tchounwou, P.B.; Yedjou, C.G.; Patlolla, A.K.; Sutton, D.J. Heavy metal toxicity and the environment. Mol. Clin. Environ. Toxicol. 2012, 133–164. [Google Scholar] [CrossRef]
  25. Goyer, R.; Golub, M.; Choudhury, H.; Hughes, M.; Kenyon, E.; Stifelman, M. Issue Paper on the Human Health Effects of Metals; Risk Assessment Forum, US Environmental Protection Agency: Washington, DC, USA, 2004.
  26. NTP (National Toxicology Program). 10th Report on Carcinogens; U.S. Department of Health and Human Services, Public Health Service: Washington, DC, USA, 2002.
  27. Tift, W. Ellis Island; Contemporary Books: Chicago, IL, USA, 1990. [Google Scholar]
  28. Desforges, L.; Maddern, J. Front doors to freedom, portal to the past: History at the Ellis Island Immigration Museum, New York. Soc. Cult. Geogr. 2004, 5, 437–457. [Google Scholar] [CrossRef]
  29. Yew, E. Medical inspection of immigrants at Ellis Island, 1891–1924. Bull. N. Y. Acad. Med. 1980, 56, 488–510. [Google Scholar] [PubMed]
  30. Save Ellis Island. Available online: https://www.saveellisisland.org/gallery/aerial-views-of-ellis-island (accessed on 20 August 2017).
  31. Ecology and Environment, Inc. Soil Sampling Env; Ecology and Environment, Inc.: Lancaster, NY, USA, 1997. [Google Scholar]
  32. United States Environmental Protection Agency (USEPA). Preparation of Soil Sampling Protocols: Sampling Techniques and Strategies; EPA/600/R-92; Office of Research and Development: Washington, DC, USA, 1992.
  33. Barth, D.S.; Mason, B.J. Soil Sampling Quality Assurance User’s Guide; EPA-600/4-84-043; USEPA: Washington, DC, USA, 1984.
  34. Mason, B.J. Preparation of Soil Sampling Protocol: Technique and Strategies; EPA-600/4-83-020; USEPA: Washington, DC, USA, 1983.
  35. Sparks, D.L.; Page, A.L.; Helmke, P.A.; Loeppert, R.H. (Eds.) Methods of Soil Analysis Part 3—Chemical Methods; SSSA Book Ser. 5.3; Soil Science Society of America and American Society of Agronomy: Madison, WI, USA, 1996. [Google Scholar]
  36. Krumbein, W.C.; Pettijohn, F.J. Manual of Sedimentary Petrology; Appleton-Century-Crofts, Inc.: New York, NY, USA, 1938; p. 549. [Google Scholar]
  37. Folk, R.L. Petrology of Sedimentary Rocks; Hemphill Publishing Co.: Austin, TX, USA, 1974; pp. 16–18. [Google Scholar]
  38. The SediGraph Method of Particle Sizing. Micromeritics Instrument Corporation. Available online: http://www.micromeritics.com/Repository/Files/sedigraph_method_poster.pdf (accessed on 18 December 2017).
  39. USDA Soil Texture Calculator. Available online: https://www.nrcs.usda.gov/wps/portal/nrcs/detail/soils/survey/?cid=nrcs142p2_054167 (accessed on 20 August 2017).
  40. Mandzhieva, S.; Minkina, T.; Pinskiy, D.; Bauer, T.; Sushkova, S. The role of soil’s particle-size fractions in the adsorption of heavy metals. Eurasian J. Soil Sci. 2014, 3, 197–205. [Google Scholar] [CrossRef]
  41. Dube, A.; Zbytniewski, R.; Kowalkowski, T.; Cukrowska, E.; Buszewski, B. Adsorption and migration of heavy metals in soil. Pol. J. Environ. Stud. 2001, 10, 1–10. [Google Scholar]
  42. Minkina, T.M.; Pinskii, D.L.; Mandzhieva, S.S.; Antonenko, E.M.; Sushkova, S.N. Effect of the particle-size distribution on the adsorption of copper, lead, and zinc by Chernozemic soils of Rostov oblast. Eurasian Soil Sci. 2011, 44, 1193–1200. [Google Scholar] [CrossRef]
  43. Mills, A.L. Keeping in Touch: Microbial Life on Soil Particle Surfaces. Adv. Agron. 2003, 78, 1–43. [Google Scholar] [CrossRef]
  44. USEPA. Method 3051: Microwave Assisted acid Digestion of Sediments, Sludges, Soils, and Oils; Test Methods for Evaluating Solid Waste; USEPA: Washington, DC, USA, 1995; pp. 1–30.
  45. USEPA. Report: Recent Developments for In Situ Treatment of Metals Contaminated Soils, Office of Solid Waste and Emergency Response; USEPA: Washington, DC, USA, 1996.
  46. Mackey, E.A.; Christopher, S.J.; Lindstrom, R.M.; Long, S.E.; Marlow, A.F.; Murphy, K.E.; Paul, R.L.; Popelka-Filcoff, R.S.; Rabb, S.A.; Sieber, J.R.; et al. Certification of three NIST renewal soil standard reference materials for element content: SRM 2709a San Joaquin Soil, SRM 2710a Montana Soil I, and SRM 2711a Montana Soil II. NIST Spec. Publ. 2010, 260, 1–39. [Google Scholar]
  47. Morgan, S.L.; Bartick, E.G. Discrimination of Forensic Analytical Chemical Data Using Multivariate Statistics. In Forensic Analysis on the Cutting Edge: New Methods for Trace Evidence Analysis; John Wiley & Sons, Inc.: Hoboken, NJ, USA, 2007; pp. 333–374. [Google Scholar] [CrossRef]
  48. USDA Web Soil Survey. Available online: https://websoilsurvey.sc.egov.usda.gov/App/WebSoilSurvey.aspx (accessed on 20 August 2016).
  49. Andersson, A. Distribution of heavy metals as compared to some other elements between grain size fractions in soils. Swedish J. Agric. Res. 1979, 9, 7–13. [Google Scholar]
  50. Rieuwerts, J.S.; Thornton, I.; Farago, M.E.; Ashmore, M.R. Factors influencing metal bioavailability in soils: Preliminary investigations for the development of a critical loads approach for metals. Chem. Spec. Bioavailab. 1998, 10, 61–75. [Google Scholar] [CrossRef]
  51. Maskall, J.; Whitehead, K.; Thornton, I. Heavy metal migration in soils and rocks at historical smelting sites. Environ. Geochem. Health 1995, 17, 127–138. [Google Scholar] [CrossRef] [PubMed]
  52. Riffaldi, R.; Levi-Minzi, R.; Soldatini, G.F. Lead adsorption by soils. Pt II. Water Air Soil Pollut. 1976, 6, 119–128. [Google Scholar] [CrossRef]
  53. Qian, J.I.N.; Shan, X.Q.; Wang, Z.J.; Tu, Q. Distribution and plant availability of heavy metals in different particle-size fractions of soil. Sci. Total Environ. 1996, 187, 131–141. [Google Scholar] [CrossRef]
  54. Oud, S.S.; EL-Saeid, M.H.; Nadeem, M.E.A. Effect of Soil Chemical and Physical Properties on Cd Mobility Studied by Soil Thin-Layer Chromatography. Curr. World Environ. 2014, 9, 561–569. [Google Scholar] [CrossRef]
  55. Bloomfield, C. The translocation of metals in soils. In The Chemistry of Soil Processes; Greenland, D.J., Hayes, M.H.B., Eds.; John Wiley & Sons Ltd.: Chichester, UK, 1981. [Google Scholar]
  56. Ernst, W.H.O. Bioavailability of heavy metals and decontamination of soils by plants. Appl. Geochem. 1996, 11, 163–167. [Google Scholar] [CrossRef]
  57. Avramidis, P.; Nikolaou, K.; Bekiari, V. Total organic carbon and total nitrogen in sediments and soils: A comparison of the wet oxidation-titration method with the combustion-infrared method. Agric. Agric. Sci. Procedia 2015, 4, 425–430. [Google Scholar] [CrossRef]
  58. Walkley, A.; Black, I.A. An examination of the Degtjareff method for determining soil organic matter and a proposed modification of the chromic acid titration method. Soil Sci. 1934, 37, 29–38. [Google Scholar] [CrossRef]
  59. Williams, C.H.; Williams, E.G.; Scott, N.M. Carbon, nitrogen, sulphur, and phosphorus in some Scottish soils. Eur. J. Soil Sci. 1960, 11, 334–346. [Google Scholar] [CrossRef]
  60. Van Veen, J.A.; Kuikman, P.J. Soil structural aspects of decomposition of organic matter by micro-organisms. Biogeochemistry 1990, 11, 213–233. [Google Scholar] [CrossRef]
  61. Gougoulias, C.; Clark, J.M.; Shaw, L.J. The role of soil microbes in the global carbon cycle: Tracking the below-ground microbial processing of plant-derived carbon for manipulating carbon dynamics in agricultural systems. J. Sci. Food Agric. 2014, 94, 2362–2371. [Google Scholar] [CrossRef] [PubMed]
  62. Plant-Microbe Interaction-C:N Ratio. Agronomy Tech Note 76; 2014. Available online: https://www.nrcs.usda.gov/wps/PA_NRCSConsumption/download?cid=stelprdb1254120&ext=pdf (accessed on 27 August 2017).
  63. Crohn, D. Nitrogen mineralization and its importance in organic waste recycling. In Proceedings of the National Alfalfa Symposium, San Diego, CA, USA, 13–15 December 2004; pp. 13–15. [Google Scholar]
  64. Scherer, H.W. Sulfur in soils. J. Plant Nutr. Soil Sci. 2009, 172, 326–335. [Google Scholar] [CrossRef]
  65. Kaiser, D.E.; Lamb, J.A.; Vetsch, J.A. Sulfur in Minnesota Soils. Nutrient Management 2014. Available online: https://www.extension.umn.edu/agriculture/nutrient-management/secondary-macronutrients/sulfur-for-minnesota-soils/ (accessed on 20 August 2017).
  66. Barrow, N.J. A comparison of the mineralization of nitrogen and of sulphur from decomposing organic materials. Aust. J. Agric. Res. 1960, 11, 960–969. [Google Scholar] [CrossRef]
  67. Duzgoren-Aydin, N.S.; Avula, B.; Willett, K.L.; Khan, I.A. Determination of total and partially extractable solid-bound element concentrations using collision/reaction cell inductively coupled plasma-mass spectrometry and their significance in environmental studies. Environ. Monit. Assess. 2011, 172, 51–66. [Google Scholar] [CrossRef] [PubMed]
  68. Melo, V.F.; Batista, A.H.; Gilkes, R.J.; Rate, A.W. Relationship between heavy metals and minerals extracted from soil clay by standard and novel acid extraction procedures. Environ. Monit. Assess. 2016, 188, 668. [Google Scholar] [CrossRef] [PubMed]
  69. U.S. EIA. Annual Coal Distribution Report, Archive, Domestic Distribution of U.S. Coal by Destination State, Consumer, Destination and Method of Transportation 2014; U.S. EIA: Washington, DC, USA, 2013.
  70. Foster, W.D.; Feicht, F.L. Mineralogy of concretions from Pittsburgh coal seam with special reference to analcite: Am. Am. Miner. 1946, 31, 357–364. [Google Scholar]
  71. Ruppert, L.F.; Tewalt, S.J.; Bragg, L.J.; Wallack, R.N. A digital resource model of the Upper Pennsylvanian Pittsburgh coal bed, Monongahela Group, northern Appalachian basin coal region, USA. Int. J. Coal Geol. 1999, 41, 3–24. [Google Scholar] [CrossRef]
  72. DeMaris, P.J. Geologic Investigation of Roof and Floor Strata: Longwall Demonstration, Old Ben Mine No. 24: Prediction of Coal Balls in the Herrin Coal: Final Technical Report, Part 2; Contract/Grant Report 1983-02; Illinois Department of Energy and Natural Resources: Champaign, IL, USA, 1983.
  73. Singh, G. Environmental Aspects of Coal Combustion Residues from Thermal Power Plants. In Thermal Power Plants-Advanced Applications; InTech: London, UK, 2013. [Google Scholar] [CrossRef]
  74. Seshadri, B.; Bolan, N.S.; Naidu, R.; Brodie, K. The role of coal combustion products in managing the bioavailability of nutrients and heavy metals in soils. Soil Sci. Plant Nutr. 2010, 10, 378–398. [Google Scholar] [CrossRef]
  75. Buchman, M.F. NOAA Screening Quick Reference Tables; NOAA OR&R Report 08-1; Office of Response and Restoriation Division, National Oceanic and Atmospheric Administration: Seattle WA, USA, 2008; pp. 1–3.
  76. United States Environmental Protection Agency (USEPA). Release of Guidance for Developing Ecological Soil Screening Levels 2003; USEPA: Washington, DC, USA, 2003.
  77. United States Environmental Protection Agency (USEPA). Guidance for Developing Ecological Soil Screening Levels 2003; USEPA: Washington, DC, USA, 2003.
  78. New Jersey Soil Cleanup Criteria, Last Updated in 2015. Available online: http://www.nj.gov/dep/srp/guidance/scc/#a (accessed on 15 November 2017).
  79. Weber, E.; Hendrickson, K. Arsenic and Lead Mobility. In Area-Wide Contamination-Impacted Soil; Technical Memorandum; Landau Associates: Washington, DC, USA, 2006. [Google Scholar]
  80. Blaylock, M.J.; Huang, J.W. Phytoextraction of Metals. In Phytoremediation of Toxic Metals: Using Plants to Clean Up the Environment; Raskin, I., Ensley, B.D., Eds.; John Wiley & Sons: New York, NY, USA, 2000; pp. 53–71. [Google Scholar]
  81. Peryea, F.J. Historical Use of Lead Arsenate Insecticides, Resulting Soil Contamination and Implications for Soil Remediation. Proceedings of 16th World Congress of Soil Science, Montpellier, France, 20–26 August 1998. [Google Scholar]
  82. Oliveira, H. Chromium as an environmental pollutant: Insights on induced plant toxicity. J. Bot. 2012, 2012, 1–8. [Google Scholar] [CrossRef]
  83. Shanker, A.K.; Cervantes, C.; Loza-Tavera, H.; Avudainayagam, S. Chromium toxicity in plants. Environ. Int. 2005, 31, 739–753. [Google Scholar] [CrossRef] [PubMed]
  84. Wyszkowska, J. Soil contamination by chromium and its enzymatic activity and yielding. Pol. J. Environ. Stud. 2002, 11, 79–84. [Google Scholar]
  85. Agency for Toxic Substances and Disease Registry. Toxicological Profile for Chromium; Agency for Toxic Substances and Disease Registry: Atlanta, GA, USA, 2012.
  86. Gaudino, S.; Galas, C.; Belli, M.; Barbizzi, S.; de Zorzi, P.; Jaćimović, R.; Jeran, Z.; Pati, A.; Sansone, U. The role of different soil sample digestion methods on trace elements analysis: A comparison of ICP-MS and INAA measurement results. Accredit. Qual. Assur. 2007, 12, 84–93. [Google Scholar] [CrossRef]
  87. Burke, T.; Fagliano, J.; Goldoft, M.; Hazen, R.E.; Iglewicz, R.; McKee, T. Chromite ore processing residue in Hudson County, New Jersey. Environ. Health Perspect. 1991, 92, 131–137. [Google Scholar] [CrossRef] [PubMed]
  88. Paustenbach, D.J.; Rinehart, W.E.; Sheehan, P.J. The health hazards posed by chromium-contaminated soils in residential and industrial areas: Conclusions of an expert panel. Regul. Toxicol. Pharmacol. 1991, 13, 195–222. [Google Scholar] [CrossRef]
  89. Apte, A.D.; Tare, V.; Bose, P. Extent of oxidation of Cr (III) to Cr (VI) under various conditions pertaining to natural environment. J. Hazard. Mater. 2006, 128, 164–174. [Google Scholar] [CrossRef] [PubMed]
  90. National Research Council. Arsenic in Drinking Water: 2001 Update; National Academies Press: Washington, DC, USA, 2001. [Google Scholar]
  91. Allen, W. The War on Bugs; Chelsea Green Publishing: White River Junction, VT, USA, 2008; p. 274. [Google Scholar]
  92. Smith, E.R.G.; Naidu, R.; Alston, A.M. Arsenic in the Soil Environment: A review. In Advances in Agronomy; Academic Press: Cambridge, MA, USA, 1998. [Google Scholar]
  93. Chung, J.Y.; Yu, S.D.; Hong, Y.S. Environmental source of arsenic exposure. J. Prev. Med. Public Health 2014, 47, 253. [Google Scholar] [CrossRef] [PubMed]
  94. Kabata-Pendias, A. Trace Elements in Soils and Plants; CRC Press: Boca Raton, FL, USA, 2010. [Google Scholar]
  95. Sadiq, M. Arsenic Chemistry in Soils: An Overview of Thermodynamic Predictions and Field Observations. Water Air Soil Pollut. 1997, 93, 117–136. [Google Scholar] [CrossRef]
  96. Tokunaga, S. Interaction of Anionic Pollutants with Soils—Sorption of As(III), As(V), Sb(III), Sb(V), Se(IV) Ions by Six Soils. In Proceedings of the 9th International Conference on Environmental Science and Technology, Rhodes Island, Greece, 1–3 September 2005. [Google Scholar]
  97. Das, P.; Samantaray, S.; Rout, G.R. Studies on cadmium toxicity in plants: A review. Environ. Pollut. 1997, 98, 29–36. [Google Scholar] [CrossRef]
  98. Roane, T.M.; Pepper, I.L. Microbial responses to environmentally toxic cadmium. Microb. Ecol. 1999, 38, 358–364. [Google Scholar] [CrossRef] [PubMed]
  99. Pinto, A.P.; Mota, A.M.; De Varennes, A.; Pinto, F.C. Influence of organic matter on the uptake of cadmium, zinc, copper and iron by sorghum plants. Sci. Total Environ. 2004, 326, 239–247. [Google Scholar] [CrossRef] [PubMed]
  100. Sheldon, A.R.; Menzies, N.W. The effect of copper toxicity on the growth and root morphology of Rhodes grass (Chloris gayana Knuth.) in resin buffered solution culture. Plant Soil 2005, 278, 341–349. [Google Scholar] [CrossRef]
  101. Kandeler, F.; Kampichler, C.; Horak, O. Influence of heavy metals on the functional diversity of soil microbial communities. Biol. Fertil. Soils 1996, 23, 299–306. [Google Scholar] [CrossRef]
  102. Banu, N.A.; Singh, B.; Copeland, L. Influence of copper on soil microbial biomass and biodiversity in some NSW soils. In Proceedings of the SuperSoil 2004: 3rd Australian New Zealand Soils Conference, Sydney, Australia, 5–9 December 2004; pp. 1–9. [Google Scholar]
  103. Chen, Y.X.; Wang, Y.P.; Lin, Q.; Luo, Y.M. Effect of copper-tolerant rhizosphere bacteria on mobility of copper in soil and copper accumulation by Elsholtzia splendens. Environ. Int. 2005, 31, 861–866. [Google Scholar] [CrossRef] [PubMed]
  104. Xu, J.; Bravo, A.G.; Lagerkvist, A.; Bertilsson, S.; Sjöblom, R.; Kumpiene, J. Sources and remediation techniques for mercury contaminated soil. Environ. Int. 2015, 74, 42–53. [Google Scholar] [CrossRef] [PubMed]
  105. Toole-O’Neil, B.; Tewalt, S.J.; Finkelman, R.B.; Akers, D.J. Mercury concentration in coal-unraveling the puzzle. Fuel 1999, 78, 47–54. [Google Scholar] [CrossRef]
  106. DiFrancesco, D.T.; Shinn, R.C. NJDEP New Jersey Mercury Task Force Report Volume II Exposure and Impacts, Chapter 7; New Jersey Department of Environmental Protection: Trenton, NJ, USA, 2002; pp. 84–85.
  107. 1961–1990 Wind Roses by Month—Charts, NOAA. Available online: https://www.wcc.nrcs.usda.gov/ftpref/downloads/climate/windrose/ (accessed on 15 November 2017).
  108. Arrigo, C.; Sidhu, V.; Mejia, D.; Mendez, L.; Freile, D.; Duzgoren-Aydin, N.S. Preliminary Study Of Geochemical Characteristics of Soils and Their Bacterial Isolates for Antibiotic Activity: Case Study from Ellis Island, New York; Geological Society of America Abstracts with Programs; Geological Society of America: Boulder, CO, USA, 2016; p. 48. [Google Scholar] [CrossRef]
Figure 1. Aerial view of the historical building layout on the south side of Ellis Island, circa 1920s. Note that the central area between Island 2 and 3 was not at that time completely combined together with landfill sediment. (Photograph modified from saveellisisland.org) [30].
Geosciences 08 00013 g001
Figure 2. Aerial view of sampling sites at Ellis Island, NY-NJ. Sampling locations are marked with red stars. At the powerhouse (furnace) site, sample replicates were collected from the same general location but at different times. The furnace samples are identified in the red rectangle to the side. Note that the central area between Island 2 and 3 is land at present. (Photograph modified from saveellisisland.org) [30].
Geosciences 08 00013 g002
Figure 3. (a) NRCS soil texture classification for Ellis Island soil samples. Orange denotes soils from the Furnace Area (Coarse Sand to Loamy Coarse Sand); not all samples from the Furnace area were included for soil texture analysis since the area was relatively small (approximately 15–20 m2); Green denotes soils from the Isolation Wards (Loamy Sands to Sandy Loams); Blue denotes soil from the Minor Chimney Area (Coarse Sand). Modified from USDA Web Soil Survey [39]. (b) NRCS soil texture classification for Ellis Island soil samples. Green denotes soils from the Central Area (Coarse Sand to Loamy Coarse Sand); Blue denotes soil from the GH Area (Sandy Loam); Red denotes soils from the Office Area (Sandy Loam); Black denotes soils from the Morgue (Coarse Sand and Loamy Coarse Sand). Modified from USDA Web Soil Survey [39].
Geosciences 08 00013 g003aGeosciences 08 00013 g003b
Figure 4. Linear correlation between carbon and nitrogen concentration in Ellis Island soil samples.
Geosciences 08 00013 g004
Figure 5. Sulfur showed weaker linear correlation with carbon composition than nitrogen in Ellis Island soil samples, which might be the indication of mixed soil sulfur sources.
Geosciences 08 00013 g005
Figure 6. (ae) Acid extractable metal profile in Ellis Island soil samples. Metal concentrations are compared with reported New Jersey soil metal background concentrations (green-solid line), Ecological-Soil screening level for both plants (purple-dashed line) and microbes (yellow-dashed line) and New Jersey Department of Environmental Protection soil cleanup criteria (red-solid line).
Geosciences 08 00013 g006aGeosciences 08 00013 g006b
Figure 7. Discriminant analysis of two soil sample groups (furnace and non-furnace) based on acid extractable metal concentrations. Eclipses indicate a 95% confidence region containing the true mean of the group. The biplot rays suggest the direction of variables in the canonical space and the correlation between variables. The sample group from the furnace area can be statistically separated from the samples from the non-furnace sites.
Geosciences 08 00013 g007
Figure 8. Total Hg concentrations in Ellis Island soil samples. Green solid line indicates the US geometric mean soil Hg background concentration; purple dash line indicates the Eco-SSL for plants.
Geosciences 08 00013 g008
Figure 9. Total Hg concentration in different size fraction of Ellis Island soil samples. Three samples were included in the analysis. Overall, the total Hg concentration increases as the particle size decreases.
Geosciences 08 00013 g009
Table 1. List of soil samples and collected during the 2016 and 2017 sampling events and the related sampling location information.
Sampling TimeSample IDSample Location Information
Spring 2016GH WardArea between the general hospital building and psychopathic ward
Central A, BCentral area of the hospital complex which was formed with sediments
Isolation Ward A, BArea near isolation wards which quarantined patients with contagious diseases
Morgue AHospital morgue
Furnace A, BPowerhouse with a coal-burning furnace
Spring 2017Isolation Ward CArea near isolation wards which quarantined patients with contagious diseases
Morgue BHospital morgue
Minor ChimneyThe kitchen area with a chimney
Office A, BHospital office building
Furnace C-JPowerhouse with a coal-burning furnace
Table 2. Plasma and data acquisition parameters for the X-series ICPMS.
Plasma
Cool gas flow13.0 L min−1
Auxiliary gas flow0.80 L min−1
Sample gas flow0.84 L min−1
RF power1400 W
Data Acquisition
Isotopes24Mg, 44Ca, 52Cr, 65Cu, 75As, 111Cd, 115In, 208Pb
Integration modePeak jump
Integration time10 ms
Number of sweeps80
Number of main runs3
Table 3. Measured acid extractable metal concentrations for NIST 2711a (Montana soil II). All concentrations are in mg·kg−1 unless otherwise noted. All elements determined in this study fall within the certified concentration ranges published by NIST [46]. All elements’ mean recoveries agreed well with NIST reported values [46].
Mg (%)Ca (%)PbCrAsCdCu
Concentration0.641.43134516.010851.9134
SD (n = 6)0.040.051165.7225.110
NIST certified range0.5–0.661.4–1.71100–140012–1881–11043–56120–160
Mean recoveries60%59%96%31%100%96%95%
Table 4. CNS analysis results for Ellis Island soil samples. All samples were run in replicates; results were displayed as percentage of sample dry weight (% ± relative percent difference).
Sample IDCarbonNitrogenSulphurInorganic C (% of tol C)C:NC:S
GH Ward5.72 ± 1.20.309 ± 4.30.072 ± 2.41%1979
Central A7.95 ± 0.490.423 ± 1.50.086 ± 3.85%1992
Central B5.41 ± 1.80.281 ± 1.60.085 ± 2.85%1964
Isolation Ward A6.62 ± 0.400.353 ± 0.430.084 ± 2.91%1979
Isolation Ward B8.47 ± 0.470.420 ± 0.730.100 ± 1.21%2085
Isolation Ward C8.39 ± 1.00.384 ± 6.90.093 ± 5.11%2290
Minor Chimney8.75 ± 1.30.455 ± 4.80.099 ± 5.07%1988
Morgue A8.50 ± 0.690.503 ± 0.300.094 ± 124%1790
Morgue B6.90 ± 6.20.318 ± 4.40.086 ± 8.23%2280
Office A5.50 ± 1.60.234 ± 0.240.084 ± 0.753%2465
Office B5.95 ± 4.80.282 ± 2.00.071 ± 7.54%2184
Furnace A11.8 ± 1.00.720 ± 0.720.109 ± 1.35%16108
Furnace B11.1 ± 0.110.688 ± 0.110.080 ± 4.45%16139
Furnace C11.9 ± 0.750.668 ± 7.30.117 ± 127%18102
Furnace D8.58 ± 2.00.423 ± 2.10.074 ± 2.610%20116
Furnace E11.2 ± 1.40.655 ± 4.40.088 ± 9.07%17127
Furnace F10.1 ± 0.100.547 ± 2.80.096 ± 3.97%18105
Furnace G8.06 ± 0.840.362 ± 1.00.077 ± 4.216%22105
Furnace H7.06 ± 0.360.285 ± 5.80.056 ± 9.218%25126
Furnace I7.56 ± 0.440.373 ± 7.90.076 ± 3.510%20100
Furnace J10.4 ± 0.550.600 ± 3.70.097 ± 3.18%17107
Table 5. Acid extractable metal concentration in Ellis Island soil samples. Concentrations are in mg·kg−1 unless otherwise noted.
Sample IDMg (%)Ca (%)PbCrAsCdCu
GH Ward0.220.1359760.414.70.80221
Central A0.660.7254258.315.30.61158
Central B0.520.5626337.310.80.4478.4
Isolation Ward A0.290.1869379.316.90.52365
Isolation Ward B0.320.1253869.116.40.45302
Isolation Ward C0.280.1844955.026.30.45187
Minor Chimney0.671.3133842.111.70.70126
Morgue A0.390.6490063.110.61.02291
Morgue B0.350.4047340.417.01.18208
Office A0.270.3895237.424.41.42346
Office B0.340.5265438.521.61.28244
Furnace A1.061.2848178.513.20.4377.6
Furnace B0.761.0927171.78.860.3354.2
Furnace C0.531.6360325.78.120.9173.4
Furnace D0.871.7629164.712.90.6264.3
Furnace E0.591.4925733.78.680.7363.4
Furnace F0.571.4086942.810.01.0570.1
Furnace G1.342.6234952.216.40.6193.8
Furnace H1.292.4932664.816.70.5980.7
Furnace I0.771.59100857.914.10.7478.0
Furnace J0.691.5633947.510.90.7892.5
Table 6. Concentration ranges of acid extractable heavy metals in Ellis Island soil samples in comparison with the NJ DEP nonresidential direct contact soil clean-up criteria and the mean reported soil metal background concentrations in NJ soil. [77,78].
ElementsConcentration Range in Ellis Island Samples (mg·kg−1)NJ DEP Cleanup Criteria (mg·kg−1)NJ Soil Metal Background Level (mg·kg−1)
Pb257–100840035
Cr25.7–79.324013.9
As8.12–26.3197.0
Cd0.33–1.42780.3
Cu54.2–36560014
Table 7. Weight percentages and loss-on-ignition values in different size fraction in three selected Ellis Island soil sample. Estimated total organic matter percentage in the three samples were calculate based on LOIs.
Isolation Ward CFurnace FFurnace G
Estimated Total Organic Matter (%)14136
Size Fraction (µm)LOI (%)LOI (%)Weight (%)Weight (%)LOI (%)Weight (%)
500–100015232522420
250–5001063623029
125–25013122818928
<125161711371123

