1. Introduction
Human societies are developed at the expense of natural resources [
1]. However, the non-rational use of these resources leads to their degradation, reaching unrecoverable levels. Desertification is an example of this degradation process.
Desertification does not only mean the expansion of deserts, it also concerns dryland ecosystems, which cover more than a third of the earth’s land area and which are extremely vulnerable to over-exploitation and inappropriate land use.
As it was defined by the United Nations during the Conference on Environment and Sustainable Development in Rio in 1992, desertification is the degradation of land in arid, semi-arid and dry subhumid climate [
2]. It is manifested by the partial or total loss of agricultural and grazing land, deforestation and water imbalance. The factors inducing this phenomenon are either natural such as arid climate [
3,
4], vegetation coverage and soil, or human [
5] namely overgrazing [
6,
7], deforestation and inappropriate agricultural practice [
8].
In Morocco, where the climate is semi-arid, arid and Saharian in nearly 93%of its surface, the coverage of forest ecosystems does not exceed 8% (if we exclude alfa grass), with an area of 31,482 km2. These ecosystems, with low productivity but with vital environmental function, are essential and they currently suffer from an imbalance between their renewal capacities on the one hand, and the anthropozoogenic action such as over-grazing, cooking and heating wood, on the other hand. This imbalance brings about deforestation over an area of nearly 31,000 ha year−1 and forest fire covering nearly 2800 ha year−1.
Damages inflicted on croplands are not only limited to a qualitative aspect, characterized by a reduction in their productivity, but also to a quantitative aspect manifested in a reduction of their areas. Some farmers even abandon their lands which prove to be unproductive. Urbanization also threatens farmlands, due to rapid population growth and the emergence of several new towns. Besides, cities rarely expand and built-up efficiently.
Water erosion, the main agent of land degradation, is a source of pollution since it carries away supplies of sediments, chemical products and organic matter into rivers. Thus, it leads to the deterioration of the quality of surface water, reduces the supply of aquifer, leading up to a rapid silting-up of reservoirs and the reduction of electricity production [
9,
10].
The uncontrolled harvesting of some livestock species for the extraction of essential oils and the loss of traditional forms of organization as well as over-grazing, are the causes of rangeland degradation. This rangeland degradation process is amplified by the recurrent droughts that Morocco has suffered. In several cases, the number of animals attending rangelands has exceeded the grazing lands capacity.
This worrying situation leads to the loss of soil fertility, accelerates the desertification process and compromises the country’s capacity to respond to the water and agro-food needs.
Scientists have been involved in desertification research for a long time, and many models for desertification assessment have been developed. In this study, the methodology used is based on the Mediterranean Desertification and Land Use (MEDALUS) model, which takes into account soil, climate, vegetation and management indexes to identify the sensitivity of areas heading toward desertification.
Owing to the use of remote sensing and Geographical Information System (GIS) techniques, both the land degradation assessment and its spatial distribution are easily measured, with a minimum cost and better accuracy, particularly in larger areas [
11].
2. Case Study Description
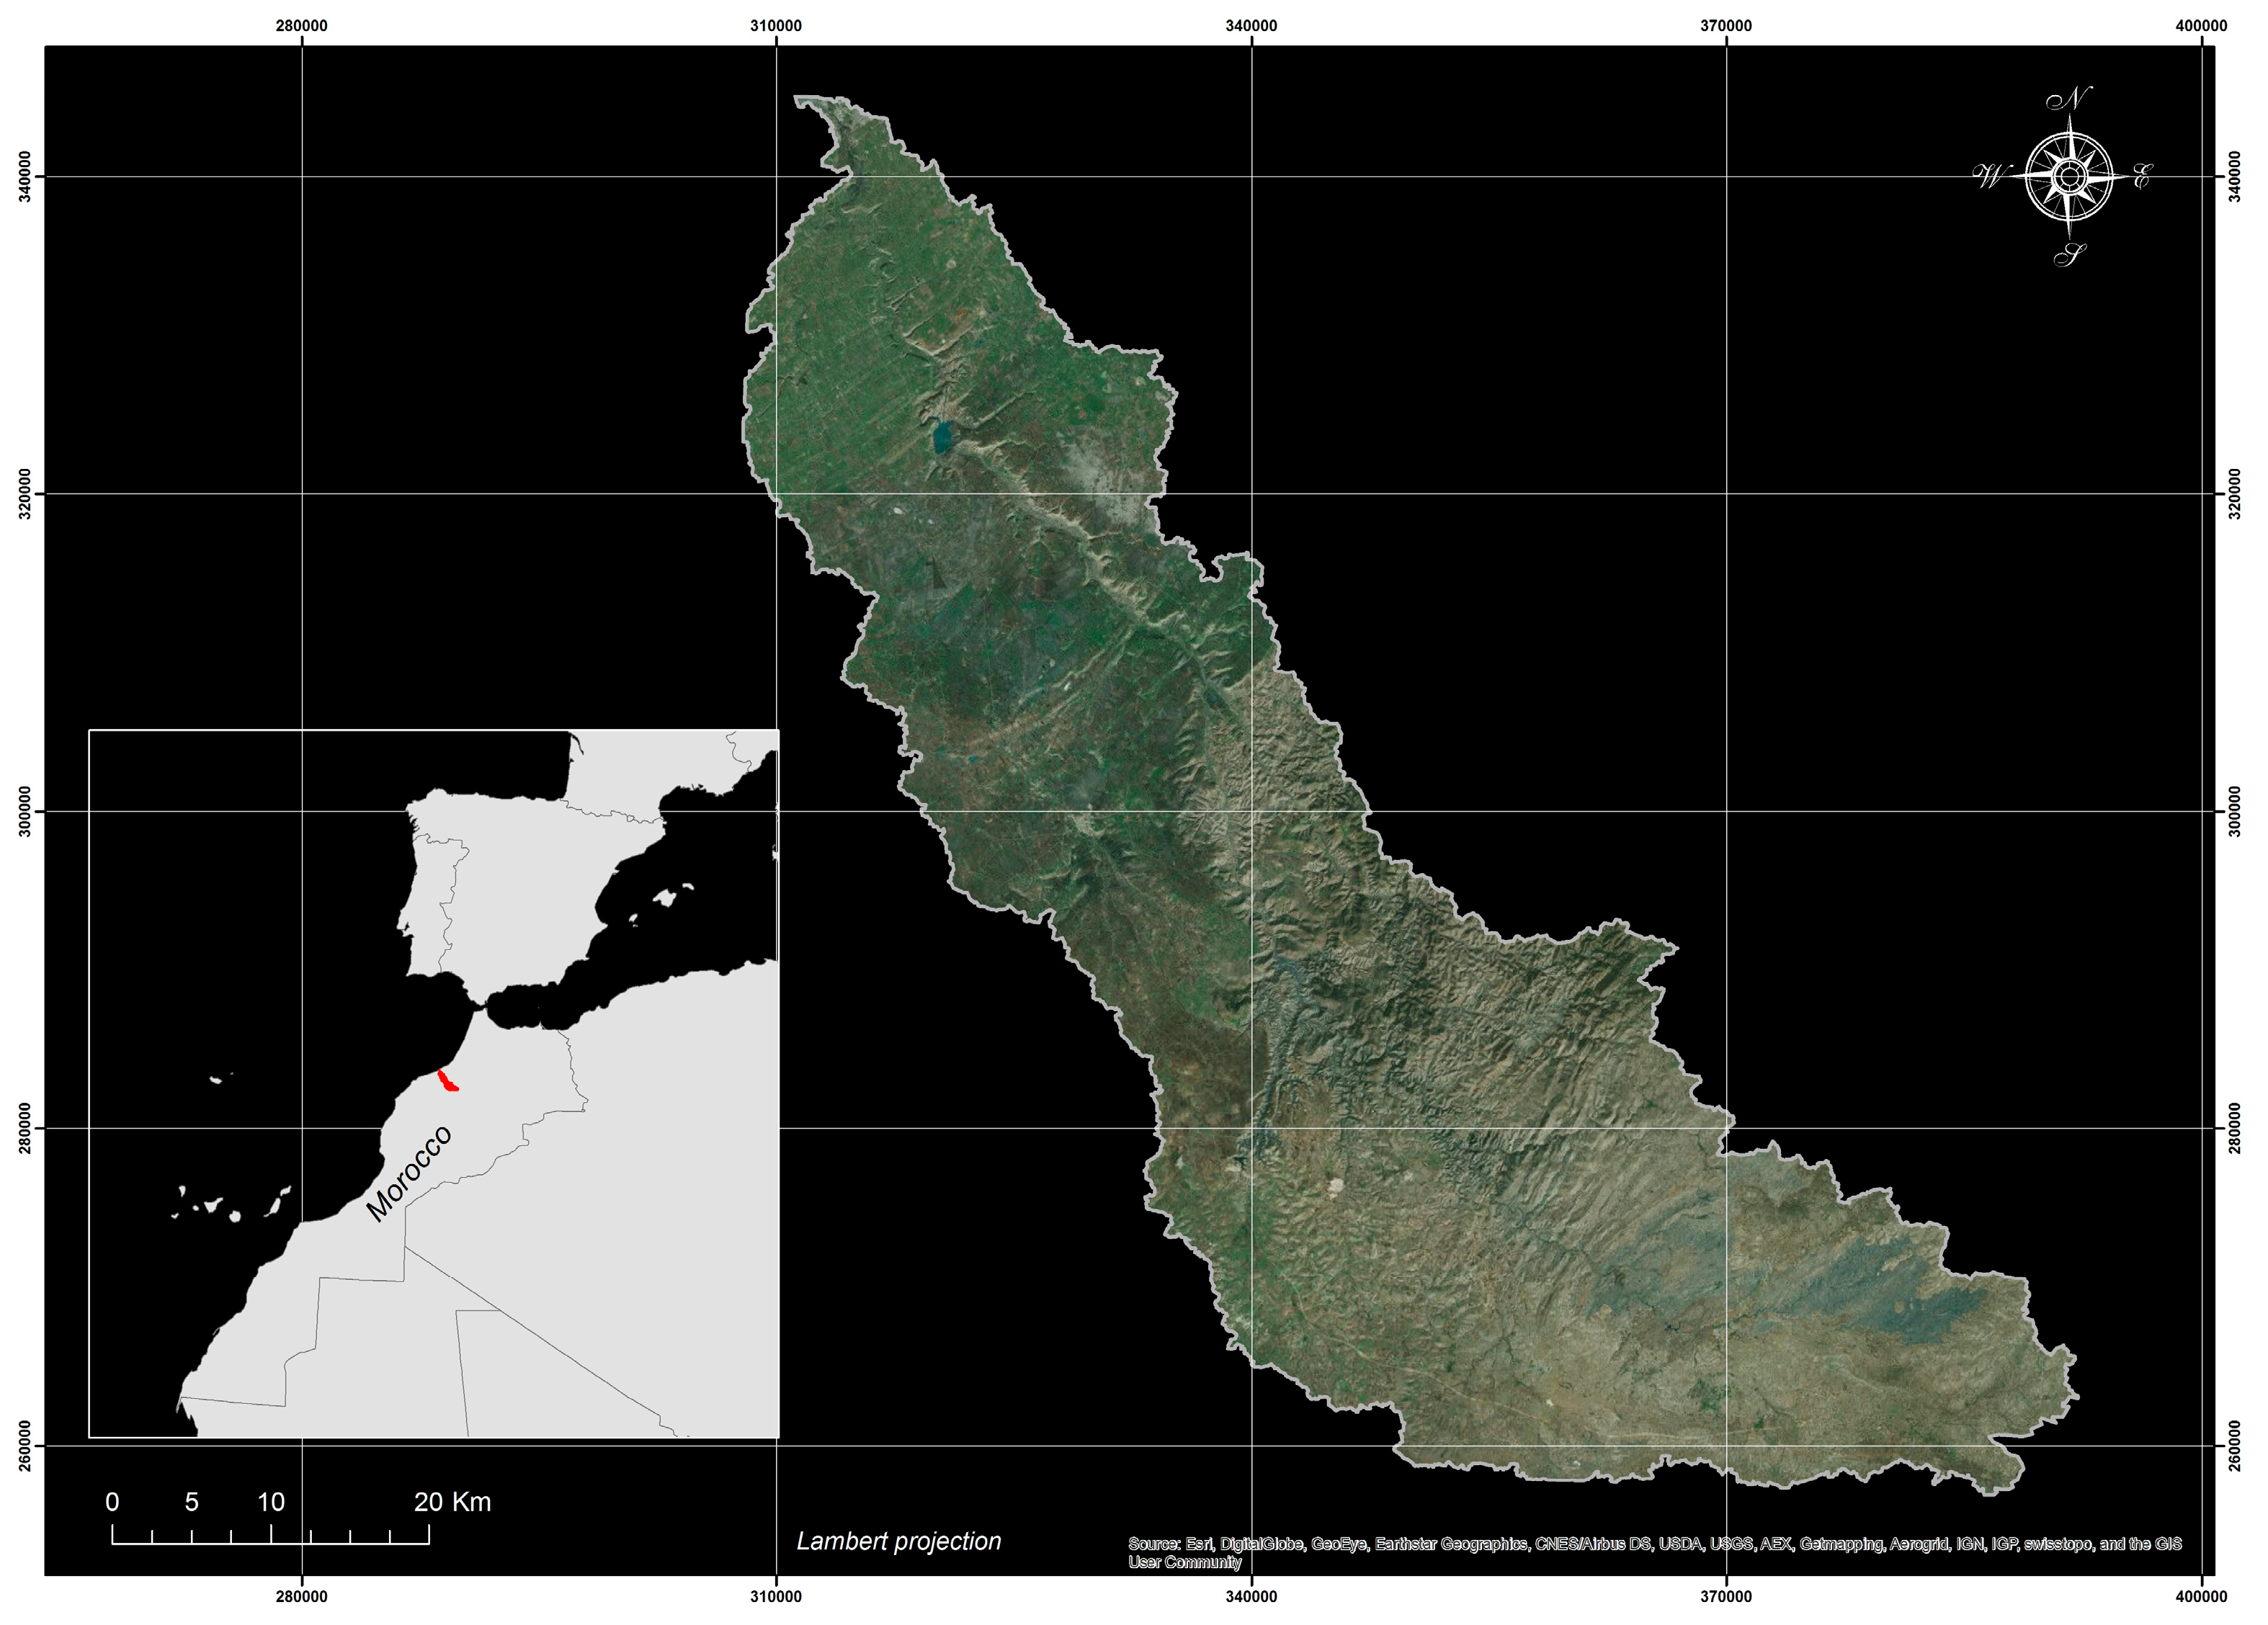
The catchment area of Oued El Maleh, the subject of this study, covers an area of 2577 km
2. It is spread across Settat, Benslimane and Mohammedia cities and is located in the region of Casablanca-Settat, between 32°90′′ N and 33°76′′ N and 06°60′′ E–07°50′′ E. It’s bordered on the North-East by Oued Nfifikh watershed and the oceanic basins of Chaouia on the South-West (
Figure 1). On the litho-geological level, it is characterized by the presence of four litho-facies units namely: (i) the loose sediment or soil, (ii) the less resistant and highly altered rock and/or soil (red), (iii) the weakly or moderately compacted rocks and/or soils and (iv) the compacted and unaltered rock. The average annual rainfall is 320 mm. The altitude is ranging from 0 to 962 m.
The vegetation cover is dominated by cereals (wheat, barely, etc.), grazing plants and forest species based on Thuya, Cork-Oak and Evergreen-Oak.
The catchment area is drained by the Oued El Maleh and its tributary Oued Hassar, Oued Zamra and Oued Laatach and whose outlet is located in the city of Mohammedia. The Oued El Malehdam is located at 28 km from Casablanca city and at 20 km upstream from the outlet. With a volume of water retention of 5.2 million m3, the dam allowed the installation of many farms dedicated to wine and cereal growing. This contributed to the prosperity of the neighboring areas and the setting of abundant agricultural labor force in rural towns. The Tamesna dam, recently built at the outlet of Oued Zamra, tributary of Oued El Maleh, offers 57 million m3 storage capacity. It was especially built to supply the cities of Ben Ahmed, El Gara and surrounding areas with drinking water and irrigation. The maintaining of the functions of this building depends on the attenuation of desertification effects and soil protection against erosion in the region.
The wetland complex, made up of two separate systems Oued El Maleh estuary and its dam’s reservoir, has been classified by the Ramsar Convention as a Ramsar Site, which has international biological and ecological interest.
The study of both demography and the usage patterns of the 24 communities that occupy the study area contributes to an understanding of the relationship between the natural resources and the ever increasing population. In 2014, the total population of the watershed had approximately 462,773 inhabitants, spread over 112,323 households. The sex ratio is almost 50% and the average enrolment rate is 28.9%. The phenomenon of migration is very low in the study area and often directed towards Casablanca and Mohammedia cities. The settlement is either scattered or grouped in douars or are very often in hamlets whose proximity to each other is 5–10 min walk.
The most common activity around the watershed is agriculture, which employs 74.7% of the labor force. The main cultivated crops are cereals. People living near the forests of Achach, Al Khatouate and El Mdakra are engaged in grazing and carbonization, which both depend on these resources [
12]. The private land “Melk” remains the most dominant status of the land in the study area.
3. Data Used
The data used in this study include land use, digital elevation model (DEM), rainfall data and soil data. The land use was extracted from Landsat image Enhanced Thematic Mapper (ETM) acquired on 16 December 2014 with a spatial resolution of 30 m [
13] and projected in Universal Transverse Mercator (UTM). The DEM was extracted for the study area from ASTER Global Digital Elevation Model (ASTER GDEM) with spatial resolution of 30 m. The rainfall data for 30 years were collected from the Hydraulic Basin Agency of Bouregreg and Chaouia over 12 climate stations. The pedology data were provided by the National Institute for Agricultural Research of Settat. Livestock size of the different communities was obtained from Agriculture General Recensement of Chaouia Ouardigha. The population size was taken from the census done in 2014 by the Ministry of Plan.
4. Method Used
Different approaches are used for the assessment and monitoring of desertification. Some models combine man and the environment, and generate synthetic indexes; this is the case with integrated models [
14]. Other models use state indicators [
15] directly measurable or observed in the field or on a satellite image, such as vegetation cover or soil salinity.
The methodology used is based on the original model of MEDALUS, developed in a large project established by the European Commission [
16]. The MEDALUS is one of the most widely used models in monitoring desertification sensitivity. Several regional studies were realized based on it, especially in Euro-Mediterranean countries. In the South side of the Mediterrean sea, other studies, which were less numerous, were conducted to assess desertification, namely these of Chakroun et al. in Tunisia [
17], and Fozooni [
18] and Sepehr [
19] in Iran. In Morocco, Mokhtari et al. used the same model for the Moulouya watershed [
20].
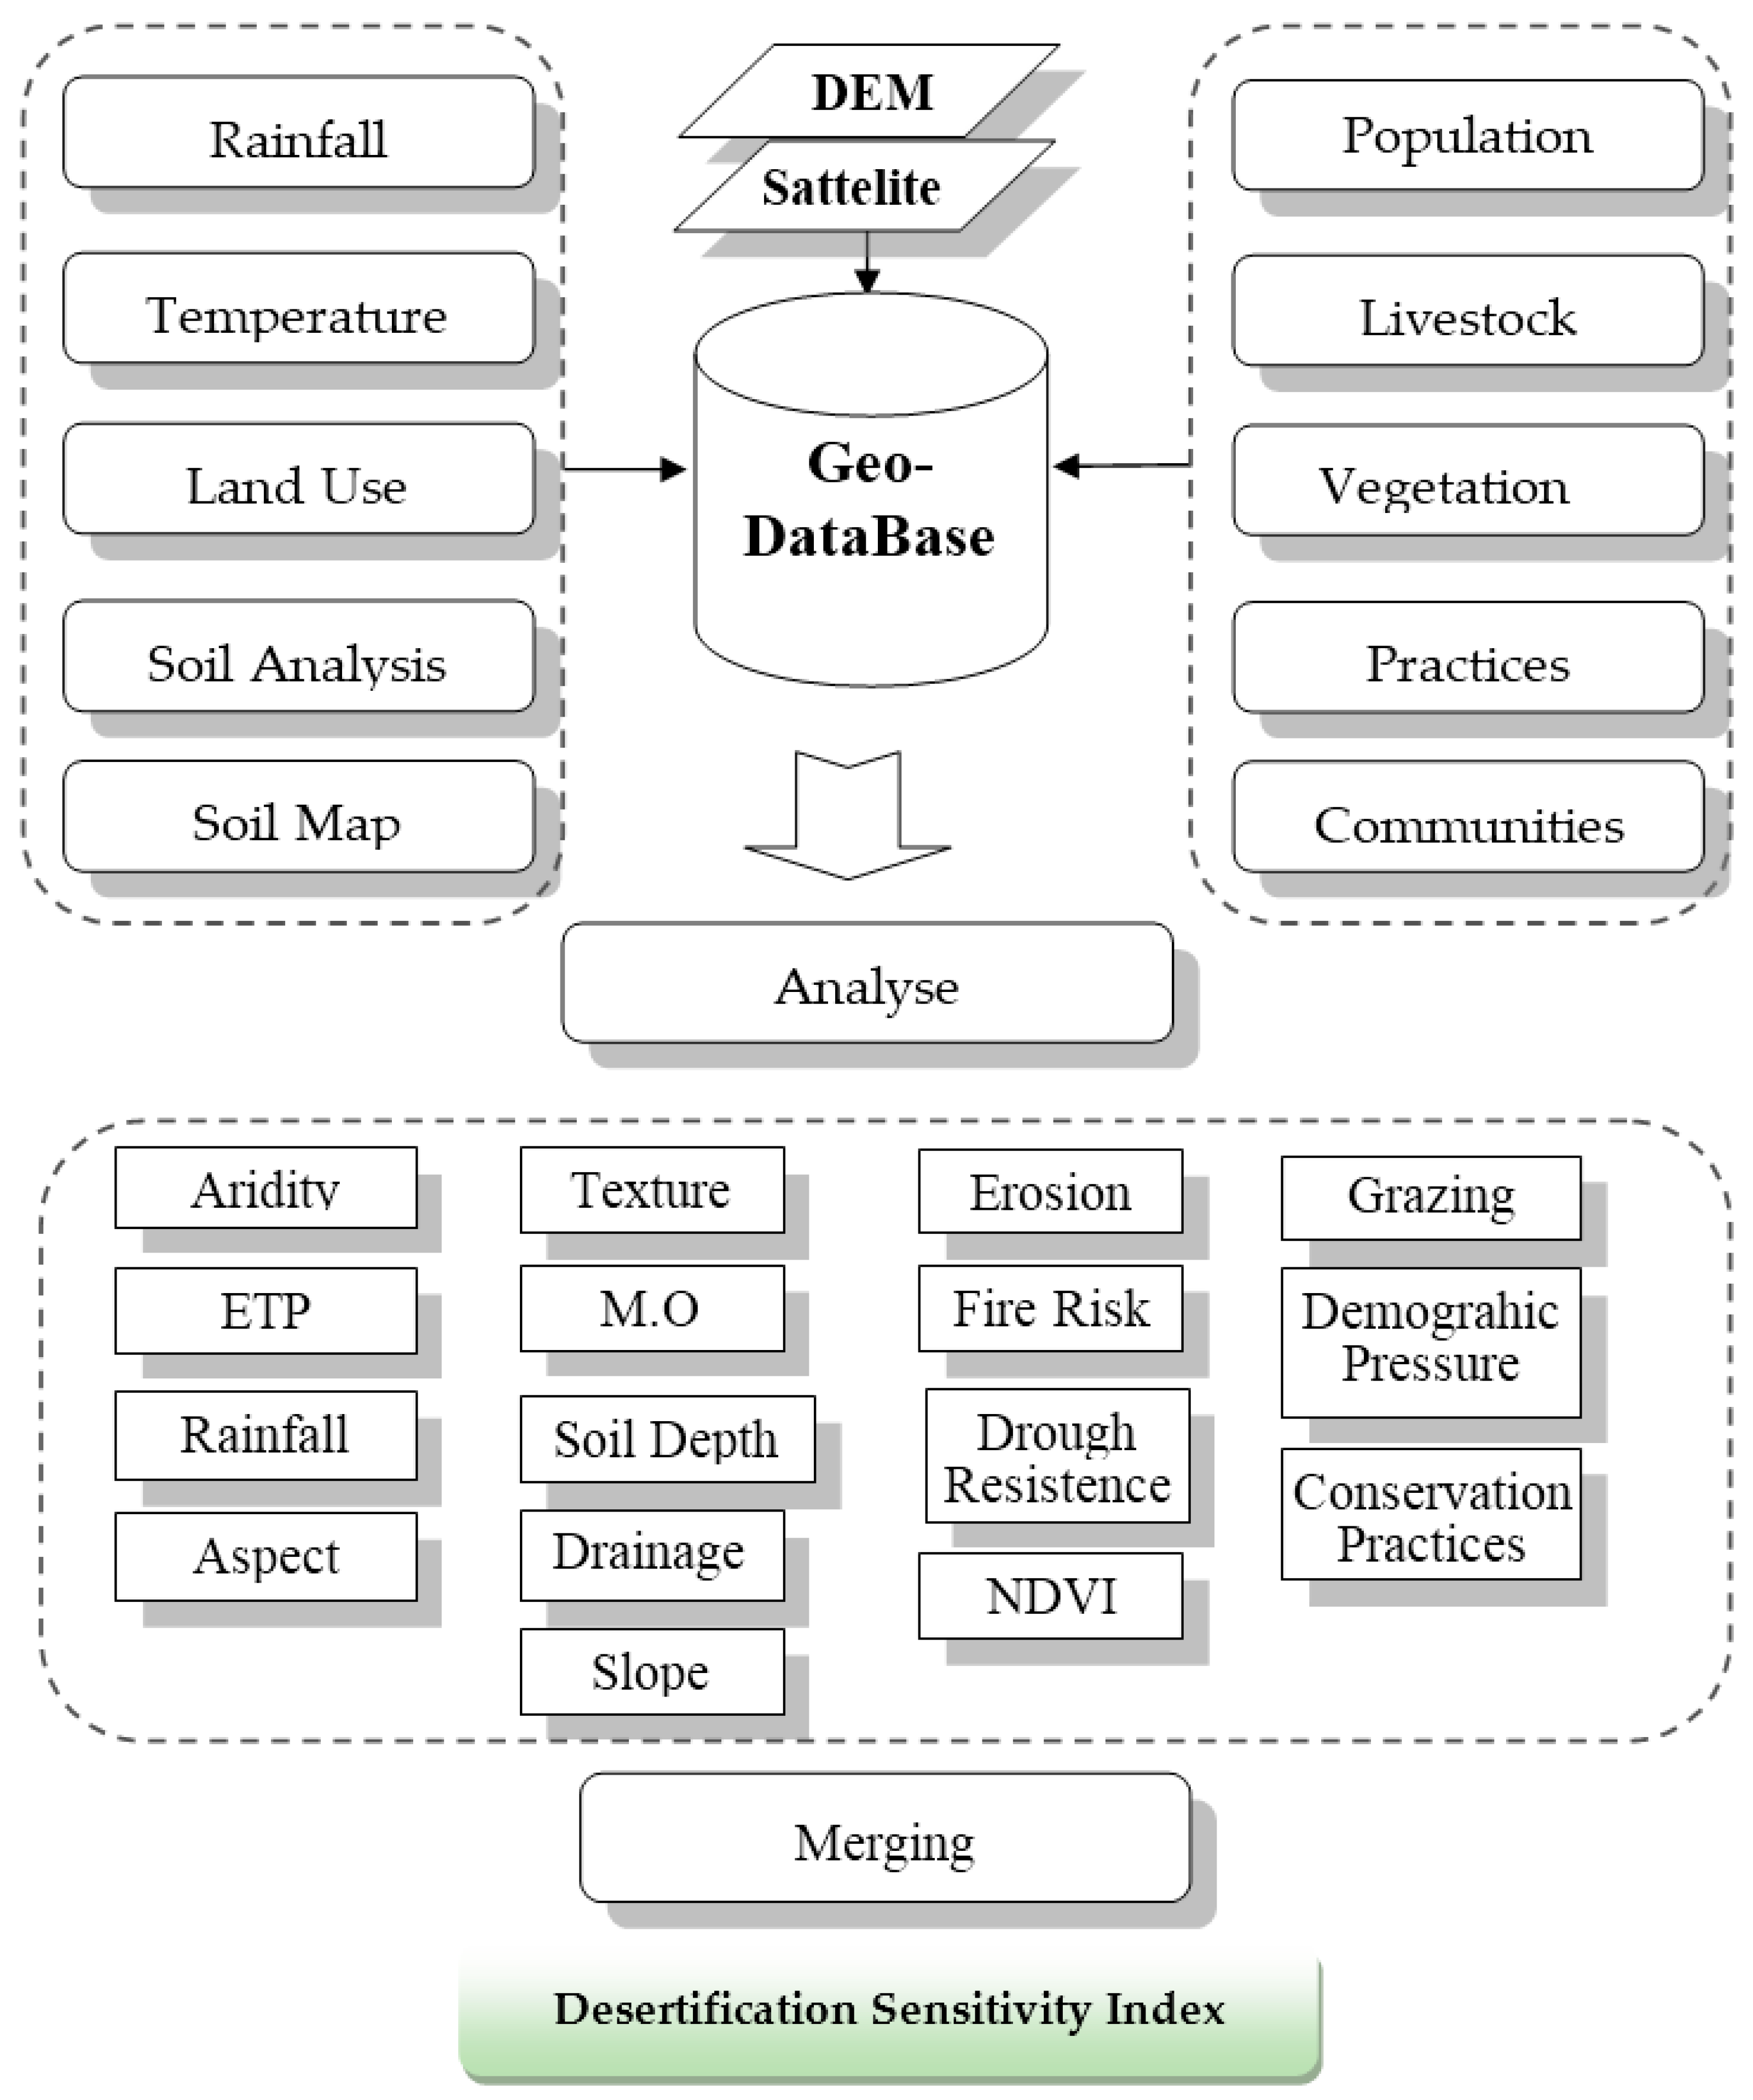
The MEDALUS identifies the environmentally sensitive areas [
21] and involves soil, vegetation, climate and management factors [
22]. Each factor is represented by an index which is calculated by the combination of sub-indexes. The output map corresponds to desertification sensitivity areas (
Figure 2).
The areas with high soil, climate, vegetation and management quality show a low sensitivity desertification index, whereas, the areas that have low soil, climate, vegetation and management quality correspond to high risk of desertification sensitivity.
GIS and remote sensing, considered decision making tools, enabled advances in spatial sciences [
23] including the monitoring of desertification sensitivity.
4.1. Soil Quality Index
The soil factor is intimately linked to the desertification process; its impact is determined by the strength of cohesion between soil particles, the water retention capacity, the level of development of the surface horizon, the texture and the structure. The evaluation of the soil factor consists in appreciating its fertility and its predisposition to be preserved against climatic hazards and agricultural techniques using intrinsic characteristics. The algebraic expression reflecting the effect of soil factor is given by the Equation (1):
where
SQI is the soil quality index;
T is the tex
ture (silt, sand, clay);
Dp is the depth of the surface horizon;
S: the slope;
Dr is the drainage;
OM is the organic matter.
The sub-indexes
T,
Dp,
Dr and
OM were calculated after scanning the soil map of the watershed and the allocation of values from the physical analyzes of the soil (
Table 1). The sub-index slope was derived from a digital elevation model ASTER GDRM. All the variables correspond to weights (
Table 2) and are dimensionless.
The weights attributed to each sub-index relating to soil properties are recorded in the following table.
4.2. Vegetation Quality Index
Vegetation plays an important role in preventing desertification. It makes it possible by both fixing soil with its root system [
24] and obstructing rain with foliage [
25]. Vegetation, therefore, reduces the kinetic energy of raindrops. Plant cover promotes water infiltration and reduces runoff. The senescent vegetation enriches surface soil with organic matter and improves its structure and cohesion. The vegetation index was approached using the formula (2).
where:
VQI is the vegetation quality index;
FR is the fire risk;
PE is the protection against erosion;
DR is the drought resistance;
C is the coverage. All the variables correspond to weights (
Table 3) and are dimensionless.
FR,
PE and
DR were derived from the land use map, the sub-index
C was extracted from the calculation of the Normalized Difference Vegetation Index (NDVI) [
26].
The NDVI reflects the photosynthetic activity of vegetation and it is highly correlated to vegetation presence [
27]. The
Table 3 below shows the weights attributed to each sub-index that correspond to the vegetation index.
4.3. Climate Quality Index
Difficult climatic conditions, namely dryness and recurrent and prolonged drought, put the planted areas in a state of physiological dysfunction, which makes them vulnerable to dieback. The following formula gives the expression of the climate index.
where:
CQI is the Climate Quality Index;
R is the rainfall;
ETP is the evapotranspiration;
Ar is the aridity;
A is the aspect.
ETP sub-index values were calculated using the Thornthwite formula (4). Aridity came from the UNESCO formula that characterizes arid areas (5). Rainfall and temperatures data were recorded at 12 stations bordering the study area (
Table 4). They were interpolated across the watershed using the kriging geostatistic method. The aspect was extracted from ASTER DEM using spatial analyst extension. All the variables correspond to weights (
Table 5) and are dimensionless.
where:
ETP (
m) is the mean evapotranspiration for the month
m (m = 1 to 12), the unit corresponds to mm;
T (
m) is the mean temperature for the month
m, the unit corresponds to °C.
where:
I is the annual thermic index.
F(m,ϕ) is a corrective factor which depends of the month
m and the latitude.
where:
R is the annual rainfall and
ETP is the evapotranspiration.
The weights attributed to each sub-index of climate index are shown in
Table 5.
4.4. Management Quality Index
Humans are an important factor that influences the desertification process by agrosylvopastoralism activities. Deforestation, over-grazing and inappropriate agricultural practices, such as culture in a direction perpendicular to the contour lines, are all elements that accentuate the process of desertification. The management quality index is calculated by the following equation.
where:
MQI is the Management Quality Index;
G is the grazing,
PD is the population density;
CP is the conservation practices. All the variables correspond to weights and are dimensionless.
Grazing sub-index was calculated by the ratio of the real load of livestock (RL) that goes through the watershed on the potential load (PL) that correspond to the carrying capacity of pasture land (Equation (7)). RL and PL are calculated by Livestock Unit (LU) which is a reference unit that facilitates the aggregation of livestock from various species (sheep, goat, cow, etc.).
The potential load of livestock (
PL) is derived from the feed units (
FU) that may be provided by the rangeland that are not deteriorated. The
FU is a unit for measuring and comparing the nutritive value of feed. One
FU is the equivalent to the average energy produced by 1 kg of dry barley. Basically, one
LU needs one
FU every day, and it is equivalent to the need of one sheep unit (
SU). The real load (
RL) corresponds to the effective livestock size (
Table 6).
where:
GU is goat unit;
SU is sheep unit;
BU is bovine unit;
CU is camel unit.
The weights attributed to each sub-index relating to anthropozoogenic factors are shown in
Table 7.
4.5. Sensitivity Desertification Index
The Equations (1)–(3) and (6) give expressions for the various indicators. The combination of different indicators, following the model given by Equation (9), gives the degree of sensitivity to desertification, DSI (Desertification sensitivity index). The value of DSI ranges between 1 and 2. All the variables are dimensionless.
5. Results
The calculation of each indicator involved in the MEDALUS model was done through algebraic combination tools and by a multitude of spatial analysis functions. The different indexes
VQI,
SQI,
MQI and
CQI are represented in maps with matrix format (
Figure 3,
Figure 4,
Figure 5 and
Figure 6). Their combination by the MEDALUS model (Equation (9)) allows having a sensitivity to desertification map (SDI) where at each location we are able to see the potential of desertification.
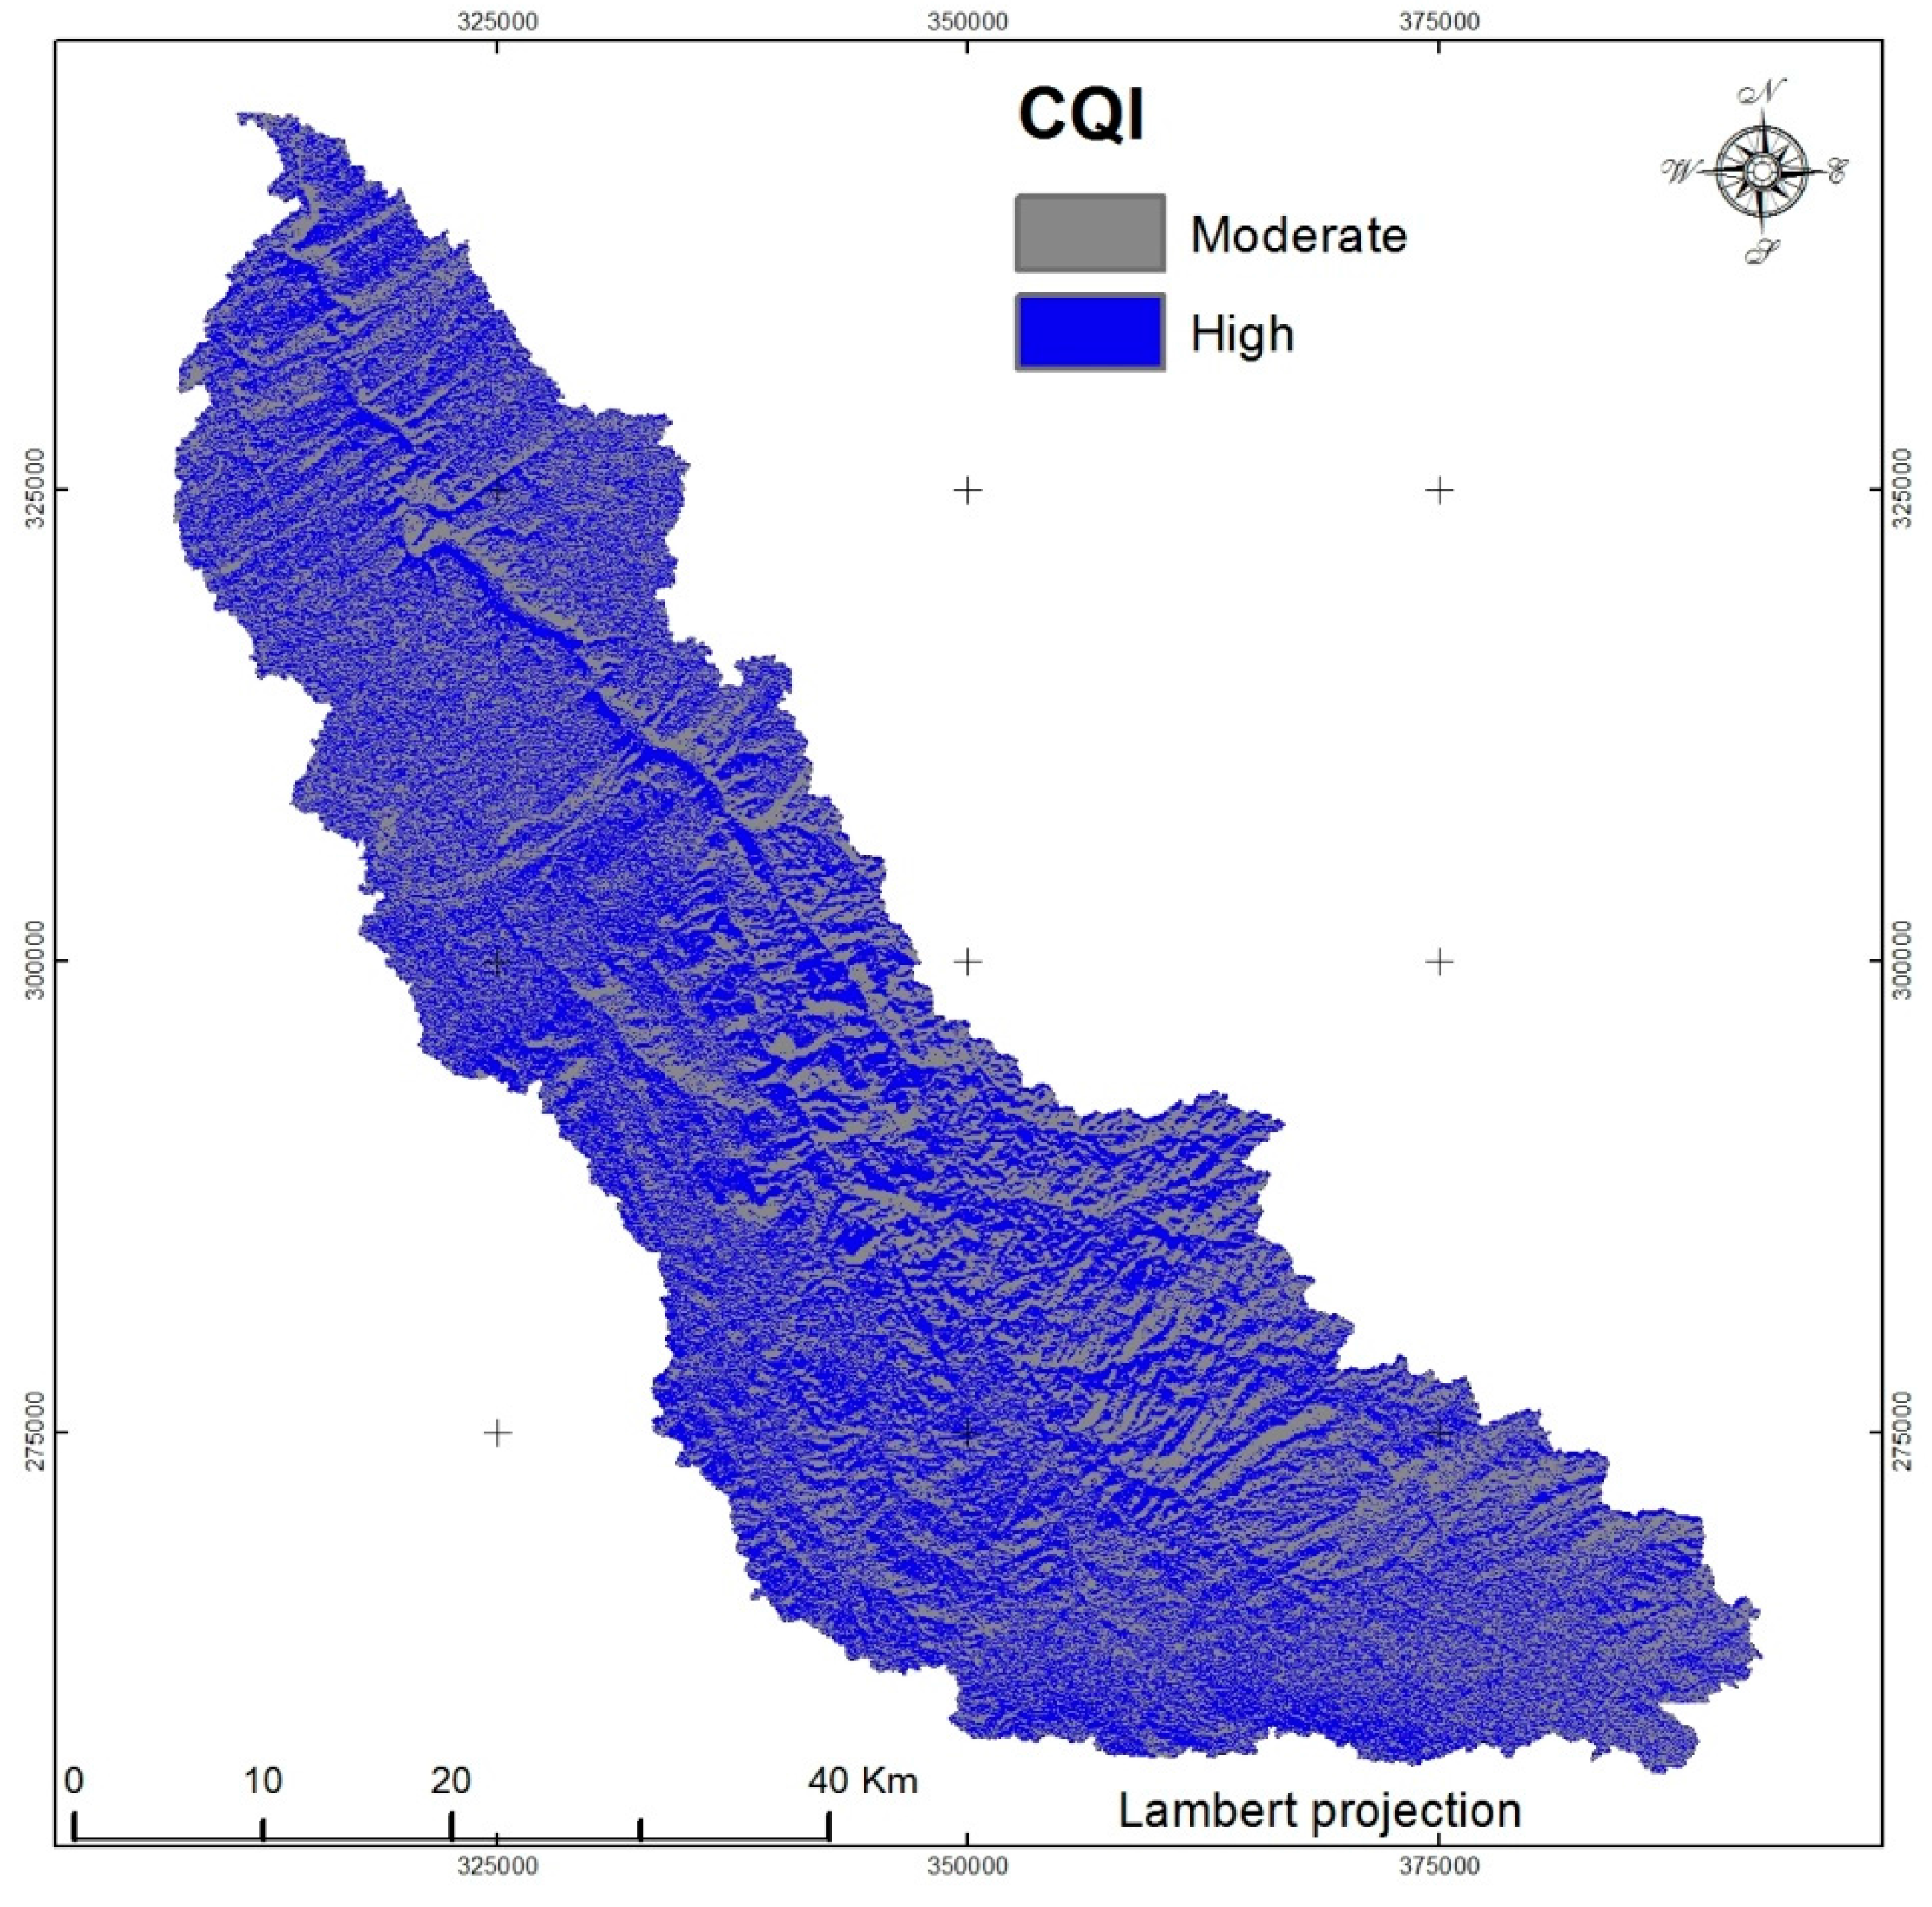
The Climate Quality Index is based on four sub-indexes: aspect, rainfall, aridity and evapotranspiration. As mentioned before, the aspect map was derived from the digital elevation model ASTER GDEM with 30 m of resolution. While the rainfall, aridity and evapotranspiration maps were calculated by using the climate data provided by the main weather stations in the region.
Table 5 gives scores for the different class of each sub-index. The rainfall class “>300 mm” dominates the entire watershed, due to the importance of a semi-arid and sub-humid climate. The Aspect classes “North-East” and “South-West” are the dominant due to the orientation of the watershed. They represent, approximately 67% of the area.
The assessment of the “climate” factor based on the data of 12 climate stations shows an index between 1.00 and 1.30 with an average of 1.14 (
Figure 3). The spatial variability is strongly linked to the Aspect sub-index due to the homogeneity of Rainfall and Aridity sub-indexes. A total of 51% of the study area is qualified as “good climate quality” while the rest of the area (49%) is qualified as “moderate climate quality”. On the other hand, the Climate factor contributes less to the desertification process, which is justified by the absence of the “weak class” of the Climate index.
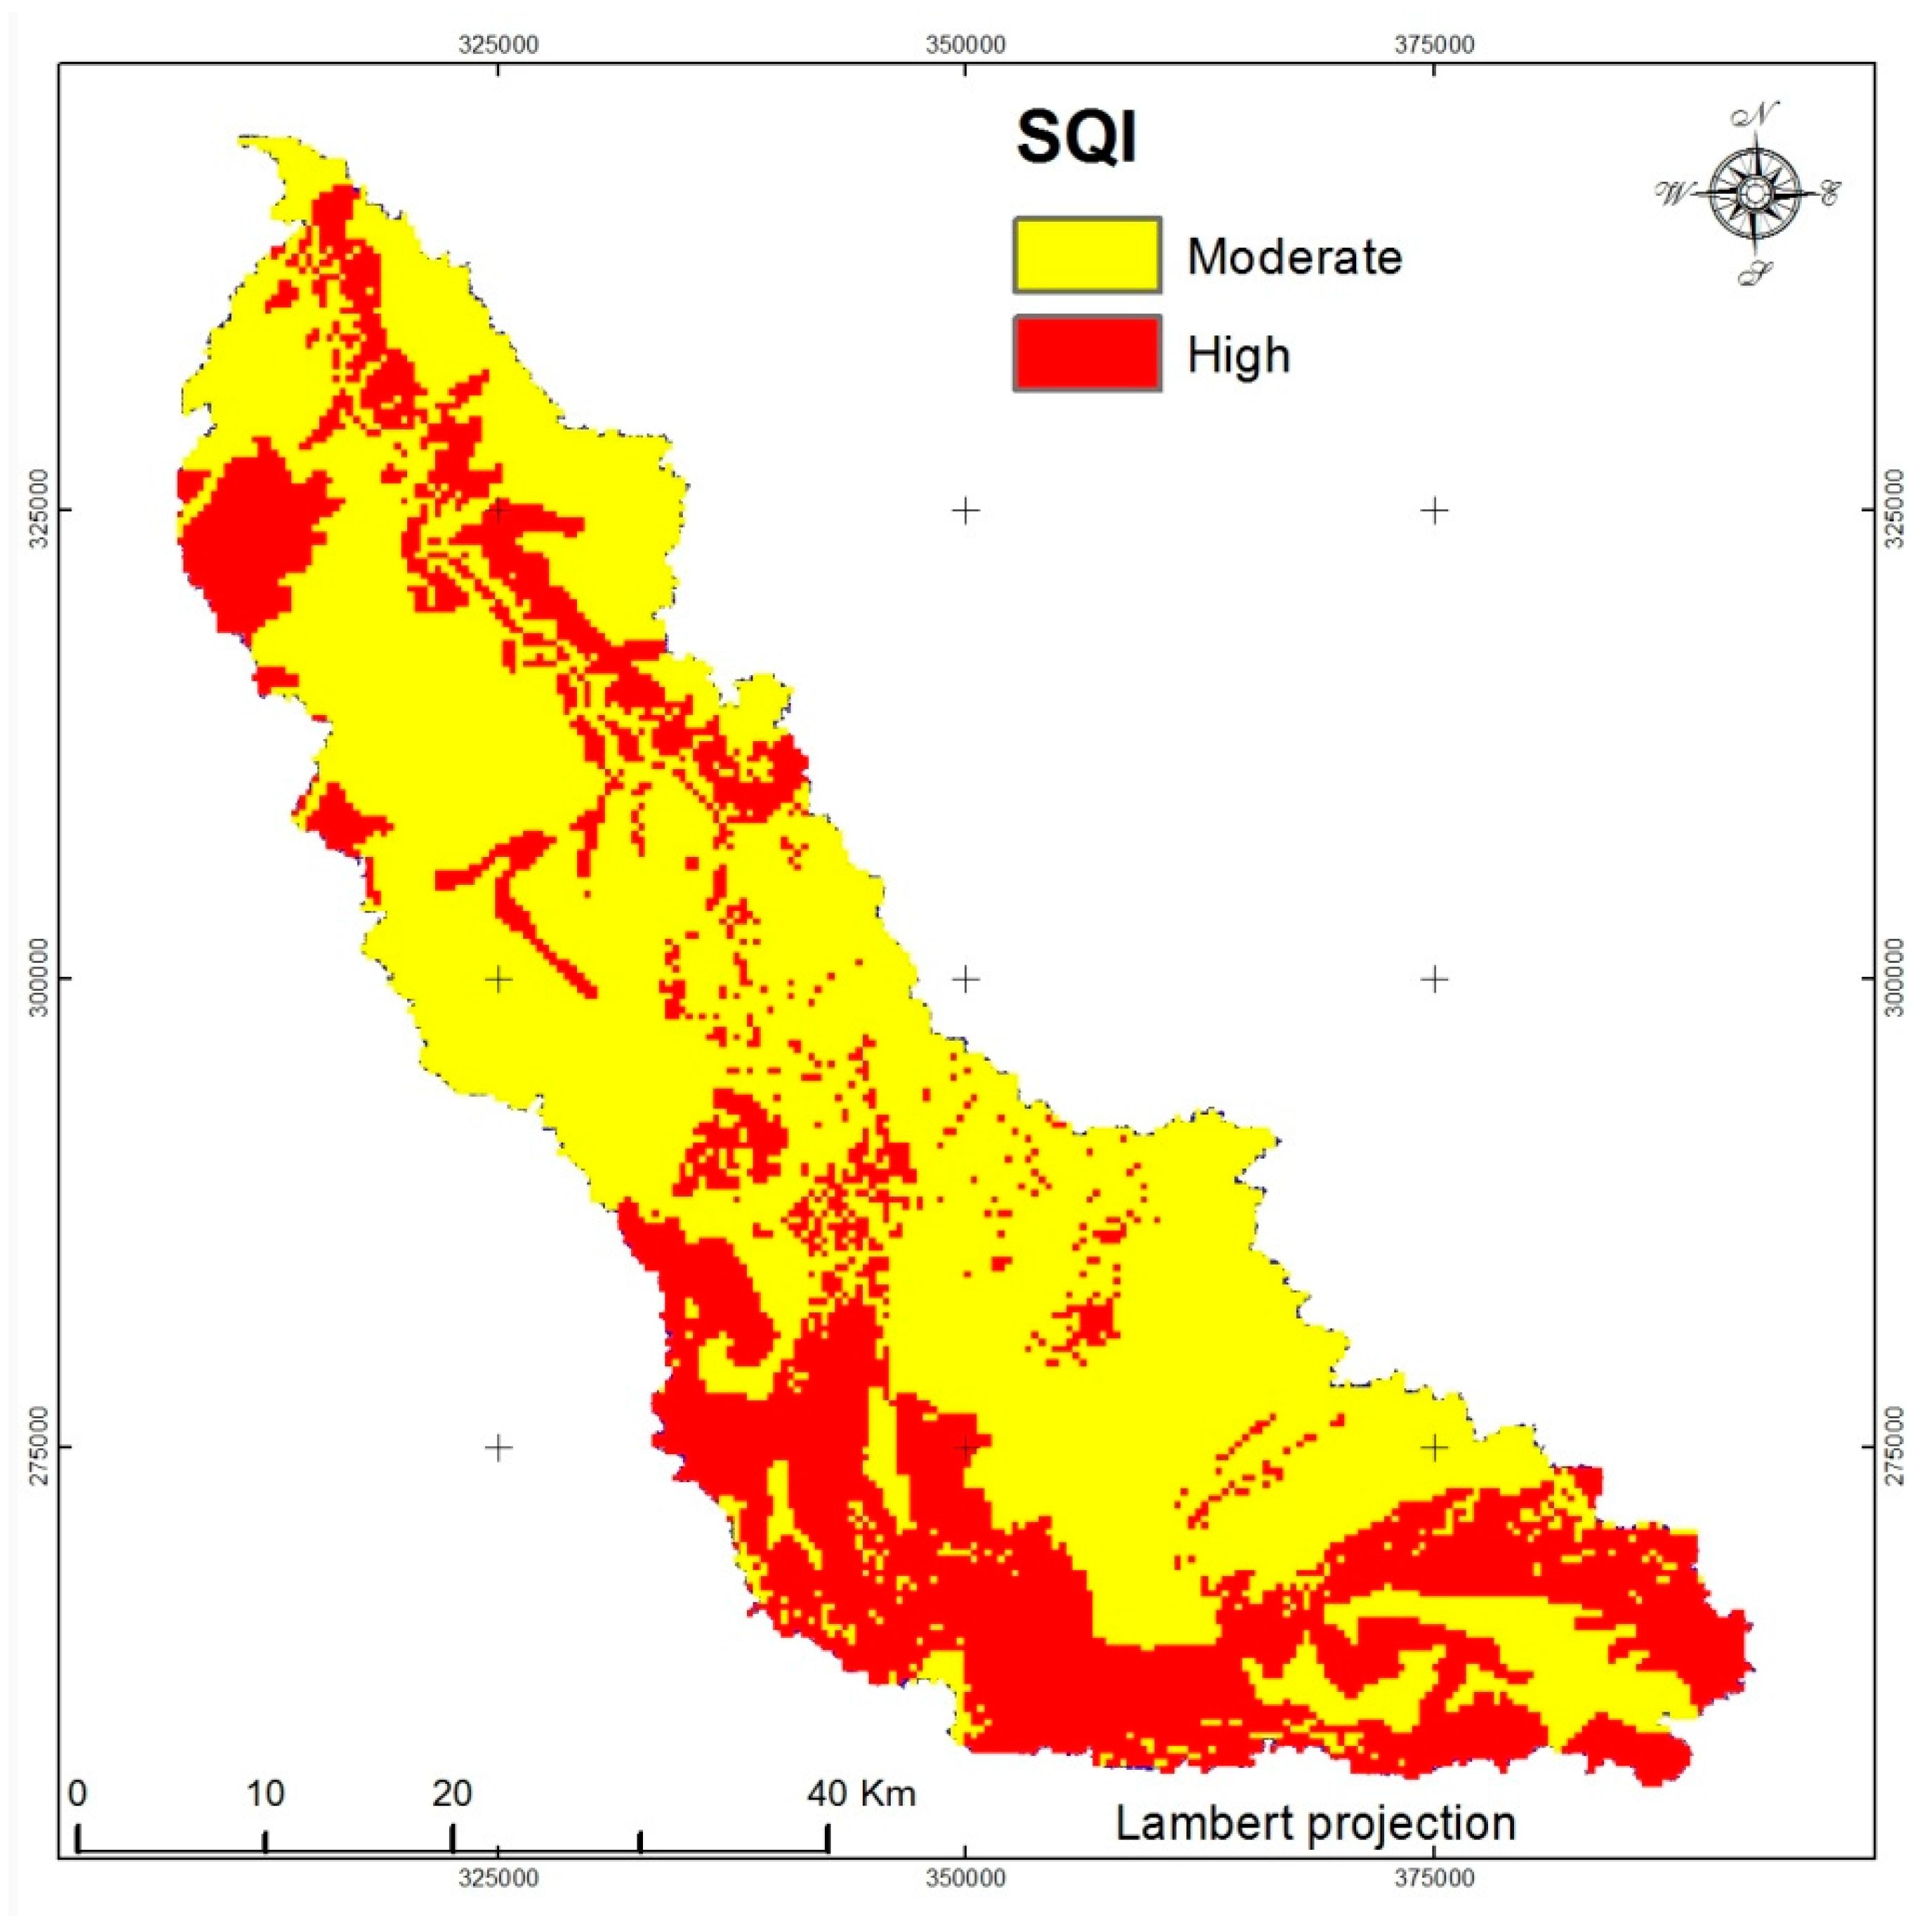
The Soil Quality Index was obtained by the overlying of five layers, namely the texture, the surface horizon depth, the slope, the drainage and the organic matter. The elaboration of these maps was implemented by means of the digitalization of the soil map and the integration of the survey analysis data for each soil type.
The soil analysis revealed that soils with coherent texture represent more than 50% of the area. Thus, these textures are encountered in calcimanesic and fersialitic soils. While tender texture represented by isohumic soil is recorded in 30% of the area.
The depth of surface horizon was extracted from the study of soil profile samples (
Table 1) and generalized over the watershed by using the soil type map. These depths show that 85% of the study area, equivalent to 2175 km
2, represent moderate to deep soil. Thus, soils in the study area are still conserved.
The slope map derived from the digital elevation model aforementioned shows that the areas with slope gentle to flat “<18%” are dominant (98%). This confirms that the land morphology corresponds generally to plains and low mountains.
The Soil Quality Index is between 1.07 and 1.41. Calcimagnesic and poorly evolved soils have high values; reflecting their low susceptibility to desertification. While, fertialitic, vertic and isohumic soils are moderately sensitive to desertification; this latter class occupies the north and the center of the basin. However, the “weak class” is absent in the watershed. According to the SQI map, more than two thirds (2/3) of soils, which correspond to plains and low mountains, are good quality regarding their physico-chemical intrinsic characteristics (
Table 8).
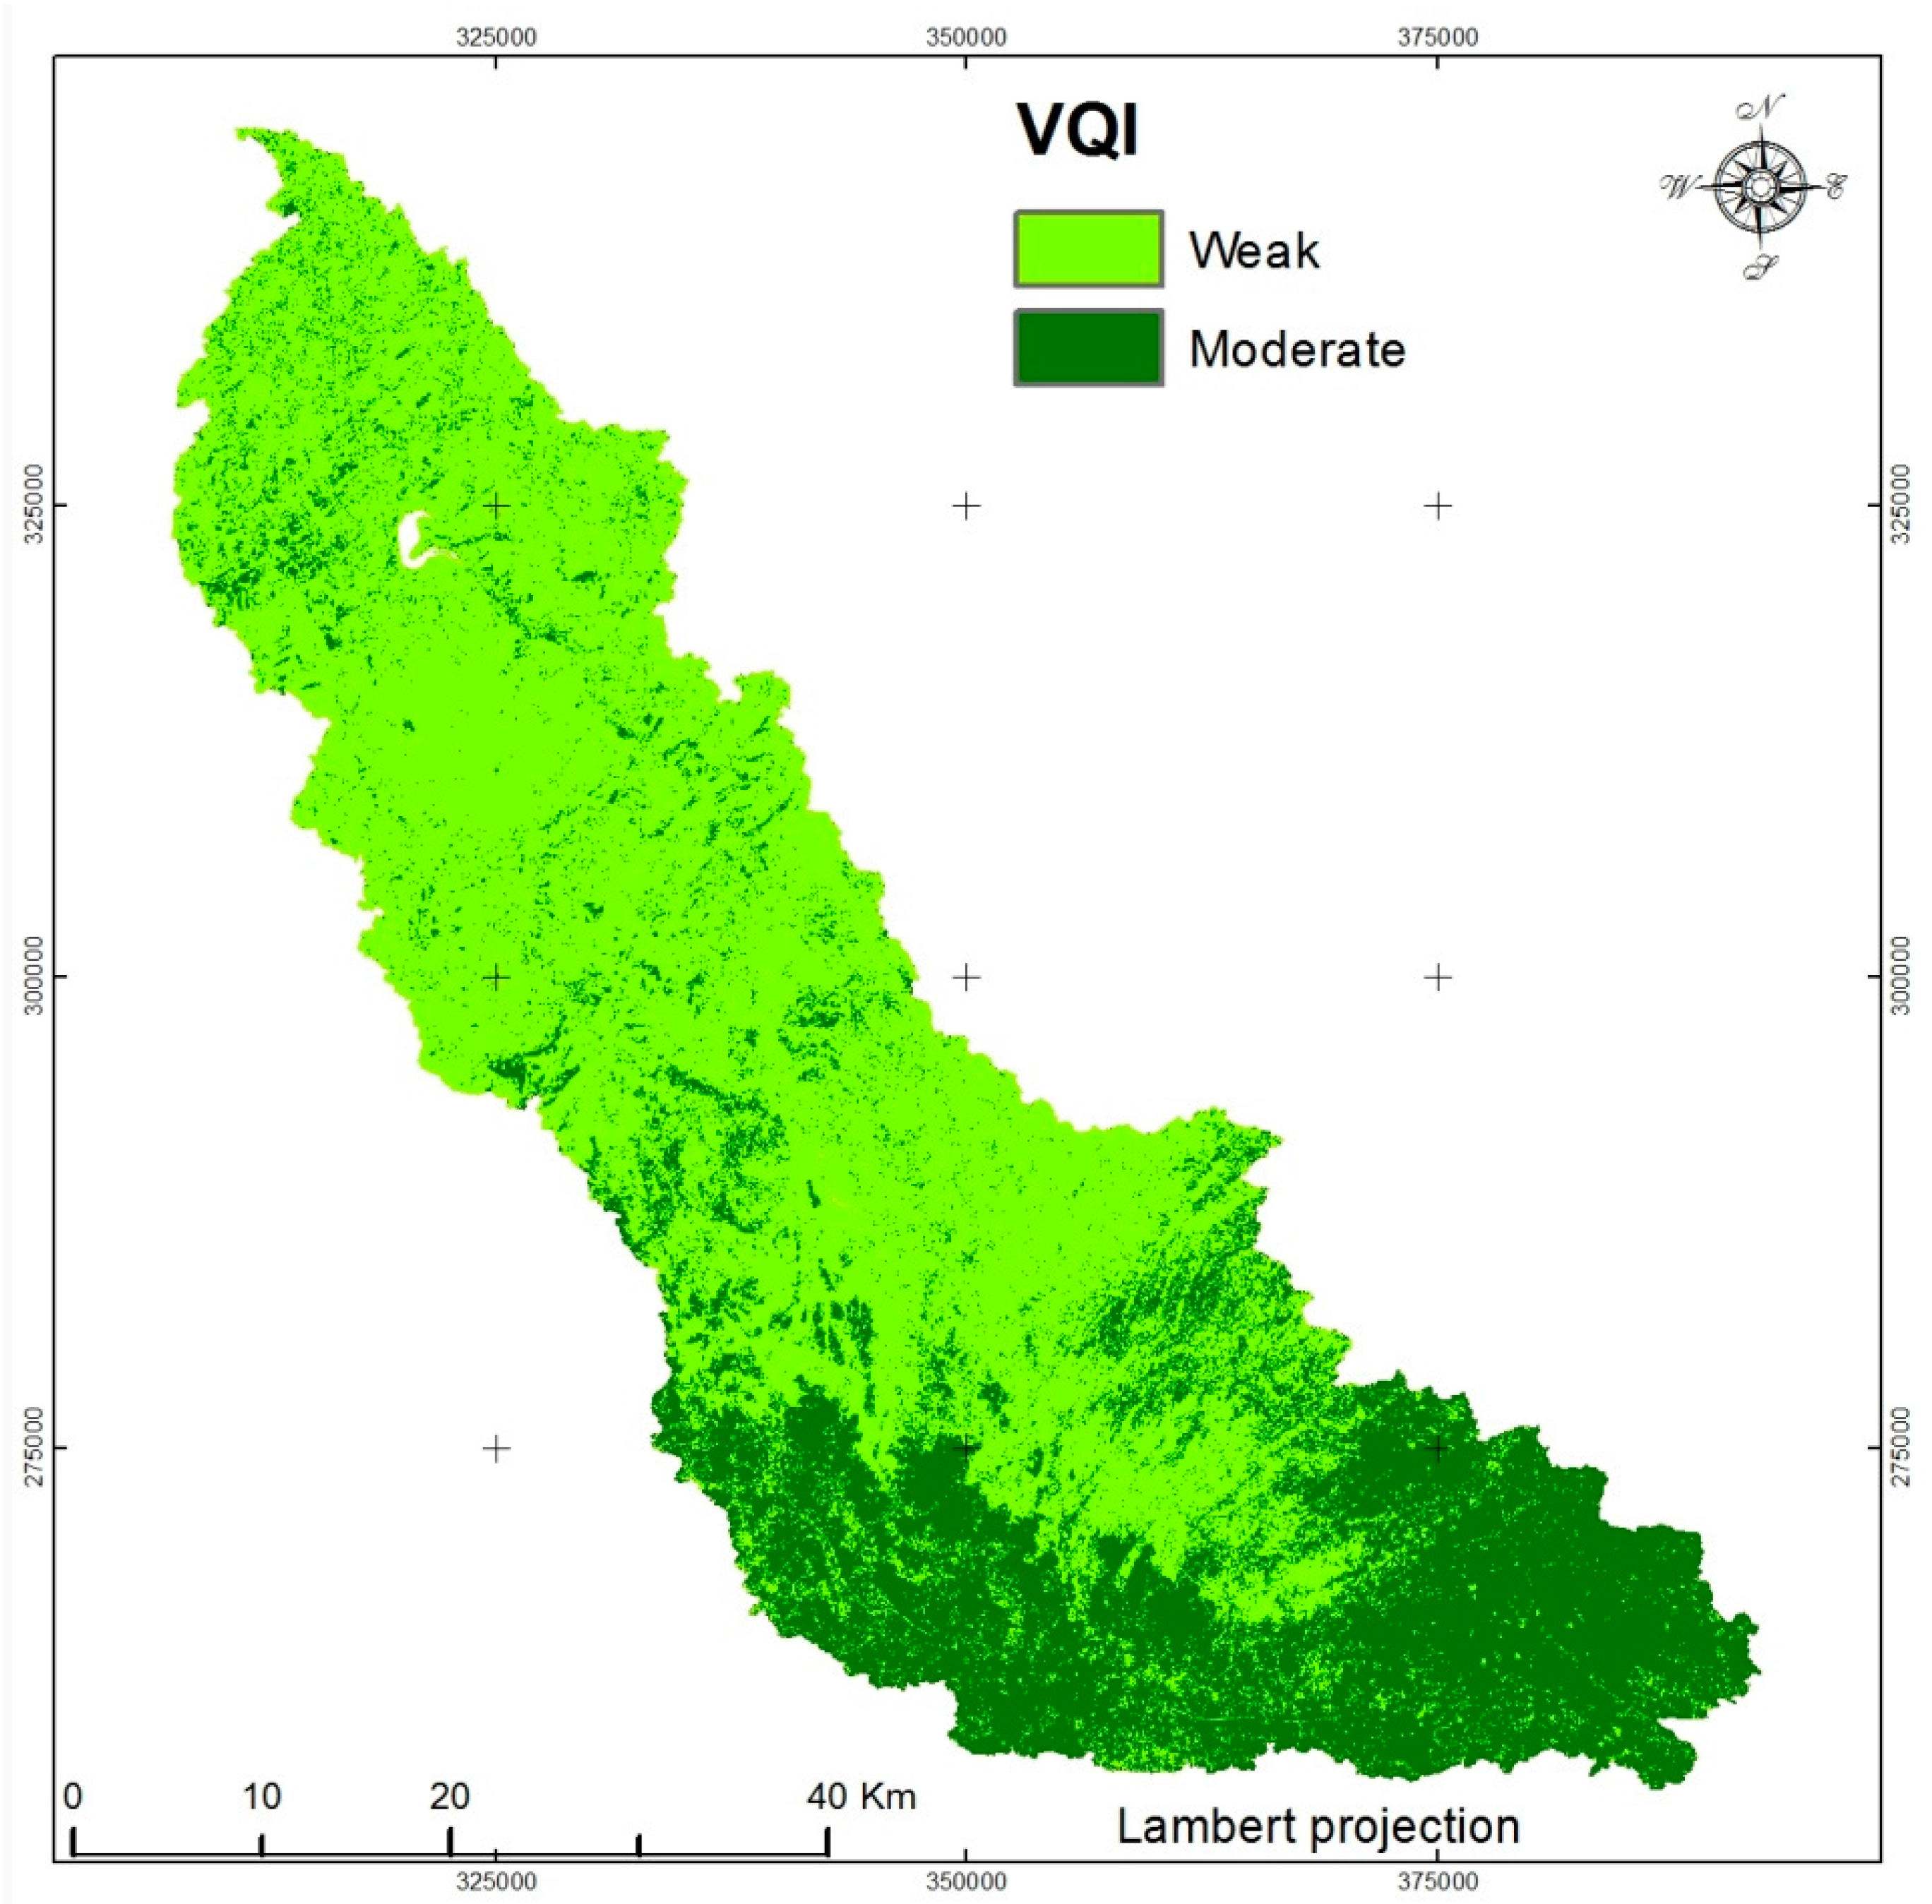
The role of vegetation is definite. The
VQI is deduced by the combination of fire risk, protection against erosion, drought resistance and coverage data. The elaboration of the
VQI map requires the use of Landsat 7 ETM+ image orthorectified and field visits. The use of satellite image with a low resolution (30 m) is justified. In fact, desertification phenomena could be noticed on big areas. The field visits have as objective to validate the supervised classification to identify the different land use. The vegetation existing in the study area corresponds to cultivated lands based on cereals (wheat, barely, etc.), forest ecosystems of thuya, evergreen oak and cork-oak and grazing plants. In the study area we find also badlands [
29] where the erosion takes linear form and the soils are inappropriate to agriculture.
The coverage sub-index shows that only 10% of the area is well covered, which can be explained by the low percentage of forests in the watershed. In fact, the presence of three layers in this type of vegetation (herbs, shrubs, tree layers) well protects the soil. However, in this area the risk of fire is high.
The fire risk grows up if we move from agricultural to forest lands. This is because of the estate nature. In fact, the forest is considered as a public property while agricultural lands are a private property. In watershed Oued El Maleh, the forests, representing only 10%, are accessible. Thus, the fire risk is low; the class of “high risk” represents only, according to FR sub-index, 13%. The setting up of the fire risk map should not only be based on the kind of the vegetation, as in this case, but should also involve wind speed and direction.
The average VQI at the watershed level is 1.35. This reflects the nature of land use characterized by the dominance of agricultural lands and by the scarcity of the forest cover (below 10%). The soil protect power against erosion in cultivated lands is comparatively lower than the one in the forest which is well protected by both its root system and foliage.
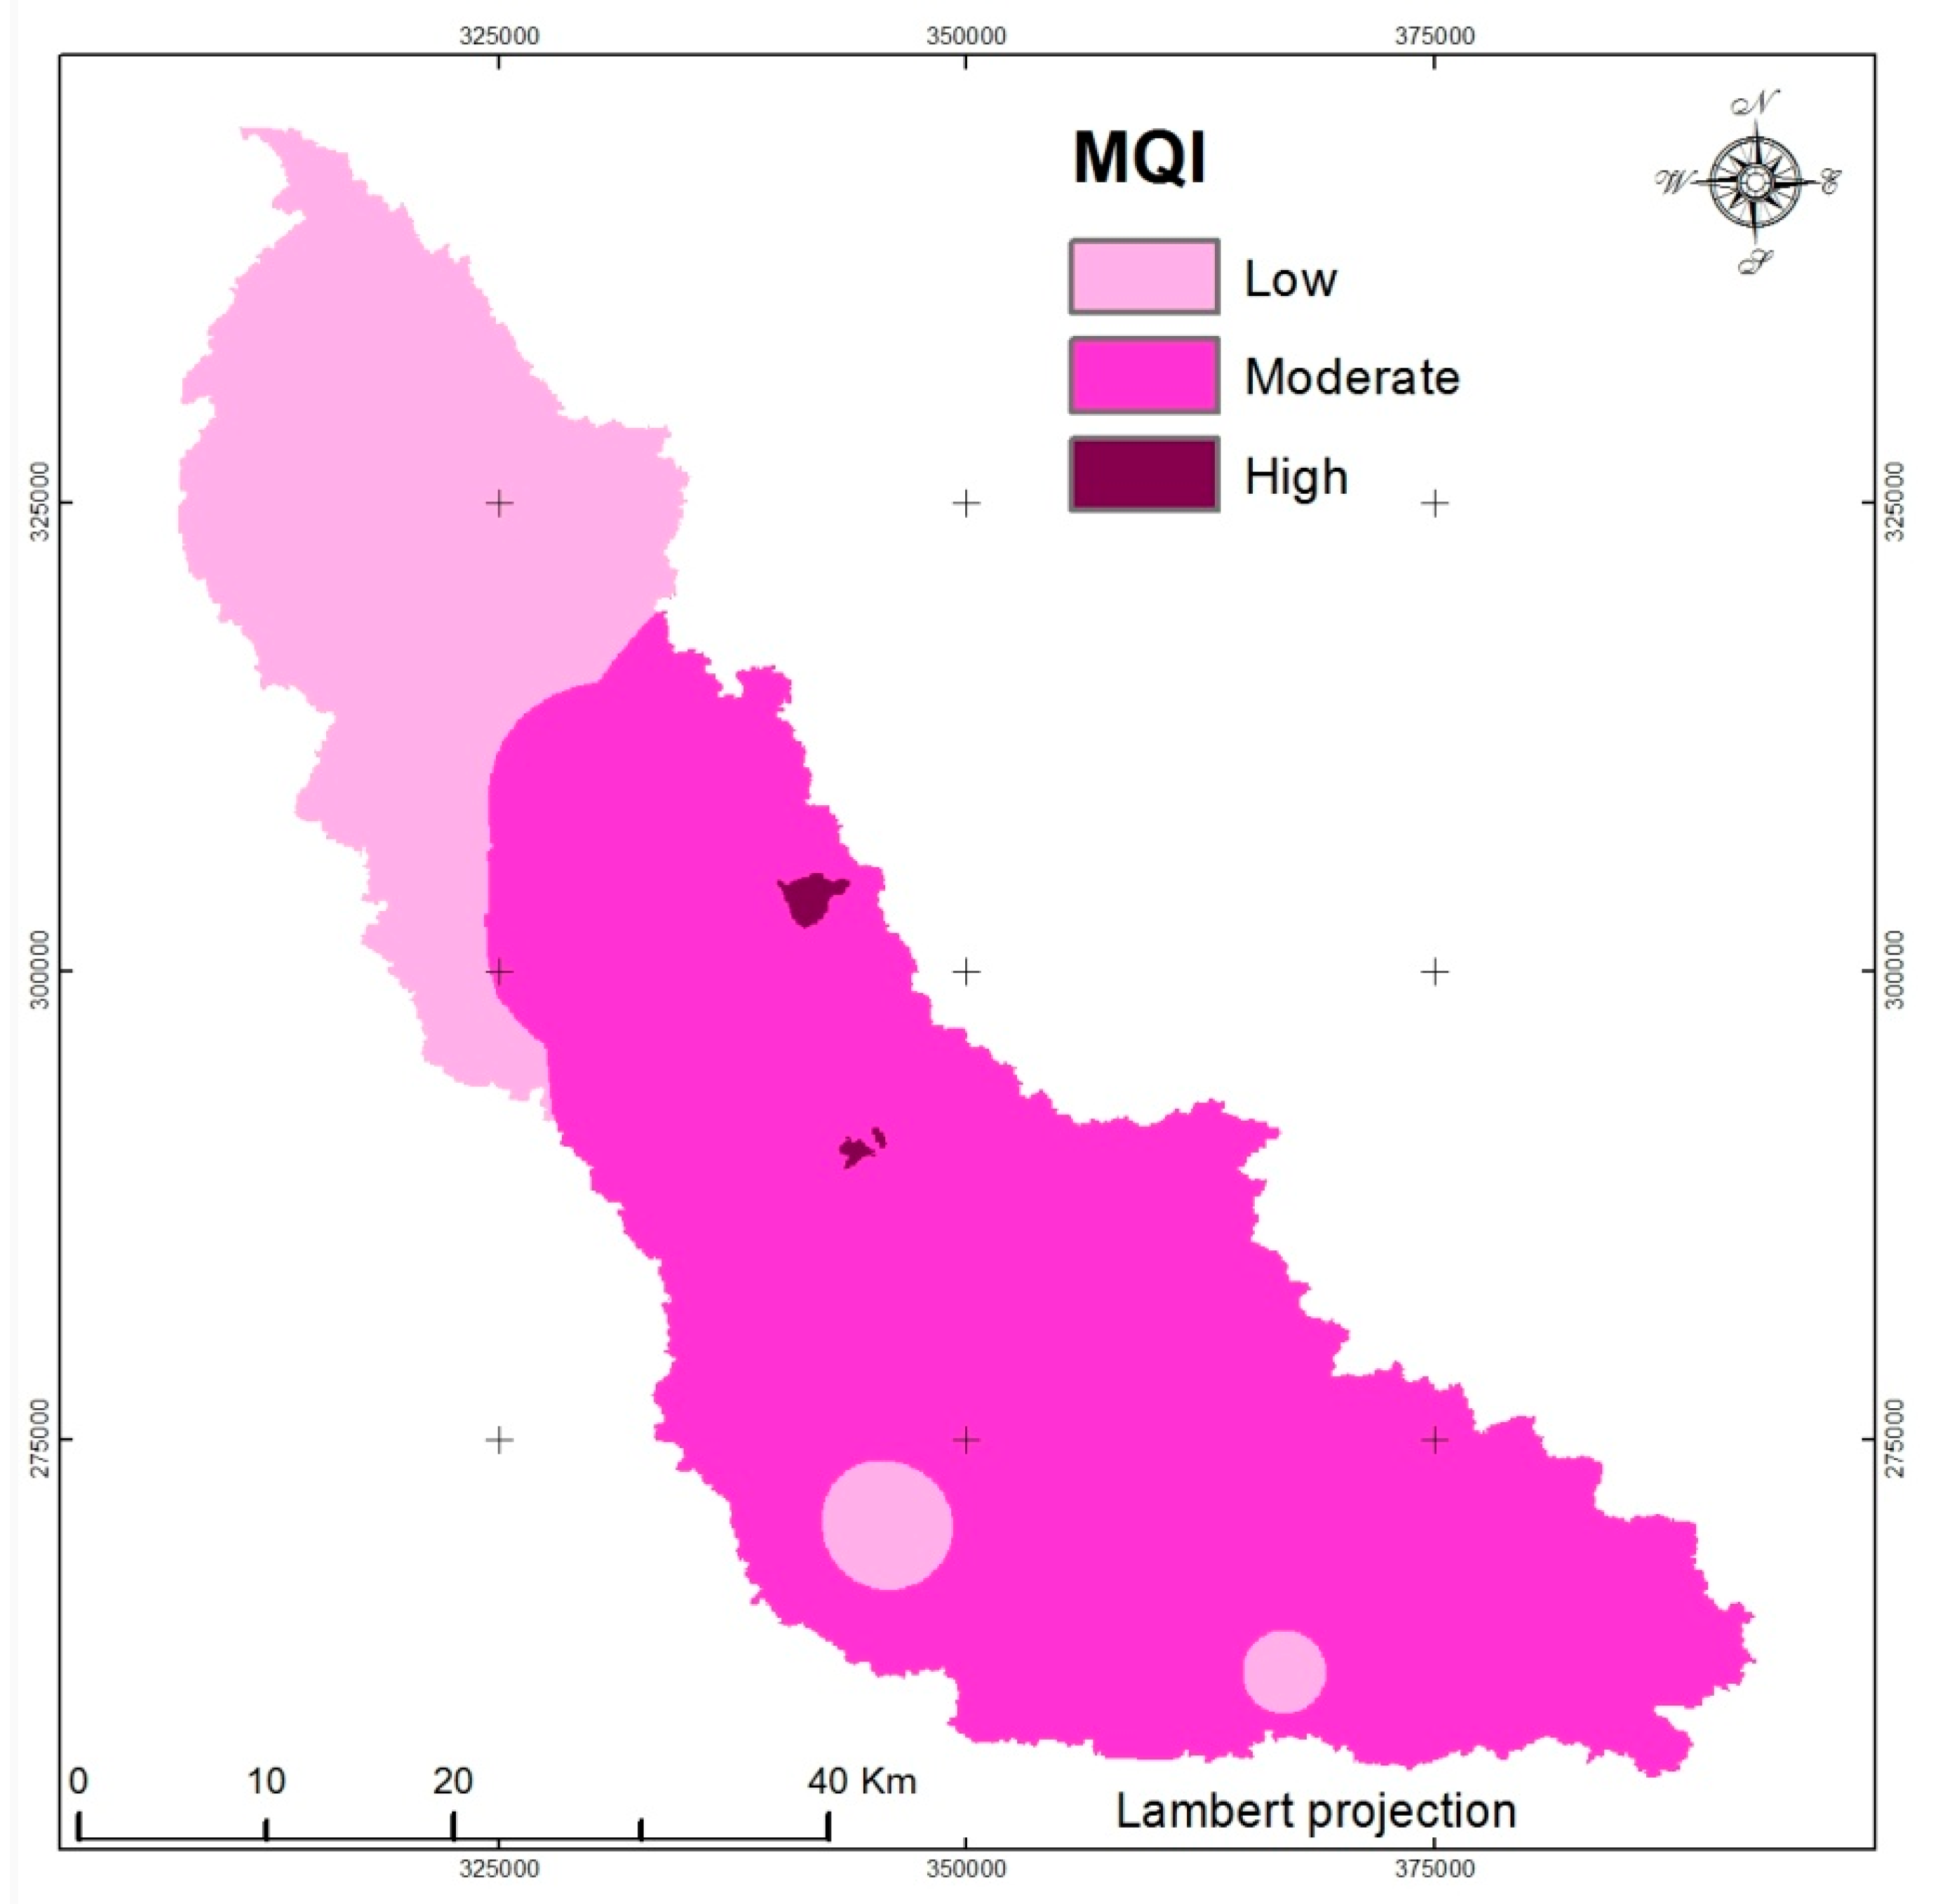
The watershed OM counts 32 communities with population of 503,500 inhabitants, the least populated community is Ait Ammar with 4260 inhabitants and the most populated is Mohammedia with 208,612 inhabitants [
28]. According to the results of the population pressure sub-index, 22% of the study area is subject to demographic pressure and it is concentrated in the north of the watershed due to both the presence of a strong network of roads and the plains as common landforms. Moreover, this area is close to Casablanca, the over populated economic capital of Morocco.
The pressure exerted on grazing lands was approached through the rapport between the real animal load found in fields and the potential animal load can be borne. The data from the Agricultural General Recensement spatialized based on communities (
Table 6) shows that 83% of the study area is subject to moderate intensity of grazing. The class of “high intensity” represents only 5%.
The precarious social situation of rural populations leads to natural resources management abuse. The MQI that reflects the equilibrium of these two components fluctuate between 1 and 1.9. The areas where the management quality index is good correspond to areas that are less densified and where the erosion control practices, such plowing, follow the contour lines and terraces are more frequently used. However, this area is very limited and represents only 10% of the study area.
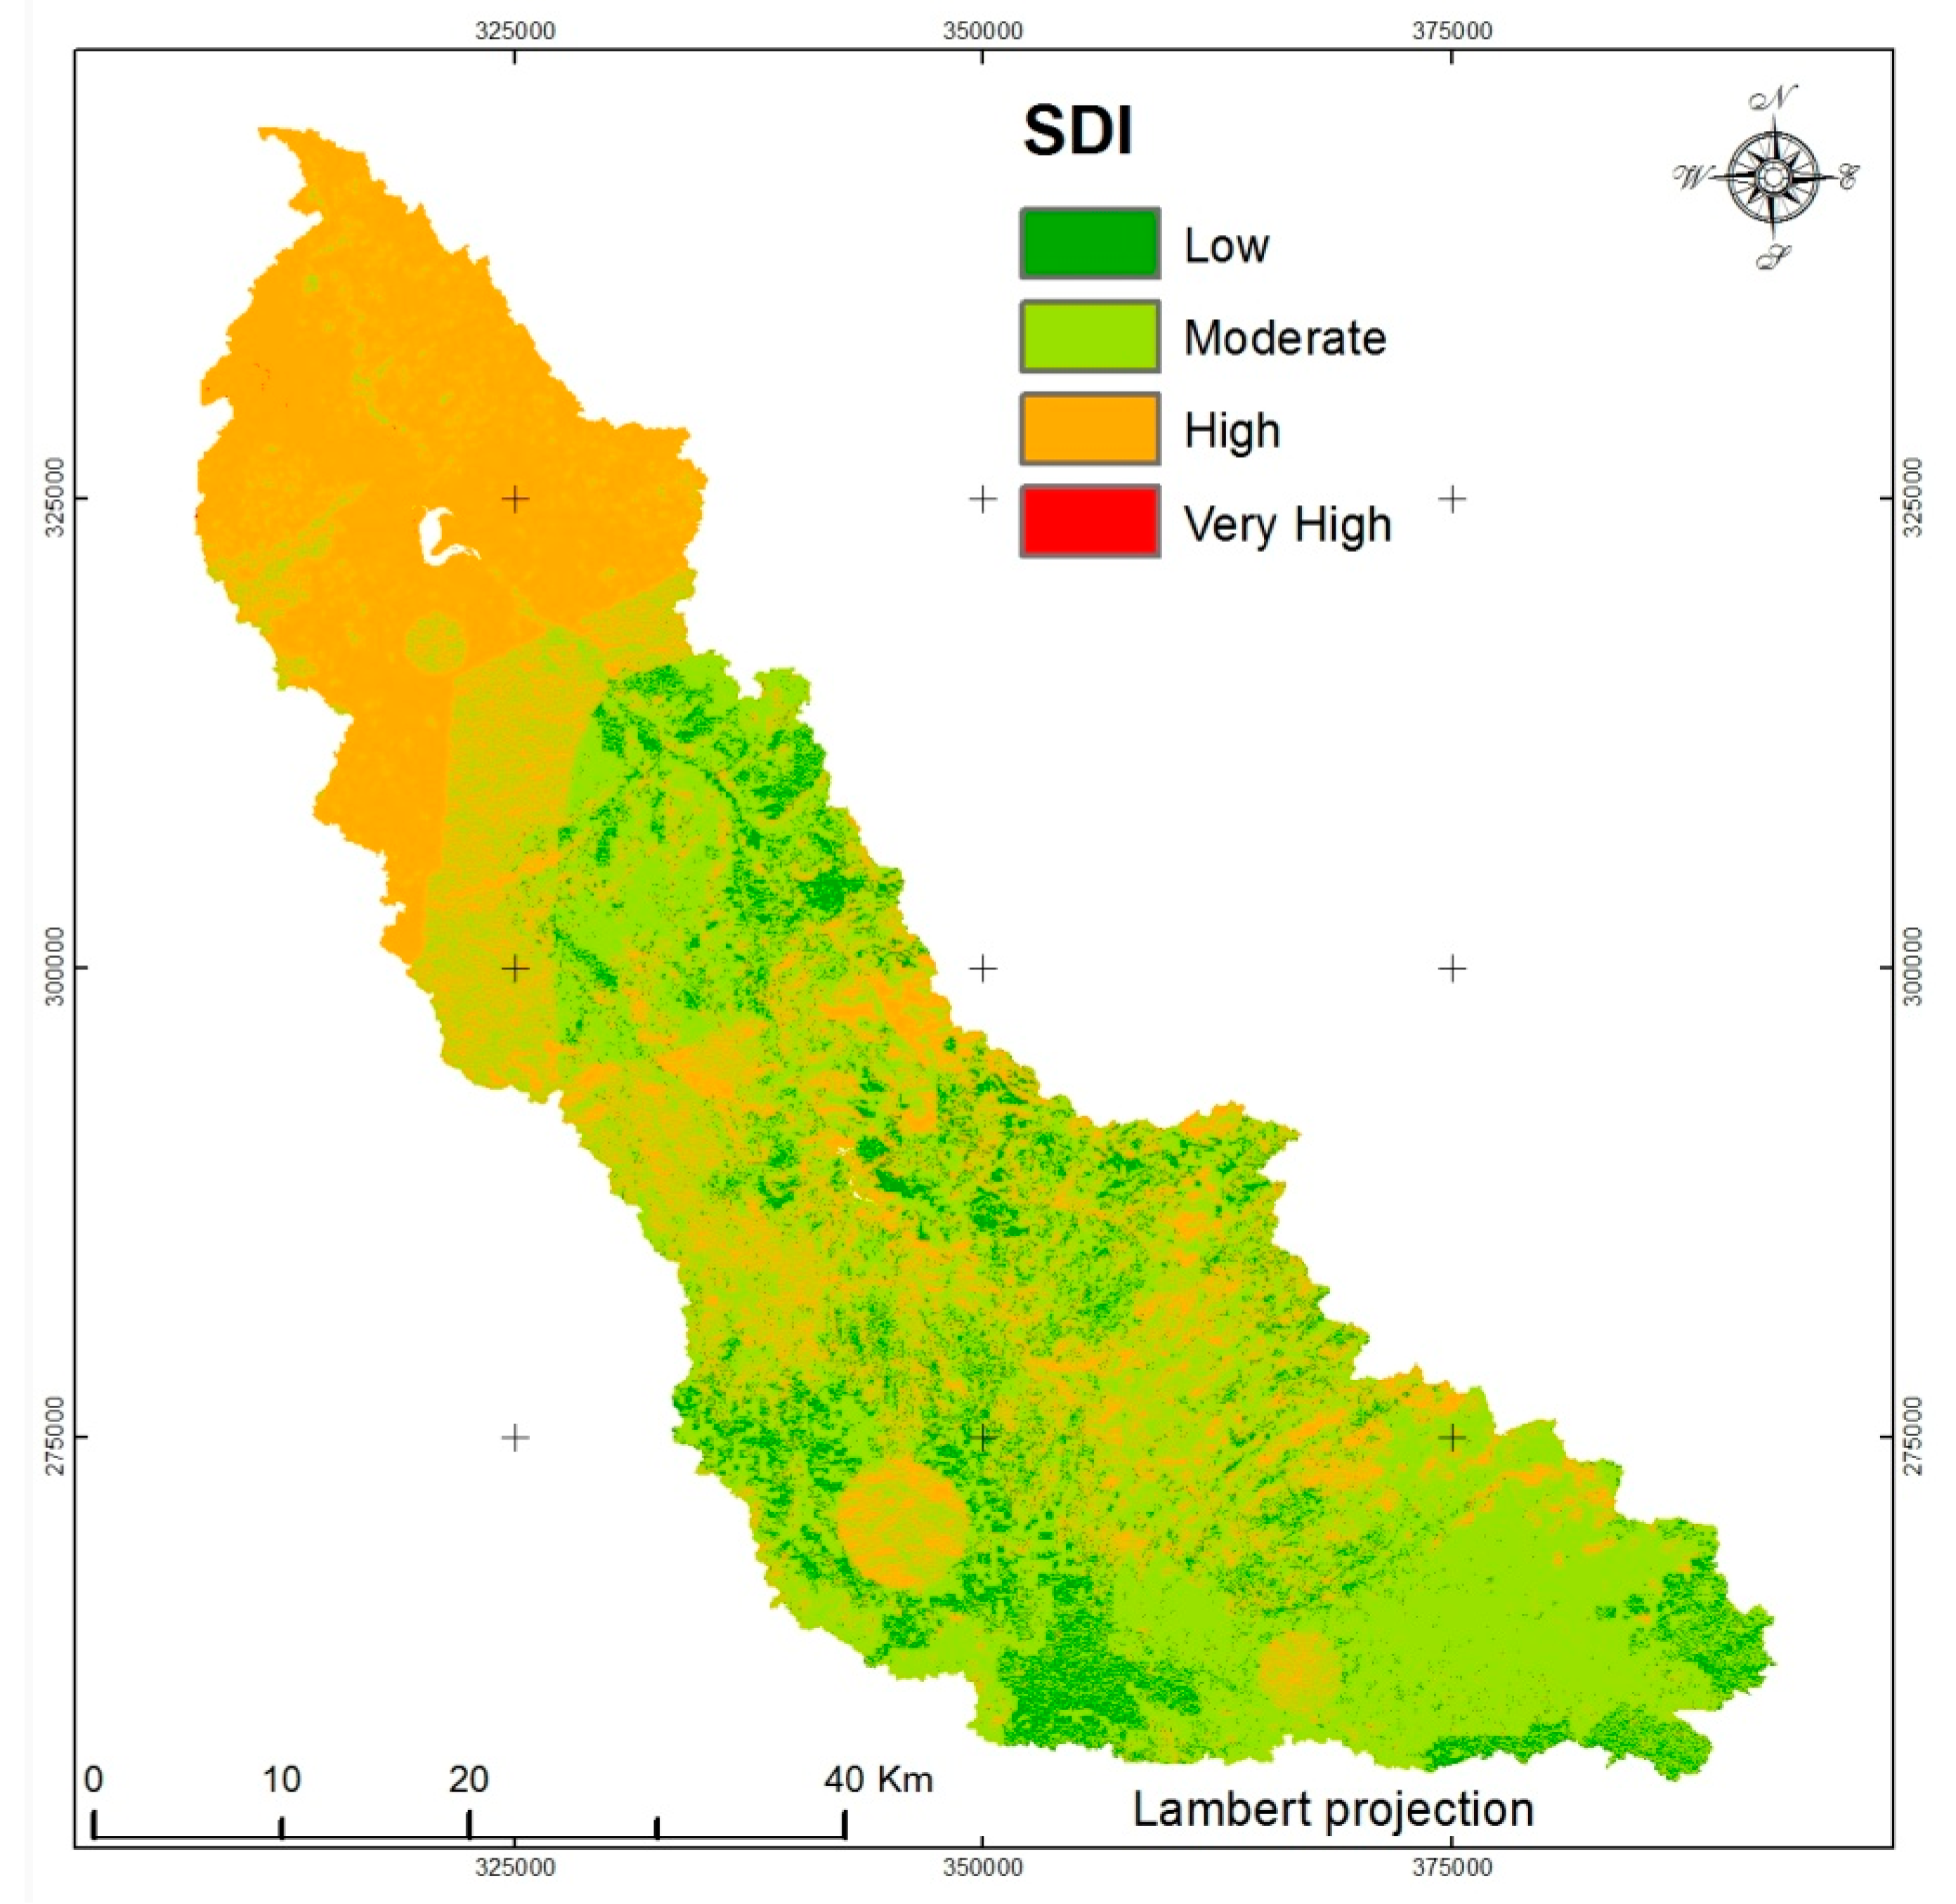
The degree of SDI is generally considered moderate in most of the watershed with spatial variability (sub-catchments). In fact, only 35% of the watershed area is subjected to high soil degradation. Moreover, the “very high” class is absent in the synthetic map (
Figure 7).
The areas that are most exposed to desertification are located in the north of the watershed where there is a concentration of large cities, such as, Mohammedia and El Gara. This area is also close to Casablanca city, considered the largest Moroccan city and the economic capital of the country. In this part of the watershed, anthropogenic pressure on resources is more felt. This is also explained by the dominance of land agricultures which are generally known for their poor soil and more generation of sediment, as compared to forest lands which are characterized by permanent cover and richness in humus and organic matter. Forest ecosystems are concentrated in the middle and south of the watershed.
There are, however, limitations to the use of the European desertification model. The MEDALUS needs a big Geo-database, which is not often synchronized in time. In addition, the model does not give a quantitative index of desertification assessment and the SDI values correspond to weights and do not reflect a physical size.
6. Conclusions
Desertification is an irreversible process of soil degradation. It is caused both by human and natural factors and threatens the sustainability of natural resources. It is manifested by deforestation and the deterioration of agriculture lands and rangelands.
The methodology used is based on the use of the MEDALUS model. The model includes four indexes namely vegetation, climate, soil and management. Each index is evaluated by the combination of sub-indexes and represented in cartographic format. The overlaying of all the indexes onto a geographic information system enabled us to spatialize the degree of desertification sensitivity (SDI) at the watershed scale in a synthetic map.
The rate of desertification sensitivity is generally considered moderate in most of the watershed (>50%) with spatial variability. Moreover, it appears from the analysis of the potential desertification that the areas more exposed to desertification are located in the north of the catchment, where large cities such as Mohammedia and El Gara are concentrated and the dominant land use is agriculture.
On the whole, this work has approached the problem of desertification in the Oued El Maleh watershed. To conduct this research, the use of GIS and remote sensing has enabled us to identify, within a synthetic map, the areas that are most exposed to land degradation based on human and natural indexes. Furthermore, this map is a useful support for land managers and decision makers to select desertification endangered areas.


