Abstract
This work assesses the feasibility of national ground deformation monitoring of Great Britain using synthetic aperture radar (SAR) imagery acquired by Copernicus’ Sentinel-1 constellation and interferometric SAR (InSAR) analyses. As of December 2016, the assessment reveals that, since May 2015, more than 250 interferometric wide (IW) swath products have been acquired on average every month by the constellation at regular revisit cycles for the entirety of Great Britain. A simulation of radar distortions (layover, foreshortening, and shadow) confirms that topographic constraints have a limited effect on SAR visibility of the landmass and, despite the predominance of rural land cover types, there is potential for over 22,000,000 intermittent small baseline subset (ISBAS) monitoring targets for each acquisition geometry (ascending and descending) using a set of IW image frames covering the entire landmass. Finally, InSAR results derived through ISBAS processing of the Doncaster area with an increasing amount of Sentinel-1 IW scenes reveal a consistent decrease of standard deviation of InSAR velocities from 6 mm/year to ≤2 mm/year. Such results can be integrated with geological and geohazard susceptibility data and provide key information to inform the government, other institutions and the public on the stability of the landmass.
1. Introduction
Satellite interferometric synthetic aperture radar (InSAR) data have proven effective and valuable in the analysis of geohazards based on multi-temporal radar images and have played a key role in recent years representing a cost- and time-efficient support and/or alternative to geological and geotechnical investigations [1].
Starting from the end of the eighties and beginning of the nineties [2,3], onward, the potential of satellite InSAR for cm or sub-cm level surface deformation mapping over a large area was revealed. Those works represented a milestone for the breakthrough of InSAR methods which proliferated during the following decades with a steady improvement and validation of several and different techniques (such as persistent scatterer interferometry—PSI, and small baseline subset—SBAS; [4]) through a large amount of scientific literature. This was especially thanks to international projects, such as Terrafirma [5], funded by the European Space Agency (ESA), and the EC-FP7 PanGeo project [6], and thanks to new SAR missions, such as ENVISAT in 2002, TerraSAR-X in 2007 and COSMO-SkyMed the following year. The proportional increase in the number of citations per year compared to the corresponding number of papers can be related to the increasing efforts in InSAR applications rather than the improvement or development of InSAR techniques (Figure 1).
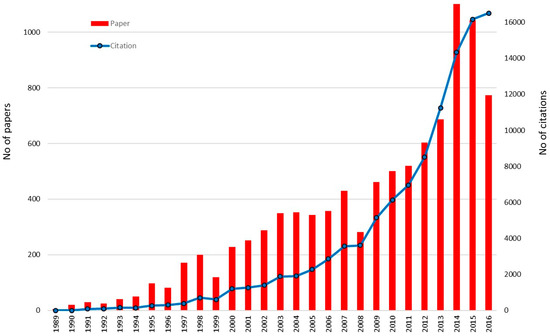
Figure 1.
Number of articles, proceedings papers, and reviews found as of December 2016 in the ISI Web of Knowledge under the terms “InSAR” and “Interferometry” in the areas of remote sensing applied to Earth sciences; data from Thomson Reuters.
Italy is the only country worldwide where an InSAR database has been assembled successfully from the processing of ~15,000 ERS and ENVISAT SAR scenes to cover an entire nation (>300,000 km2), and is now being extended with X-band COSMO-SkyMed data. The processing is part of a project funded by the Italian Ministry for the Environment, Territory and Sea in the framework of the Extraordinary Plan of Environmental Remote Sensing and essentially driven by the country’s susceptibility to hydro-geomorphological risk [7].
In April 2014, with the launch of the first satellite of ESA’s Sentinel-1 mission, Sentinel-1A [8], a new challenge has been set for InSAR applications: to provide, on a national scale, near real-time disaster monitoring, assessment, and response for geological processes [9]. In this paper, we aim to assess the feasibility of InSAR techniques to monitor the landmass of Great Britain to extend the work done by [10] who simulated SAR geometric distortions and predicted persistent scatterer densities for ERS and ENVISAT C-band SAR and InSAR applications in Great Britain. The target region encompasses an area of 243,610 km2 made up of a main landmass and minor islands and islets. Since not all of the different geohazards affecting Great Britain produce ground displacement (e.g., flooding, storms, and wildfires), our assessment is limited to ground instability phenomena, such as natural compaction of recent river deposits [11] and loessic silt (largely confined to Southeast Essex and Northern Kent), shrink-swell terrains [12] found mainly in the southeast of the country, landsliding [13], land subsidence/uplift due to groundwater abstraction/recharge [14], glacial isostatic adjustment [15], dissolution of soluble rocks [16] principally in Cheshire, Pennines, and Wales, ground motions induced by human activities [17], and excavations and mine-water management in active and abandoned mining areas [18]. The United Kingdom is a country with limited direct experience of natural disasters and the British Geological Survey (BGS) archive confirms that just eleven people are known to have died as the results of British earthquakes since 1580 [19]. Moreover, despite an estimated 32,000 natural sinkholes, none has been responsible for a single death. Landslides are responsible of less than one death per year, apart from the Aberfan disaster of 1966 that claimed over 144 victims [20]. However, despite the sources of geohazards associated with ground deformation being heterogeneously distributed across Great Britain, most of the landmass can be potentially affected by geohazards, which caused 1–2 billion euros of damage per year in the UK in 1998–2009 [21].
Considering the latest set of 30-year averages data from the Met Office [22] for 1981–2010, climatic variables, such as rainfall (>1150 mm/year) and cloud coverage, suggest that active remote sensing technologies (e.g., radar sensors) are particularly suitable for monitoring the country.
The framework of this work follows the four conditions that must be fulfilled for accomplishing a nationwide InSAR analysis: we analyse the Sentinel-1 archive image availability in Section 2.1, the effect of topography on the SAR images in Section 2.2, the effect of land use on radar targets distribution in Section 2.3, the feasibility of Sentinel-1 in terms of the kinematic, temporal, and spatial extension of the investigated phenomenon in Section 2.4 and the effect of different stacks of Sentinel-1 images on InSAR results over Doncaster in Section 2.5. The future perspectives relating to the implementation of the Sentinel-1 nationwide monitoring are finally discussed with respect to the benefits for geohazards susceptibility and risk assessment.
2. Materials, Methods, and Discussion
2.1. Sentinel-1 Archive Data
ESA is developing the Sentinels, a new family of six missions, each based on a constellation of two satellites to fulfil revisit and coverage requirements, providing robust datasets for Copernicus Services. The Sentinel-1 constellation ensures the continuity of the ERS and ENVISAT missions and has been specifically designed to provide systematic and regular SAR observations with high temporal (six-day revisit time) and spatial (~250 km swath and ~165 km azimuth width) coverage. The Terrain Observation by Progressive scans SAR (TOPSAR) of the Interferometric Wide Swath (IWS) is the main acquisition mode over land [23], in addition to Stripmap and Extra Wide Swath (EWS) products. Sentinel-1 SAR products are freely available for both research and commercial applications, thus providing the scientific community, as well as public and private companies with more opportunities to explore.
Currently, Sentinel-1 products are available through the following platforms:
- Sentinels Scientific Data Hub (https://scihub.copernicus.eu/) operated by ESA, the most completed and updated (within 24 hours for systematically archived data) archive where SAR data are identified according to relative orbit and slice number. In 2015, alone, more than 1000 out of the 15,243 users registered from the UK [24].
- Alaska Satellite Facility [25], as part of an agreement between the U.S. State Department and the European Commission, where products are identified from their path and frame.
- Sentinel Data Access Service [26] operated by the Satellite Applications Catapult in association with the UK Space Agency where SLC IWS SAR data are identified according to the Absolute Orbit number.
Starting from October 2014, when just two IW SLC images were available over Great Britain (Figure 2), and tracking the status of the archive, we found that there were a total ~11,200 SLC Sentinel-1A images as of the end of December 2016. The analysis shows that the average number of scenes acquired per month for each acquisition geometry (ascending and descending) increased from a few tens in 2014 to over 100–200 in 2015 and up to ~400 at the end of 2016. The scenes are almost equally distributed among the ascending and descending orbits, as opposed to the observed preponderance of ERS and ENVISAT descending frames with respect to ascending ones from 1991 to 2010 [10]. The current acquisition rate has been achieved after the completion of the commissioning phase of the second satellite of the constellation, Sentinel-1B (launched in April 2016 and orbiting Earth 180° apart from its twin), when further products have been made available from mid-September 2016 and the number of scenes acquired per month over the landmass has increased to ~400. A short gap occurs between 16 June 2016 and 28 June 2016 due to the persistence of the onboard anomaly of the SAR antenna [27].
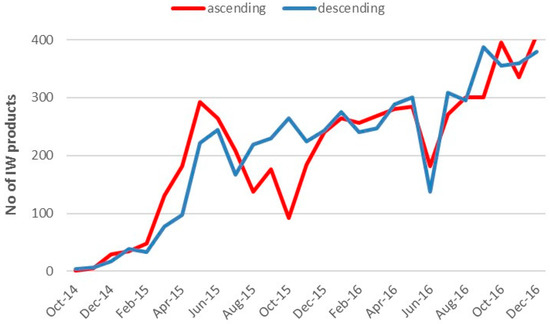
Figure 2.
Number of Sentinel-1 IW products available over Great Britain from the Sentinel Data Hub as of December 2016.
The Sentinel-1A IW coverage of Great Britain is achieved by 46 different ascending frames (from 158 to 200) and 41 different descending frames (from 392 to 428) distributed along a total of six paths in each geometry (Figure 3). Among the possible path-frame combinations, a full coverage of Great Britain can be achieved with just 15 IW frames.
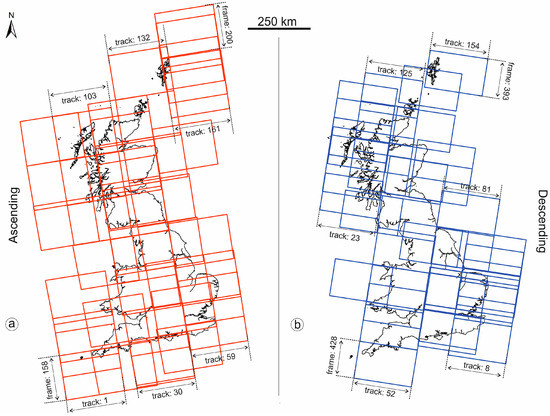
Figure 3.
Satellite SAR image availability over Great Britain: spatial distribution of Sentinel-1A frames for the (a) ascending and (b) descending modes. Along the same path a step of 5 in frame ID is required to cover the next or previous adjacent area.
However, it becomes apparent that the opportunity to use always the same frames to cover the same area has been affected by some inconsistency in the Sentinel-1 acquisition as shown in the example of Figure 4. In this case, the Sentinel-1A ascending stack along path 30 has been selected to cover the municipality of Doncaster. Since 6 January 2016 there has been a regular succession of the acquisitions of frames 169 and 174 with frame 173 until the end of March 2016. The latter covers exactly the same area of frame 172 which has been acquired just twice until now: on 24/11/2014 and 25/11/2016. The heterogeneity of the archive is increased during spring and summer as frames 170, 174, and 175 prevail until the beginning of October 2016, when frame 171 (from Sentinel-1B) cover Doncaster (Figure 4).
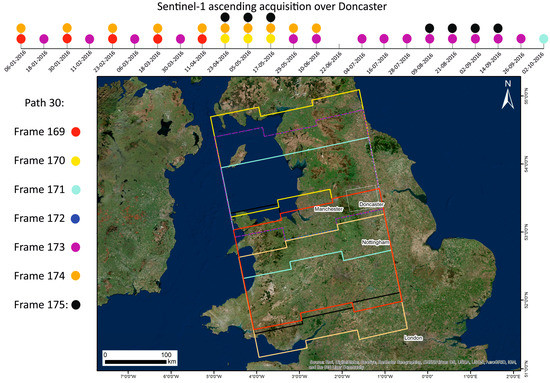
Figure 4.
Sentinel-1 IW image availability over path 30 for Doncaster during the period between January and October 2016.
2.2. Topographic Constraints
The visibility of the landmass to the radar satellite sensor depends on the orientation of the employed satellite line-of-sight (LOS) and radar acquisition geometry with respect to that of the imaged terrain. Visibility varies within different portions of the same Sentinel-1 IW scene depending on local terrain slope (β) and aspect (α), local incident angle (θ), which varies between 29.1° and 46° from the near to the far range and is ~37.5° at scene centre, and the satellite heading angle (γ), which is 9.1° on average at the latitudes of Great Britain. We extract the terrain slope and aspect from the Shuttle Radar Topography Mission (SRTM) digital surface model (DSM) at 90 m resolution which—in terms of spatial resolution—is the closest one to the Sentinel-1 ground range resolution after multi-looking using the factors of 22 and 5 in range and azimuth, respectively, as adopted by [28].
Depending on their effects, range geometrical distortions can be classified as foreshortening, layover (Lv), and shadow (Sh) (e.g., [29,30]). Their presence hampers the application of both interferometric and non-interferometric techniques (e.g., [31]). A priori identification of these distortions is, therefore, essential to plan InSAR analyses, especially over the foreslope of hilly and mountainous regions where the assessment of the most suitable LOS geometry ensures that the target area is visible prior to the acquisition of long SAR imagery stacks. To identify Sentinel-1 IW geometrical distortions in the ascending and descending acquisition modes in Great Britain, we calculated the R-Index (RI) [10,32]:
where A is the aspect correction factor, which is computed as A = α − γ for descending mode data, and A = α + γ + 180° for ascending mode data. Essentially RI, represents the ratio between the pixel size in slant and ground range geometry and its values range between −1 and +1. Areas of foreshortening show RI above 0 and up to sin (θ). The latter represents the specific threshold to discriminate foreshortening from good visibility regions, and is identified as RI0 [10]. Radar layover affects slopes facing the sensor, where θ < β and, therefore, RI takes on negative values between 0 and −1, whilst shadow occurs when slopes facing away from the sensor are characterised by β ≥ 90° − θ. Since passive layover (Lv) and shadow (Sh) cannot be discriminated on backslopes by using the sole R-Index, Lv and Sh are separately calculated by using the formula from [32], and eventually masked out to obtain the visibility map by multiplying the RI by a reclassified binary map where pixels take on values of 0 and 1 where Lv or Sh occur and do not, respectively, as follows:
RI = sin [θ − β × sin (A)]
Visibility = RI × Lv × Sh
The total areas of shadow within Great Britain were found to be as small as 9.6 km2 in ascending, and 8.8 km2 in descending, mode due to the presence of very few areas characterised by slopes steeper than 52.5° (Figure 5). Total areas of layover (including active and passive) are 8805 km2 in ascending and 7939 km2 in descending mode (Figure 5). Of these, 10.5 km2 in ascending and 11.2 km2 in descending mode are active layover regions, which were determined as a subset of total layover, by considering DSM pixels showing R between −1 and 0. Total extension of layover and shadow distortions for the landmass is ~1.0% in each imaging mode (Figure 6). The results of the analysis show that, for almost the entire territory, the layover effects that are observed for the descending geometry over slopes facing E can be compensated by employing the ascending geometry, and vice versa, for W-facing slopes (Figure 5). Areas resulting in layover or shadow distortions in both geometries, corresponding to ~185 km2, cannot be monitored using SAR imagery with either orbital mode, but our simulation shows that fortunately these do not occur anywhere in Great Britain but are limited to Northwest Highlands and Grampian Mountains. This allows to include in the InSAR studies also challenging phenomena like coastal landslides whose analyses otherwise are strongly compromised by geometrical distorsions. Areas of foreshortening were determined by considering an R-index of 0 to +0.6 (the RIo of S-1), and extended to 75,070 km2 (~32.7% of the landmass) in ascending, and 74,994 km2 (~32.6%) in descending mode. The absence of any type of distortions is observed over around 153,273 km2 (~67.2%) in ascending and 155,054 km2 (~67.5%) in descending mode (Figure 5). Differently from the results of the simulation for the ERS and ENVISAT acquisition modes [10] the larger θ of Sentinel-1 (~37.5° instead of ~23.3°), reduces the overall size of the areas affected by SAR foreshortening and shadow effects in both geometries over the entire territory.
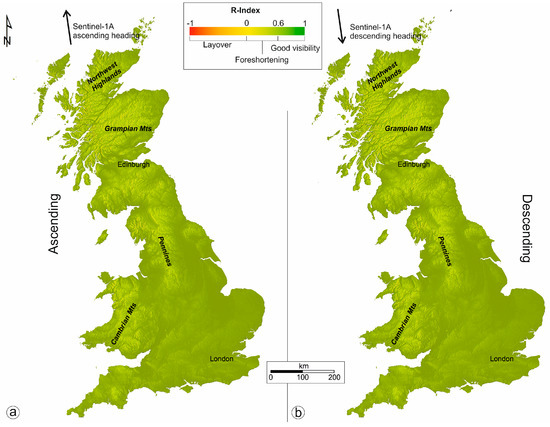
Figure 5.
Identification of image distortions to the Sentinel-1 IW ascending (a) and descending (b) modes over Great Britain.
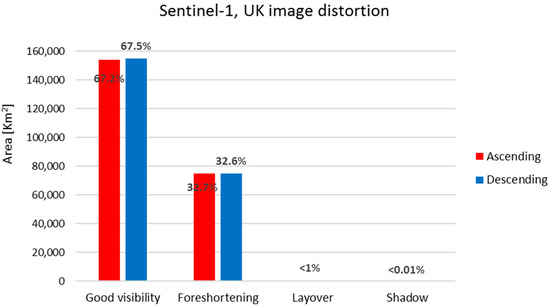
Figure 6.
Total areas of simulated Sentinel-1 IW geometric distortions (shadow and layover include both active and passive distortions) across Great Britain, based on the 90 m resolution SRTM DSM.
2.3. Land Cover Constraints
Land cover represents a critical factor reducing InSAR capabilities, in terms of accuracy of the results, due to temporal decorrelation effects. In order to remove or at least minimize such effects, two main families of methods were developed over the last decade [4]: the PSInSARTM [33] and SBAS [34]. With PS, temporal decorrelation effects are reduced by considering targets with low amplitude dispersion, while SBAS family relies on forming interferograms only between images separated by a short time interval and with a small difference in look and squint angle. However, the predominance of non-irrigated arable land and pastures, covering ~130,000 km2 across the landmass, exerts significant control on the potential for InSAR methods to identify scatterers in Great Britain, with particularly critical effects on rural and grassland regions where only a few radar targets per square kilometre can be extracted and monitored via InSAR processing of C-band data [10]. Novel InSAR methods, such as SqueeSAR™ [35] and ISBAS [36,37], aim to increase the coverage of results in non-urban regions by considering, respectively, distributed scatterers (e.g., debris, non-cultivated land, or low vegetation cover), or intermittently coherent surfaces. We assess ISBAS density using the freely-available CORINE land cover data for the reference year 2012 (CLC2012) and at 100 m resolution, following the empirical approach illustrated in [38].
Therefore, for each single land cover class the number of ISBAS targets N falling inside the land cover class is calculated. This is implemented by counting the number of geocoded ISBAS Nk (of the reference SAR data) for each single subarea k of each land cover class (i) and then summing up the results (N = ΣNk). Then, the entire area of the i-th class within each site A was calculated. Next, the ISBAS density p for each class i (ISBAS targets per km2) was derived:
pi = Ni/Ai
The procedure described above was implemented in a geographical information system (GIS) and executed for a number of calibration sites. In particular, the pi was estimated from a total of 64,844 km2 including six subareas (East Anglia, East Midlands, Hampshire, Lancashire, Yorkshire, and Southern Scotland) where 36 out of the 39 land cover types of Great Britain occur and 5,155,619 ISBAS pixels have been identified (Table 1). The exploitation of existing ISBAS datasets over different areas has been the input data for the quantitative calibration of countrywide land cover data towards extending the pre-survey feasibility assessment to the entire landmass and land cover types mapped across the country (Figure 7).

Table 1.
Sentinel-1A datasets used to calibrate the CORINE land cover map CLC2012 for Great Britain. Asc., Ascending; Desc., Descending.
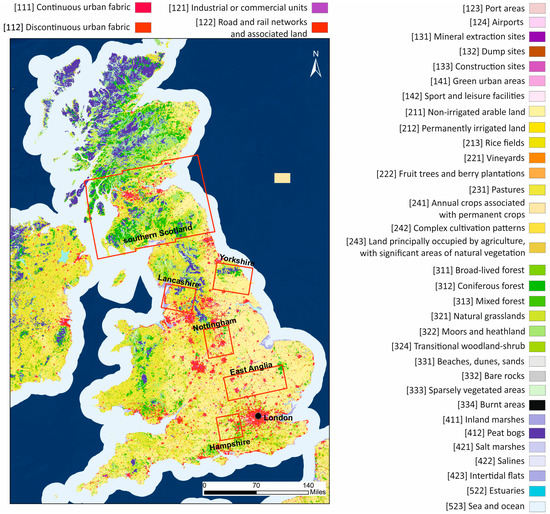
Figure 7.
CORINE land cover map 2012 (CLC2012) of Great Britain, along with the footprints of the six test sites where the ISBAS average density has been extracted.
By using the same sensor with the same wavelength over the two acquisition geometries, normalization of absolute ISBAS densities has not been required. Furthermore, climate conditions are similar in the seven calibration sites (Met Office, [22]), therefore, no initial climate classification and compensation were performed.
Standing at the ISBAS average density, ISBAS standard deviation and extension of each land cover types (Figure 8), ranging from the 122 ISBAS/km2 over continuous urban fabric to just 9 ISBAS/km2 over estuaries, and accounting for the topographic constraints, ~22,000,000 ISBAS points can be acquired, corresponding to an area of ~170,000 km2, namely 70% of the Great Britain landmass. No ISBAS points were detected over burnt areas, costal lagoons, permanently irrigated land, sea and ocean, water bodies, and water courses.
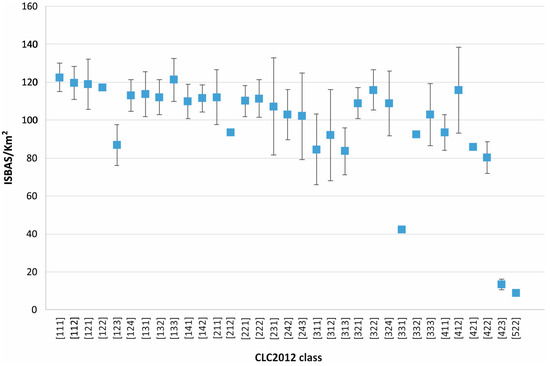
Figure 8.
Average ISBAS densities estimated using the six calibration sites for the 33 CLC2012 classes, according to the code used in Figure 7, mapped in Great Britain where at least one ISBAS point occurred in the calibration sites. Therefore, burnt areas, coastal lagoons, permanently irrigated land, water bodies, and water courses classes have been excluded.
2.4. Kinematic and Geometrical Constraints to Monitor Geohazards
Even if a sufficient number of Sentinel-1 data over Great Britain is already available (see Section 2.1), geometrical distortions represent a spatially-limited constraint (see Section 2.2) and land cover always allows a sufficient density of ISBAS radar targets (see Section 2.3), three systematic conditions can still negatively affect the analysis:
- The extension of the investigated phenomena must be over ~0.008 km2 which refers to the size of the smallest possible feature that can be detected by Sentinel-1 data accounting for the spatial resolution of its IW mode. Apart from dolines and sinkholes particular landslide typology (especially falls and topples), UK geohazards have an extension at the kilometric scale.
- Rather than providing 3-D components, ISBAS measurements are along the LOS direction and, therefore, insensitive to horizontal displacements in the along-track direction [39]. To decompose the InSAR LOS signal into its vertical and horizontal components we, therefore, need sufficient acquisitions of both ascending and descending SAR data [40]. In the absence of both geometries, quantification of the fraction of maximum motions measurable along the satellite LOS can be quantified by means of the R-Index for areas of good visibility or foreshortening. In this regard, most of the UK geohazards do not prevent InSAR analysis by being associated with predominant vertical deformation (see Section 1) and, specifically, this is true for dolines, sinkholes, collapsible ground, compressible ground, and shrink-swell terrains.
- Finally, a third limitation is represented by the incapability for resolving deformation ≥λ/4 between two SAR acquisitions [41] that constrains the measurable displacement velocity to ≤86 cm/year, or 1.4 cm for Sentinel-1 scenes six days apart. Such values are usually large enough to completely assess and monitor strain rates associated with rock and soil viscous, viscoelastic, or creep behaviour induced by human or natural-changes in stress conditions. At the same time, events partially detectable by SAR platforms represent an unlikely occurrence in the UK, temporally in the case of interseismic elastic deformation where an earthquake of ≥3.7 ML statistically hits every year, and spatially in the case of fall and topple landslides, whose recurrence is mainly limited to Western Scotland [13].
An example of the S-1 kinematic and geometrical constraints is given in Figure 8 which focuses on a sinkhole of 12 m in diameter which appeared twice (14 August 2015 and 15 September 2015) in Mancunian Way, Manchester and determined the partial collapse of the carriageway within diamicton deposits (Figure 9). The descending interferogram spanning across the date of the event has not been able to detect the phenomenon due to the (1) and (3) conditions, despite its vertical component of movement.
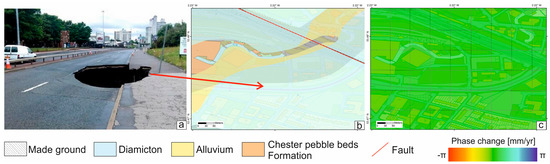
Figure 9.
The sinkhole on Mancunian Way (a) Image copyright: MEN SYNDICATION). The 10k Geological map of superficial deposits (b) and the wrapped interferogram between 22 July 2015 and 15 August 2015 (c). The black square refers to the pixel size and geolocation error is half the size of the pixel. Contains Ordnance Data © Crown Copyright and database rights 2017.
2.5. Test Site
The Doncaster area (see Figure 4) has been selected to validate the simulated distortion maps and the CLC2012 map and inspect the influence of an increasing number of SAR images on the LOS velocities. By using the ISBAS approach, a multithreaded solution for the Punnet software was adopted where 28 threads enhance the process model with, parallel, flows of execution within a process.
Starting from the first available acquisition, on 12-3-2015, an initial stack of 20 Sentinel-1A scenes in ascending mode along satellite track 30 has been considered and then gradually incremented by adding the five temporally successive Sentinel-1A and also -1B images in order to evaluate the effect of the number of SAR images on the standard deviation of LOS velocities (σ). Therefore, the 20 images stack encompasses the time span from the first acquisition until 29-5-2016, the 25 images stack the time span until 9-8-2016, the 30 images stack the time span until 2-10-2016, the 35 images stack the time span until 1-11-2016 and the 40 images stack the time span until 1-12-2016. In all the processing the 18-1-2016 acquisition has been set as the master, the scenes were multi-looked by a factor of 5 × 22 in azimuth and range, respectively, and interferograms were generated within a maximum baseline of 200 m and one year in space and time, respectively. The derivation of linear velocities for each coherent point (with coherence above 0.25) was then performed using a reference point at the HOOB GNSS station (latitude: 53.4829° N; longitude: −1.3797° E) located northeast of Doncaster [42]. Coherent pixels cover 80% of the 1750 km2 extended area with an average density of 51 ISBAS/km2 (Figure 10). With an average RI-ascending of 0.57, shadowing and layover are not present, while foreshortening, with an extension of 1517.8 km2, represents 87% of the area.
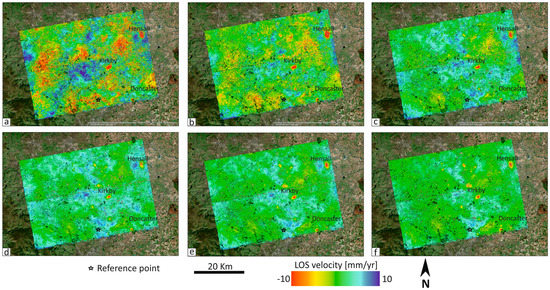
Figure 10.
Sentinel-1A LOS velocities for the Doncaster area with 15 (a), 20 (b), 25 (c), 30 (d), 35 (e) and 40 (f) Sentinel-1 images.
The increased number of interferograms for each successive processing led to highlight the two main areas of subsidence north of Doncaster, namely Kirkby and Hensall, through the reduction of tropospheric noise and the consequent decrease in σ which assumes a progressively lower values compared to the average LOS velocity. The ISBAS standard deviation ranges from 5.9 mm/year with 105 interferograms which is 58 times that of the average LOS velocity, to 1.9 with 741 interferograms, which represent less than the average LOS velocity (Figure 11). The potential cause of deformation affecting those sites cannot be related to groundwater extraction from the Sherwood Sandstone Group whose depth here is usually ≤5 m here, due to the stable piezometric levels of the Carlton Hanger Lane [43]. In this perspective, further research should focus on analyzing the 3D displacement vector and InSAR time series to identify a possible link to the former underground mining activities in the area.
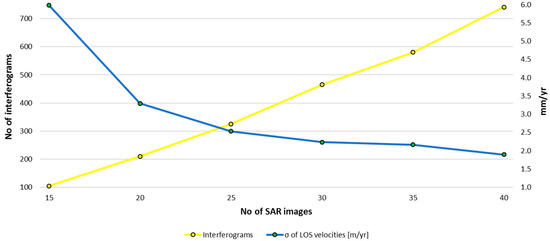
Figure 11.
The inverse relationship between the number of interferograms and the LOS standard deviation for the Doncaster area.
3. Conclusions and Future Perspectives
In this paper, the feasibility of the Sentinel-1 satellite to provide InSAR-derived ground deformation map for Great Britain has been analysed in relation to the availability of archived stacks of imagery suitable for interferometric applications, terrain visibility for the two radar acquisition geometries, the density of good radar reflectors for the various land cover types, and the kinematic and geometrical constraints of the investigable phenomena. We showed that topography exerts limited control on the visibility of the British landmass, with only ~1.0% of the total territory potentially affected by radar shadow and layover to the Sentinel-1 IW modes in each acquisition mode. Calibration of the CLC2012 using seven external ISBAS datasets allowed the characterisation of the land cover classes in terms of the average of potential pixel density that ISBAS could provide for each category. Despite the predominance of non-urban land cover across the landmass, the Sentinel-1 shorter repeat-cycles combined with an improved processing technique like ISBAS addresses the need for more dense networks of monitoring targets across rural and partly-vegetated regions with an average density of 90 ISBAS/km2 and a potentiality of ~22,000,000 pixels for each acquisition mode covering Great Britain. Furthermore, all of the Great Britain landmass, as of 2016, has enough IW acquisitions (≥30 on average) to guarantee satisfactory results in terms of standard deviation of the LOS velocity as shown in the Doncaster test site.
The implementation of the ground motion study of the whole of Great Britain with interferometric measurements aim to:
- Provide information at regional and national scales to identify ground displacements that occur over hundreds or thousands of square kilometres and characterise areas prone to risk because they are affected by critical geohazards. With such information decision-makers (e.g., UK Oil and Gas Authority, Coal Authority, Environmental Agency, or Health and Safety Executive) can analyse and evaluate different scenarios and plan specific actions based on homogeneous and reliable measurements. Furthermore, InSAR data can be updated regularly as more Sentinel-1 images are acquired, and can provide new ways to design early warning systems covering entire nations, where satellite information can highlight areas where in situ sensors and continuous monitoring tools should be installed or field checks should be optimized.
- Realize an important database to encourage the sharing of methodologies, data, and results. In this regard the manual data analysis and interpretation of ~22 M ISBAS points makes the process cumbersome, operator-dependent, and time-consuming, while semi-automated methodologies can be particularly advantageous for analysing and classifying remote sensing data at the regional scale.
Acknowledgments
A. Novellino, F. Cigna, and L. Bateson published with the permission of the Executive Director of BGS.
Author Contributions
A. Novellino and F. Cigna conceived and designed the experiments; A. Novellino and A. Sowter performed the experiments; all the authors analyzed the data; A. Novellino, F. Cigna and S. Marsh wrote the paper.
Conflicts of Interest
The authors declare no conflict of interest.
References
- Simons, M.; Rosen, P.A. Interferometric Synthetic Aperture Radar Geodesy. Treatise Geophys. 2007, 3, 391–446. [Google Scholar]
- Gabriel, A.K.; Goldstein, R.M.; Zebker, H.A. Mapping small elevation changes over large areas: Differential radar interferometry. J. Geophys. Res. 1989, 94, 9183–9191. [Google Scholar] [CrossRef]
- Massonnet, D.; Rossi, M.; Carmona, C.; Adragna, F.; Peltzer, G.; Feigl, K.; Rabaute, T. The displacement field of the Landers earthquake mapped by radar interferometry. Nature 1993, 364, 138–142. [Google Scholar] [CrossRef]
- Hooper, A. A multi-temporal InSAR method incorporating both persistent scatterer and small baseline approaches. Geophys. Res. Lett. 2008, 35, L16302. [Google Scholar] [CrossRef]
- Terrafirma Project. Available online: http://www.terrafirma.eu.com/ (accessed on 28 March 2017).
- Pangeo Project. Available online: http://www.pangeoproject.eu/ (accessed on 28 March 2017).
- Salvati, P.; Bianchi, C.; Rossi, M.; Guzzetti, F. Societal landslide and flood risk in Italy. Nat. Hazards Earth Syst. Sci. 2010, 10, 465–483. [Google Scholar] [CrossRef]
- ESA—Sentinel mission. Available online: https://sentinel.esa.int/web/sentinel/home (accessed on 28 March 2017).
- Milillo, P.; Riel, B.; Minchew, B.; Yun, S.; Simons, M.; Lungrden, P. On the Synergistic Use of SAR Constellations’ Data Exploitation for Earth Science and Natural Hazard Response. IEEE J STARS 2015, 9, 1095–1100. [Google Scholar] [CrossRef]
- Cigna, F.; Bateson, L.; Jordan, C.J.; Dashwood, C. Simulating SAR geometric distortions and predicting Persistent Scatterer densities for ERS-1/2 and ENVISAT C-band SAR and InSAR applications: Nationwide feasibility assessment to monitor the landmass of Great Britain with SAR imagery. Rem. Sens. Env. 2014, 152, 441–466. [Google Scholar] [CrossRef]
- Aldiss, D.; Burke, H.; Chacksfield, B.; Bingley, R.; Teferle, F.N.; Williams, S.; Blackman, D.; Burren, R.; Press, N. Geological interpretation of current subsidence and uplift in the London area, UK, as shown by high precision satellite-based surveying. Proc. Geol. Assoc. 2014, 125, 1–13. [Google Scholar] [CrossRef]
- Jones, L.D.; Terrington, R. Modelling volume change potential in the London Clay. Q. J. Eng. Geol. Hydrogeol. 2011, 44, 1–15. [Google Scholar] [CrossRef]
- Pennington, C.; Freeborough, K.; Dashwood, C.; Dijkstra, T.; Lawrie, K. The National Landslide Database of Great Britain: Acquisition, communication and the role of social media. Geomorphology 2015, 249, 44–51. [Google Scholar] [CrossRef]
- Bonì, R.; Cigna, F.; Bricker, S.; Meisina, C.; McCormack, H. Characterisation of hydraulic head changes and aquifer properties in the London Basin using Persistent Scatterer Interferometry ground motion data. J. Hydrol. 2016, 540, 835–849. [Google Scholar] [CrossRef]
- Bradley, S.L.; Milne, G.A.; Teferle, F.N.; Bingley, R.M.; Orliac, E.J. Glacial isostatic adjustment of the British Isles: New constraints from GPS measurements of crustal motion. Geophys. J. Int. 2009, 178, 14–22. [Google Scholar] [CrossRef]
- Cooper, A.H.; Farrant, A.R.; Price, S.J. The use of karst geomorphology for planning, hazard avoidance and development in Great Britain. Geomorphology 2011, 134, 118–131. [Google Scholar] [CrossRef]
- Wilson, M.P.; Davies, R.J.; Foulger, G.R.; Julian, B.R.; Styles, P.; Gluyas, J.G.; Almond, S. Anthropogenic earthquakes in the UK: A national baseline prior to shale exploitation. Mar. Petrol. Geol. 2015, 30, 1–17. [Google Scholar] [CrossRef]
- Bateson, L.; Cigna, F.; Boon, D.; Sowter, A. The application of the intermittent SBAS (ISBAS) InSAR method to the south Wales coalfield, UK. Int. J. Appl. Earth Obs. Geoinform. 2015, 34, 249–257. [Google Scholar] [CrossRef]
- British Geological Survey. Have Earthquakes Caused Deaths in Britain? Available online: http://www.earthquakes.bgs.ac.uk/education/faqs/faq14.html (accessed on 28 March 2017).
- Gibson, A.D.; Culshaw, M.G.; Dashwood, C.; Pennington, C.V.L. Landslide management in the UK—The problem of managing hazards in a ‘low-risk’environment. Landslides 2013, 10, 599–610. [Google Scholar] [CrossRef]
- European Environment Agency. Mapping the Impacts of Natural Hazards and Technological Accidents in Europe—An Overview of the Last Decade. EEA Technical Report No 13/2010. 2011. Available online: http://www.eea.europa.eu/publications/mapping-the-impacts-of-natural (accessed on 28 March 2017).
- Met Office—UK Climate. Available online: http://www.metoffice.gov.uk/public/weather/climate/ (accessed on 28 March 2017).
- De Zan, F.; Guarnieri, A.M. TOPSAR: Terrain observation by progressive scans. IEEE Trans. Geosci. Remote Sens. 2006, 44, 2352–2360. [Google Scholar] [CrossRef]
- European Space Agency. SPA-COPE-ENG-RP-066: Sentinels Data Access Annual Report (3/10/2014–30/11/2015), 2016. Available online: https://sentinel.esa.int/web/sentinel/user-guides/document-library/-/asset_publisher/xlslt4309D5h/content/sentinels-data-access-annual-report (accessed on 28 March 2017).
- Alaska Satellite Facility. Available online: https://www.asf.alaska.edu/ (accessed on 28 March 2017).
- Sentinel Data Access Service. Available online: http://sedas.satapps.org (accessed on 28 March 2017).
- Copernicus—Open Access Hub. Available online: https://scihub.copernicus.eu/news/ (access on 13 October 2016).
- ESA. Sentinel-1 User Handbook 2013. Available online: https://sentinel.esa.int/ (access on 13 October 2016).
- Kropatsch, W.G.; Strobl, D. The generation of SAR layover and shadow maps from digital elevation models. IEEE Trans. Geosci. Remote Sens. 1990, 28, 98–107. [Google Scholar] [CrossRef]
- Colesanti, C.; Wasowski, J. Investigating landslides with space-borne Synthetic Aperture Radar (SAR) interferometry. Eng. Geol. 2006, 88, 173–199. [Google Scholar] [CrossRef]
- Cigna, F.; Bianchini, S.; Casagli, N. How to assess landslide activity and intensity with Persistent Scatterer Interferometry (PSI): The PSI-based matrix approach. Landslides 2013, 10, 267–283. [Google Scholar] [CrossRef]
- Notti, D.; Herrera, G.; Bianchini, S.; Meisina, C.; García-Davalillo, J.C.; Zucca, F. A methodology for improving landslide PSI data analysis. Int. J. Remote Sens. 2014, 35, 2186–2214. [Google Scholar]
- Ferretti, A.; Prati, C.; Rocca, F. Permanent scatterers in SAR interferometry. IEEE Trans. Geosci. Remote Sens. 2001, 39, 8–20. [Google Scholar] [CrossRef]
- Berardino, P.; Fornaro, G.; Lanari, R.; Sansosti, E. A new Algorithm for Surface Deformation Monitoring based on Small Baseline Differential SAR Interferograms. IEEE Trans. Geosci. Remote Sens. 2002, 40, 2375–2383. [Google Scholar] [CrossRef]
- Ferretti, A.; Fumagalli, A.; Novali, F.; Prati, C.; Rocca, F.; Rucci, A. A new algorithm for processing interferometric data-stacks: SqueeSAR. IEEE Trans. Geosci. Remote Sens. 2011, 49, 3460–3470. [Google Scholar] [CrossRef]
- Gee, D.; Sowter, A.; Novellino, A.; Marsh, S.; Gluyas, J. Monitoring land motion due to natural gas extraction: Validation of the Intermittent SBAS (ISBAS) DInSAR algorithm over gas fields of North Holland, the Netherlands. Mar. Petrol. Geol. 2016, 77, 1338–1354. [Google Scholar] [CrossRef]
- Sowter, A.; Amat, M.B.C.; Cigna, F.; Marsh, S.; Athab, A.; Alshammari, L. Mexico City land subsidence in 2014–2015 with Sentinel-1 IW TOPS: Results using the Intermittent SBAS (ISBAS) technique. Int. J. Appl. Earth Obs. 2016, 52, 230–240. [Google Scholar] [CrossRef]
- Plank, S.; Singer, J.; Thuro, K. Assessment of number and distribution of persistent scatterers prior to radar acquisition using open access land cover and topographical data. ISPRS J. Photogramm. 2013, 85, 132–147. [Google Scholar] [CrossRef]
- Hu, J.; Li, Z.W.; Ding, X.L.; Zhu, J.J.; Zhang, L.; Sun, Q. Resolving three-dimensional surface displacements from InSAR measurements: A review. Earth Sci. Rev. 2014, 133, 1–17. [Google Scholar] [CrossRef]
- Wright, T.J.; Parsons, B.E.; Lu, Z. Toward mapping surface deformation in three dimensions using InSAR. Geophys. Res. Lett. 2004, 31. [Google Scholar] [CrossRef]
- Rosen, P.A.; Hensley, S.; Joughin, I.R.; Li, F.K.; Madsen, S.N.; Rodriguez, E.; Goldstein, R.M. Synthetic aperture radar interferometry. Proc. IEEE 2000, 88, 333–382. [Google Scholar] [CrossRef]
- Natural Environment Research Council (NERC). British Isles Continuous GNSS Facility (BIGF). Available online: http://www.bigf.ac.uk/ (access on 25 March 2017).
- Environment Agency, Scottish Environment Protection Agency and Irish Office of Public Works. Shoothill GaugeMap. Available online: http://www.gaugemap.co.uk/# (access on 24 March 2017).
© 2017 by the authors. Licensee MDPI, Basel, Switzerland. This article is an open access article distributed under the terms and conditions of the Creative Commons Attribution (CC BY) license (http://creativecommons.org/licenses/by/4.0/).