Article

Assessing Floods and Droughts in Ungauged Small Reservoirs with Long-Term Landsat Imagery

1
IRD, UMR G-eau, BP 5095, 34196 Montpellier CEDEX 5, France
2
Department of Geography, King’s College London, WC2R 2LS London, UK
3
Montpellier SupAgro, UMR G-eau, 34060 Montpellier, France
*
Author to whom correspondence should be addressed.
Geosciences 2016, 6(4), 42; https://doi.org/10.3390/geosciences6040042
Submission received: 29 May 2016 / Revised: 2 September 2016 / Accepted: 15 September 2016 / Published: 27 September 2016
(This article belongs to the Special Issue Mapping and Assessing Natural Disasters Using Geospatial Technologies)

Abstract

:
Small reservoirs have developed across semi-arid areas as a low cost solution for millions of rural small holders to harvest scarce water resources. Studies have highlighted limited agricultural water use and low water availability on individual reservoirs, but no information exists on the drought patterns of multiple small reservoirs. Their small size and dispersion prevents individualised hydrological monitoring, while hydrological modelling suffers from rainfall variability and heterogeneity across data sparse catchments and reservoirs. A semi-automated original approach exploiting free, archive Landsat satellite images is developed here for long-term monitoring of multiple ungauged small water bodies. Adapted and tested against significant hydrometric time series on three lakes, the method confirms its potential to monitor water availability on the smallest water bodies (1–10 ha) with a mean RMSE of 20,600 m3 (NRMSE = 26%). Uncertainties from the absence of site-specific and updated surface-volume rating curves were here contained through a power relationship adapted over time for silting based on data from 15 surrounding lakes. Applied to 51 small reservoirs and 546 images over 1999–2014, results highlight the ability of this transposable method to shed light on flood dynamics and allow inter annual and inter lake comparisons of water availability. In the Merguellil upper catchment, in Central Tunisia, results reveal the significant droughts affecting over 80% of reservoirs, confirming the need for small reservoirs to maintain a supplementary irrigation objective only.

Graphical Abstract

1. Introduction

1.1. Small Water Bodies in Agriculture

Small reservoirs and other water and soil conservation works have become increasingly widespread across semi-arid areas due to their combined ability to harvest sparse and scarce erratic rainfall and runoff for local users, reduce the transport of eroded soil, attenuate floods and, in certain cases, favour groundwater recharge. Small reservoirs are built relatively inexpensively [1,2], using materials taken locally and composed of an embankment made from compacted soil and a stone cladding. The dam is equipped, in certain cases, with a spillway, a water intake tower connected to an outlet valve to lower levels and flush sediment. Definitions vary widely, but capacities typically remain under 1 million m3 (1 Mm3) and surface areas under 10 ha [3].
Bottom-up development fuelled by the simplicity and low costs of these structures led notably to large numbers of tanks in India [4] and açudes in Brazil [5]. Supported through national and international projects, these reservoirs flourished across countries of sub-Saharan Africa, Asia and Latin America since the 1960s (Figure 1).
Providing rural small holders with an additional water supply, these reservoirs are believed to hold great potential to support small-scale irrigation [2]. These structures also benefit from reduced environmental impacts, unlike large irrigation and dam projects, drawing continued attention and support from donors and stakeholders. Studies in several countries have highlighted multiple benefits of these multi-use systems and interest from users, but have also pointed to limited agricultural production [7,8]. These findings lead, on the one hand, to questioning the suitability and subjectivity of evaluation frameworks and exploring quantitatively and qualitatively the benefits of small reservoirs (SR), to inform stakeholders of the relevance of such investments. On the other hand, additional research must seek to investigate the reasons behind the limited agricultural development.
Significantly, the actual hydrological potential of these small reservoirs remains largely unknown. Individual instrumentation for research and monitoring purposes has highlighted significant droughts, but also significant heterogeneity in their functioning, as a result of differing catchment characteristics (rainfall, size, land use, etc.) and reservoir characteristics (high infiltration, evaporation, withdrawals, etc.) [9,10,11,12]. The small scale, size, importance and scattered and isolated nature of these systems prevent wide-scale monitoring of their resources, and modelling suffers from large uncertainties [10,12], predominantly due to highly localised rainfall intensities, which are not captured by field observations or satellite-based products. Furthermore, more thorough understanding of the hydrology of multiple SR is a prerequisite to understanding and modelling the combined influence of small reservoirs on downstream flows, estimated to reach up to 50% on heavily-developed catchments [13,14,15].

1.2. Remote Sensing in Hydrology

Remote sensing, which began with aerial photography, has seen a significant surge in methods and applications following the development of satellite imagery over the past 40 years. Providing coverage of the whole globe at increasing spatial, temporal and spectral resolution and with reducing costs, satellite-borne sensors increased opportunities for spatial analysis of the atmosphere, oceans, continental surfaces and underground resources. These enhanced sensor characteristics allow for hydrological studies across multiple locations and large areas, while archive images support historical perspectives over several decades. Providing information of interest on flooded areas, hydrological processes and ecosystems, images are used to assess water surfaces, river depths and widths, as well as to investigate water quality issues, such as turbidity or salinity, notably through proxies, such as chlorosis or increased brightness resulting from high salinity [16], or to visualise geomorphology and map river channels. Specifically, remote sensing has shown its potential to monitor large areas, including wetlands [17,18,19], large rivers [20] and large lakes [21,22]. Studies have also pointed to the potential of satellite imagery to study small water bodies, as low as 1 ha, notably for inventory or diachronic studies [23].
Long-term monitoring of small water bodies however introduces specific constraints and difficulties in terms of temporal resolution, archive availability, costs and spatial resolution. Ogilvie [12] highlighted the existing potential of freely-available medium-resolution (Landsat) imagery to monitor resources in seven gauged small reservoirs as low as 1 ha over several years. Monitoring multiple ungauged small reservoirs introduces additional constraints to upscale the approach, notably in terms of identification and automation, as well as the conversion of remotely-sensed surface area to volumes in the absence of lake-specific rating curves to account for morphological differences and silting over time.
Strategies to adapt the method to ungauged small reservoirs and to reduce the associated uncertainties are investigated here and assessed against long-term hydrometric time series available for small reservoirs within a semi-arid catchment in central Tunisia (Figure 2). Applied to 51 small reservoirs over 15 years, the results of this approach are then analysed to inform stakeholders of the true hydrological potential of small reservoirs to support agricultural practices (in terms of water availability, droughts, etc.) in semi-arid areas.

2. Materials and Methods

2.1. Water Detection Principles

Remote sensing exploits differences in the electromagnetic waves emitted and reflected by objects under investigation to distinguish and classify land surface areas. The different level of absorption and reflectance in several wavelengths can be used to discriminate water over other land uses and combined in multispectral analysis to identify and classify land use features.
Classification methods for water detection employ algorithms to group pixels into clusters with similar reflectance profiles. In supervised classifications, learning zones based on external knowledge of the field or spectral information are incorporated from the onset and help calibrate the method. In unsupervised classifications, the classes produced by the algorithm are analysed a posteriori according to their spectral profiles or by exploiting secondary information, such as land use maps or field knowledge. Methods include K-means classification based on fuzzy logic, which remains highly effective in distinguishing land uses [19,24]. Maximum likelihood classifications (MLC) based on the Bayesian probability function have been used over different scales, but for automatic delineation, this method was reportedly affected by residual noise and is not calibrated with ground truth data to improve the method [23,25]. Furthermore, they are resource intensive (computational and operator time to define training zones) and can be applied and automated to series of images with difficulty. Reflectance values on a single band notably the short wave infrared (SWIR) and near infrared (NIR) or thermal bands may be thresholded to distinguish water bodies [26].
Considering the difficulties observed when water mixes with vegetation, several spectral water indices were developed to make use of the contrasting reflectance of objects in several bands (wavelengths). Using two or more spectral bands, these indices have been widely used in water studies and have been shown to perform as well [26] or better than other methods, notably MLC [27]. Working pixel by pixel unlike classifications, such as MLC, they are also less likely to over-classify areas with large variations in their covariance matrix. Often based on the normalised difference of two spectral bands, the ratio helps remove some of the residual noise after radiometric corrections, and constant thresholds may be defined, which facilitate the automation of water detection over successive images. Based on the comparison of seven commonly-used water detection indices, Ogilvie [12] showed the superior performance for small water bodies of the Modified Normalised Difference Water Index (MNDWI, [28]), which exploits the reduced reflectance in the SWIR spectral bands (Equation (1)). The index was most proficient in terms of detection accuracy and threshold stability, making it most suitable for semi-automated detection across several remote sensing images.
M N D W I = G r e e n S W I R G r e e n + S W I R

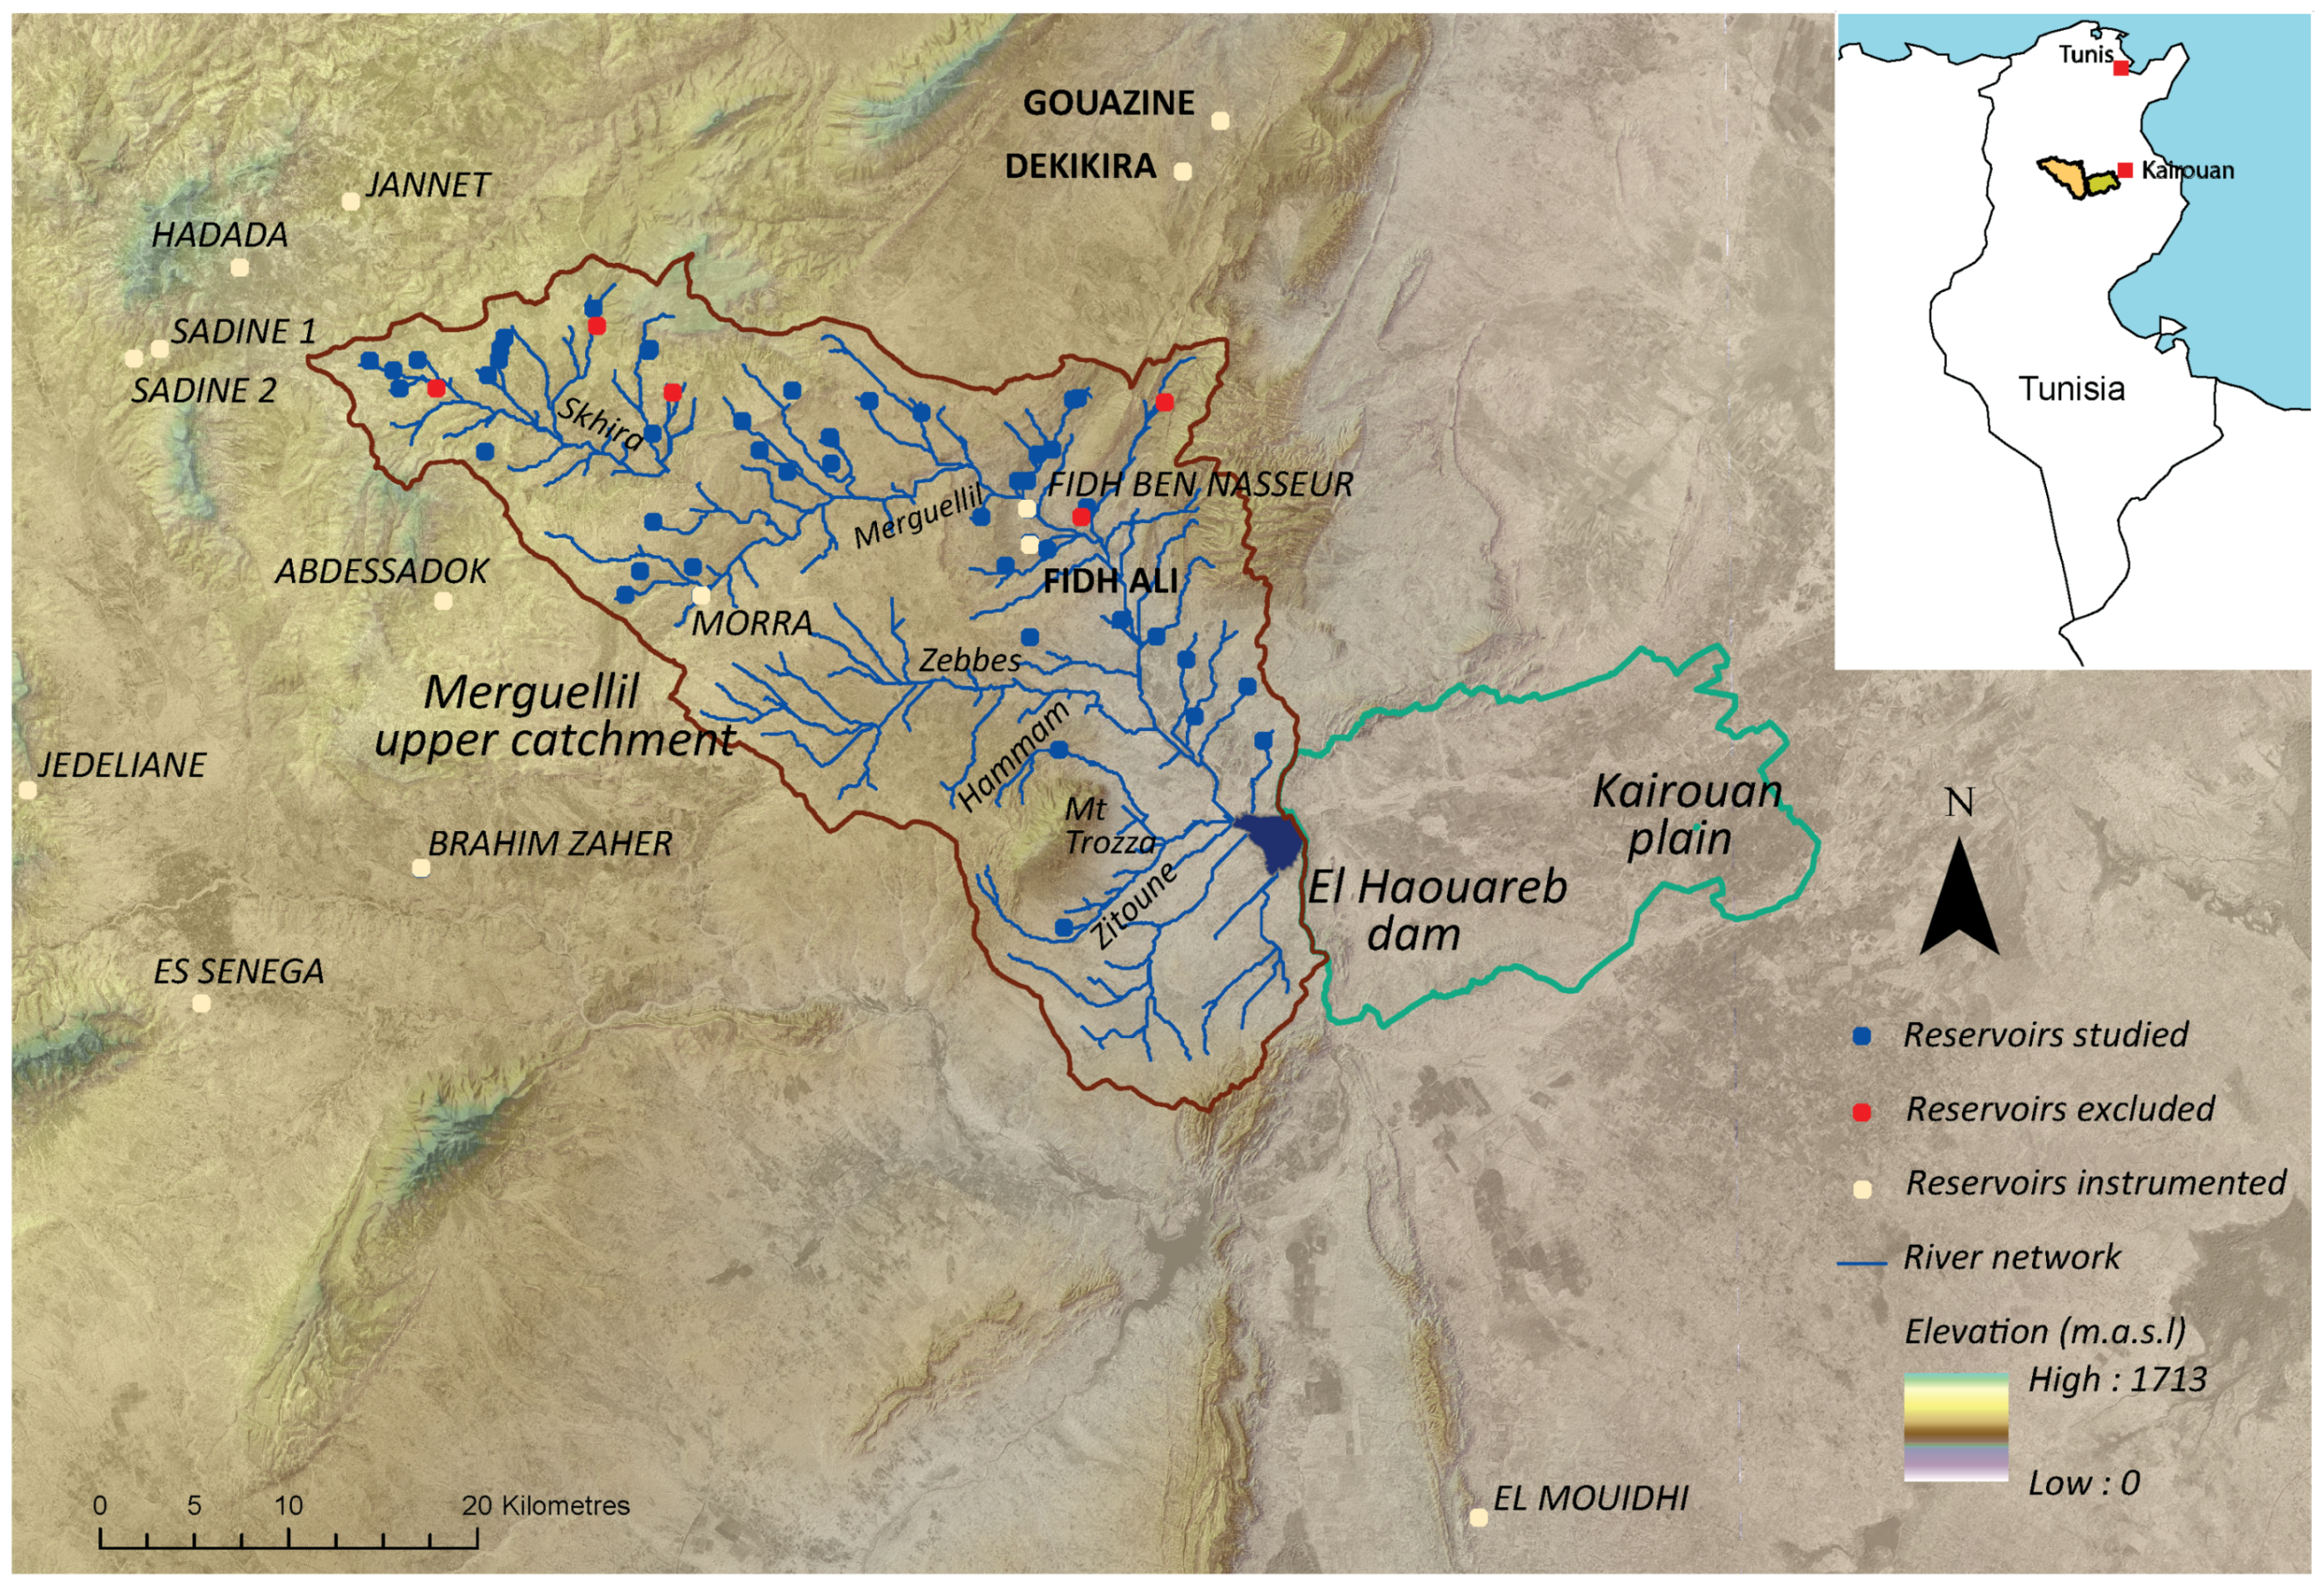
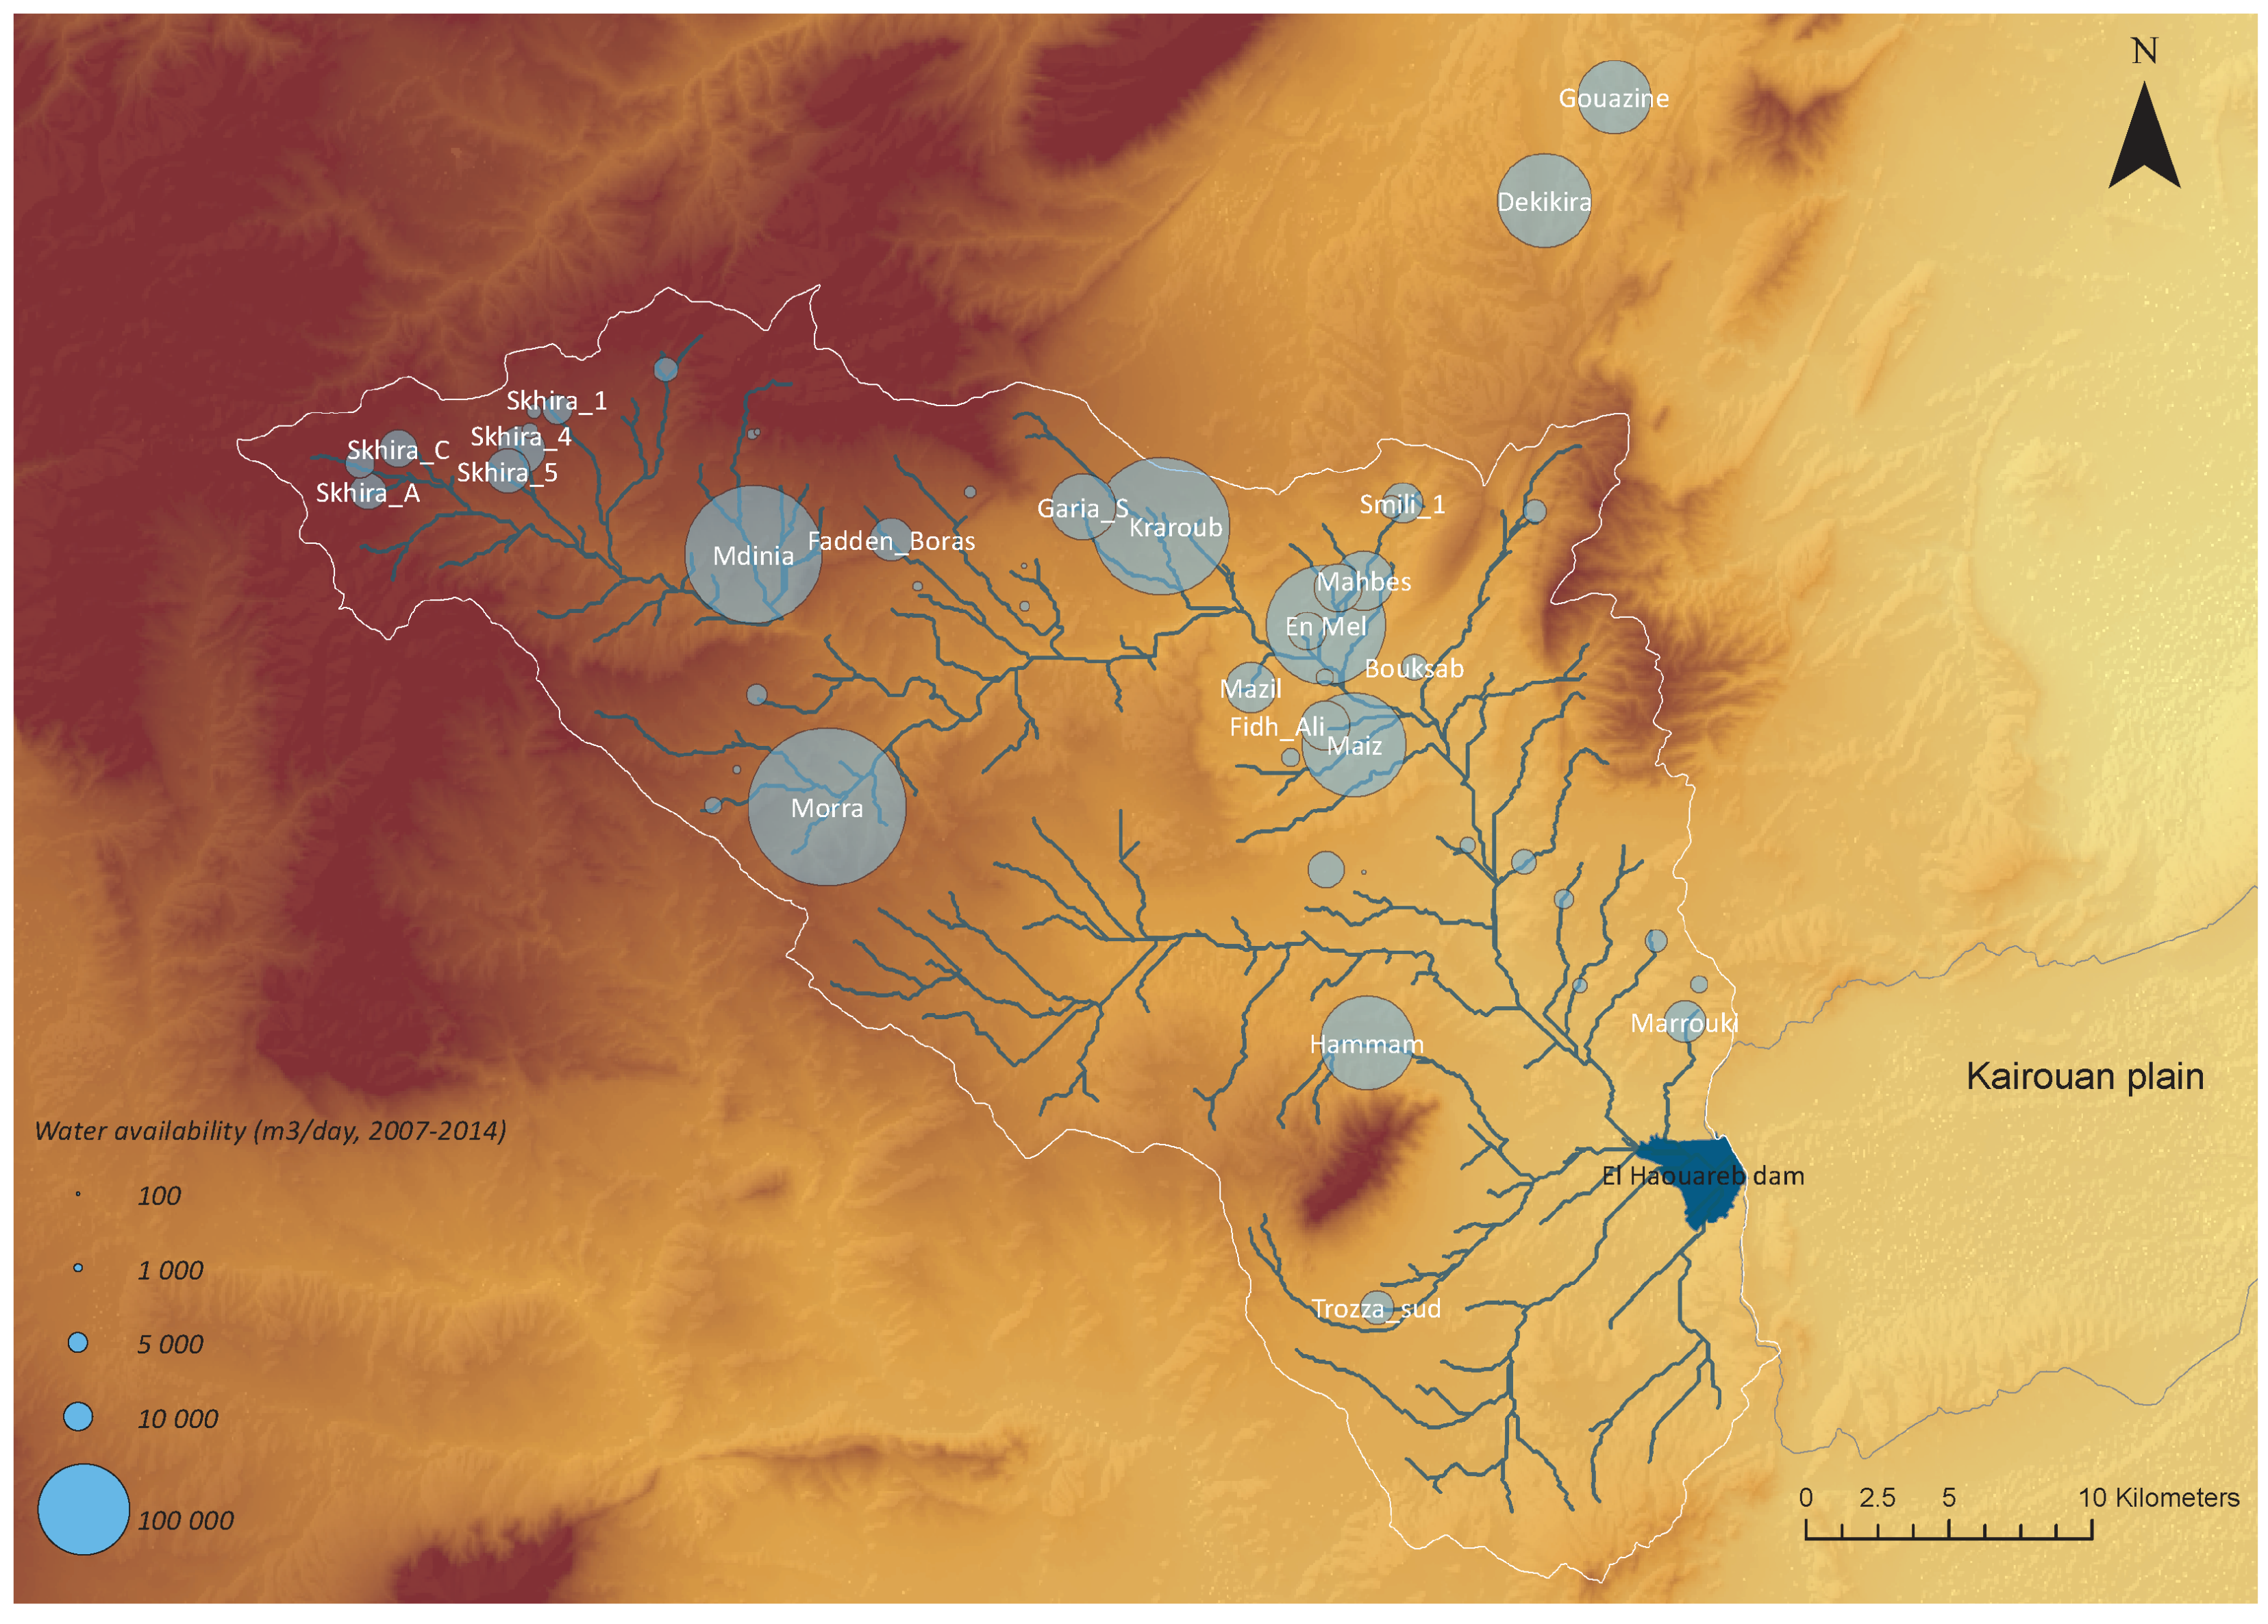
2.2. Small Reservoirs in the Merguellil Upper Catchment

The catchment used for this study is the Merguellil Upper catchment (1200 km2), situated in central Tunisia. In this semi-arid region, rainfall is low and characterised by high annual and interannual variability (329 mm/year ± 131 mm), but no declining trend has been observed [15,29]. Potential evapotranspiration varies between 1.5 and 8 mm/day for a total of 1600 mm/year. Event-based, the runoff regime is the result of intense localised rainfall events (up to 50 mm/h), which occur 5–6-times/year and cause wadis to overflow and reservoirs to flood.
The catchment contains several small reservoirs built since the 1960s. These were introduced in northern areas of Tunisia at the beginning of the 20th century [7], before spreading south with the support of several governmental and international projects. These included an ambitious nationwide strategy to build 1000 small reservoirs, 210 larger reservoirs and 20 large dams. By the late 1990s, over 700 small reservoirs had been built nationally for an estimated capacity of 70 Mm3 and led to a second phase after 2002, supported locally through a host of additional projects [1]. These works were combined with additional water and soil conservation works, including contour benches and protecting river banks. Aggressive precipitation and runoff, combined with cropping and pasture lead to strong erosion in the region, causing soil loss, gullies and the sedimentation of downstream dams [30,31].
Representative of many problems found elsewhere in the semi-arid Mediterranean basin, notably problems of uneven distribution of water resources and competition between upstream and downstream users, groundwater overexploitation and climatic variability, the region has provided an interesting case study for numerous research projects over more than 30 years. As a result, 15 small reservoirs in the region were instrumented for daily monitoring (stage, rainfall and evaporation) and regularly surveyed. Results from the remote sensing approach were compared to long-term hydrometric time series over 1999–2014 for three small reservoirs of different sizes, chosen for their extensive and reliable time series and the regular updates of their site-specific surface-volume rating curves. Furthermore, 70 surface-volume rating curves for 15 lakes were analysed below to derive a suitable common power relation updated over time to account for silting.

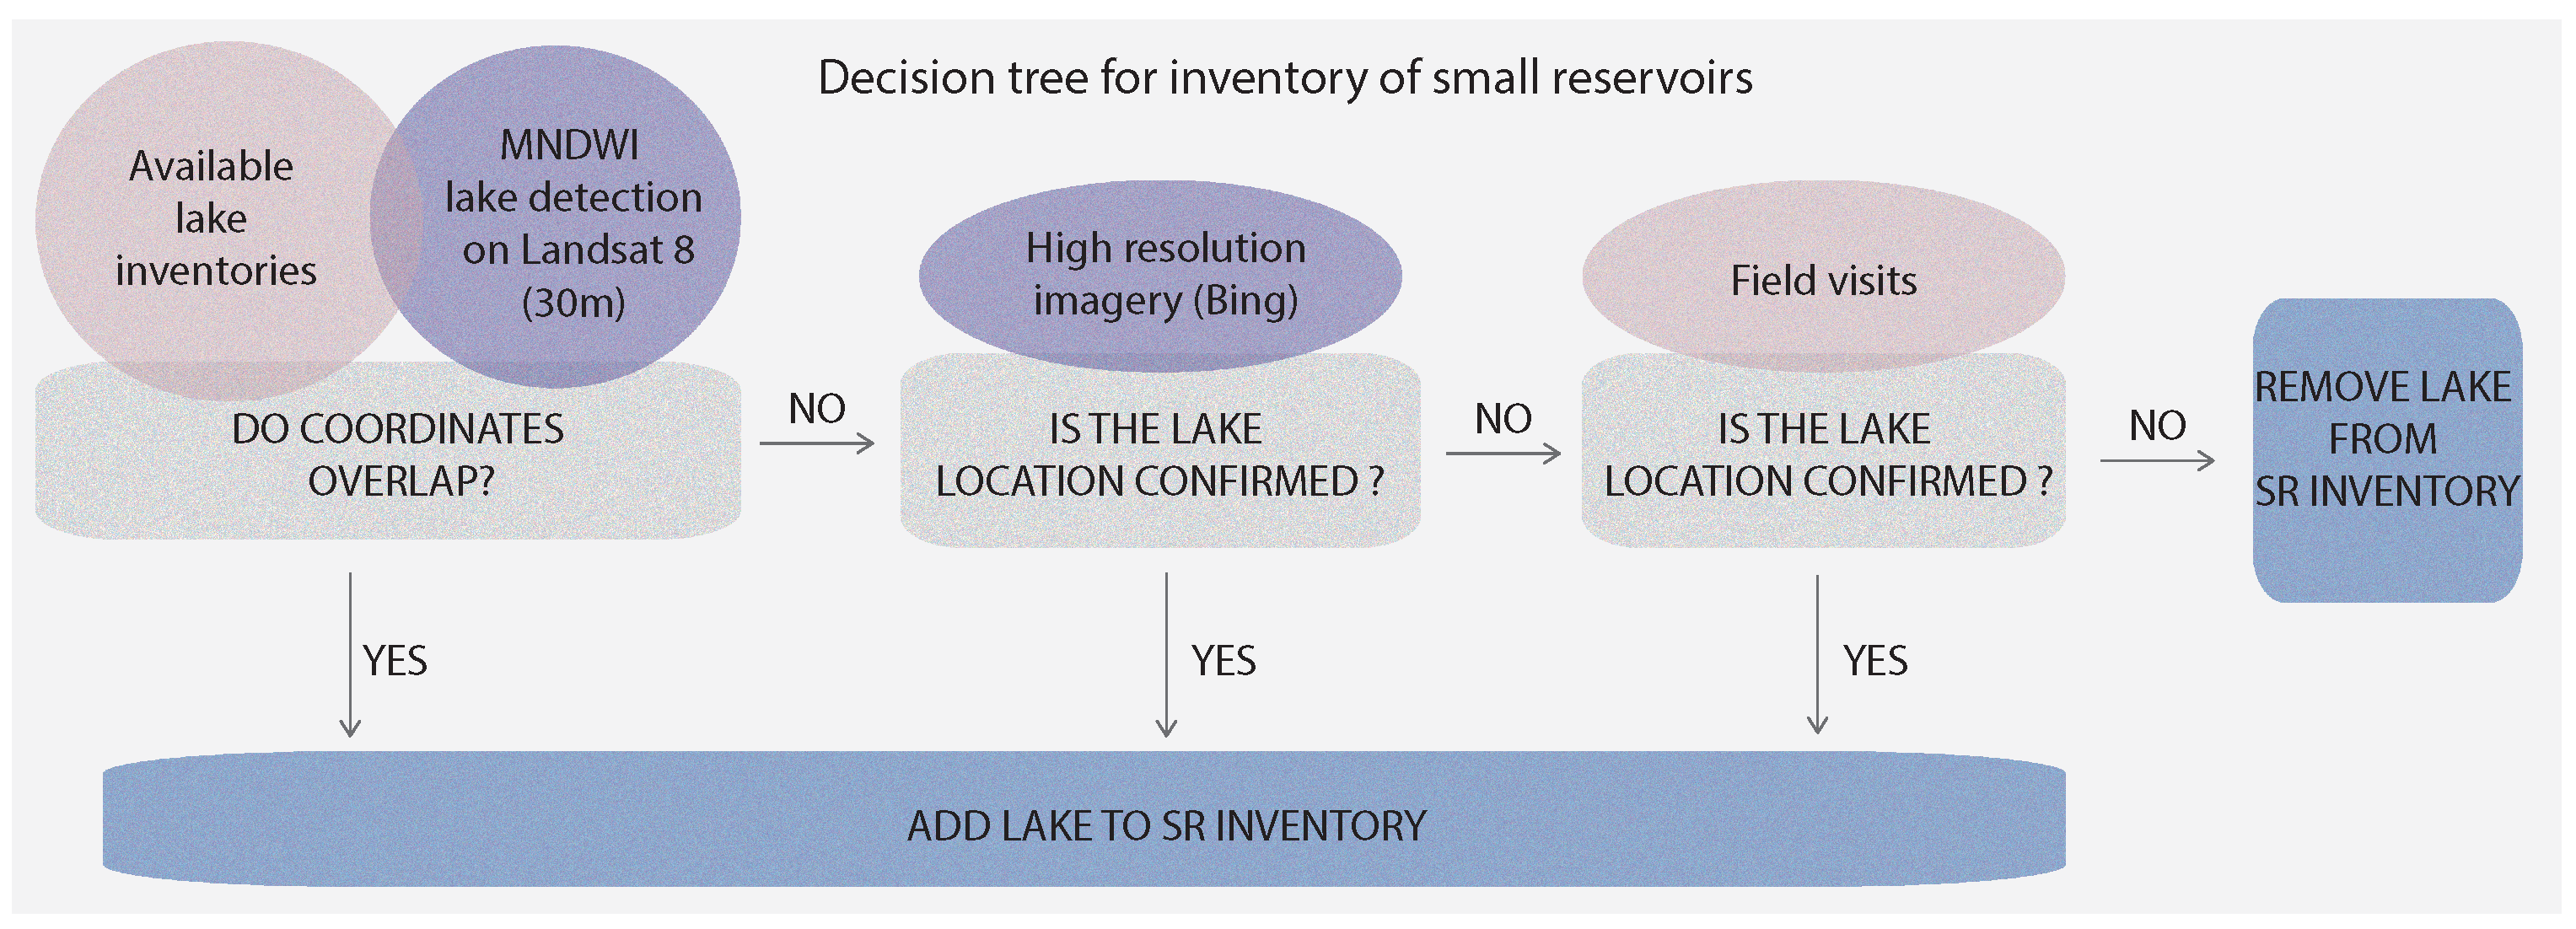
2.3. Inventory of Small Reservoirs

An inventory was produced here based on cross-referencing prior records from local authorities and the literature [1,10,32] with satellite imagery and field visits (Figure 3). Available records notably suffered from discrepancies due to substantial imprecision (mean 450 m, max. 2330 m) from coordinates transcribed upon 1:50,000 maps, compounded by different naming conventions and incomplete metadata. The MNDWI was therefore applied in the first instance to discriminate water bodies on 30-m Landsat imagery. A single cloud-free Landsat image, chosen when water levels were high across several lakes (autumn 2011) to increase the likelihood of identifying all lakes, was used. Lakes as small as 0.5 ha were detected, but the process required manual intervention to exclude additional pixels, essentially river stretches and temporary flooded areas. Additional filters based on shape, size and turbidity could help automate the process when working over large areas. Similar assessment of water bodies has notably been carried out, but focussed on larger reservoirs or used 2000 Landsat (GeoCover) images, meaning recent and small non-permanent water bodies would be omitted [33], and therefore, could not be used here. Here, the water detection index was calibrated based on ground truthing over seven reservoirs as described in [12], but where no field data are available, unsupervised classifications, such as K-means [24], may also be used to detect flooded areas.
High spatial resolution images made available freely through Microsoft Bing as part of the Bing Global Ortho project, and dating for our region between April 2011 and June 2012 was then used in a second phase to cross-check the inventory and confirm coordinates. The MNDWI spectral analysis step was essential to quickly distinguish water bodies, which may not appear on true colour composite imagery, especially if taken during the dry season. Where high spatial resolution multispectral imagery is available and affordable, these steps may be combined.
The updated inventory of lakes was then uploaded to mobile devices, and field surveys undertaken over several months over 2011–2014 allowed confirming the location and coordinates of each lake. Only one false positive was recorded, due to highly reflective rock formations, and helped identify 56 lakes in the Merguellil upper catchment (Figure 2), 10 more than the previous inventory. Due to heavy silting and the absence of initial volume information, five lakes were excluded from the subsequent analysis. Initial design capacities range between 17,000 and 1,590,000 m3, though most (83%) do not exceed 250,000 m3 (Figure 19). Despite these vast differences in water volumes, these lakes were built as part of the same water and soil conservation projects, sharing similar objectives, operation and management [1], and as a result, were here considered jointly. For the sake of comparison, the El Haouareb dam at the catchment outlet has a theoretical 95 Mm3 capacity.

2.4. Grid Cell Definition for Automation

In order to automate the remote sensing process and allow the calculation of clouds and water pixels, cells around each lake were delineated. A similar approach was notably used to study flood dynamics within designated areas of a large wetland [19]. Cells were manually created based on the high resolution images provided through the Microsoft Bing interface (more recent and spatially defined for our catchment than on Google Earth). Automated drafting of the cell polygons using a classified Landsat image was not satisfactory considering the steps required to remove unwanted polygons (river sections notably) and adding extra polygons (as not all lakes were flooded) and remodelling to account for very high floods. Likewise, automatic delineation of small reservoirs using SRTM based on topography was not attempted considering the very flat topography of certain lakes, the low spatial resolution and the low precision in altitude. Delineation sought to account for large floods by defining a 10% buffer around geomorphological boundaries of the lake, but meanders were excluded to conform with the surface-volume laws used.

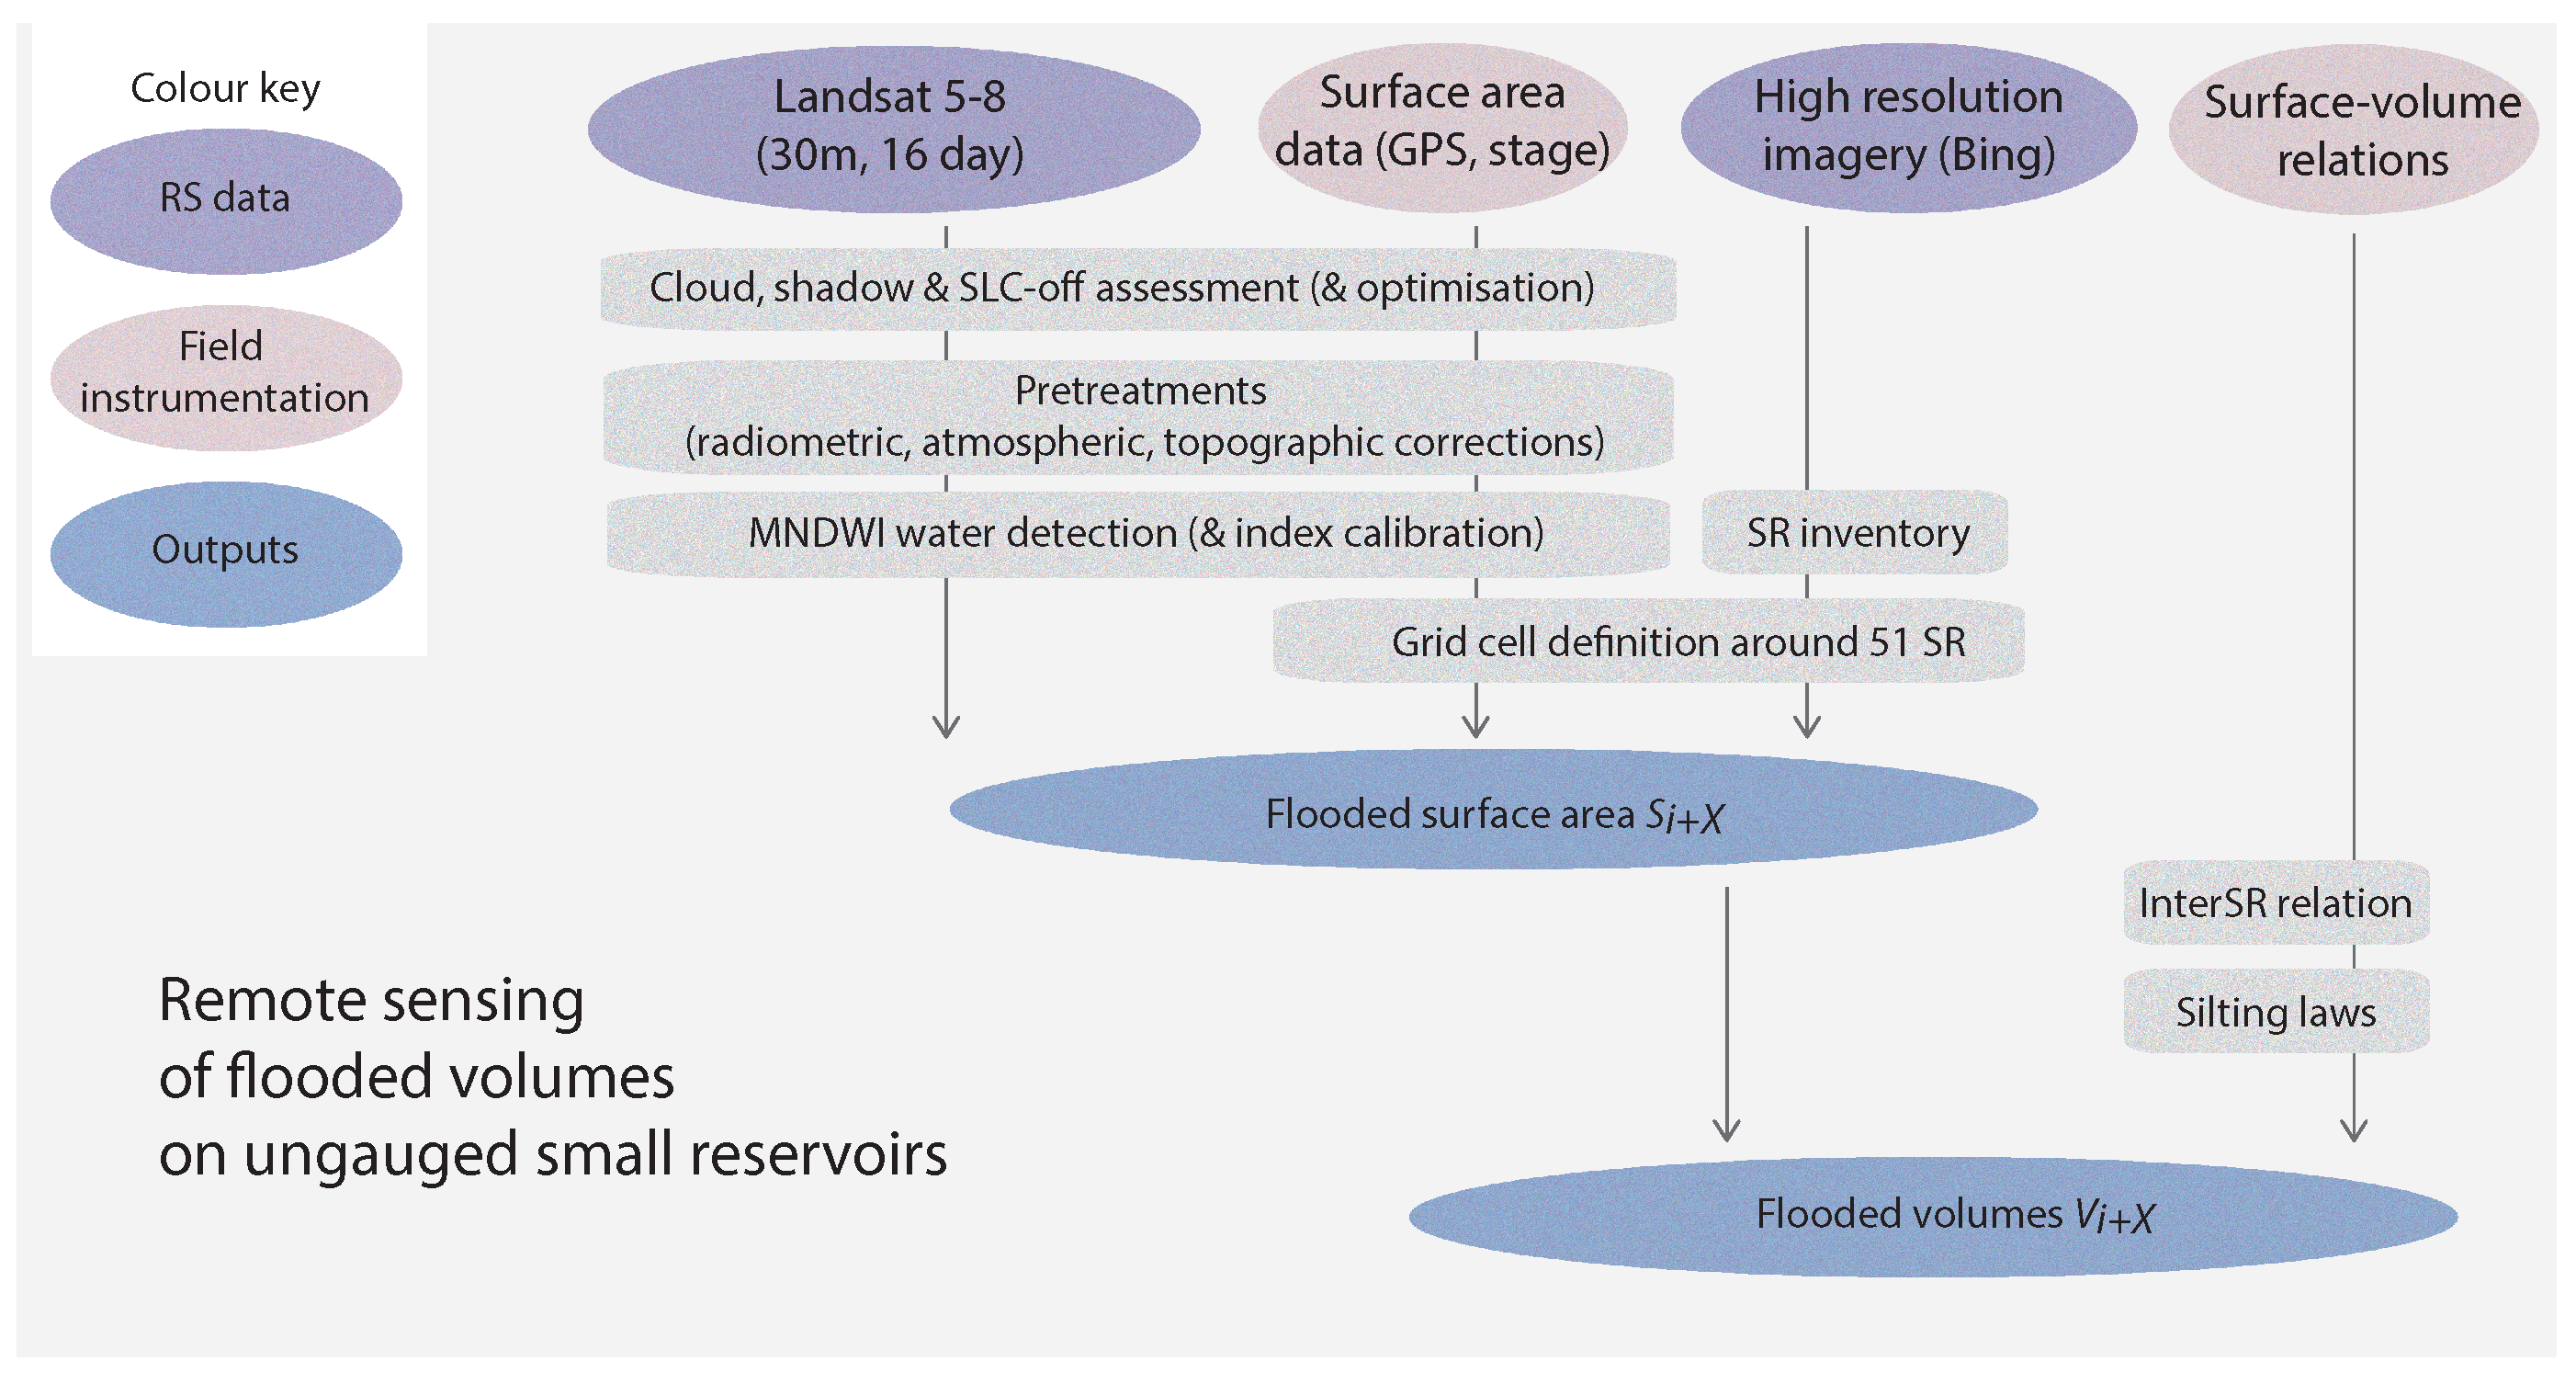
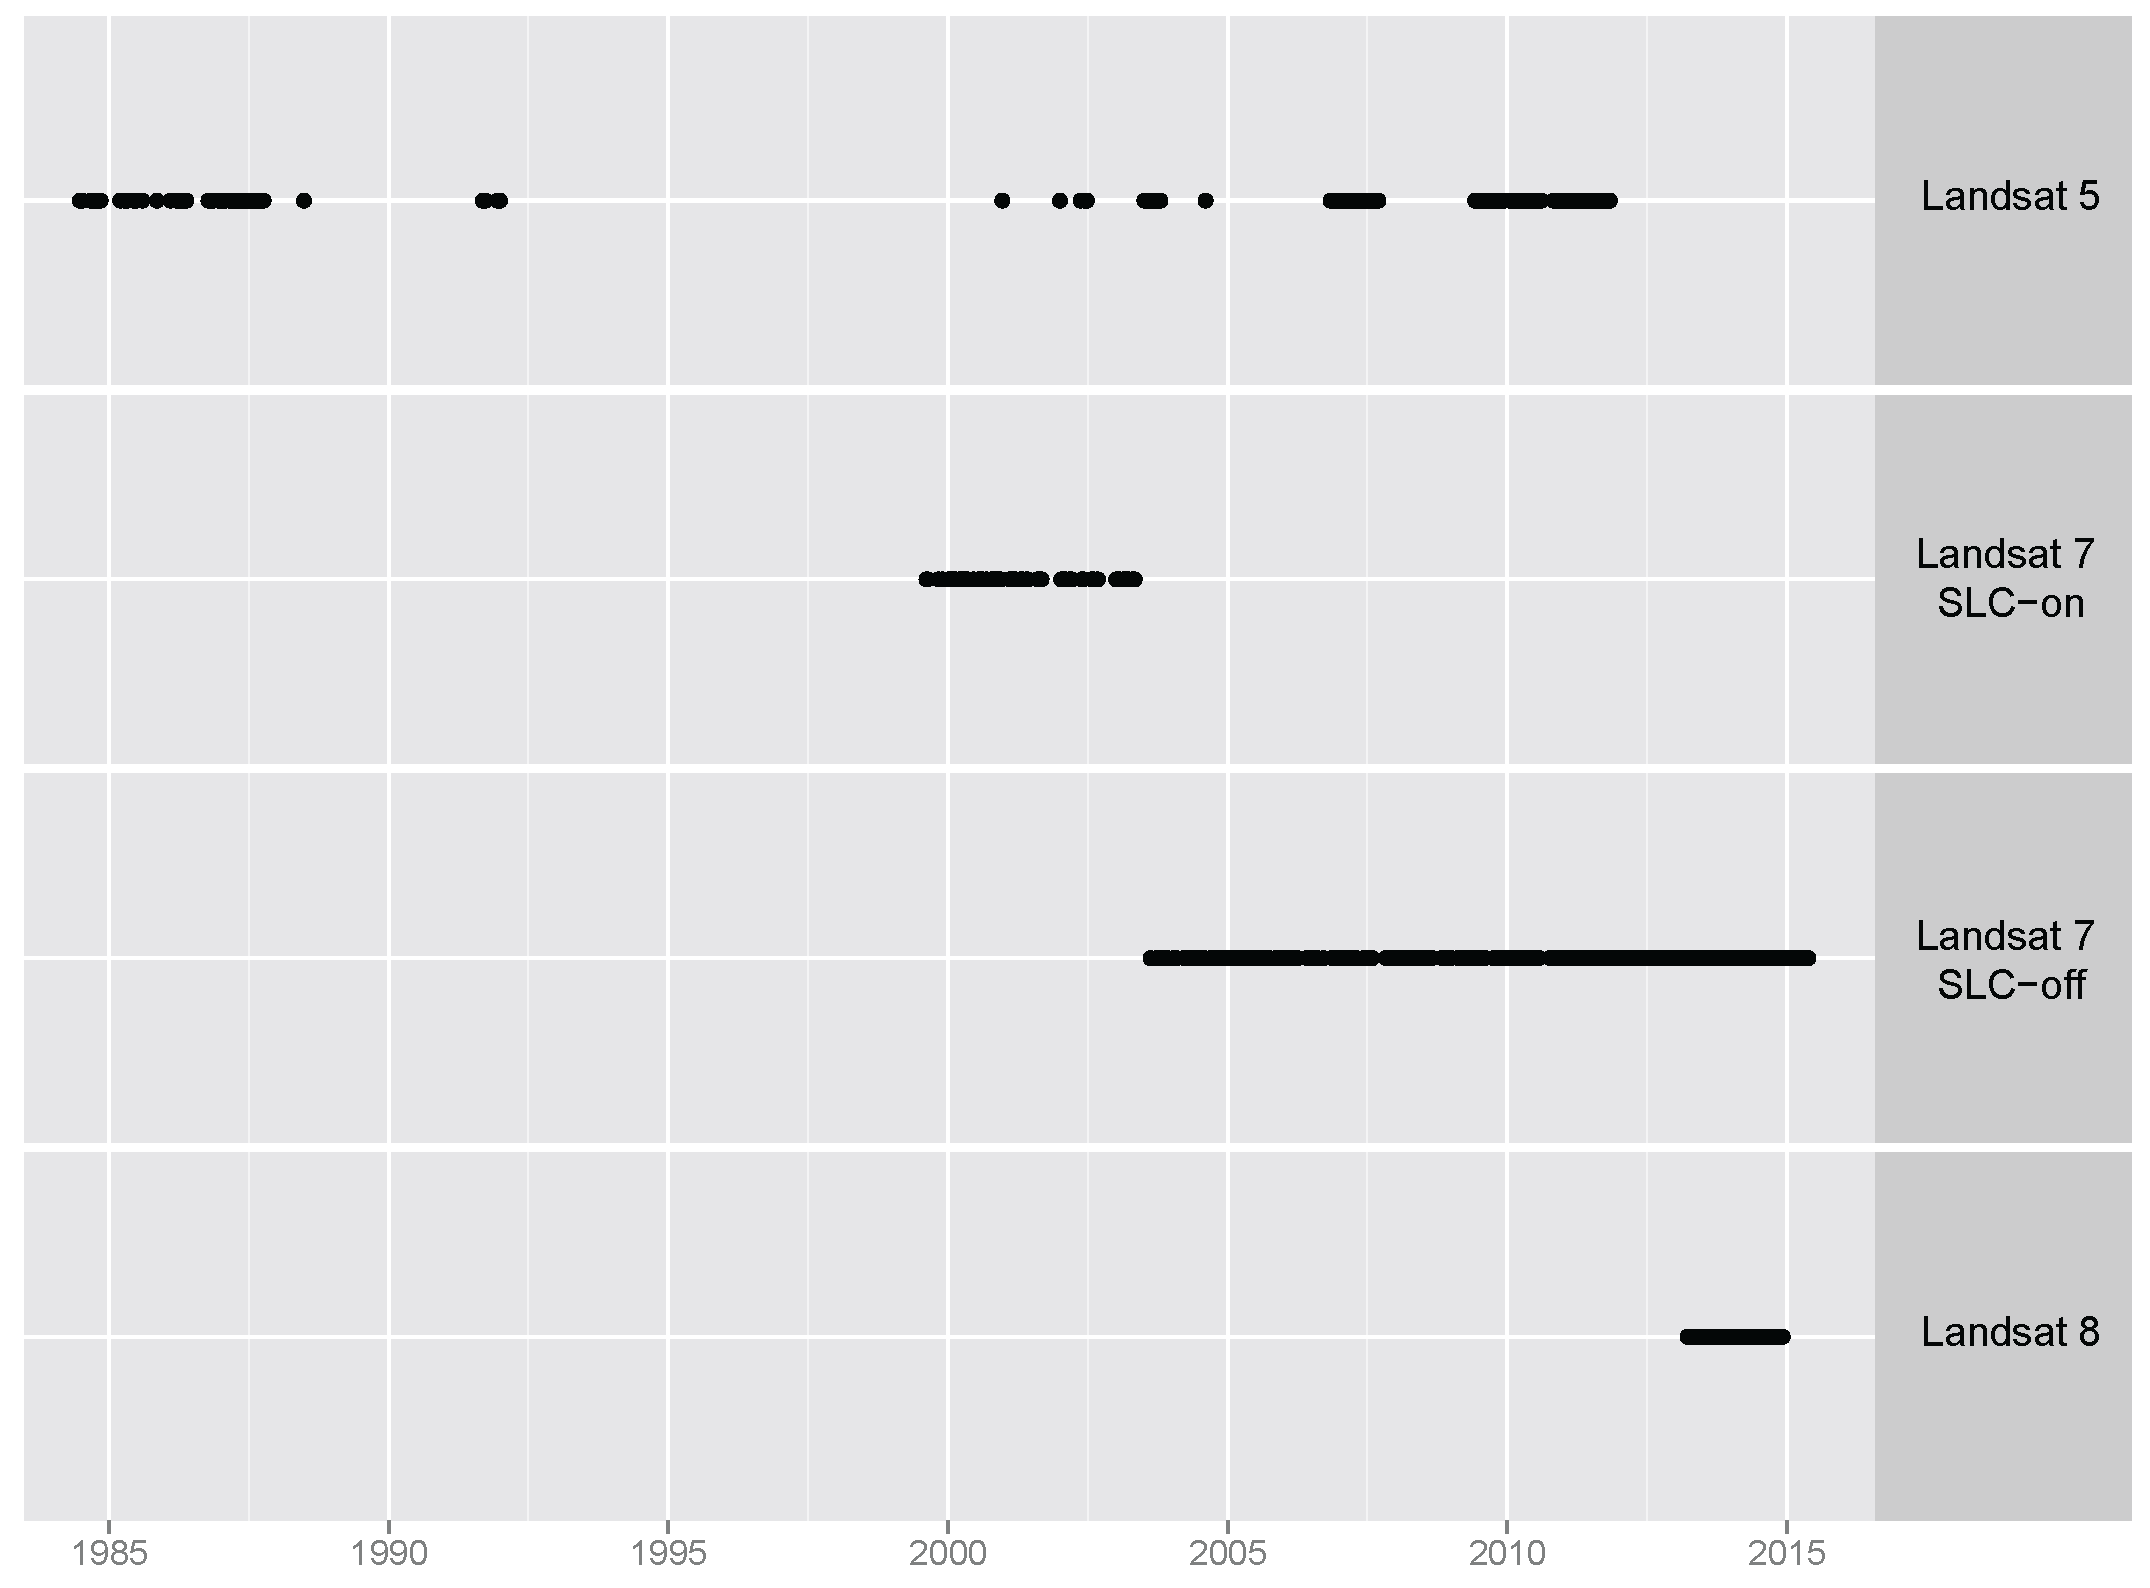
2.5. Chain of Treatments on Landsat Imagery

Selecting satellite imagery remains a compromise between spatial, temporal, spectral resolution and costs. Based on the size of the small reservoirs and the desire to investigate drought patterns over several years, Landsat imagery was used here. The Landsat programme, funded and managed by NASA, launched the Landsat 1 satellite in 1972 and in 2013 placed Landsat 8 in orbit providing unparalleled cover of the globe at medium resolution over more than four decades. Considering our interest to monitor lakes since the 1990s, images from Landsat 5, 7 and 8 were used (Figure 4). Landsat 6 crashed into the sea on its launch day in 1993. With a heliosynchronous near polar orbit at an altitude of 705 km, Landsat 5 and its successors revisit the same region of the globe every 16 days and provide multispectral images in 30-m spatial resolution in six or more spectral bands from the visible to the infrared part of the spectrum.
Five hundred forty six Landsat images over 1999–2014 were acquired freely through the USGS Earthexplorer platform and treated as follows within R (Figure 5). Digital numbers in the green and SWIR bands were converted to top of atmosphere (TOA) radiance using parameters provided in the meta-files and converted to surface reflectance using the top of canopy (TOC) dark object subtraction (DOS1) method [34,35,36] and topographically corrected based on the Minnaert [37,38,39] algorithm. Clouds and shadows were detected using Fmask [40], and SLC-off pixels on Landsat 7 images post 31 May 2003, resulting from the permanent failure of the scan line corrector (SLC) on the Landsat TM sensor, were detected by creating a mask where digital numbers were zero. MNDWI, clouds, shadows and SLC-off values were extracted and compiled for each pixel in each of the 51 grid cell for each 546 images. Pixels with MNDWI values above −0.09 were considered as flooded based on calibration and validation against Differential Global Positioning System (DGPS) contours over seven lakes in conditions of both high and low water levels [12]. Further validated against hydrometric data for seven different small reservoirs, the negative MNDWI threshold was coherent with values found in wetlands [19], which present similar issues of flooded vegetation and shallow waters [26]. Finally, images with more than 40% clouds and 25% SLC off pixels were discarded for each individual lake [12], leaving on average 282 images, i.e., 1.5 images/month. The resulting remotely-sensed assessments of flooded surface area were compiled and converted to volumes as below to study flood dynamics across all lakes. Time series were spline interpolated and smoothed to allow the calculation of water availability values over time (dry season and whole year).

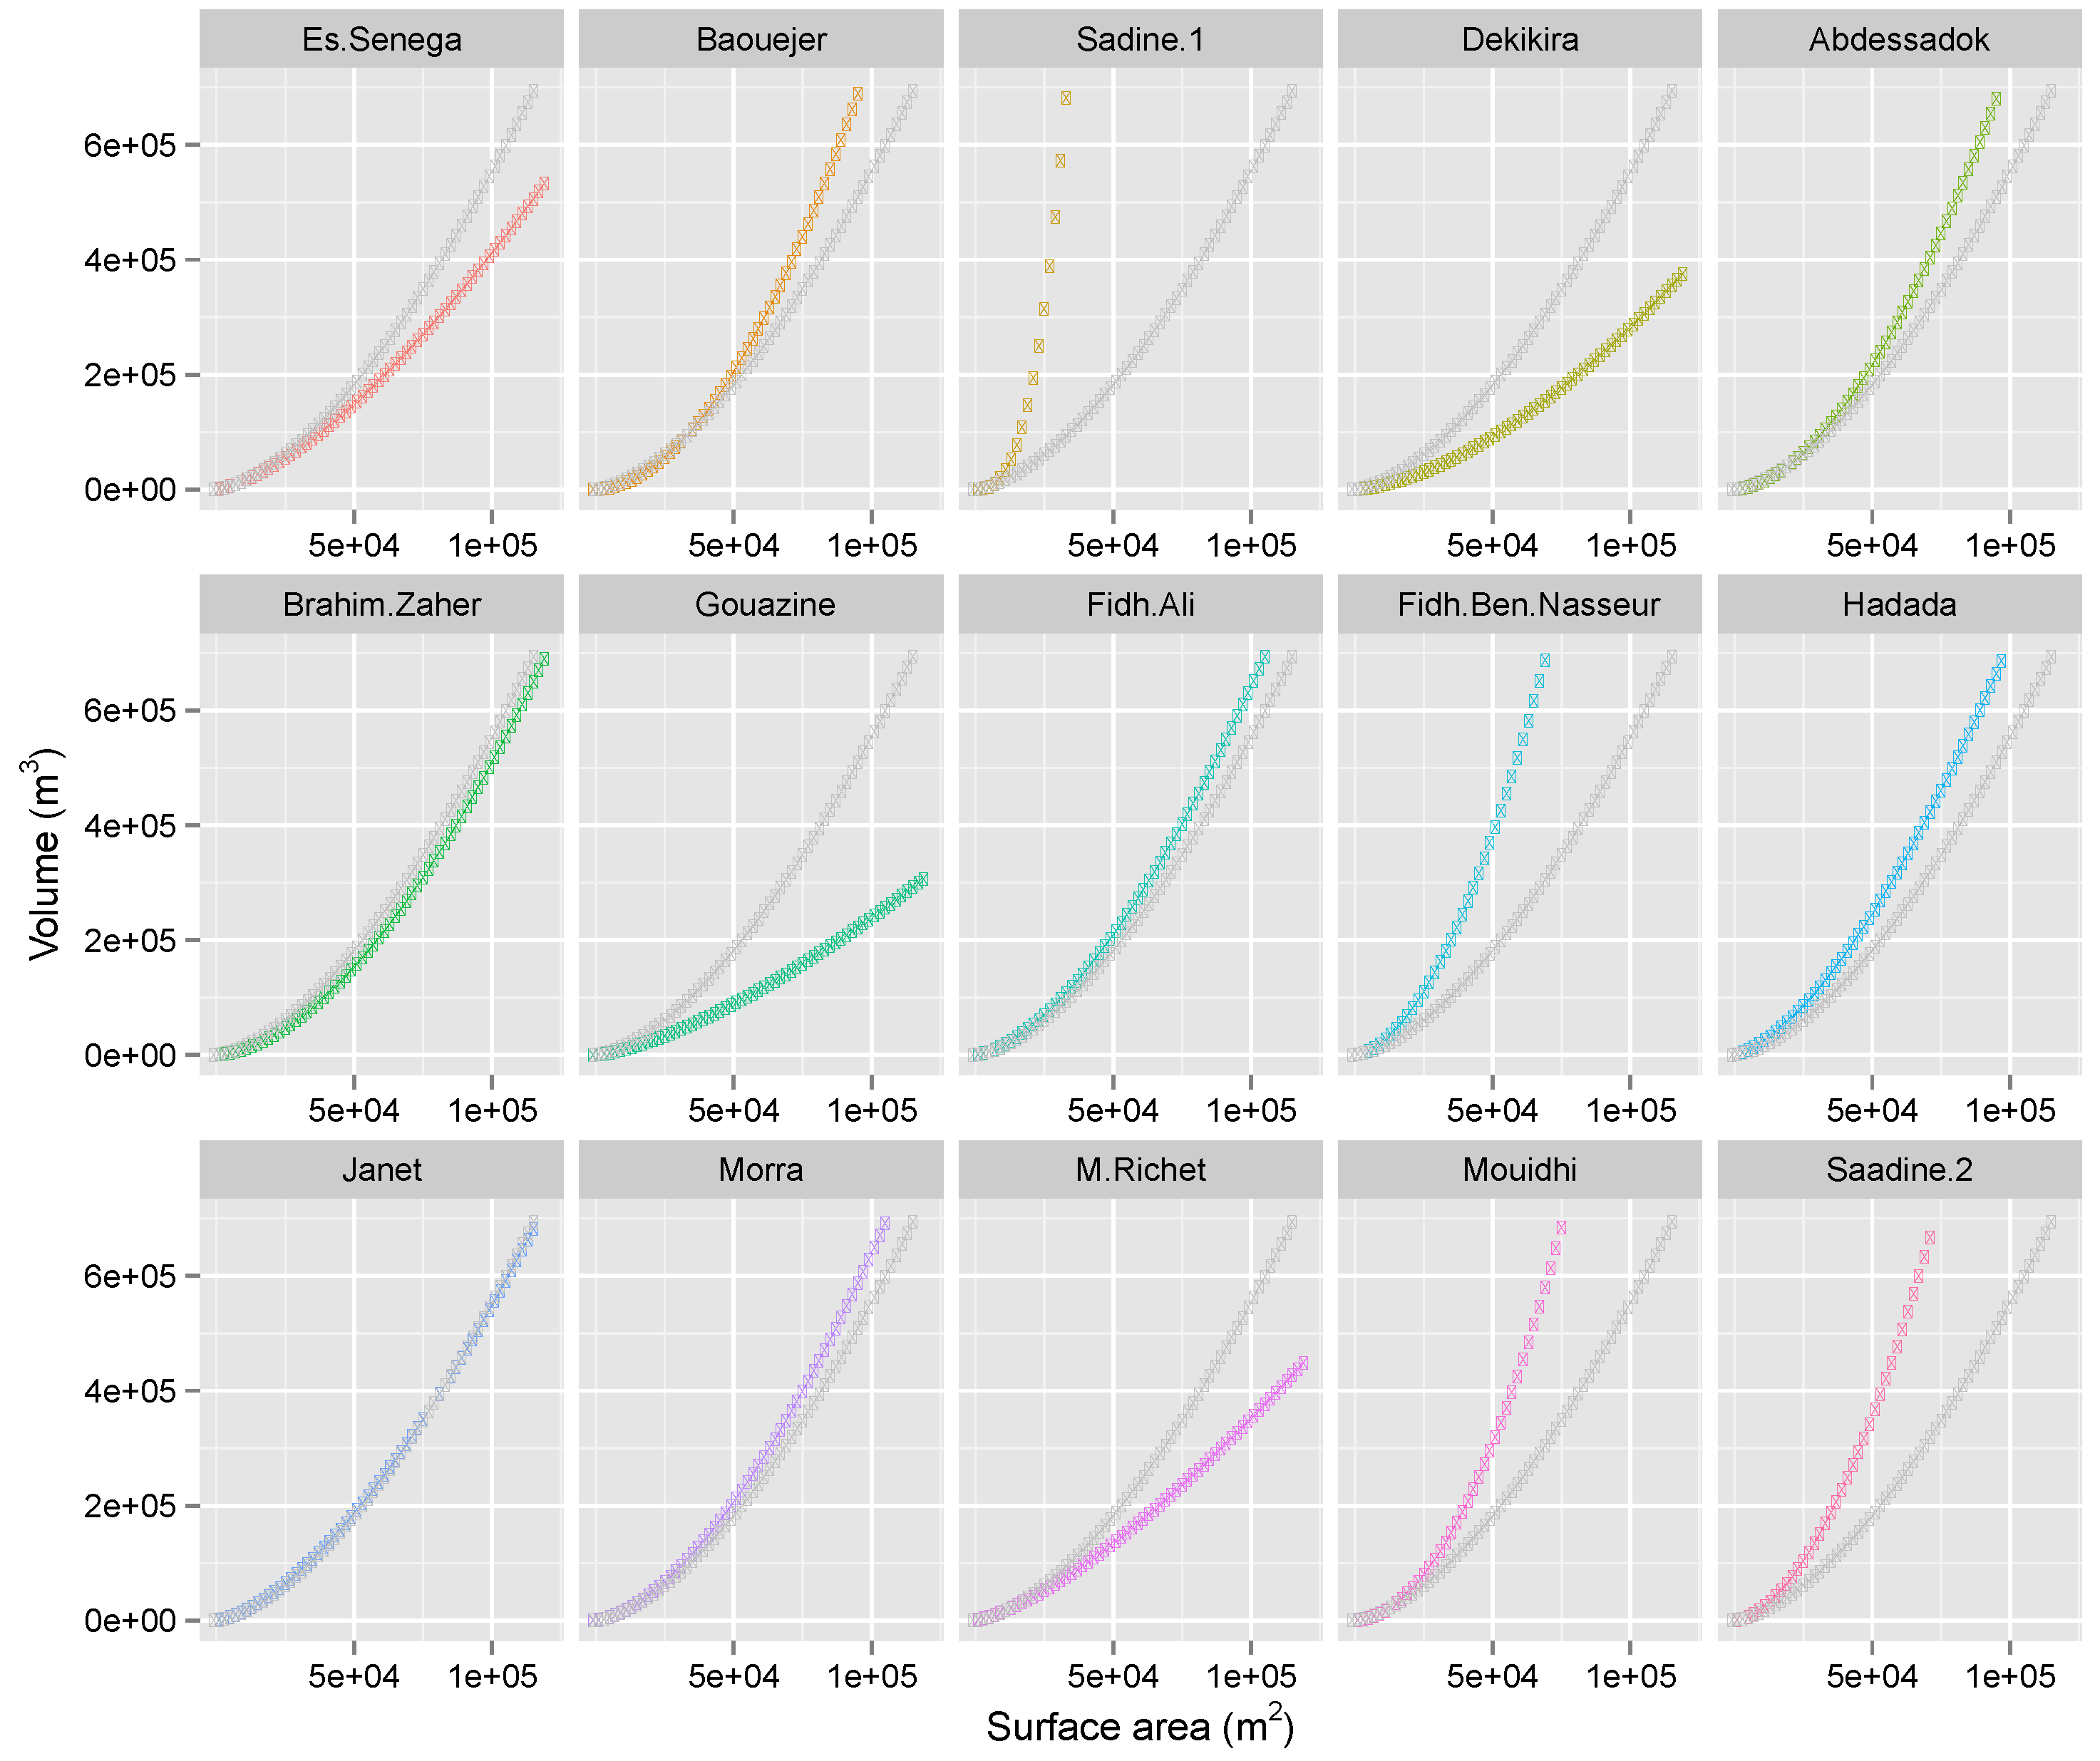
2.6. Surface-Volume Rating Curves

2.6.1. Power Relations

Converting remotely-sensed surface areas into volumetric data requires rating curves, typically produced through bathymetric surveys or topographic surveys. In the absence of surface-volume (S-V) curves for multiple ungauged reservoirs, power relations can be developed, but the uncertainties they introduce must be assessed and minimised. These have been previously used in studies with small reservoirs [23,41] and are based on the principle that when representing the lake as a half pyramid (i.e., a triangular shaped lake), volumes (V) and surface area (S) are related as per Equation (2) where B is a constant and β = 1.5. Similar relations can be defined between height and volume based on a triangular representation [10]. In practice, the lakes do not follow a true pyramid shape; if slopes are convex, β < 1.5, and β > 1.5 if slopes are concave [23]. Equation (4) and Figure 7 reveal that in this catchment lakes have predominantly concave slopes (β > 1.5).
V = B × S β
l n ( V ) = l n ( B ) + β × l n ( S )
A common inter lake (interSR) power relation was derived here based on a subset of 11 surveyed lakes in and around the catchment. Initial rating curves were used as silting introduces additional complexity and irregularities in the shape of lakes and therefore errors on rating curves. The progressive modification of the parameters due to silting was accounted for separately as discussed below. The full range of values provided in the rating curves was exploited unlike other studies [10,42] where lower values (corresponding to under 15% maximum volume) were removed and points weighted by their volume. These seek to remove the points where the lake profiles are less reliable and lead to improved estimation at the upper range and therefore R 2 (as similar % errors on large values affect R 2 more strongly), but at the lower range leads to larger errors. Considering the fact that water levels on several lakes never reach the theoretical upper range of the rating curve and are typically within the lower half (when not completely dry), we chose to favour the representation of the lower volumes in the power relation. On Gouazine lake, this method leads to errors of 8% above 4 m (4.6 ha) and 19% at 1 m (1.05 ha), respectively, against 1% and 40% when excluding lower values. The parameters of the interSR power relation were derived by linear regression of Equation (3) using the surface and volume data from instrumented lakes, which yields the values of β as the slope and l n ( B ) as the intercept, as illustrated in Figure 6. The optimal β for each lake varied moderately (coefficient of variation of 19%), while values for B varied significantly (CV = 137%) (Figure 7). Deriving a single linear model to minimise errors (and optimise Nash–Sutcliffe efficiency) between the interSR predicted volume and rating curves of all 11 lakes was preferred over averaging the parameters from each lake [10], which would give greater importance to extreme parameter values.
V = 0.0039352 × S 1.6282

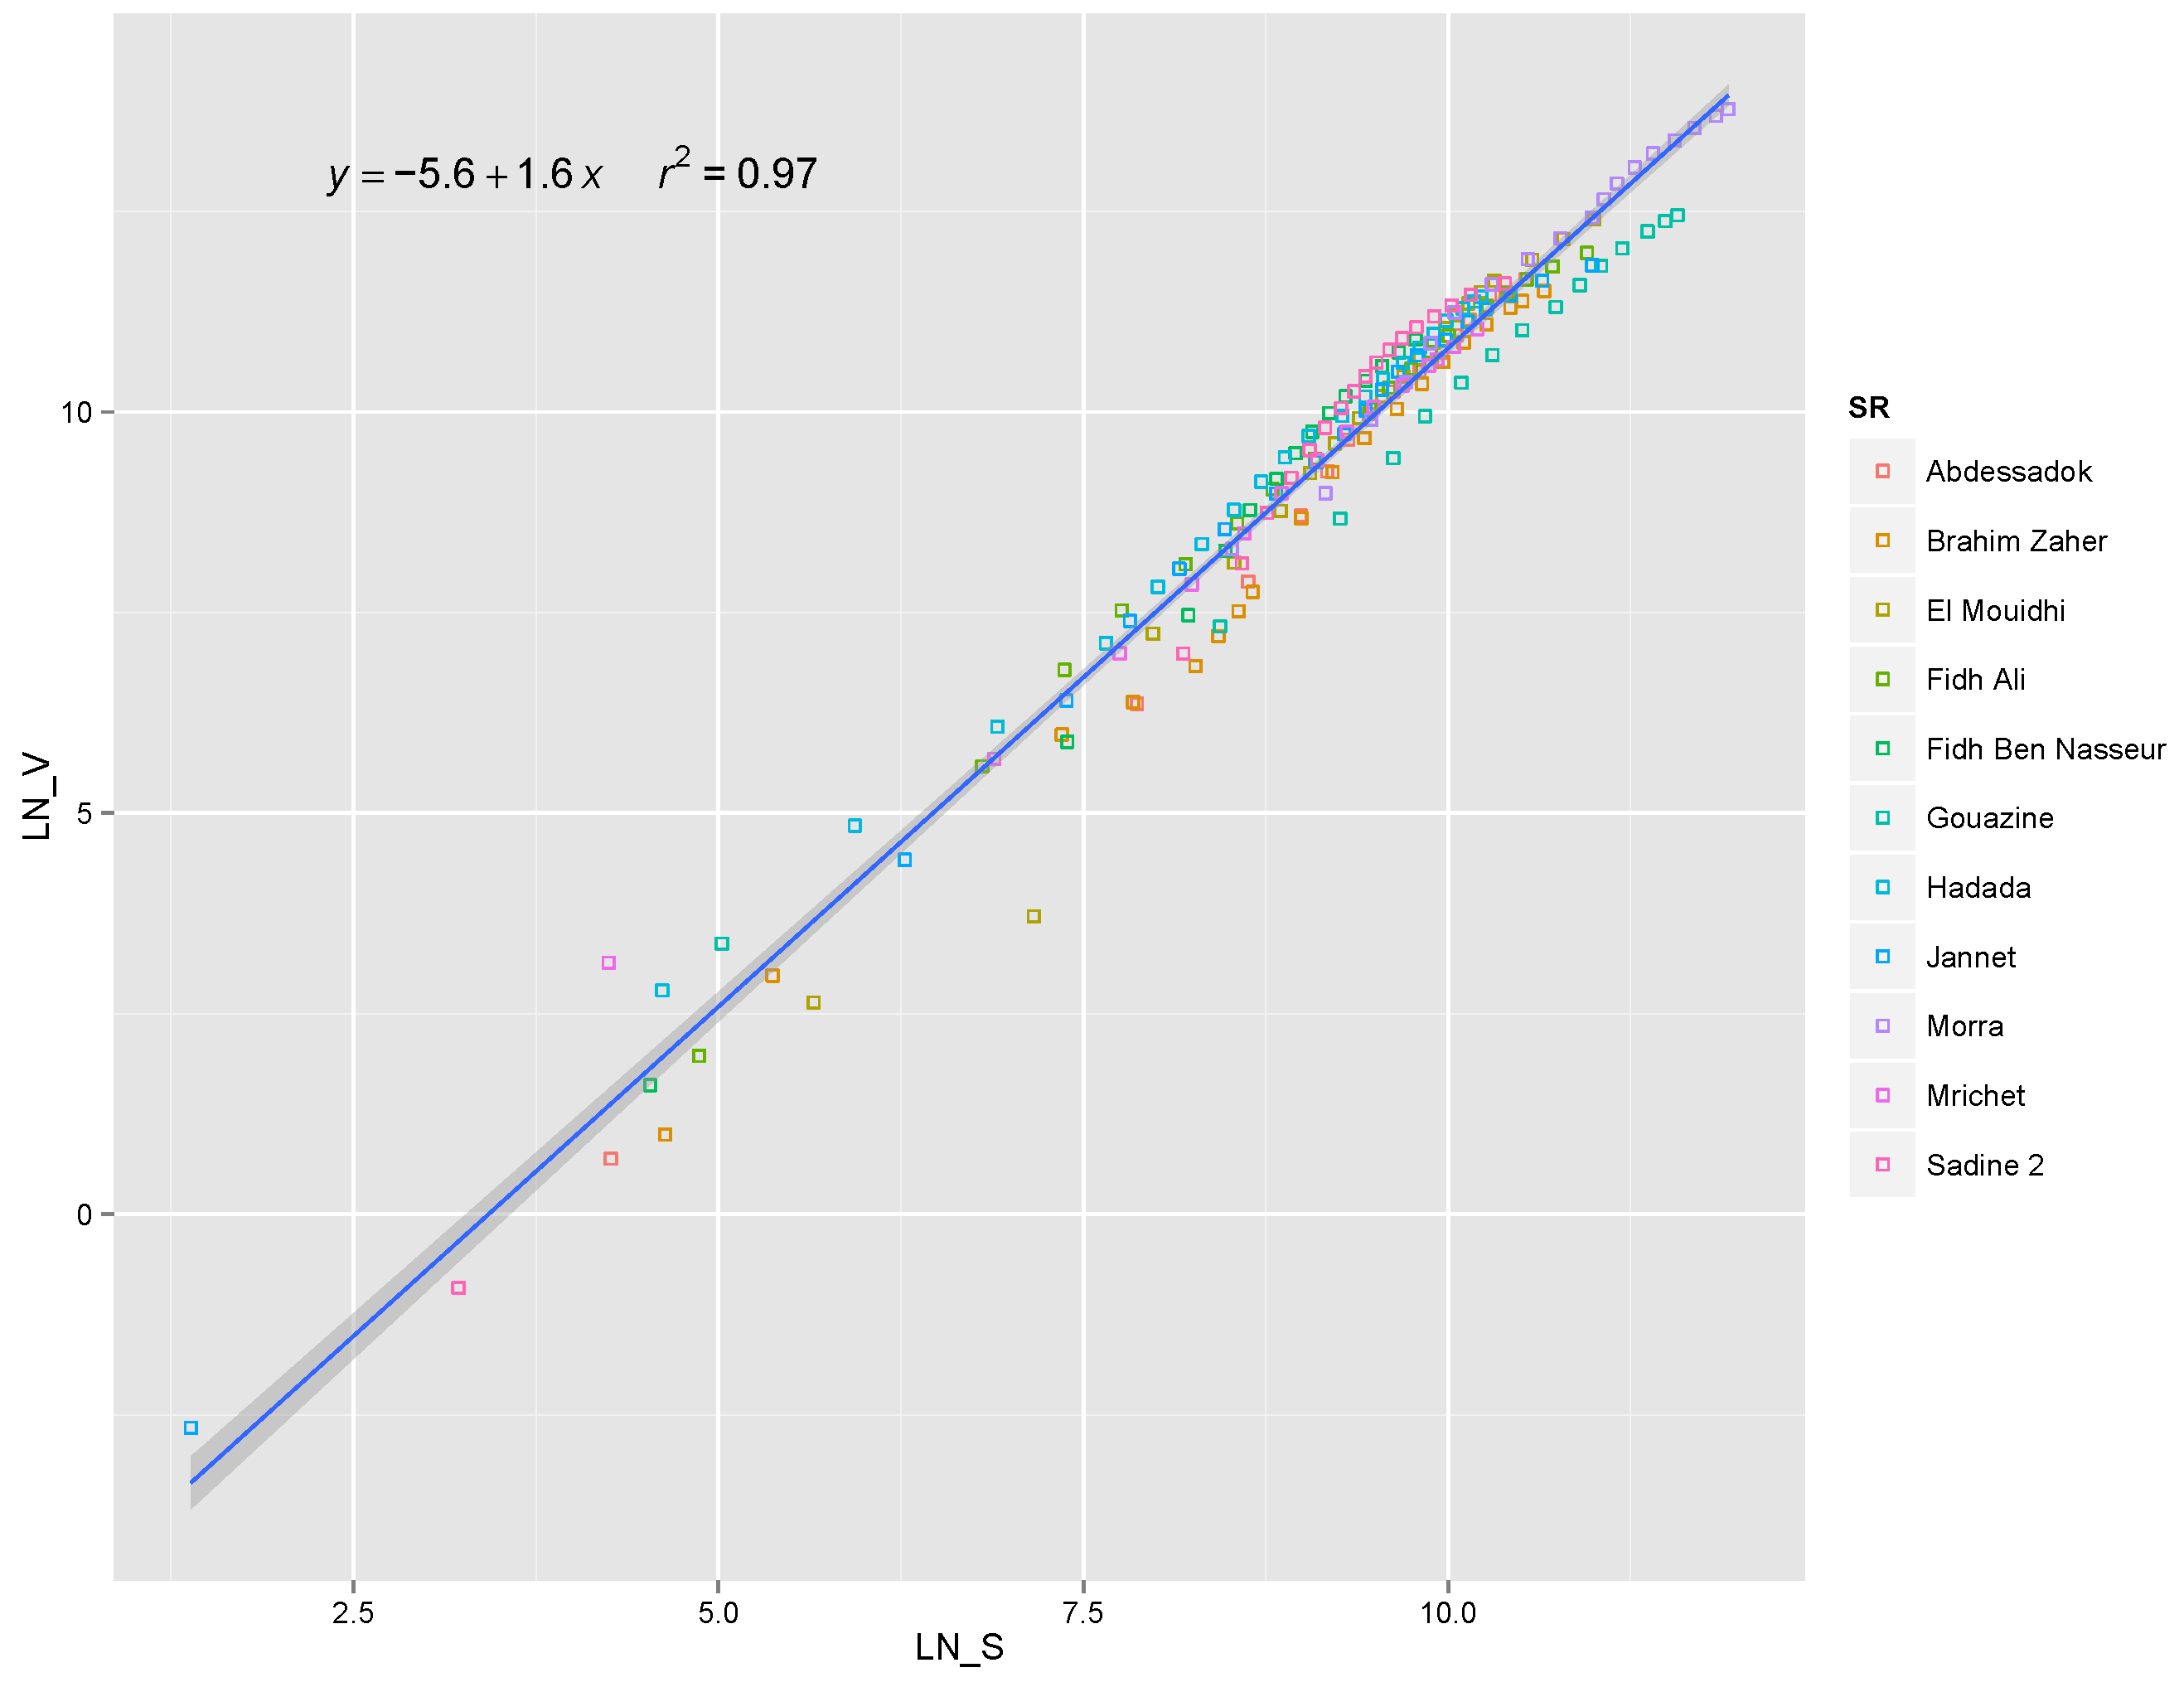
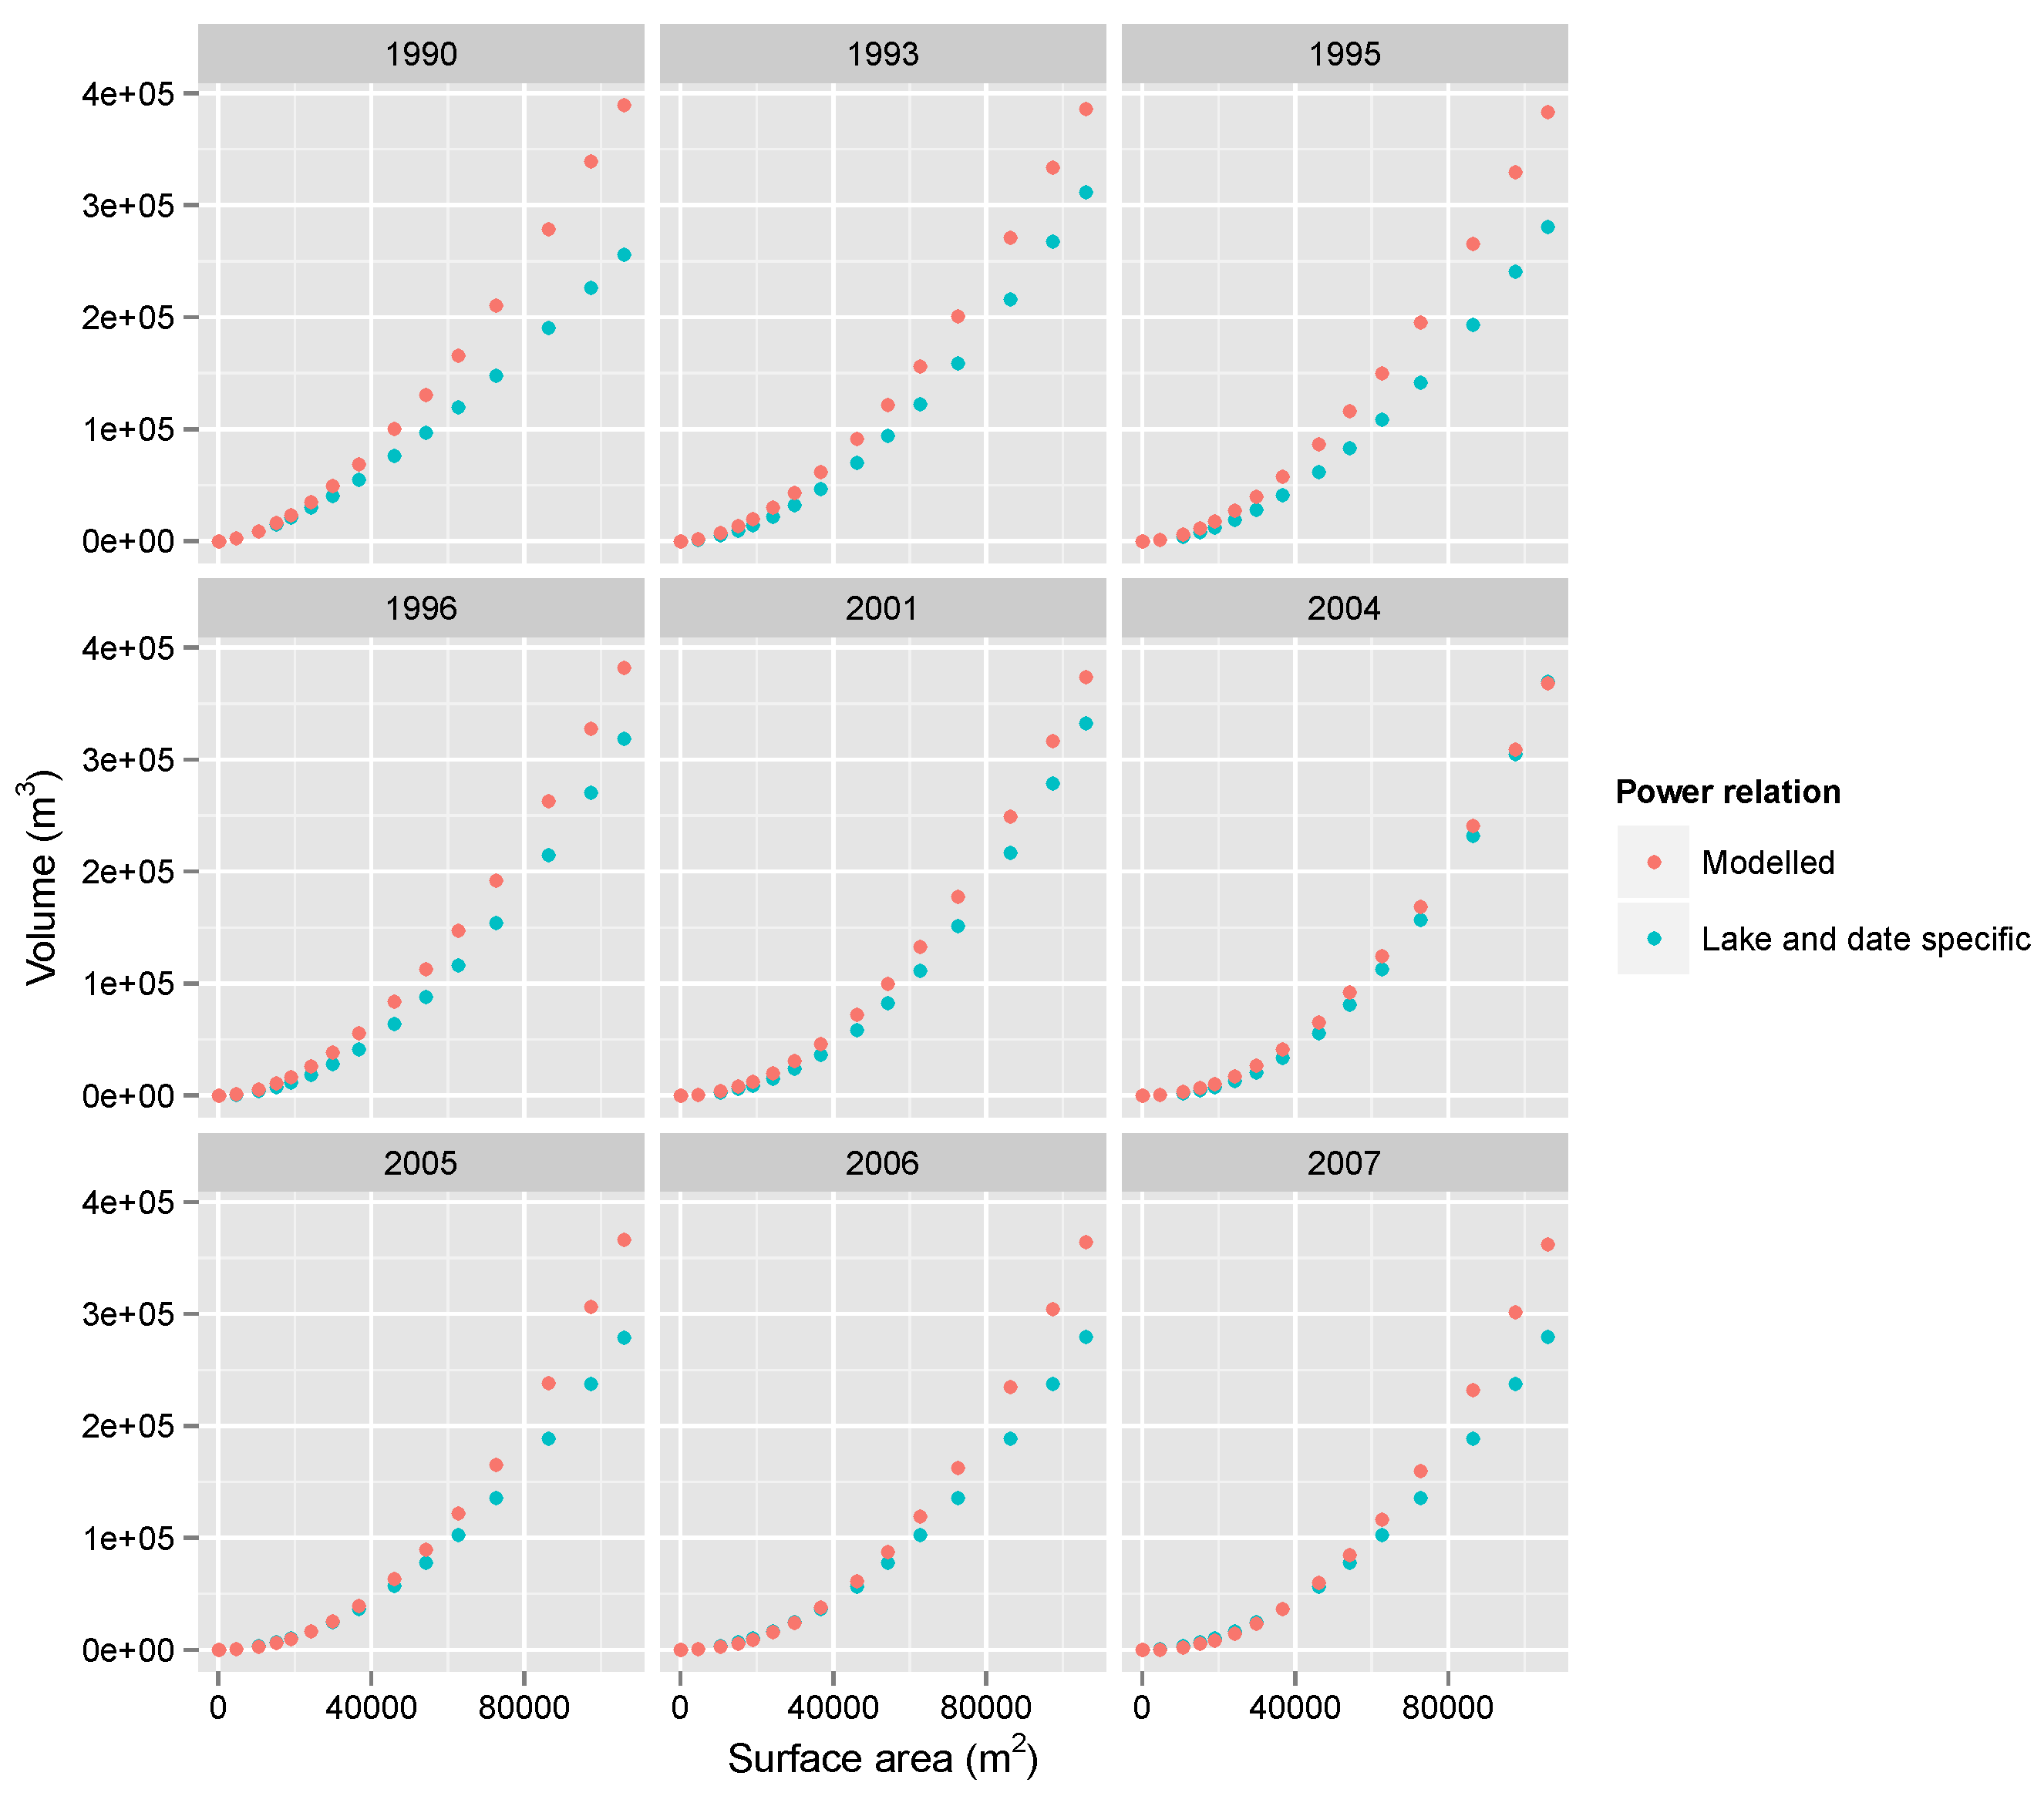
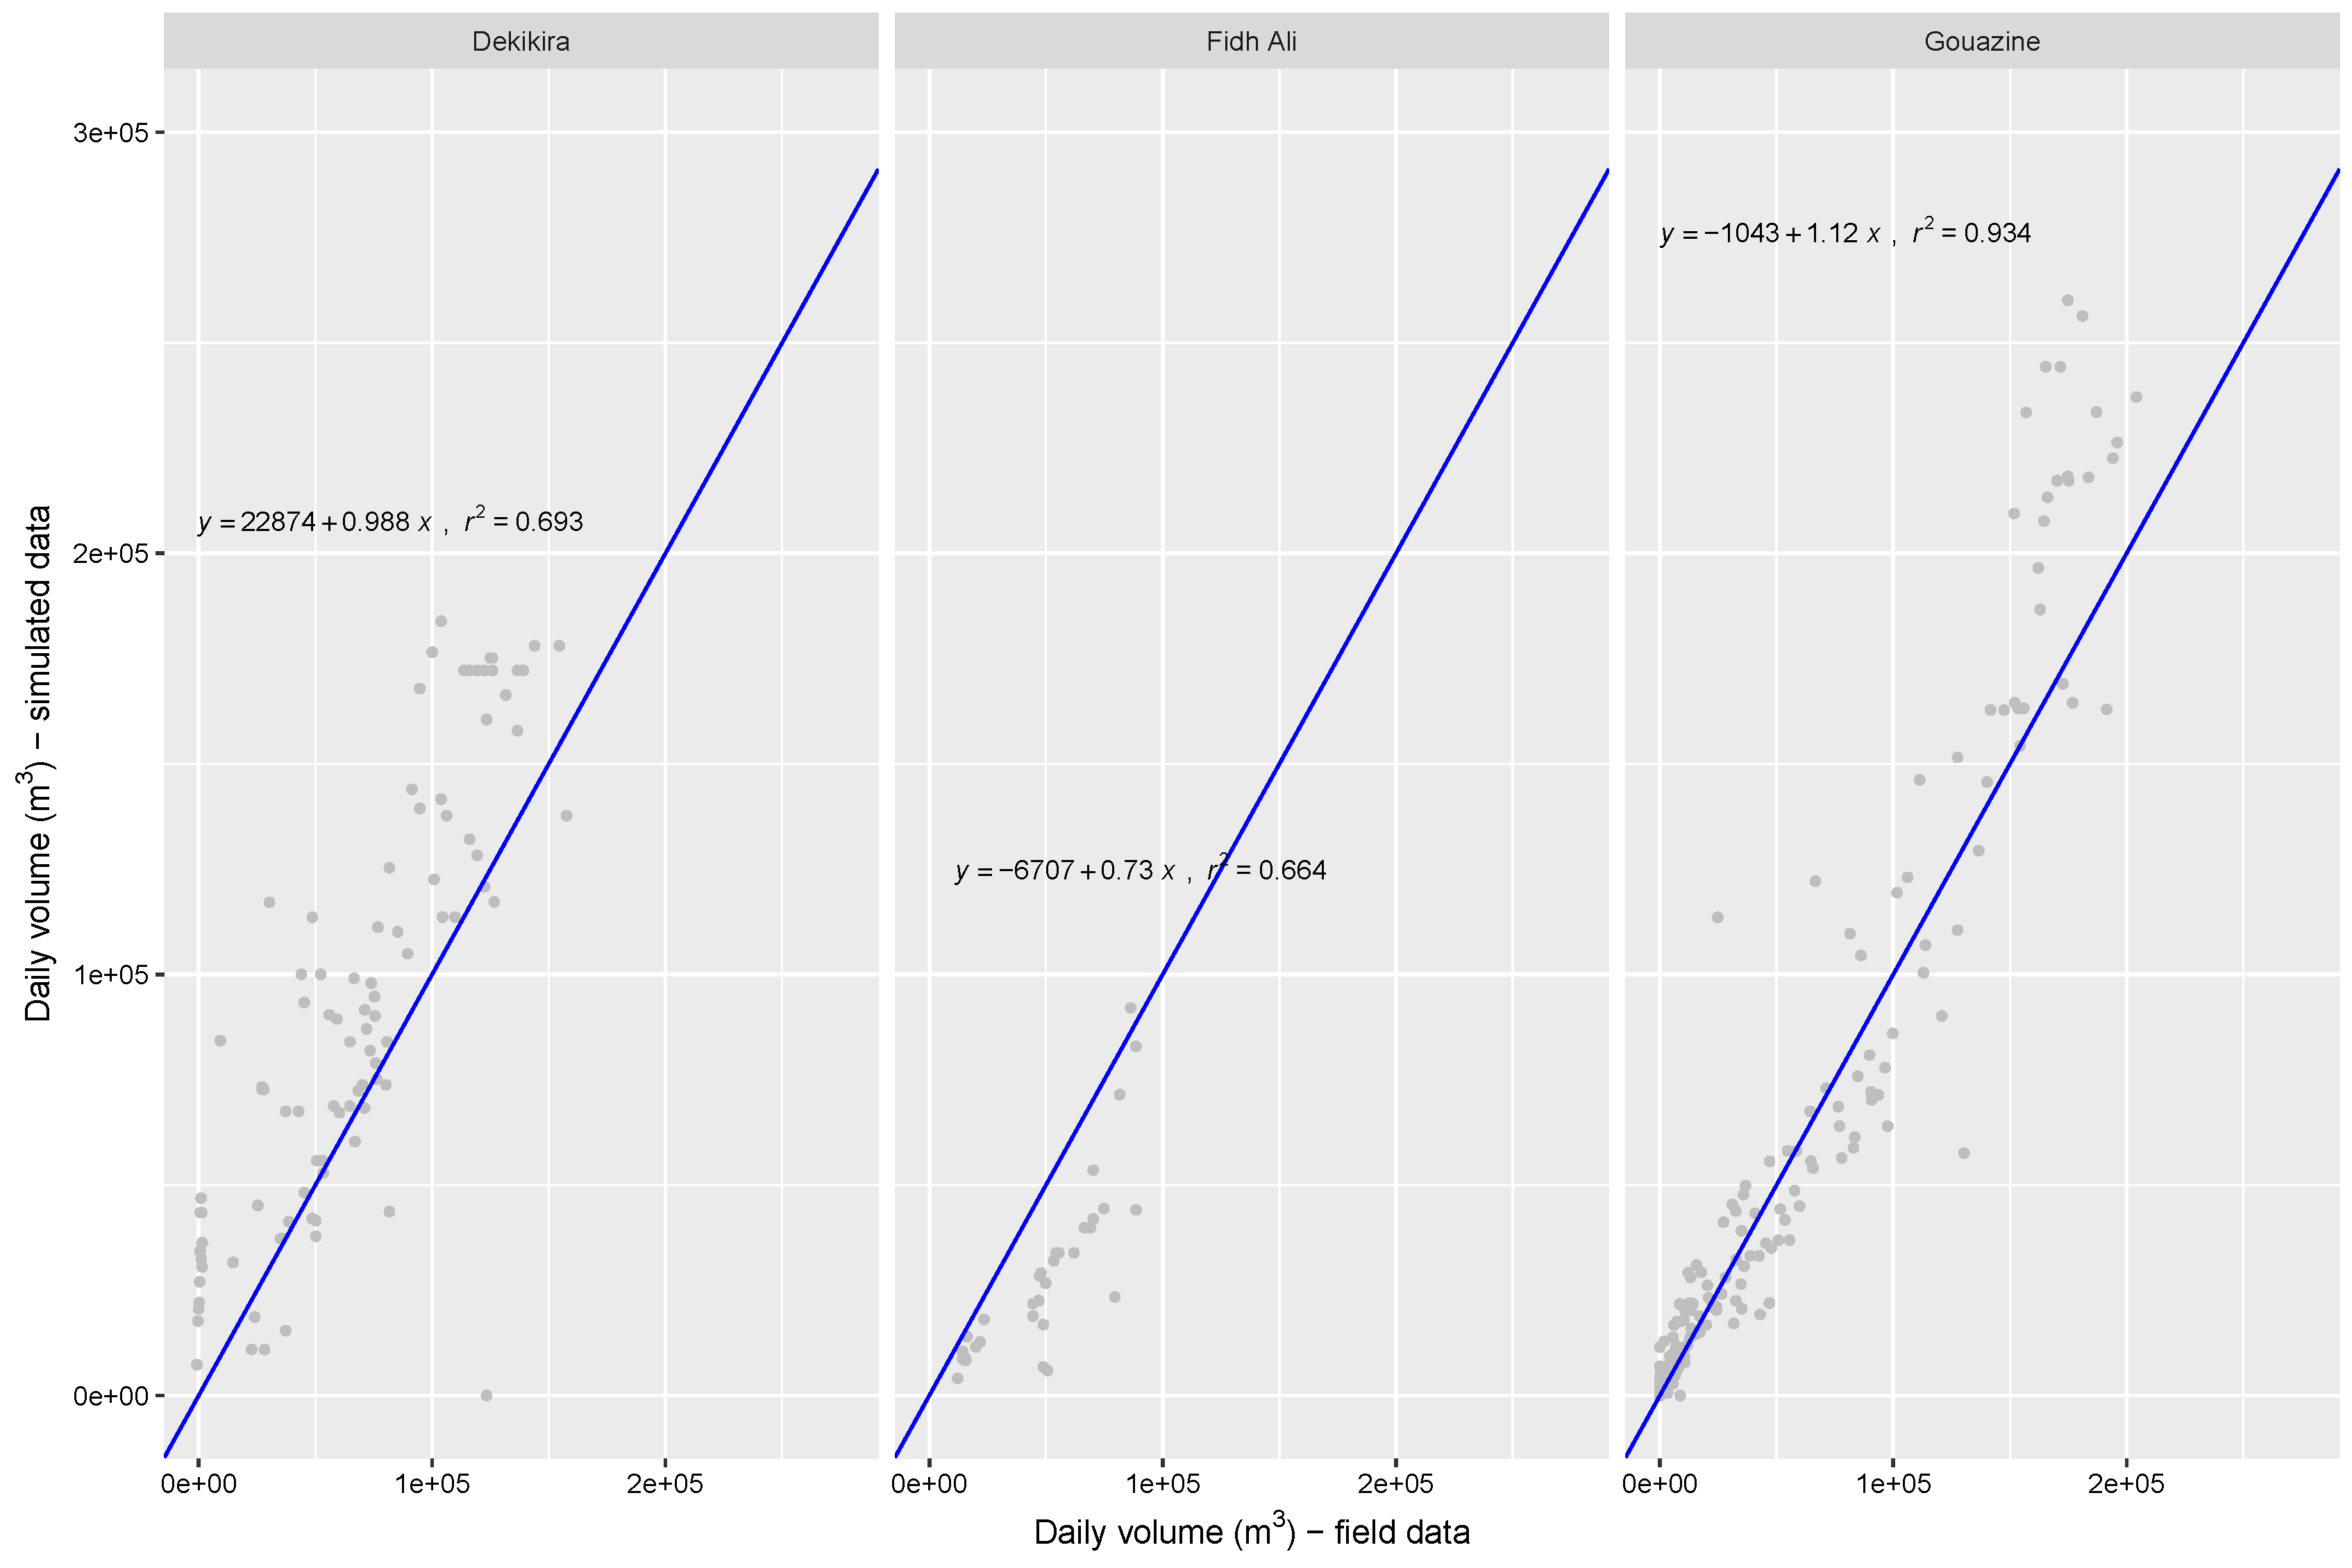
2.6.2. Validating a Common S-V Power Relation

R 2 values for the interSR relation were high (0.97), in line with values found by previous studies [23,41]. The poor fit of power relations derived for other regions (Table 1) confirms the need for locally-derived relations that reflect the local geomorphology of lakes. Relationships from Limpopo performed remarkably poorly, indicating that lakes there were much shallower than in the Tunisian context, while those for açudes in Brazil showed the greatest similarity with the Tunisian context.
Using a single interSR relation nevertheless introduce errors, as geomorphological differences remain especially between shallow oval-shaped lakes situated in floodplains (e.g., Gouazine) and deeper triangular lakes situated within stream channels (e.g., Morra) of lakes. Tested on 15 reservoirs (including four not used to derive the relationship, Es Senega, Sadine 1, Baouejer and Dekikira, to confirm the relevance of the sample), mean errors over the range of floods experienced by these lakes reached 33%. These varied significantly remaining below 25% on eight out of 15 lakes, but reaching up to 100% on two lakes (Figure 8). The relationship notably performed poorly on small lakes where the slopes were concave (β > 1.5) (Sadine 1, Sadine 2, Fidh Ben Nasseur). Higher β values correspond to lakes with steep banks, where errors in the power relation are greater as minor shifts in surface area or the parameters lead to greater volume errors [23]. No correlation could be identified between β and B parameters and lake characteristics (surface area, volume, mean depth) to further refine the parameter values for each lake, presumably as these do not sufficiently account for the slope of lake banks and other geomorphological differences. Furthermore, using a different relationship for the lakes where β is known to congregate around the lower pole of 1.4–1.7 (Figure 7) and for lakes where β values congregate above 1.7 did not improve performance. Despite significant differences in the ability of a single power relation to model individual lakes’ rating curves, errors remain comparable to those from other methods, such as the Fowler and Nelson relations [41].

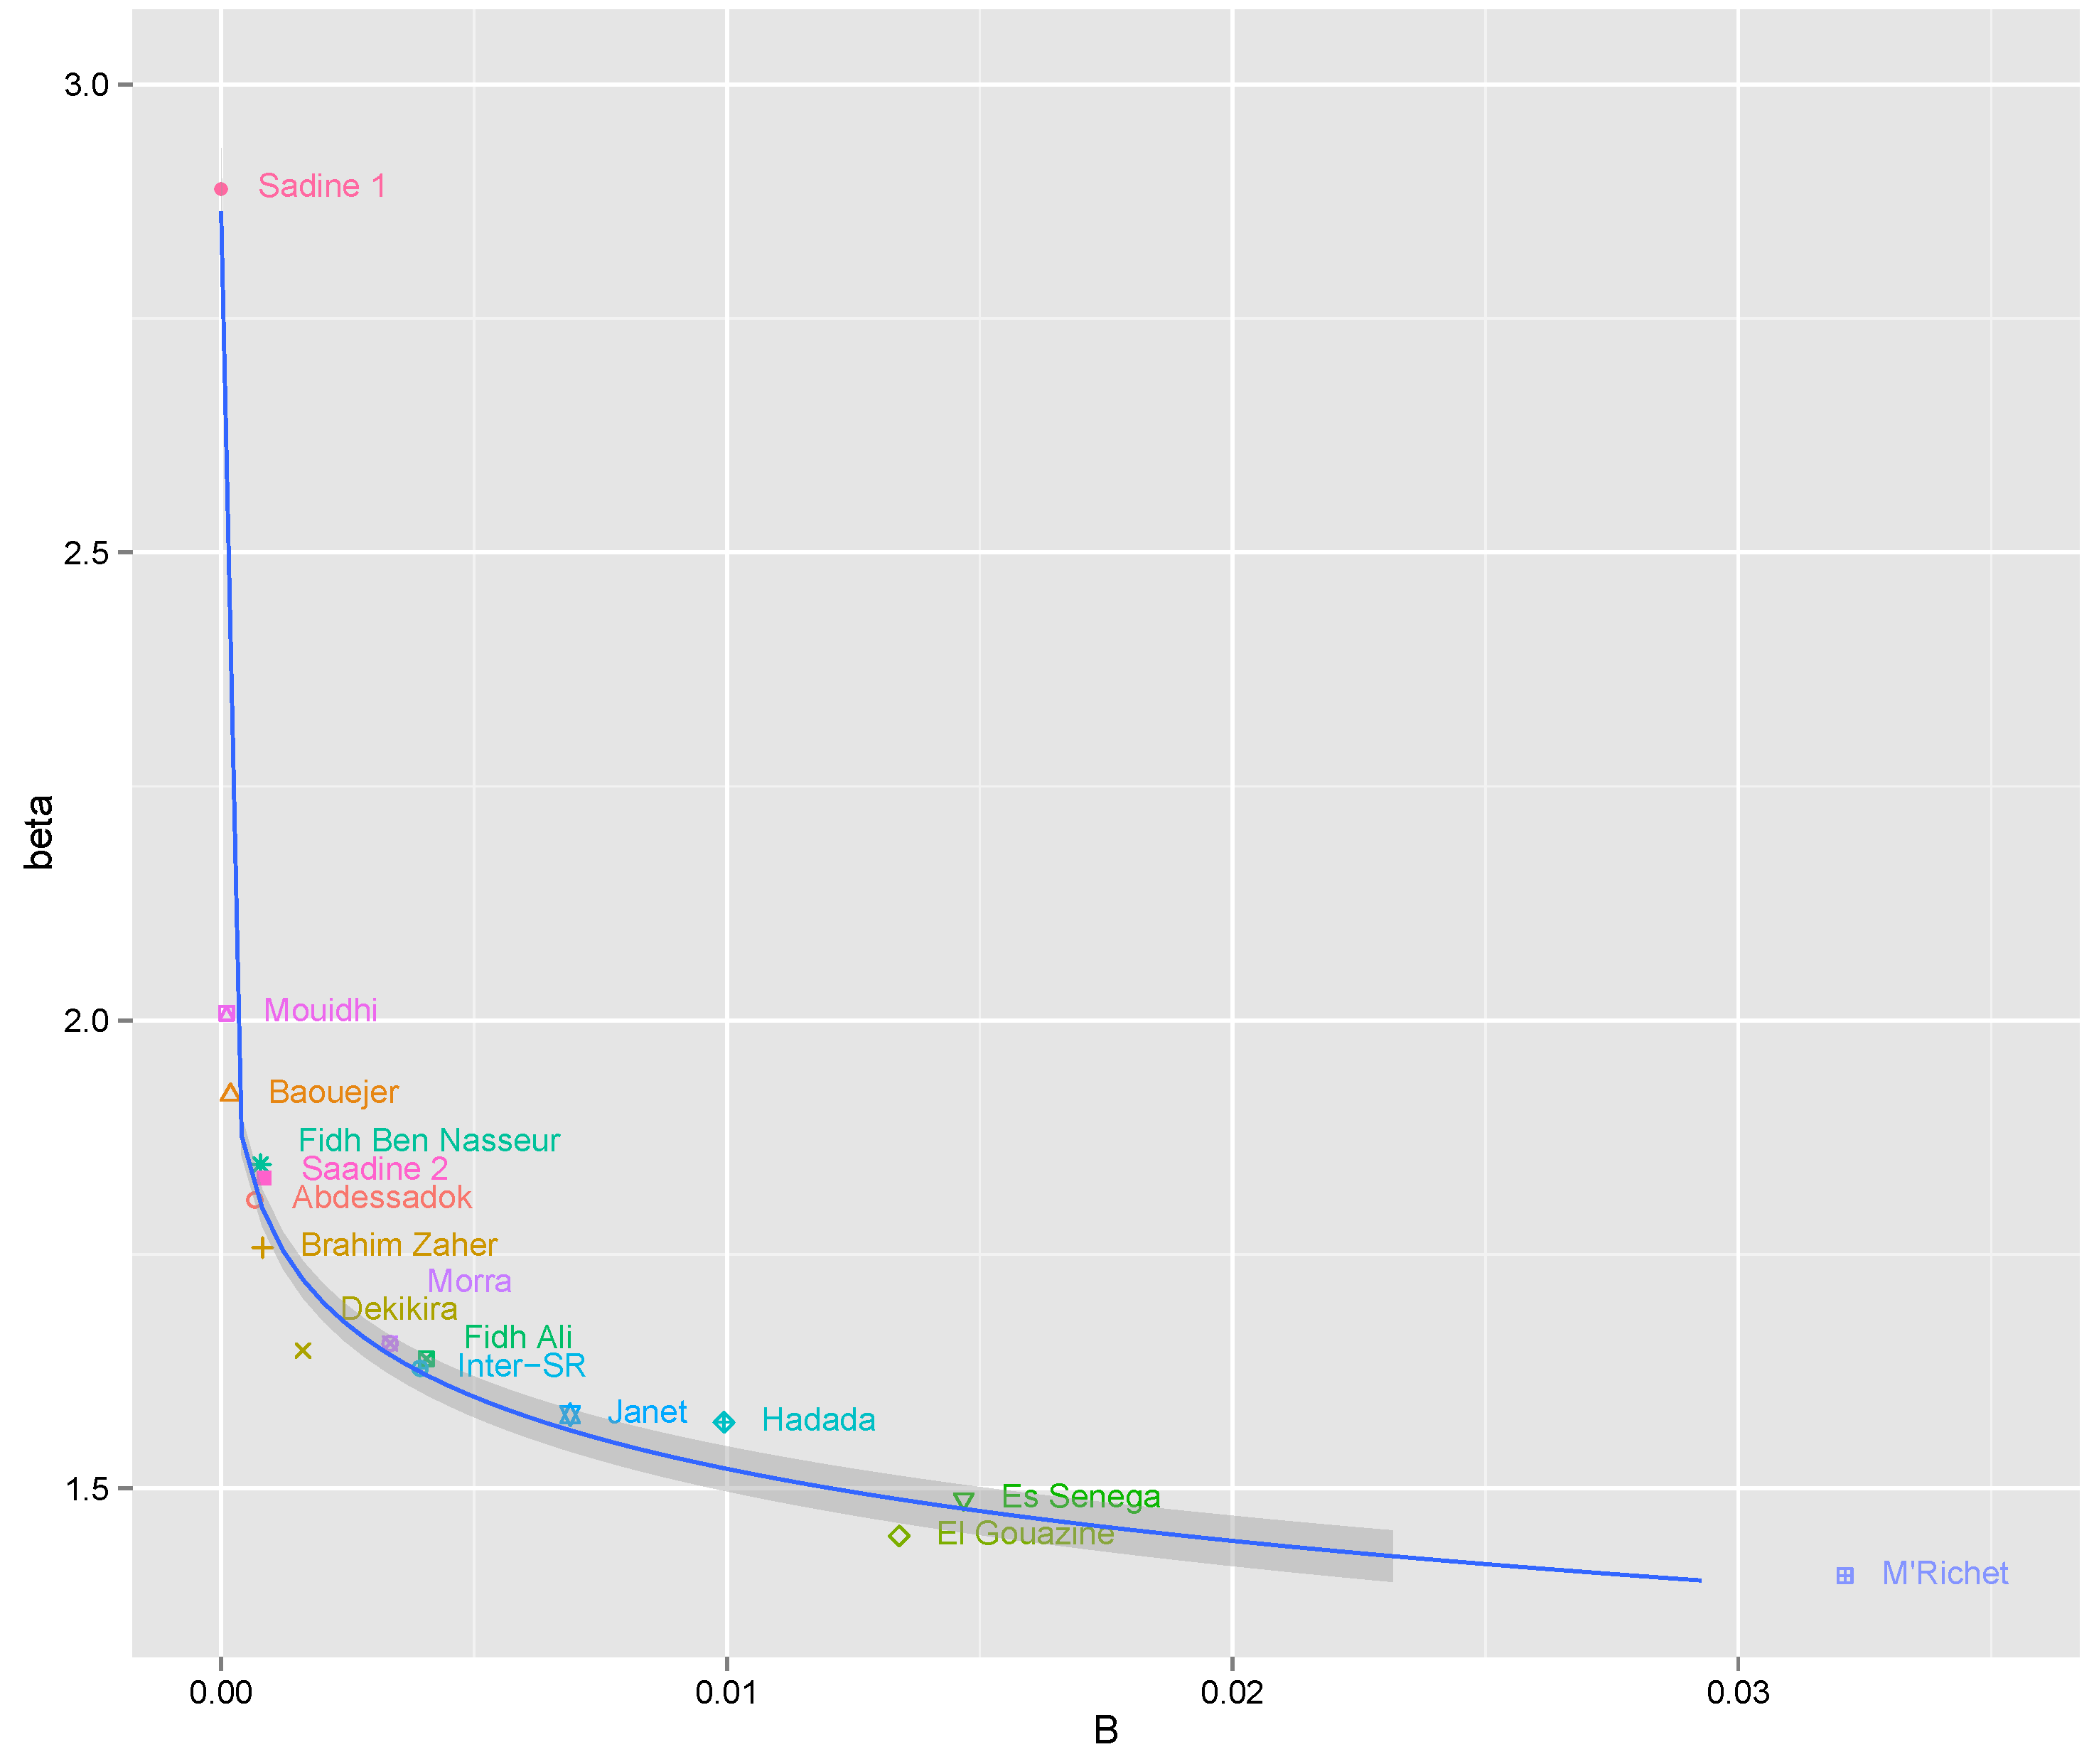
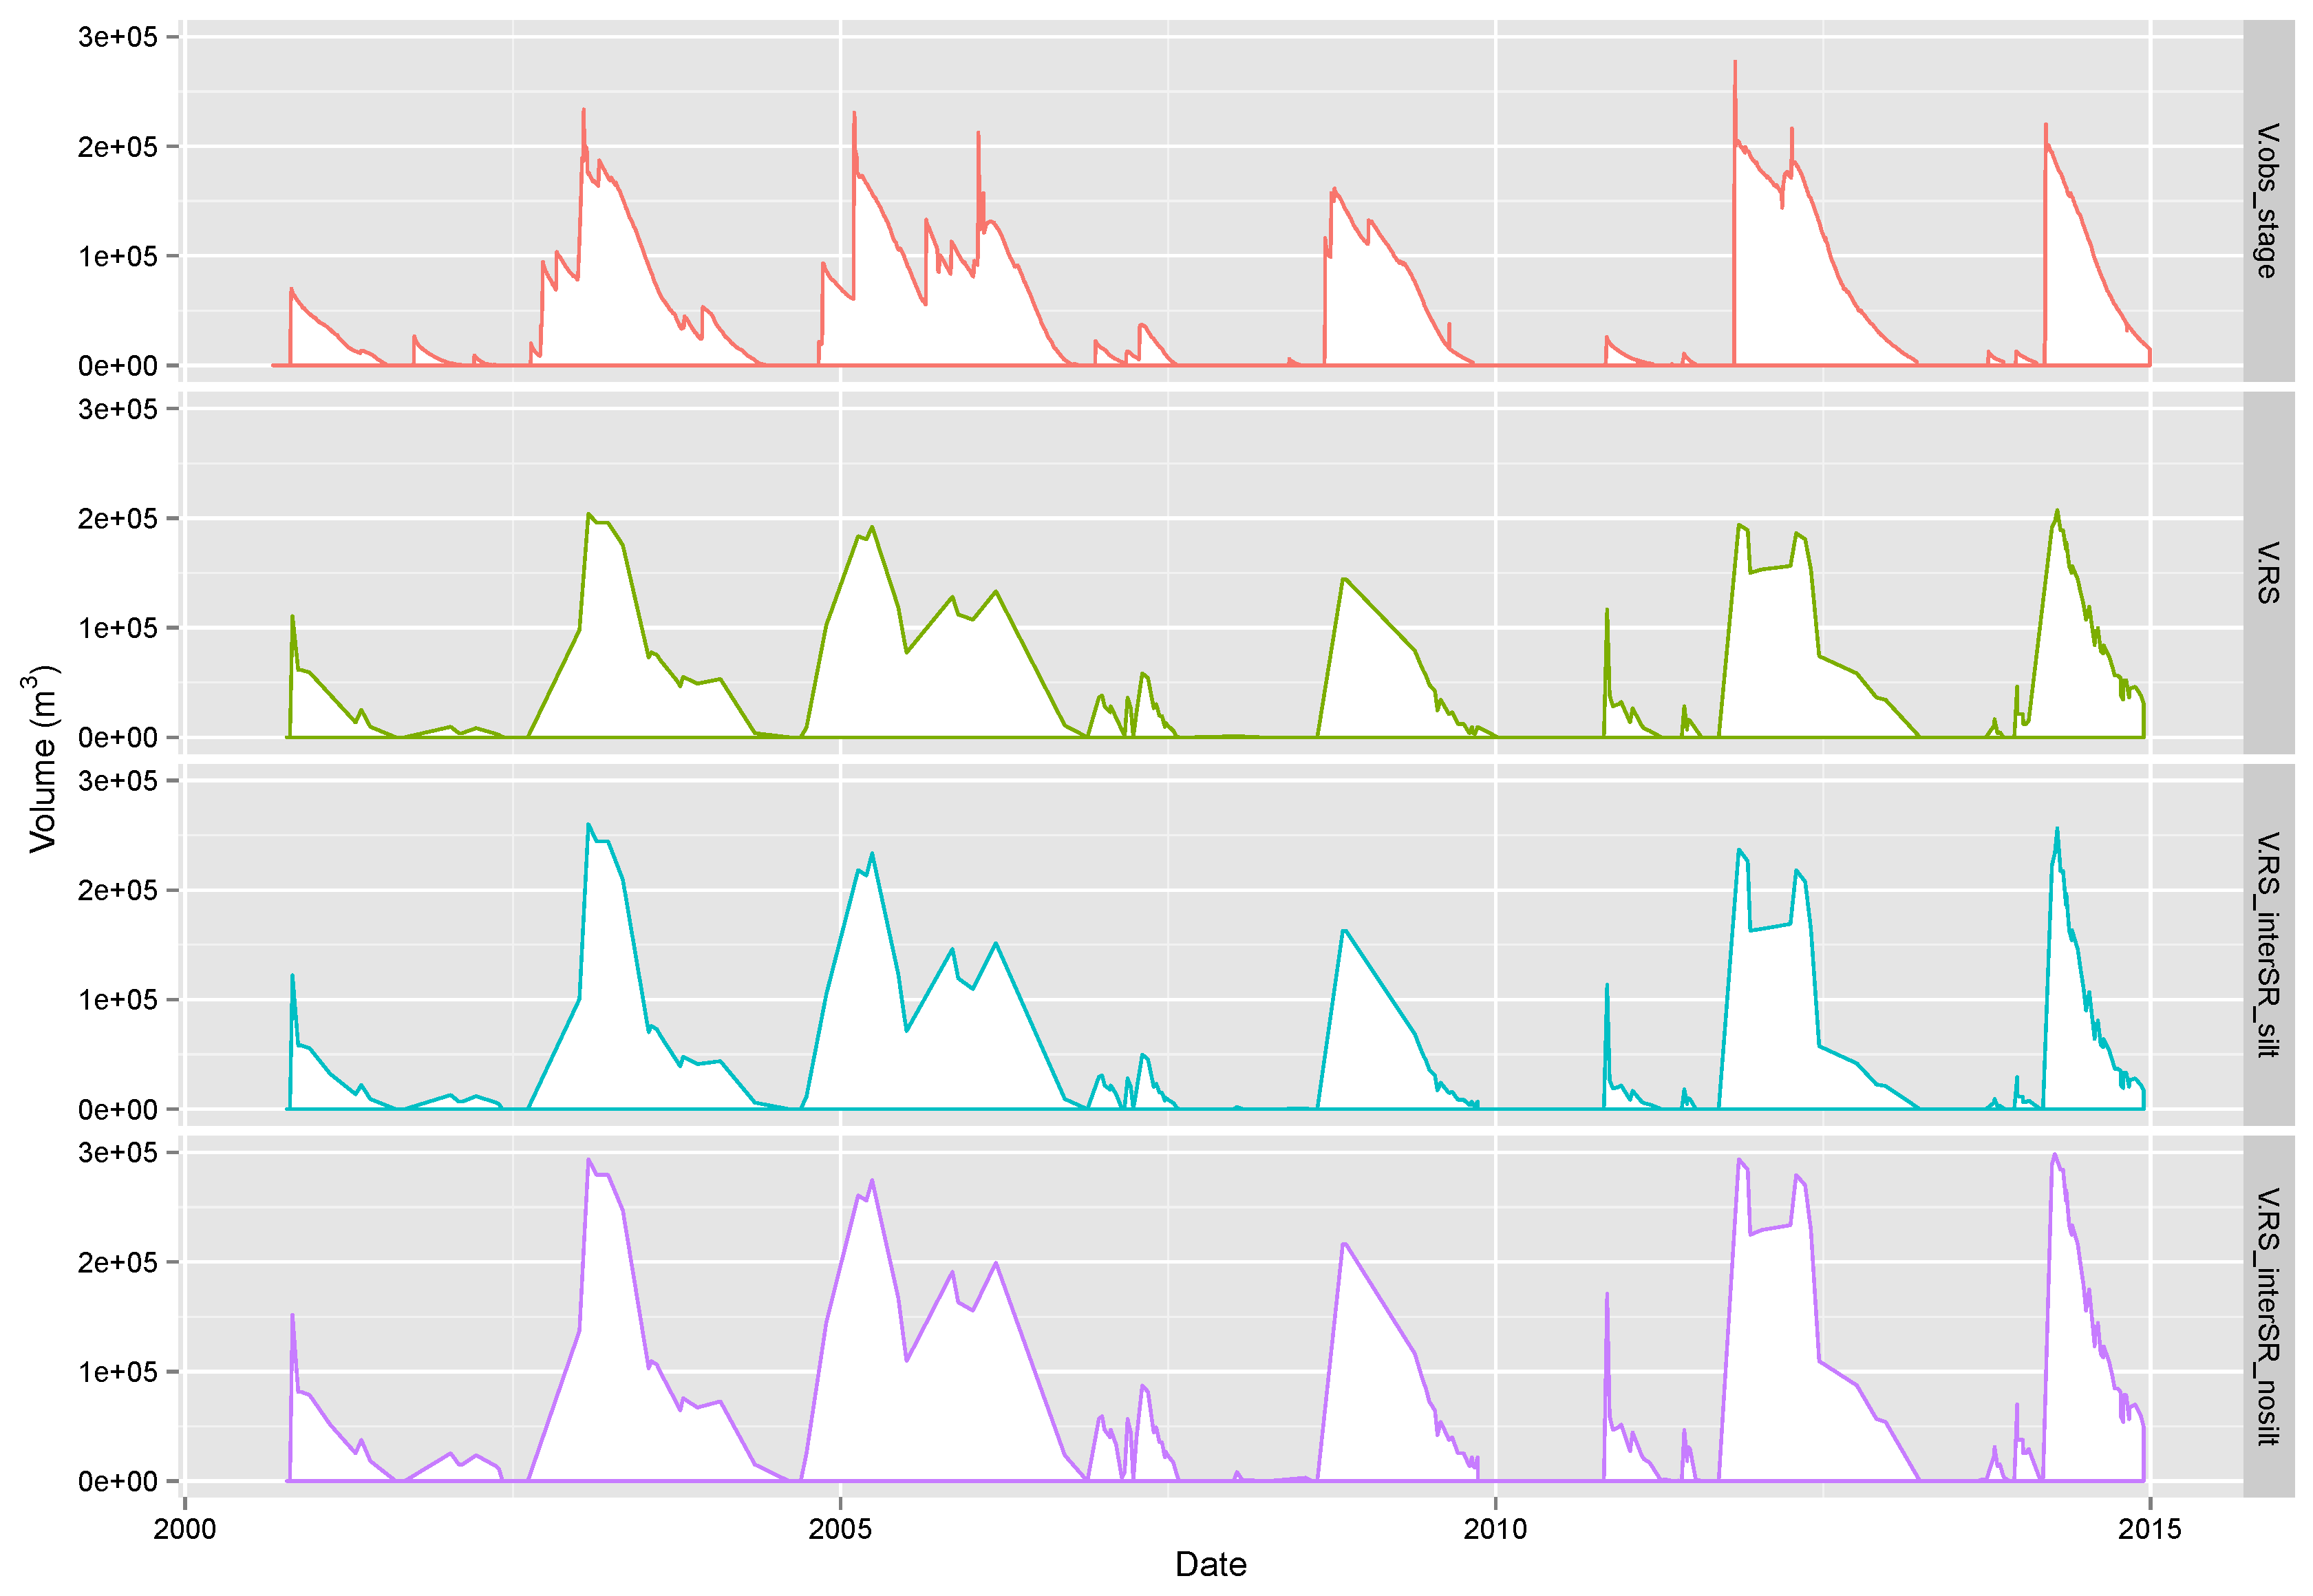
2.7. Accounting for Silting in Power Relations

Intense rains, high runoff combined with degraded and uncovered soils lead to significant erosion in semi-arid and Mediterranean areas. Associated silting reduces the capacity and lifespan of small reservoirs, which must be accounted for when considering drought and water availability assessments. Though the frequency of events and the land use conditions (cropping) during strong rainfall events are determinant, local studies [31,44,45] pointed to the difficulty in identifying and modelling the vulnerability to erosion and rate of silting and decidedly in data-poor ungauged catchments. Erosion is very heterogeneous as a result of localised rainfall events, as well as differences in the local lithology and pedology, catchment size, land cover (cropland, forest, etc.) and efforts to reduce soil erosion notably through contour benches. The influence of water and soil conservation works is also not constant, as these are shown to degrade with breaches potentially increasing erosion processes [46], while farmland abandon and forest expansion as seen in other Mediterranean areas can also in time modify erosion patterns and their amplitude [47]. Based on successive surveying of lakes, studies showed that specific erosion rates varied from 1.8 to 24.2 t/ha/year [30,31] on Gouazine and Fidh Ali respectively over the 1990–1999 period, as a result of lower crop development, clayey vs. marly soils, greater forest cover and greater contour bench development.
Considering the impossibility of multiple surveys over time across all lakes within a catchment, the interSR power relation rating curve was here adapted for silting through a progressive shift in the parameters [10,42]. Based on analysis of the β and B parameters for 70 S-V power relations on all 15 lakes over the 1990–2007 period (Figure 9), β is shown to follow a linear trend over time, increasing gradually by 0.03119/year, which is coherent with increased concavity from deposition. Lacombe [10] had also noted the particularity of Mouidhi and Sadine, whose rapid silting and small size are understood to lead to these discrepancies. In the absence of a clear trend for B, the mean decline rate in lake capacities ( V m a x ) was used to constrain the value of B. By supposing that the maximum surface area at the spillway does not evolve over time, which is acceptable based on the true rating curves, B for each lake and year was calculated based on the annual increase of β and an annual reduction of V m a x by 2930 m3/year. Initial V m a x was here known from the inventories and S m a x calculated based on the initial interSR B and β parameters. Albergel et al. [3], based on successive observations between 1988 and 1998 on 19 small dams, showed that the decline in capacity could be modelled through linear regression despite the heterogeneous silting processes.
In practice, silting is not a linear incremental process, but the result of individual discrete events, meaning lakes may fill faster than expected due to a single large event [48] and can reach 8700 m3/year on certain lakes [1,3]. Tested on four small reservoirs, the interSR power relation adapted over 25 years (i.e., 1990–2014) for silting succeeded in containing errors around 50%. After 11 years on Dekikira, the estimated power relation modelled the decline remarkably well with relative errors remaining around 55%. On Gouazine (Figure 10), after 17 years relative errors remained below 80%.

3. Results and Discussion

3.1. Method Performance on Ungauged Lakes

The performance of remote sensing in assessing droughts within ungauged lakes was investigated against long-term hydrometric data available for three regularly-surveyed small reservoirs. Specifically, the sensitivity of the approach to uncertainties from the interSR and silting models when assessing daily water volumes and mean annual availability was assessed.

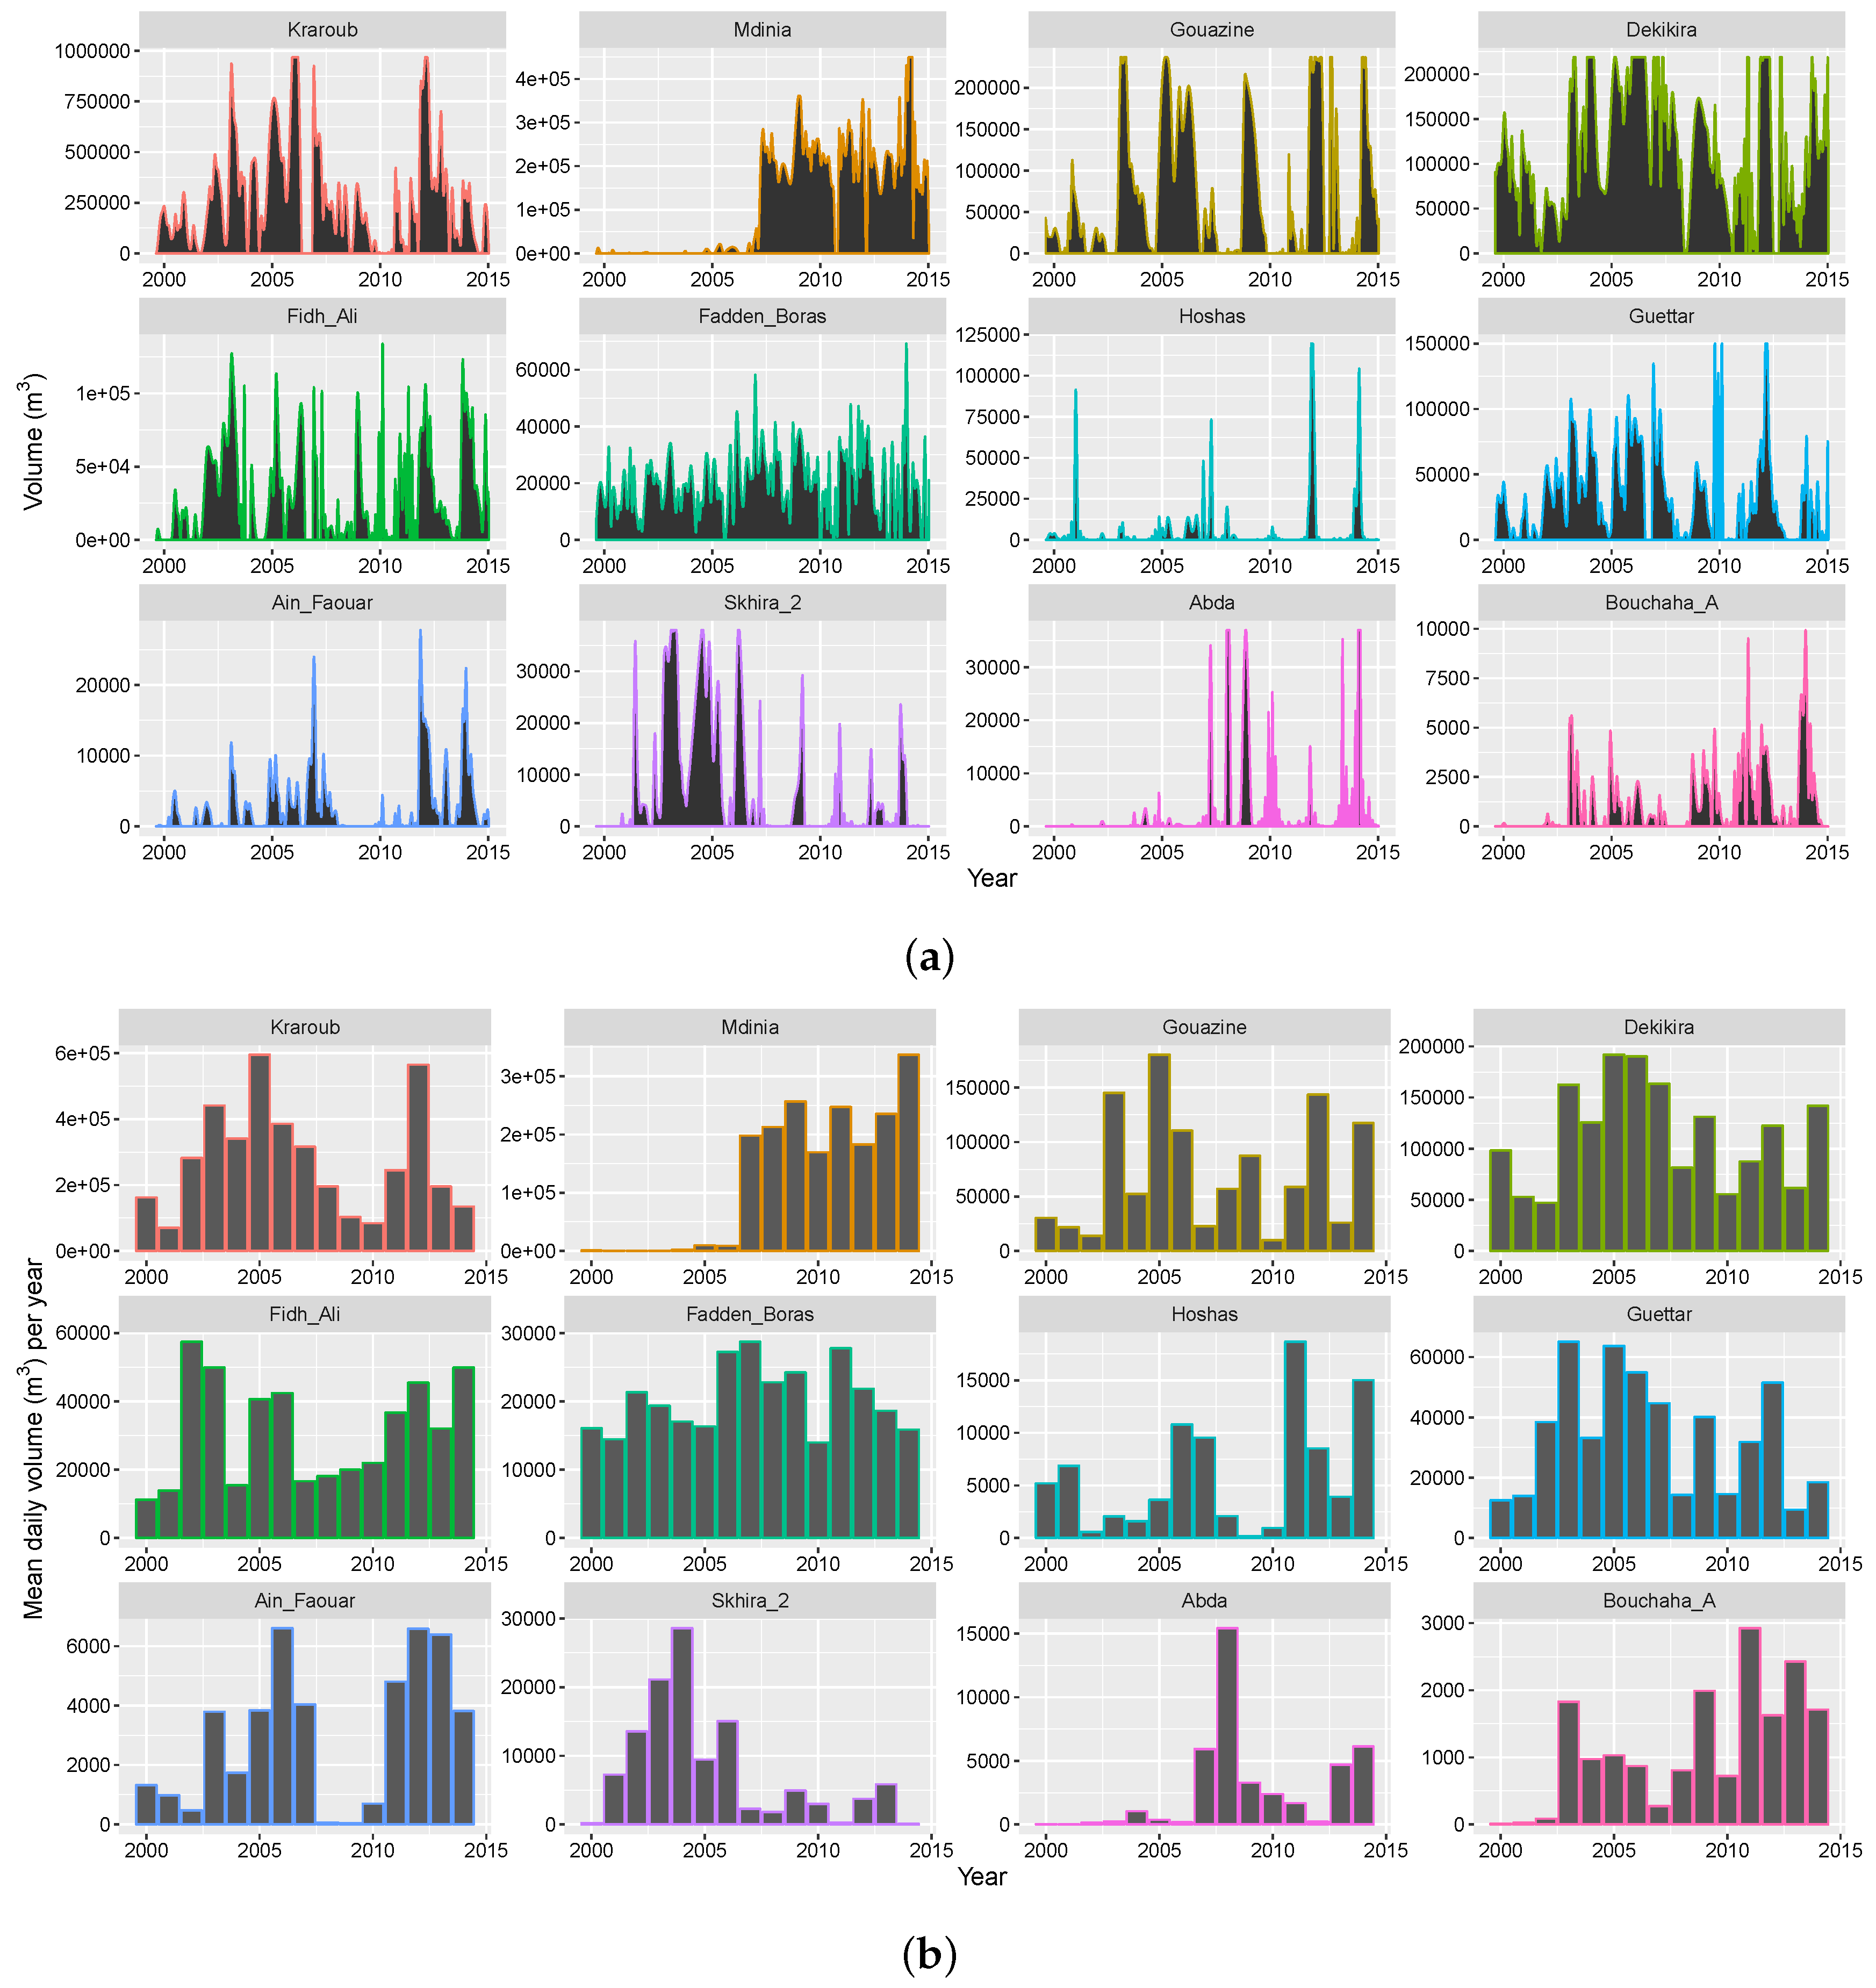
3.1.1. Daily Flood Dynamics and Water Volumes

Figure 11 illustrates the ability of Landsat-derived flooded areas to monitor flood dynamics and droughts on larger lakes (5–10 ha) even in the absence of site-specific S-V. The method provides vital information on the magnitude, frequency and timing of major floods, restituting flood peaks and decline phases, and reaches a skill level of R 2 = 0.93 on Gouazine. The interSR power relation adapted for silting over time leads to a shift in the estimated volumes and an average increase in RMSE on daily values around 50% on all three lakes from 17,800 to 26,400 m3. Mean RMSE errors rose by a further 65% to 45,900 m3 on Gouazine when not accounting for silting, confirming the value and importance of modelling silting over time in this context. Errors were prevalent at the high end of the range, as seen in the S-V relations and Figure 12, which as a result amplified the remote sensing outliers. These residual uncertainties are notably caused by difficulties in detecting cirrus clouds and shadows and can lead to significant overestimations [12].
Smaller reservoirs like Fidh Ali were more affected by residual uncertainties due to the greater proportion per lake of mixed pixels, including flooded vegetation and waters, as well as the proportionally greater error from clouds and their shadows. Furthermore, the absence of frequent observations reduced the performance, leading to irregular flood rises and rapid declines due to rapid infiltration or smaller volumes (50,000 m3), which were not reliably monitored [12]. Figure 12 highlights the somewhat lower skill ( R 2 = 0.66), as well as the systematic underestimation of the volumes on this smaller reservoir, due to the inherent difficulties in modelling the morphology of individual lakes and the heterogeneous silting over time (Figure 10). RMSE errors for ungauged smaller reservoirs rise by 35% to 19,200 m3, which when normalised over the mean volume become significant (NRMSE = 0.4) (Table 2). These results remain however drastically superior to those obtained through conventional hydrological modelling, due largely to the high spatial (and temporal) variability in semi-arid areas, which are poorly captured even in gauged catchments [12].

3.1.2. Quantifying Mean Annual Water Volumes/Availability

To analyse water availability and droughts, the remotely-sensed flood assessments were converted to mean annual volumes. Over all years and three lakes, R 2 reached 0.72 and mean RMSE across the three lakes reduced from 26,400 down to 20,600 m3 compared to daily water volumes (Figure 13 and Table 2), due to outliers being effectively smoothed over time [12]. RMSE values increased on two lakes (by 13% and 36%) compared to using the site-specific S-V, but in one case, even decreased (by 24%), as a result of beneficial uncertainty, as the overestimation from the interSR with the silting model compensated for the remote sensing errors, notably certain floods being undetected or underestimated. The steep rise in RMSE error when not accounting for silting over time (+95% on Gouazine) confirms the suitability and importance of the silt module being included on mean annual assessments.
The influence of remote sensing outliers on mean annual volumes is apparent certain years (Figure 13) and depends on their amplitude, but also the lag between successive observations, which correct the error (i.e., temporal resolution of images). As before, errors remain more significant for small lakes, due to several low periods where overestimation errors from clouds have a proportionally greater influence on the uncertainty. Nevertheless, when accounting for the mean volume of each lake, NRMSE errors from using the interSR adapted for silting over time remained low and below 0.5 in all three lakes (Table 2). The level of accuracy demonstrated here confirms the suitability of the approach to provide tangible information about water availability patterns of small reservoirs, especially when comparing inter-lake and interannual variability of resources.

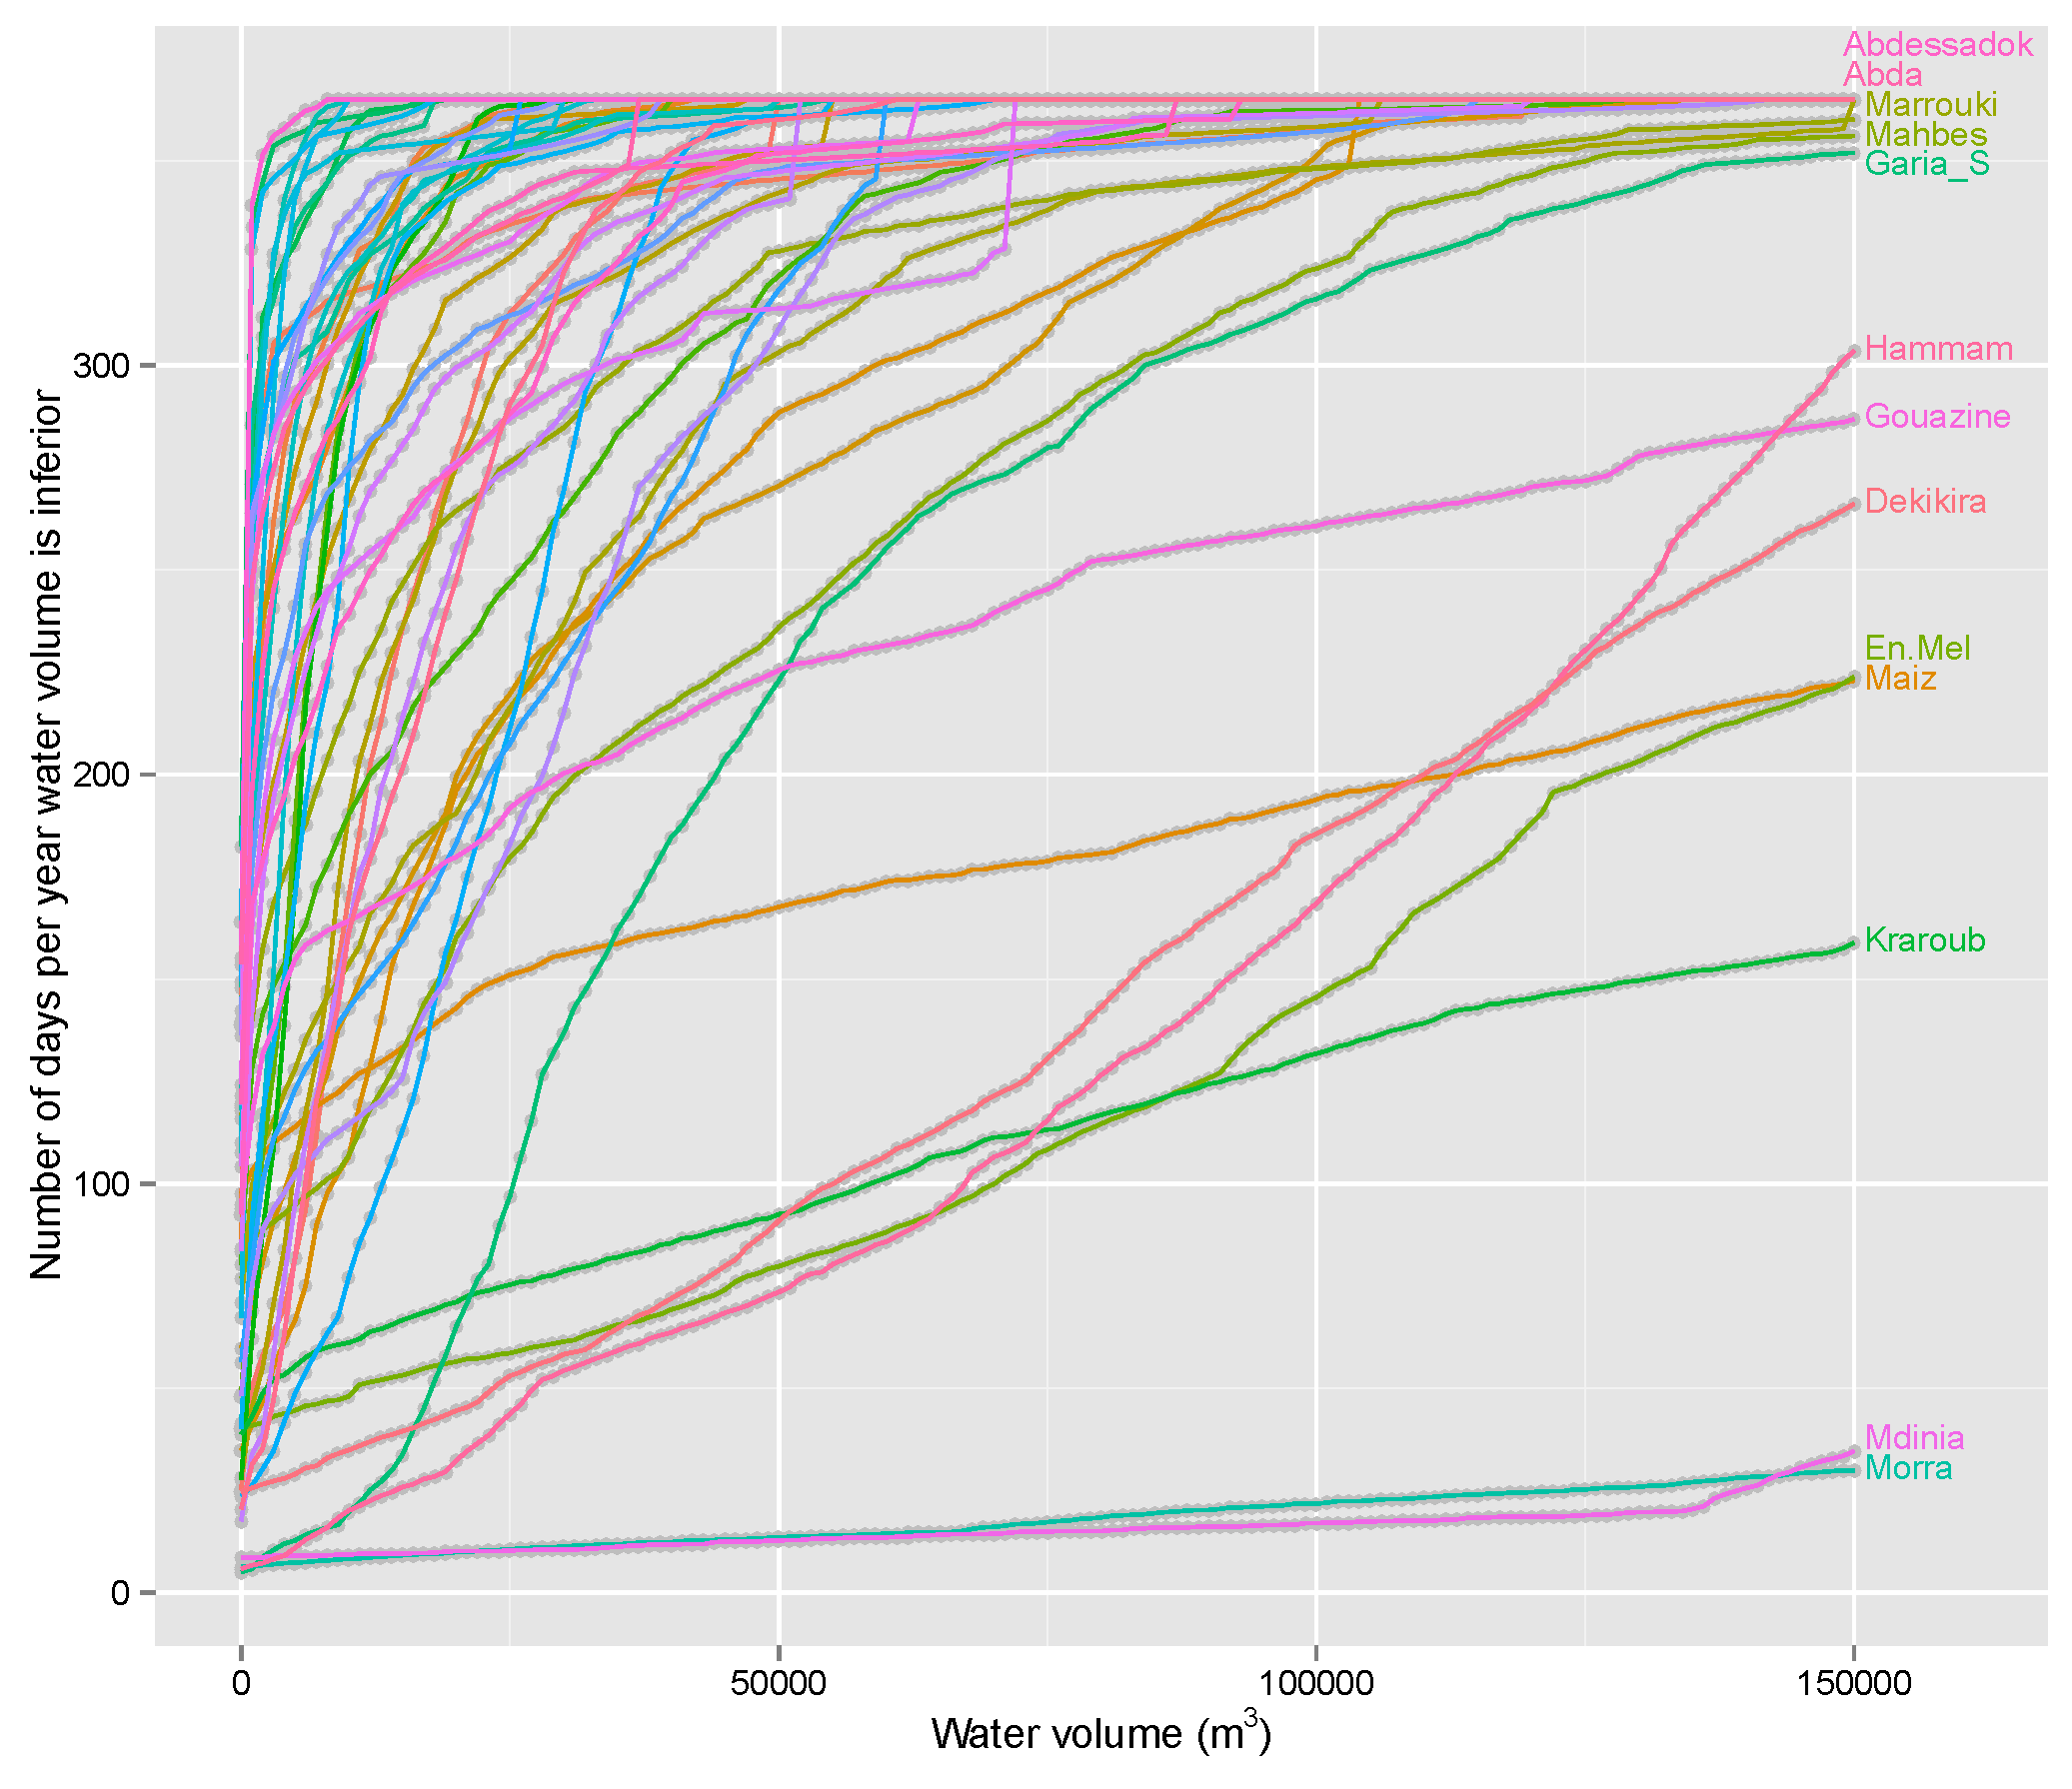
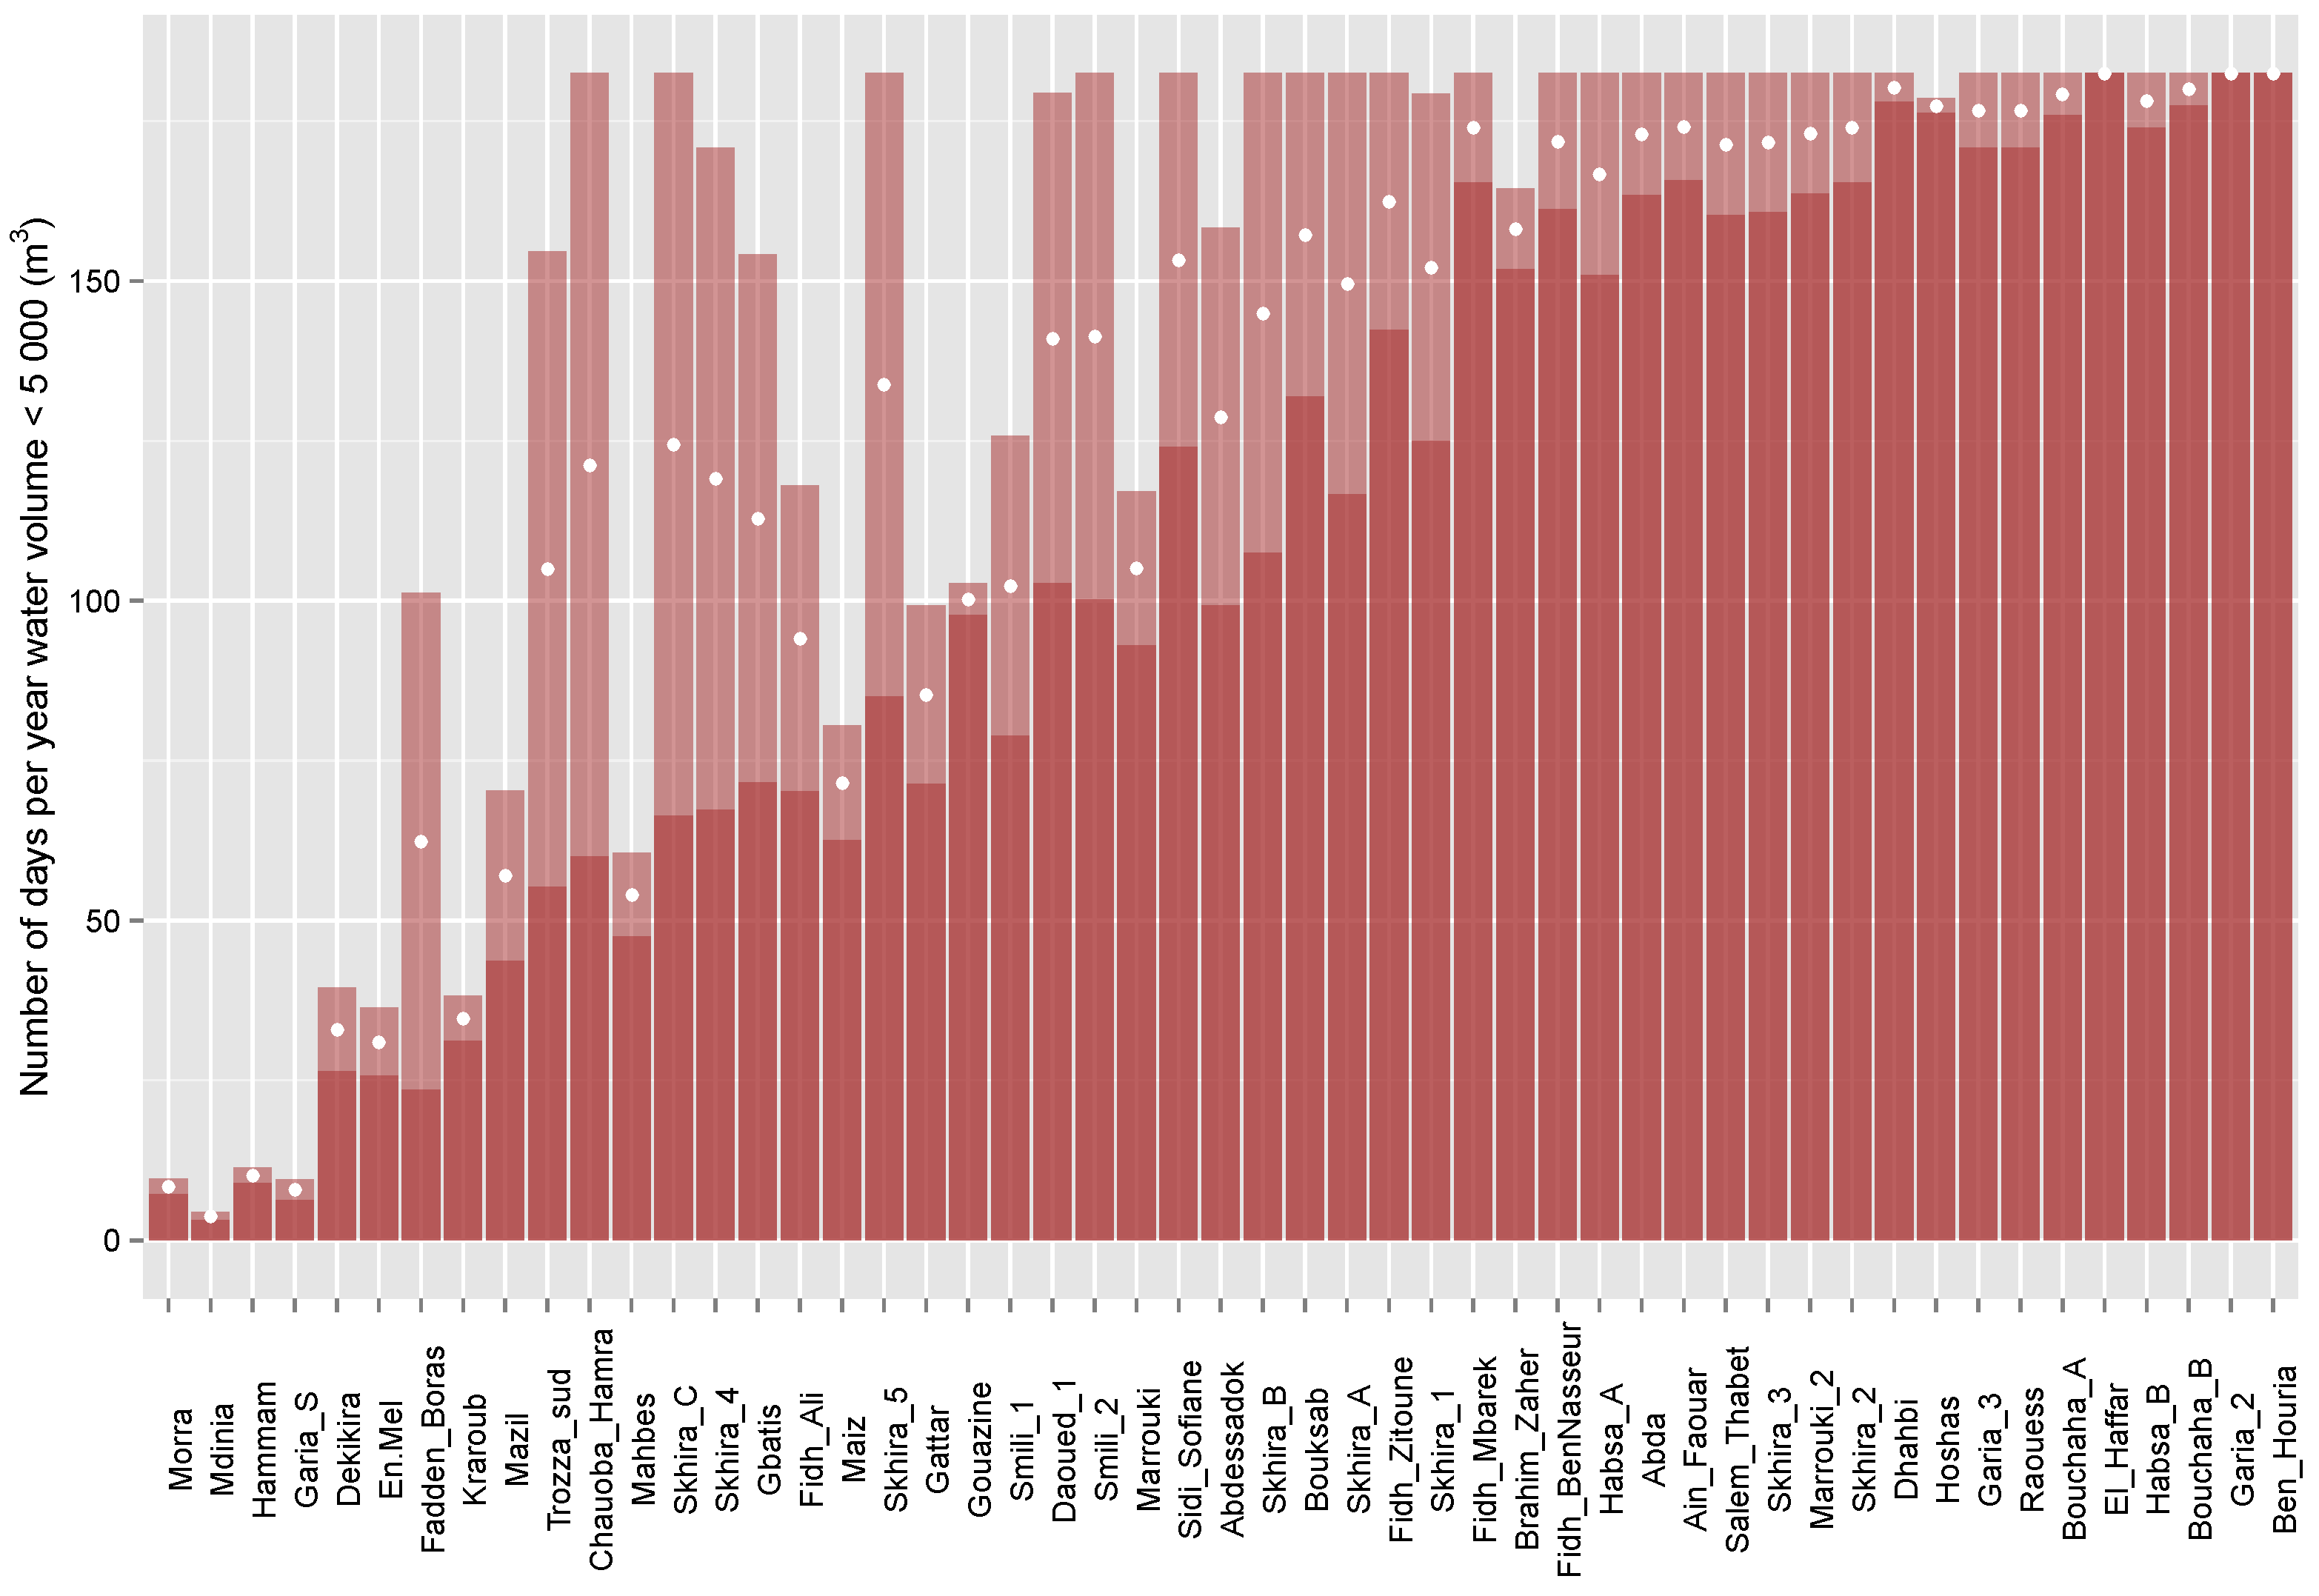
3.1.3. Timing and Duration of Droughts

Remote sensing observations (the 546 treated images) also allowed for accurate estimates of periods when the lake is dry or below a given level, as shown in Figure 14 and applied in Figures 17 and 18. Associated errors remained below 10%, including when using the interSR relation adapted for silting. Clouds only lead to an overestimation of flooded areas, facilitating the assessment of periods without water. The method performed best when using a low volume (>1000 m3) rather than zero due to residual uncertainties and interferences in the remote sensing, which can lead to solitary commission errors. The influence of individual outliers depends on sufficient temporal resolution to rapidly correct remote sensing outliers, but their influence is less detrimental than in volumetric assessments, and the method performed well even on small lakes [12].

3.2. Monitoring and Quantifying Droughts

The original insights provided by applying this approach across 51 reservoirs in a semi-arid catchment are presented here. The hydrological variations observed between years and lakes are discussed to highlight the extent of droughts and accordingly inform stakeholders about the potential of small reservoirs to support agricultural practices.

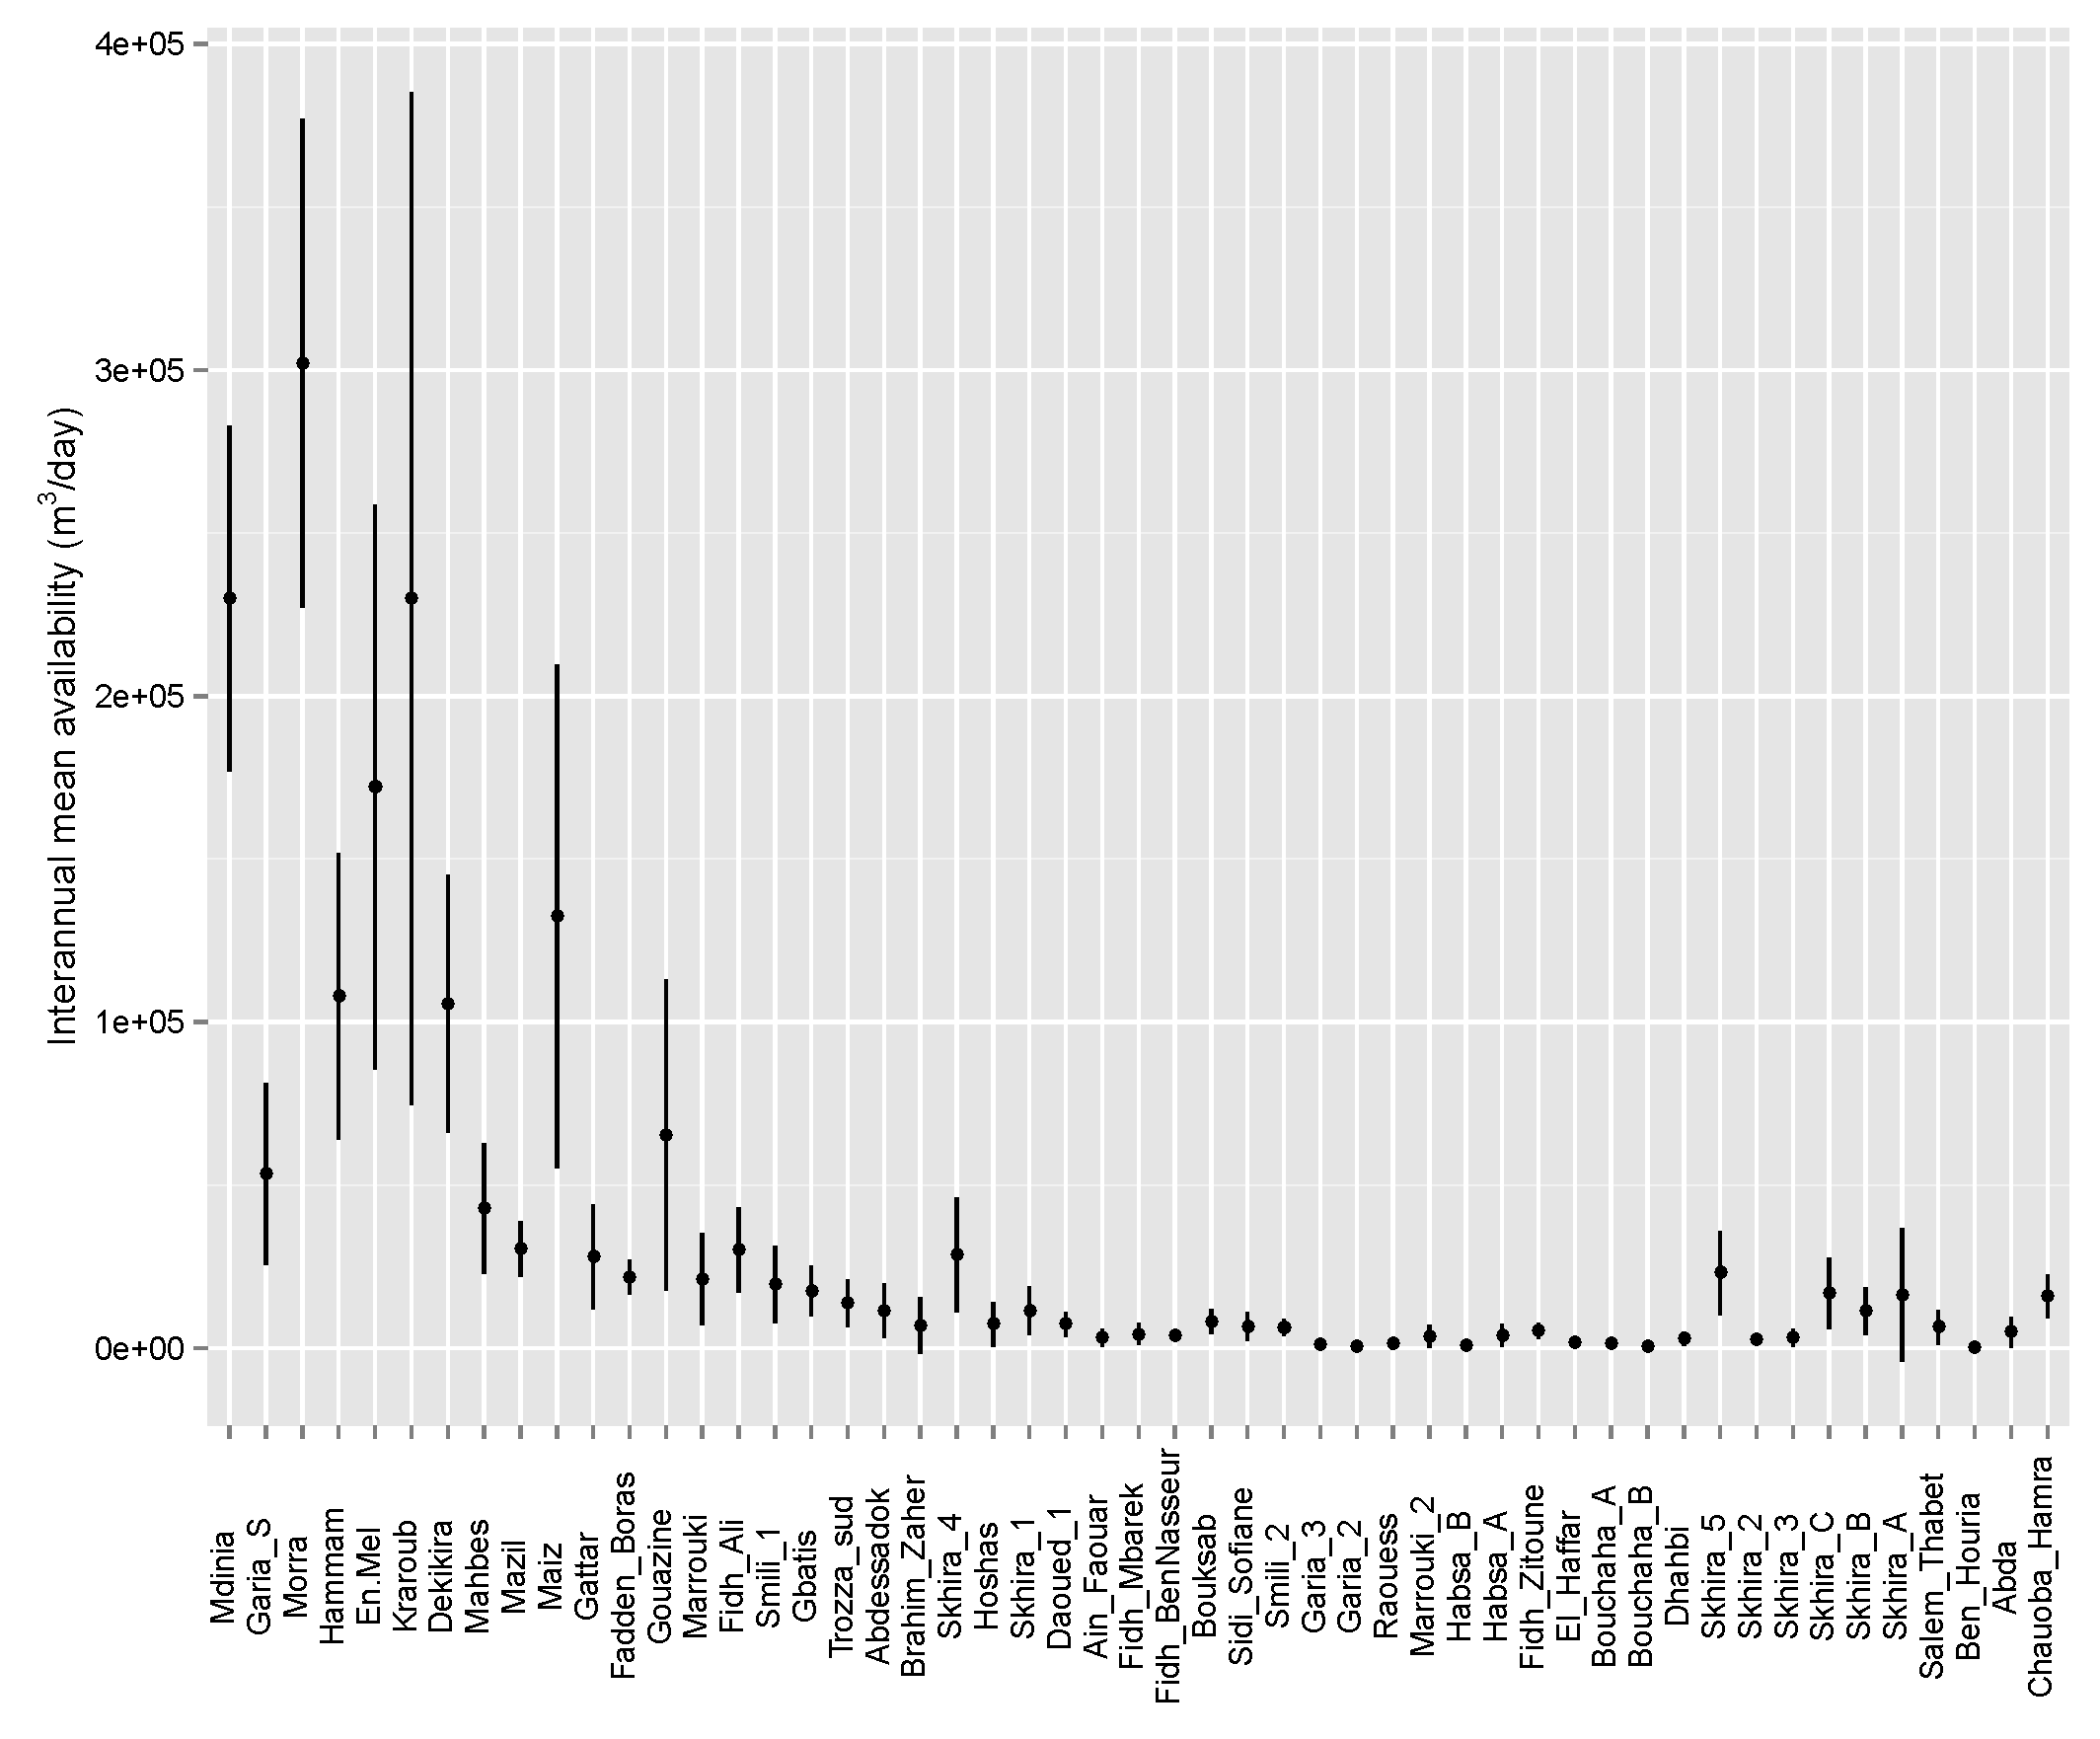
3.2.1. Water Availability Variability across Lakes and Years

Figure 15 illustrates the results of the approach applied across 546 Landsat images and multiple ungauged reservoirs. Reproducing coherent flood dynamics across lakes of all sizes, the method allows rapid identification of reservoirs subject to limited resources and regular droughts. We also note its ability to identify when lakes were commissioned and first flooded (e.g., Mdinia), as confirmed by local records. Interpolated over time and converted to a mean daily volume, observations reveal the vast differences in interannual water availability, which reached over 200,000 m3/day on large lakes, but remained close to zero for many of the small reservoirs over 1999–2014. Across all lakes and years, mean availability reached 36,000 m3.
Interannual variability, expectedly high on small lakes (e.g., Fidh Ali), was also remarkably high on large lakes, such as Kraroub, which enjoy large floods and where mean daily volumes exceed 150,000 m3 (Figure 16). The variation coefficient reaches 0.76, contrasting with other large lakes, such as Morra and Mdinia, where it remains significantly lower at 0.23. On smaller lakes, mean daily volumes are limited (below 20,000 m3) and naturally more prone to droughts, but exceptions, such as Fadden Boras, were observed. On the smallest lakes, flood amplitudes were extremely limited (10,000 m3), leading to very short floods and lengthy droughts.
These stark differences across all sizes of lakes have a substantial influence on their ability to provide both substantial and consistent water resources. To support irrigation, farmers indeed require a sufficient quantity (volume), at the right time (timing) and for the right length of time (duration). Here, this was addressed by looking at the mean number of days each lake can support farmers with a given water volume during the dry season (April–September) when watering needs are greatest. In this context, a threshold of 5000 m3/month was determined through user interviews, as the minimal requirement to practice intensive irrigated activities, based on watering requirements, technical aspects (i.e., sufficient depth to operate a pump) and methodological requirements (i.e., at least 0.5 ha, i.e., six Landsat pixels, thereby reducing the presence of single outliers [12]). Under this threshold, farmers effectively suffered from drought conditions.
The 546 Landsat observations were therefore used to derive quantitative assessments of the number of days droughts were experienced on all 51 lakes (Figure 17 and Figure 18). Results highlight the vast disparities between reservoirs, with only a handful (eight) capable of providing users with sufficiently reliable access to water (Figure 18 and Figure 19). These include four large lakes (Figure 19) with close to constant water availability during the dry season. Two other large lakes (En Mel and Kraroub), subject to high interannual variability, as already seen in the high standard deviation values (Figure 16), suffer from a greater number of droughts (on average, one month per dry season). Finally, two smaller lakes (Dekikira and Fadden Boras) appear subject to similarly low drought frequencies. These appear able to provide farmers with more reliability than certain larger lakes (e.g., Maiz) for these minimal watering requirements.

3.2.2. Quantifying Drought Frequencies

Drought periods increase rapidly as capacities decline further, and 27 lakes out of 51 suffer from drought over more than 140 days, i.e., are flooded less than 45 days during the six dry months and therefore less than the minimal growth cycle of any standard crop, compromising any potential irrigated dry season cropping.

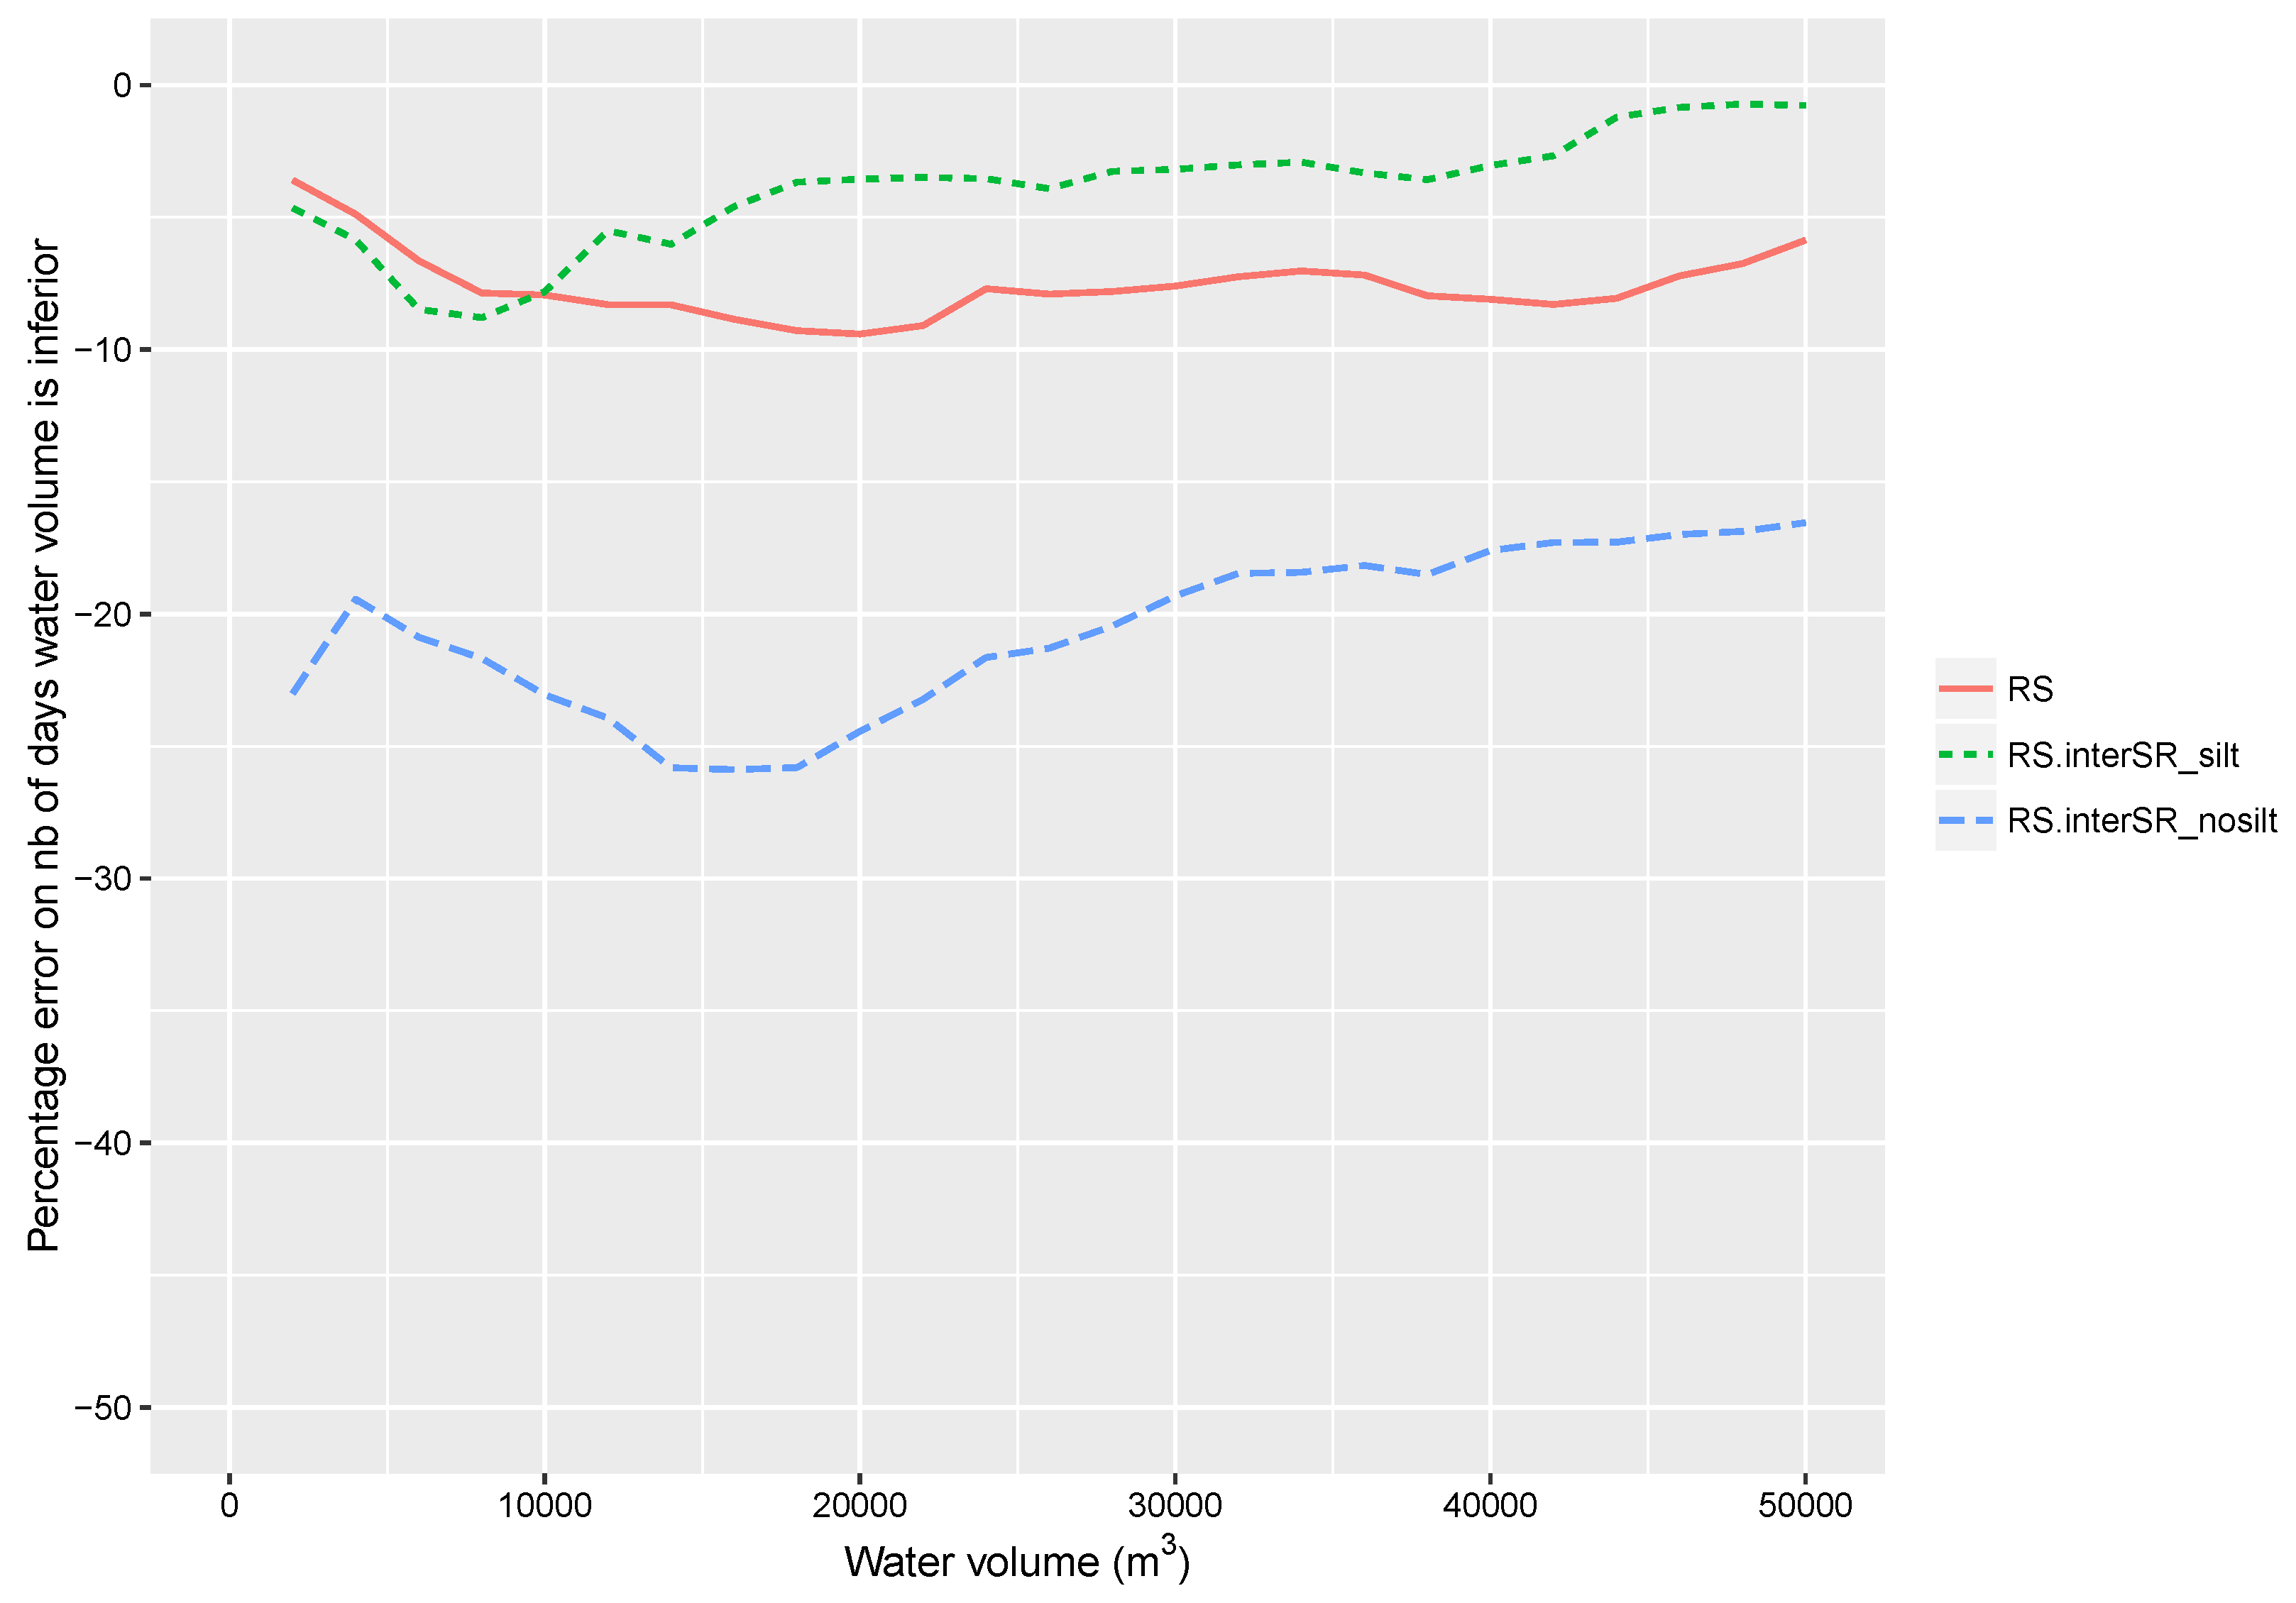
3.2.3. Uncertainties over Silting

Interestingly, on 20 of these lakes, silting is not responsible for the limited water resources, as results based on initial capacities highlight that these continue to provide a low agricultural potential (Figure 18). Results for these lakes are therefore not sensitive to silting uncertainties, pointing to low availability due to catchment and lake characteristics rather than silting. On 13 lakes, we do see a noticeable shift in the results, and this therefore highlights where updated information on the lake’s silting would be most valuable to improve the results. These combine some (though not all) of the oldest lakes and smaller lakes where uncertainties from the aggregated incremental silting over time (sometimes since the late 1960s for Skhira lakes) become most significant.
Landsat flood dynamics observed on these lakes also pointed to their ability to provide insights into the silting of lakes. Increased silting leads to lower depths, meaning the same surface area over time will evaporate or infiltrate faster, which can be observed from the surface area dynamics. Certain lakes with minimal storage are not or are no longer able to maintain resources for a sufficient length of time, and their floods become both minimal in amplitude, but also in duration, up to a stage where they are not even detected. This was clearly observed on four lakes, which field visits confirmed were silted (Ben Houria, Garia 2, Bouchaha B and Raouess). The 13 lakes where silting uncertainties were significant continued to display large and extended flood periods based on Landsat surface assessments, confirming that despite the age of some of these lakes, their silting level merits further investigation.

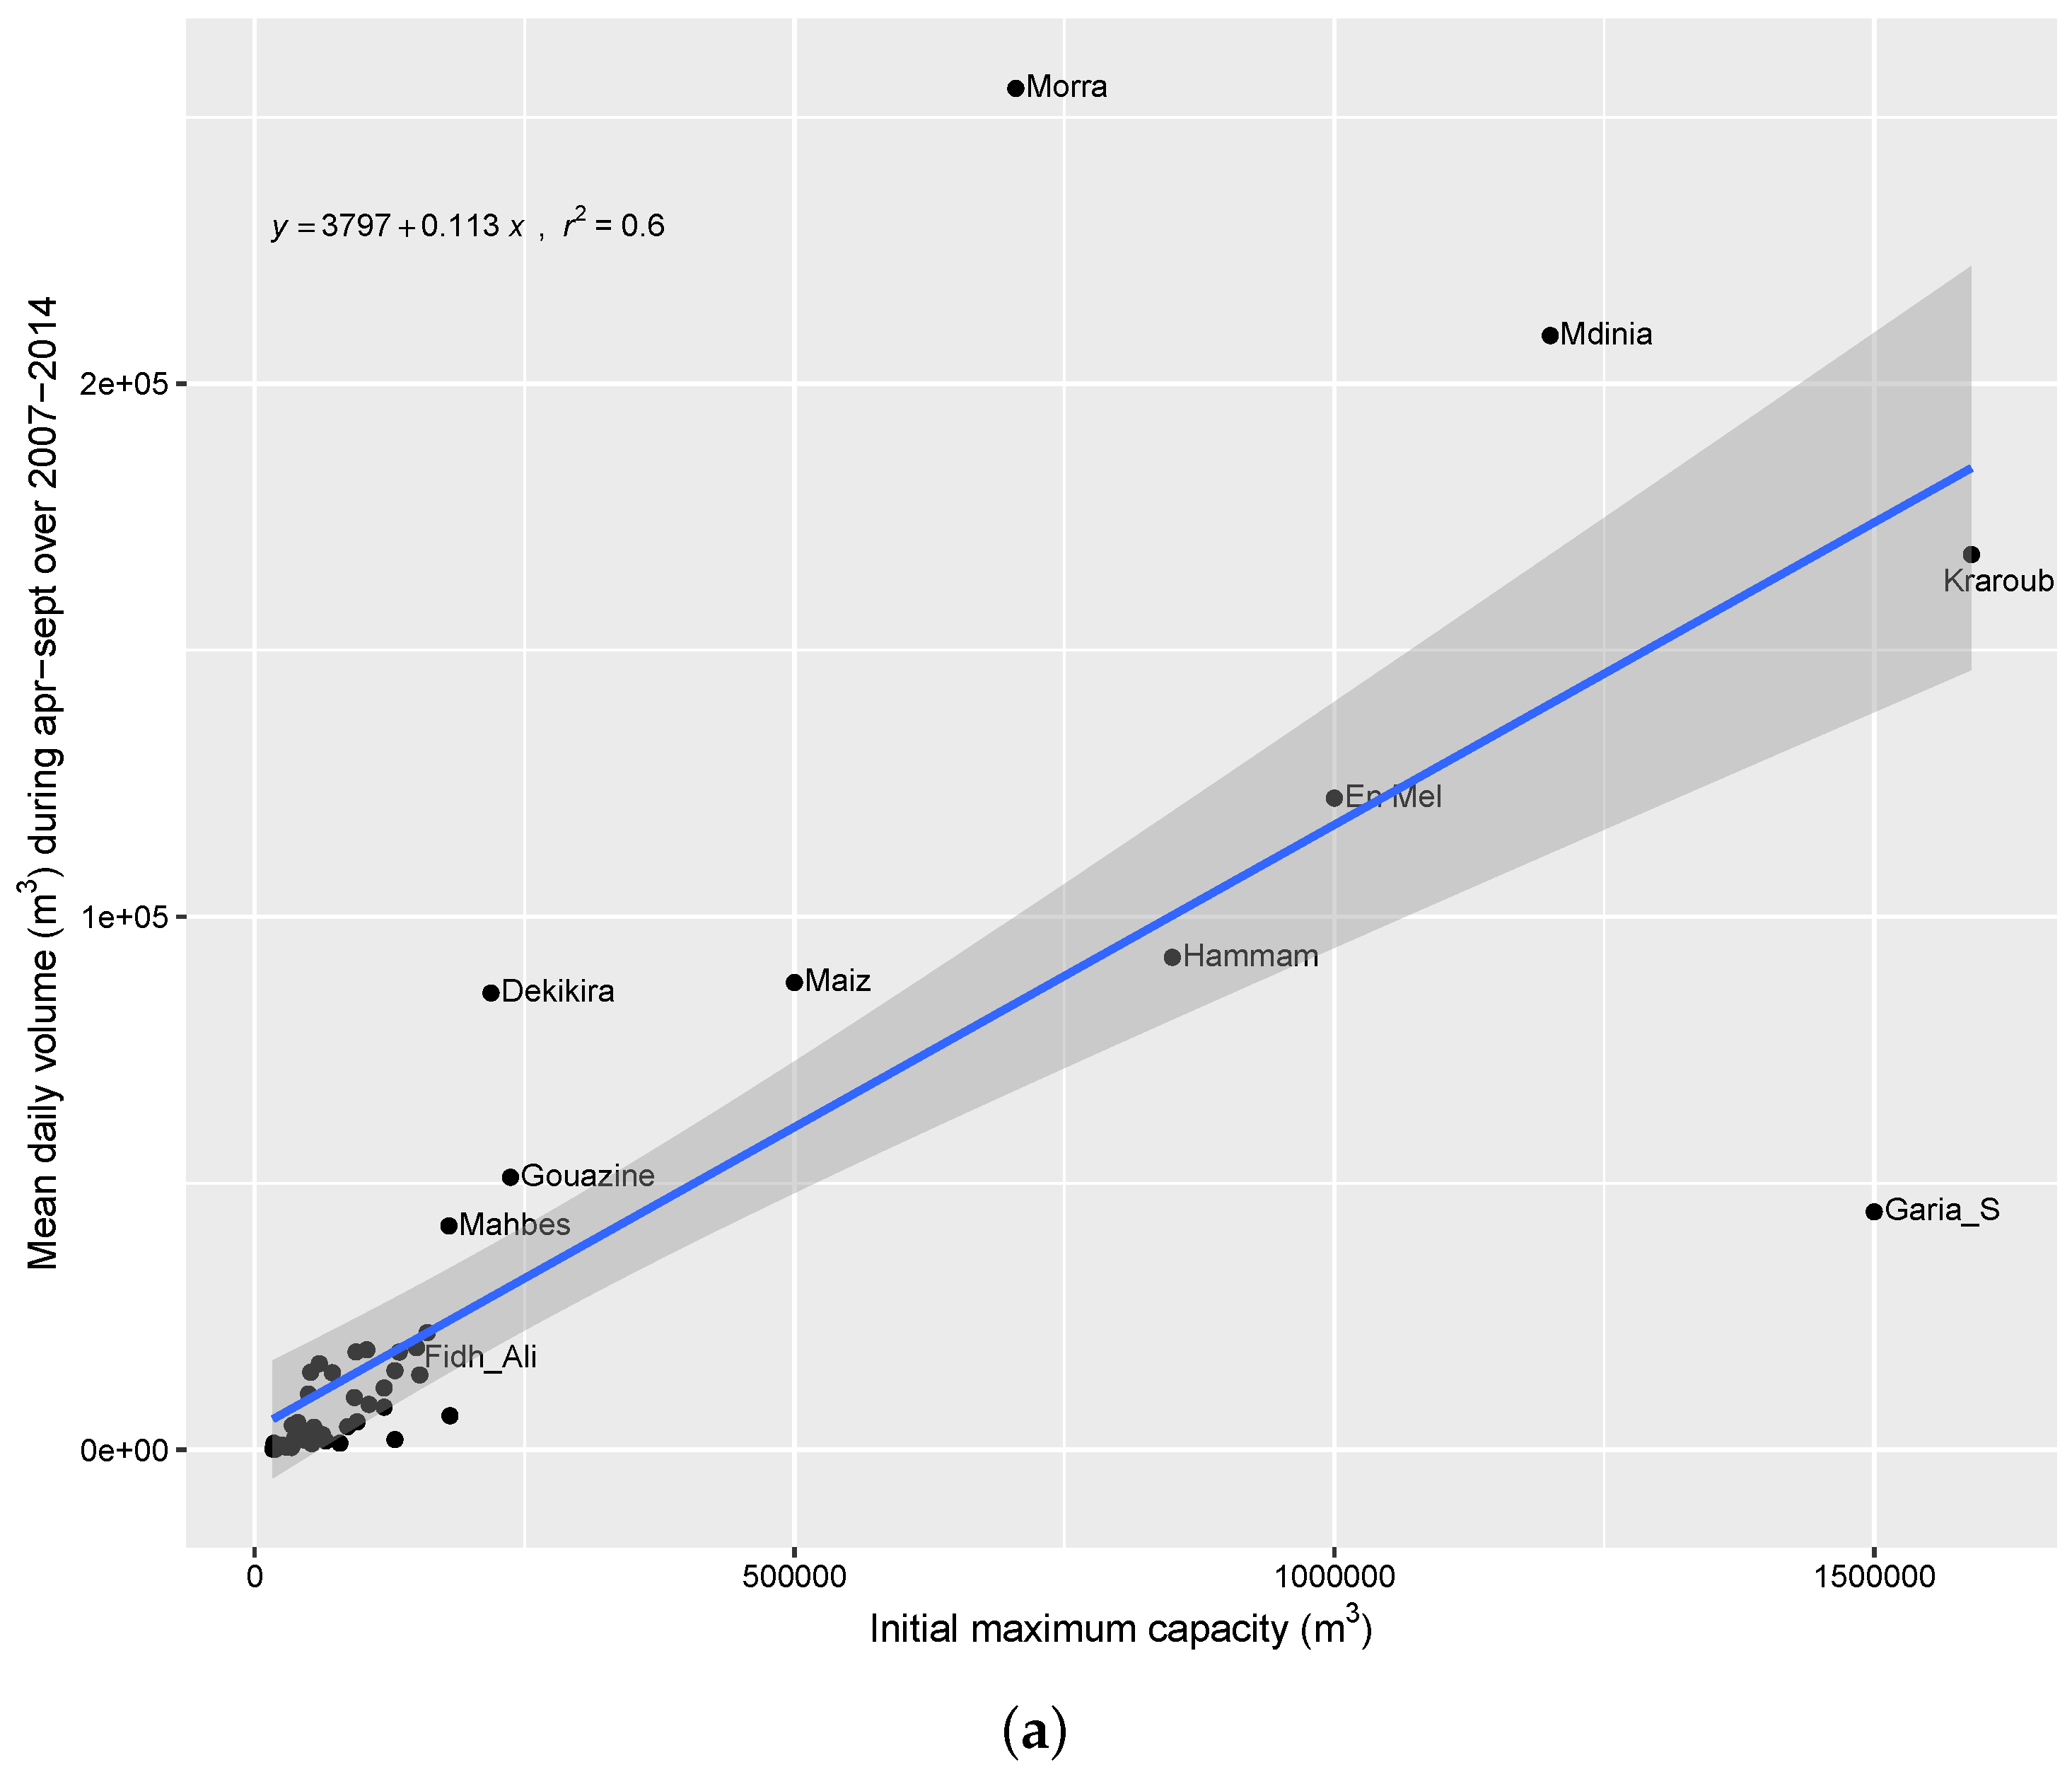
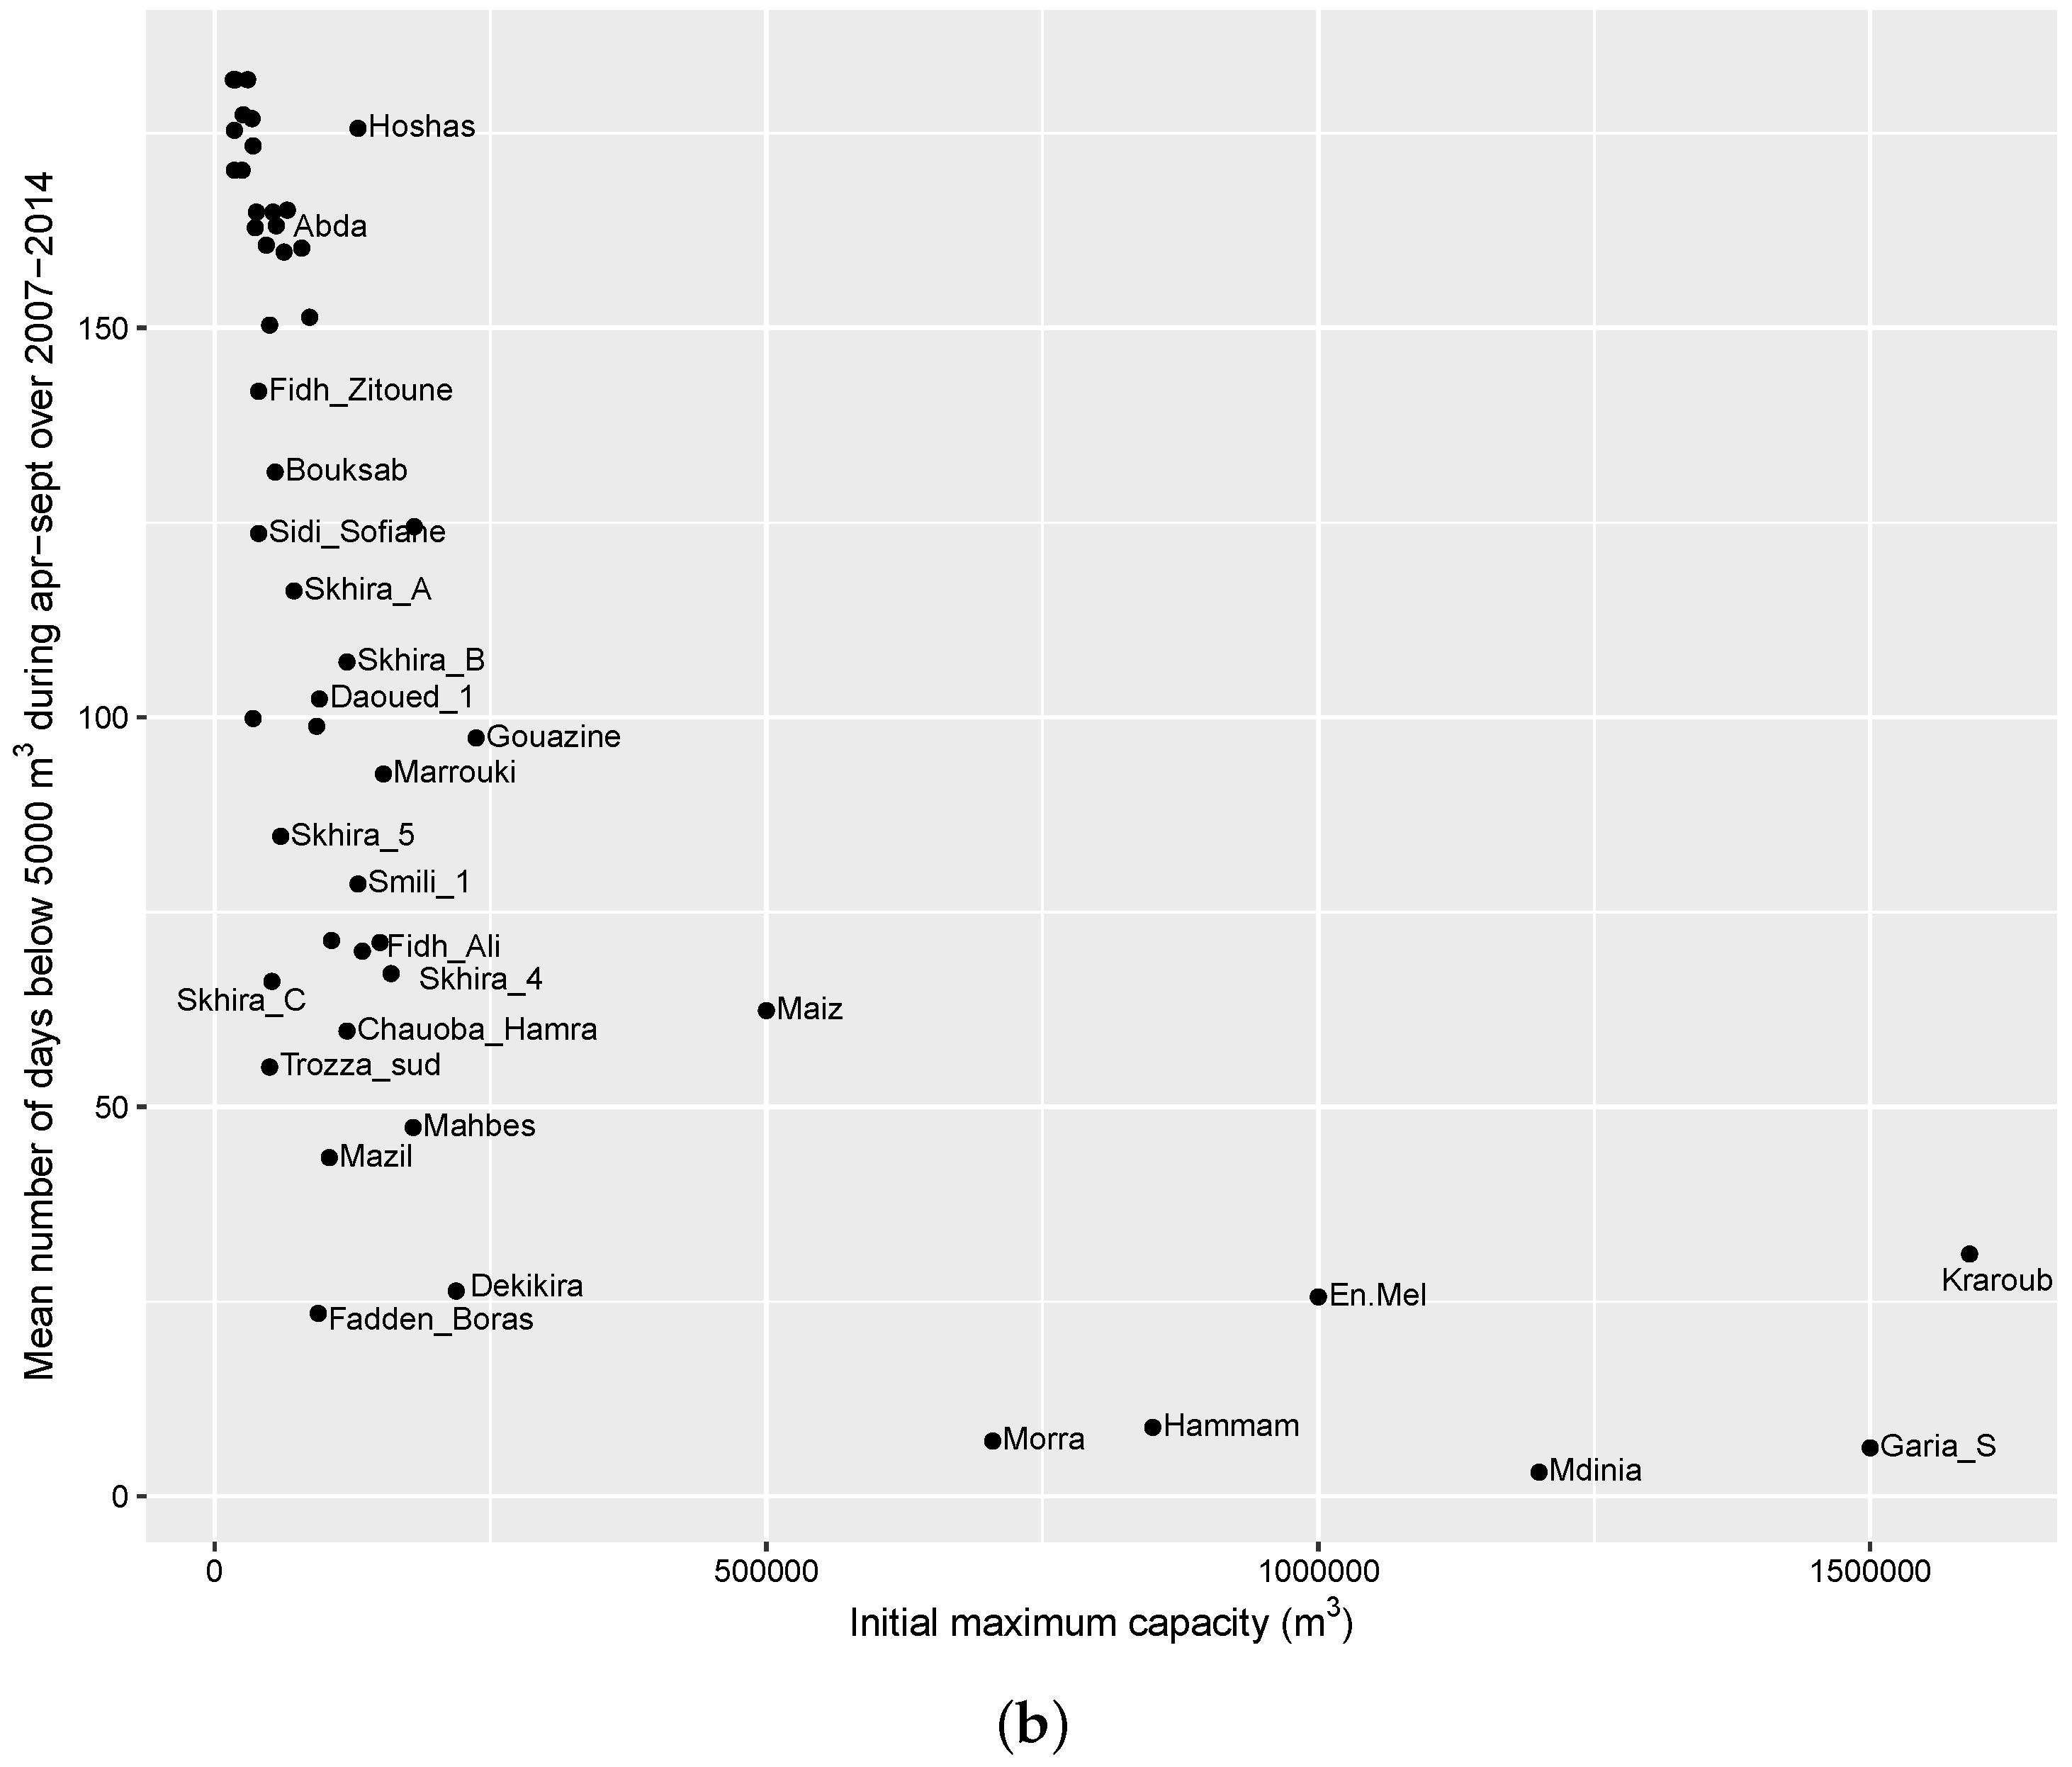
3.2.4. Relationship between Capacity and Droughts

Figure 18 and Figure 19 show that greater capacities ensure greater reliability in this context of low erratic rainfall where storage is essential. Above the 500,000 m3 threshold, reliability increases significantly in this semi-arid catchment. Lakes with substantial storage (250,000 m3) are subject to significant floods, raising their mean availability to 50,000 m3, but this remains insufficient to maintain long-term availability, i.e., remain flooded between successive floods or through the dry season with droughts up to three months reported during the dry season on Gouazine. In all of these cases, withdrawals are minimal and therefore influence the availability patterns during the dry season [12].
The initial capacity of lakes can however only provide a vague estimate to stakeholders of the potential mean availability of lakes (Figure 19). Correlation remains limited ( R 2 = 0.6), as can be expected considering the spatial rainfall and associated runoff variability, as well as differences in catchment runoff coefficients and lake characteristics (notably high infiltration). Part of these will has been accounted for during the dimensioning of dams; however, Garia S., though reliable, shows relatively low mean water volumes compared to other lakes of its capacity and may have been over-dimensioned considering its reduced catchment size (5 km2 compared to 20 km2 for other large lakes). Conversely the superior reliability of Garia S. compared to lakes such as Gouazine of similar mean availability may be explained by the observed differences in geomorphology. Further hydrological analysis can exploit the spatialized volumetric data derived from the Landsat observations to identify the drivers of high water availability through sub-catchment modelling and reservoir water balance (Figure 20).

4. Conclusions

Based on free medium-resolution remote sensing observations, this paper highlights the operational potential of Landsat satellite imagery to monitor resources in 51 scattered, ungauged small reservoirs over 1999–2014. The results confirm the growing value of satellite imagery in hydrology and specifically confirm the feasibility of studying multiple, small water bodies (1–10 ha) using medium-resolution free imagery by adapting and automating a method across 546 images using the MNDWI band ratio index [12]. Validated against extensive hydrometric time series for three reservoirs, results confirm the good skill ( R 2 up to 0.9) of the method to reproduce flood variations of lakes of medium size and sufficiently slow flood dynamics. Mean RMSE on daily volumes across all three lakes reaches 26,400 m3.
Errors from modelling lake morphologies and silting over time were contained and inferior to other uncertainties (mean RMSE increase by 50%) thanks to an interSR power relationship adapted over time to account for silting derived from 15 reservoirs in the area. Significantly, RMSE on mean annual volumes reduced to 20,600 m3, and the method displayed its potential to provide spatialized assessments of water availability and insights across reservoirs and years. Furthermore, for 20 lakes in the basin, interannual water availability was not sensitive to these silting uncertainties due to the very small and sparse volumes available.
Results also highlighted the inadequacy of imported power relations and the need to derive local S-V relations to account for the morphology of small reservoirs when converting surface area assessments into volumes. Residual uncertainties from using a single power relation across lake morphologies are exacerbated through silting, which though incremental, is not gradual and varies widely from one lake and year to another. Suitable ways to measure and update S-V for several lakes are therefore essential to assess their capacity to support agriculture or attenuate floods. Greater spatial resolution and increased access to low cost imagery (including stereoscopic/multi-view) to derive DEMs will help reduce these uncertainties. Likewise, reduced costs and adapted legislation for UAVs (unmanned aerial vehicles such as drones) can facilitate field-based acquisition of multiple rating curves over time [49]. Continuous improvements in satellite sensors and cloud detection will reduce remote sensing uncertainties and increase the importance of reducing these additional uncertainties.
Applied to 51 ungauged small reservoirs, the method provided initial insights into their flood and drought patterns and highlighted the extreme disparities between lakes and years. Importantly, results reveal the limited availability, except on a handful of lakes (eight), predominantly of large capacity (>500,000 m3), confirming the importance of storage in semi-arid basins where events are rare and spread out. All other lakes, despite significant capacities and mean interannual availability, suffer from significant variability leading to unreliable water access and drought periods on average three months of the dry season. Twenty seven lakes (i.e., 53%) suffer from significant droughts, allowing crop irrigation for less than 45 days, i.e., less than the shortest crop cycle. These substantial constraints highlight the limited agricultural potential of these smallest reservoirs and the need to maintain at most a supplementary irrigation objective. Combined with additional field data, volumes captured by small reservoirs can be analysed to investigate the role of catchment and reservoir characteristics (rainfall, evaporation, land use and land cover, etc.) in reducing drought risks and help stakeholders optimise the location, sizing and management of these vital sources of rural water supply. A clear limiting factor here, water is rarely a sufficient factor to explain agricultural development around small reservoirs or its decline. Further investigation must then seek to understand to what extent water availability has shaped agricultural development around small reservoirs and how other socioeconomic factors have influenced water use [12]. Replicable at multiples scales across ungauged reservoirs, this approach may allow stakeholders to understand the hydrological constraints experienced by millions of small holder farmers across semi-arid countries [2] and optimise practices and investments accordingly.

Acknowledgments

These works were partly funded through the French Agence Nationale de la Recherche (ANR) AMETHYST and Surfaces et Interfaces Continentales en Méditerranée (SICMED) Dyshyme projects.

Author Contributions

Andrew Ogilvie conceived the research, carried out the analysis and wrote the article. Gilles Belaud, Sylvain Massuel, Mark Mulligan and Patrick Le Goulven helped design the research, review the results and the article. Sylvain Massuel and Roger Calvez contributed in instrumenting and acquiring field data.

Conflicts of Interest

The authors declare no conflict of interest.

References

  1. Centre National des Etudes Agricoles (CNEA). Etude d’impact des Travaux de Conservation des Eaux et du sol dans le Gouvernorat de Kairouan; Technical Report; CNEA: Tunis, Tunisie, 2006. (In French) [Google Scholar]
  2. Wisser, D.; Frolking, S.; Douglas, E.M.; Fekete, B.M.; Schumann, A.H.; Vörösmarty, C.J. The significance of local water resources captured in small reservoirs for crop production—A global-scale analysis. J. Hydrol. 2010, 384, 264–275. [Google Scholar] [CrossRef]
  3. Albergel, J.; Nasri, S.; Boufaroua, M.; Droubi, A.; Merzouk, A.A. Petits barrages et lacs collinaires, aménagements originaux de conservation des eaux et de protection des infrastructures aval: Exemples des petits barrages en Afrique du Nord et au Proche Orient. Sécheresse 2004, 15, 78–86. (In French) [Google Scholar]
  4. Bouma, J.A.; Biggs, T.W.; Bouwer, L.M. The downstream externalities of harvesting rainwater in semi-arid watersheds: An Indian case study. Agric. Water Manag. 2011, 98, 1162–1170. [Google Scholar] [CrossRef]
  5. Burte, J.; Coudrain, A.; Frischkorn, H.; Chaffaut, I.; Kosuth, P. Impacts anthropiques sur les termes du bilan hydrologique d’un aquifère alluvial dans le Nordeste semi-aride, Brésil. Hydrol. Sci. J. 2005, 50, 95–110. (In French) [Google Scholar] [CrossRef]
  6. Venot, J.P.; Krishnan, J. Discursive framing: Debates over small reservoirs in the Rural South. Water Altern. 2011, 4, 316–324. [Google Scholar]
  7. Khlifi, S.; Ameur, M.; Mtimet, N.; Ghazouani, N.; Belhadj, N. Impacts of small hill dams on agricultural development of hilly land in the Jendouba region of northwestern Tunisia. Agric. Water Manag. 2010, 97, 50–56. [Google Scholar] [CrossRef]
  8. Mugabe, F.; Hodnett, M.; Senzanje, A. Opportunities for increasing productive water use from dam water: A case study from semi-arid Zimbabwe. Agric. Water Manag. 2003, 62, 149–163. [Google Scholar] [CrossRef]
  9. Kongo, V.; Jewitt, G. Preliminary investigation of catchment hydrology in response to agricultural water use innovations: A case study of the Potshini catchment—South Africa. Phys. Chem. Earth 2006, 31, 976–987. [Google Scholar] [CrossRef]
  10. Lacombe, G. Evolution et Usages de la Ressource en eau dans un Bassin Versant Amenagé Semi-Aride. Le Cas du Merguellil en Tunisie Centrale. Ph.D. Thesis, Université Montpellier II, Montpellier, France, 2007. [Google Scholar]
  11. Li, Q.; Gowing, J. A daily water balance modelling approach for simulating performance of tank-based irrigation systems. Water Resour. Manag. 2005, 19, 211–231. [Google Scholar] [CrossRef]
  12. Ogilvie, A. Upscaling Water Availability and Water Use Assessments in Hydro-Sociosystems: The Small Reservoirs of the Merguellil Catchment (Central Tunisia). Ph.D. Thesis, Université de Montpellier, Montpellier, France, King’s College London, London, UK, 2015. Available online: https://hal.archives-ouvertes.fr/tel-01341741 (accessed on 19 September 2016). [Google Scholar]
  13. Gao, P.; Mu, X.M.; Wang, F.; Li, R. Changes in streamflow and sediment discharge and the response to human activities in the middle reaches of the Yellow River. Hydrol. Earth Syst. Sci. 2011, 15, 1–10. [Google Scholar] [CrossRef] [Green Version]
  14. He, X.; Li, Z.; Hao, M.; Tang, K.; Zheng, F. Down-scale analysis for water scarcity in response to soil-water conservation on Loess Plateau of China. Agric. Ecosyst. Environ. 2003, 94, 355–361. [Google Scholar]
  15. Ogilvie, A.; Le Goulven, P.; Leduc, C.; Calvez, R.; Mulligan, M. Réponse hydrologique d’un bassin semi-aride aux événements pluviométriques et aménagements de versant (bassin du Merguellil, Tunisie centrale). Hydrol. Sci. J. 2016, 61, 441–453. (In French) [Google Scholar] [CrossRef]
  16. Bastiaanssen, W.; Molden, D.J.; Makin, I.W. Remote sensing for irrigated agriculture: Examples from research and possible applications. Agric. Water Manag. 2000, 46, 137–155. [Google Scholar] [CrossRef]
  17. Bergé-Nguyen, M.; Crétaux, J.F. Inundations in the Inner Niger Delta: Monitoring and analysis using MODIS and global precipitation datasets. Remote Sens. 2015, 7, 2127–2151. [Google Scholar] [CrossRef]
  18. Kuenzer, C.; Klein, I.; Ullmann, T.; Georgiou, E.; Baumhauer, R.; Dech, S. Remote sensing of river delta inundation: Exploiting the potential of coarse spatial resolution, temporally-dense MODIS time series. Remote Sens. 2015, 7, 8516–8542. [Google Scholar] [CrossRef]
  19. Ogilvie, A.; Belaud, G.; Delenne, C.; Bailly, J.S.; Bader, J.C.; Oleksiak, A.; Ferry, L.; Martin, D. Decadal monitoring of the Niger Inner Delta flood dynamics using MODIS optical data. J. Hydrol. 2015, 523, 368–383. [Google Scholar] [CrossRef]
  20. Martinez, J.; Letoan, T. Mapping of flood dynamics and spatial distribution of vegetation in the Amazon floodplain using multitemporal SAR data. Remote Sens. Environ. 2007, 108, 209–223. [Google Scholar] [CrossRef]
  21. Ma, M.; Wang, X.; Veroustraete, F.; Dong, L. Change in area of Ebinur Lake during the 1998–2005 period. Int. J. Remote Sens. 2007, 28, 5523–5533. [Google Scholar] [CrossRef]
  22. Swenson, S.; Wahr, J. Monitoring the water balance of Lake Victoria, East Africa, from space. J. Hydrol. 2009, 370, 163–176. [Google Scholar] [CrossRef]
  23. Liebe, J.; van de Giesen, N.; Andreini, M. Estimation of small reservoir storage capacities in a semi-arid environment. Phys. Chem. Earth 2005, 30, 448–454. [Google Scholar] [CrossRef]
  24. Jain, A.K. Data clustering: 50 years beyond K-means. Pattern Recognit. Lett. 2010, 31, 651–666. [Google Scholar] [CrossRef]
  25. Annor, F.O.; van de Giesen, N.; Liebe, J.; van de Zaag, P.; Tilmant, A.; Odai, S. Delineation of small reservoirs using radar imagery in a semi-arid environment: A case study in the upper east region of Ghana. Phys. Chem. Earth 2009, 34, 309–315. [Google Scholar] [CrossRef]
  26. Mialhe, F.; Gunnell, Y.; Mering, C. Synoptic assessment of water resource variability in reservoirs by remote sensing: General approach and application to the runoff harvesting systems of south India. Water Resour. Res. 2008, 44, 14. [Google Scholar] [CrossRef]
  27. Feyisa, G.L.; Meilby, H.; Fensholt, R.; Proud, S.R. Automated Water Extraction Index: A new technique for surface water mapping using Landsat imagery. Remote Sens. Environ. 2014, 140, 23–35. [Google Scholar] [CrossRef]
  28. Xu, H. Modification of normalised difference water index (NDWI) to enhance open water features in remotely sensed imagery. Int. J. Remote Sens. 2006, 27, 3025–3033. [Google Scholar] [CrossRef]
  29. Kingumbi, A.; Bargaoui, Z.; Hubert, P. Investigation of the rainfall variability in central Tunisia. Hydrol. Sci. J. 2005, 50, 493–508. [Google Scholar] [CrossRef]
  30. Albergel, J.; Pepin, Y.; Nasri, S.; Boufaroua, M. Erosion et transport solide dans des petits bassins versants méditerranéens. IAHS Publ. 2003, 278, 373–379. (In French) [Google Scholar]
  31. Collinet, J.; Zante, P. Analyse du ravinement de bassins versants à retenues collinaires sur sols à fortes dynamiques structurales (Tunisie). Géomorphol. Relief Proc. Environ. 2005, 1, 61–74. (In French) [Google Scholar] [CrossRef]
  32. Kingumbi, A. Modélisation Hydrologique d’un Bassin Affecté par des Changements D’occupation: Cas du Merguellil en Tunisie Centrale. Ph.D. Thesis, Université de Tunis El Manar, Ecole Nationale d’Ingénieurs de Tunis, Tunis, Tunisia, 2006. [Google Scholar]
  33. Verpoorter, C.; Kutser, T.; Seekell, D.A.; Tranvik, L.J. A Global inventory of lakes based on high-resolution satellite imagery. Geophys. Res. Lett. 2014, 41, 6396–6402. [Google Scholar] [CrossRef]
  34. Chavez, P.S.J. Image-based atmospheric corrections - revisited and improved. Photogram. Eng. Remote Sens. 1996, 62, 1025–1035. [Google Scholar]
  35. Goslee, S.C. Analyzing remote sensing data in R: The landsat package. J. Stat. Softw. 2011, 43, 1–25. [Google Scholar] [CrossRef]
  36. Song, C.; Woodcock, C.E.; Seto, K.C.; Lenney, M.P.; Macomber, S.A. Classification and change detection using Landsat TM data. Remote Sens. Environ. 2001, 75, 230–244. [Google Scholar] [CrossRef]
  37. Hantson, S.; Chuvieco, E. Evaluation of different topographic correction methods for Landsat imagery. Int. J. Appl. Earth Obs. Geoinf. 2011, 13, 691–700. [Google Scholar] [CrossRef]
  38. Minnaert, M. The reciprocity principle in lunar photometry. Astrophys. J. 1941, 93, 403–410. [Google Scholar] [CrossRef]
  39. Vanonckelen, S.; Lhermitte, S.; Van Rompaey, A. The effect of atmospheric and topographic correction methods on land cover classification accuracy. Int. J. Appl. Earth Obs. Geoinf. 2013, 24, 9–21. [Google Scholar] [CrossRef]
  40. Zhu, Z.; Woodcock, C.E. Object-based cloud and cloud shadow detection in Landsat imagery. Remote Sens. Environ. 2012, 118, 83–94. [Google Scholar] [CrossRef]
  41. Sawunyama, T.; Senzanje, A.; Mhizha, A. Estimation of small reservoir storage capacities in Limpopo River Basin using geographical information systems (GIS) and remotely sensed surface areas: Case of Mzingwane catchment. Phys. Chem. Earth 2006, 31, 935–943. [Google Scholar] [CrossRef]
  42. Cadier, E. Hydrologie des petits bassins du Nordeste Brésilien semi-aride: Typologie des bassins et transposition écoulements annuels Small watershed hydrology in semi-arid north-eastern Brazil: Basin typology and transposition of annual runoff data. J. Hydrol. 1996, 182, 117–141. (In French) [Google Scholar] [CrossRef]
  43. Gourdin, F.; Cecchi, P.; Corbin, D.; Casenave, A. Caractérisation hydrologique des petits barrages. In L’eau en Partage: Les Petits Barrages de Côte d’Ivoire; Cecchi, P., Ed.; IRD Editions: Paris, France, 2003; pp. 75–95. (In French) [Google Scholar]
  44. Hentati, A.; Kawamura, A.; Amaguchi, H.; Iseri, Y. Evaluation of sedimentation vulnerability at small hillside reservoirs in the semi-arid region of Tunisia using the Self-Organizing Map. Geomorphology 2010, 122, 56–64. [Google Scholar] [CrossRef]
  45. Jebari, S.; Berndtsson, R.; Bahri, A.; Boufaroua, R. Spatial soil loss risk and reservoir siltation in semi-arid Tunisia. Hydrol. Sci. J. 2010, 55, 121–137. [Google Scholar] [CrossRef]
  46. Baccari, N.; Boussema, M.; Lamachere, J.; Nasri, S. Efficiency of contour benches, filling-in and silting-up of a hillside reservoir in a semi-arid climate in Tunisia. C. R. Geosci. 2008, 340, 38–48. [Google Scholar] [CrossRef]
  47. García-Ruiz, J.M.; López-Moreno, J.I.; Vicente-Serrano, S.M.; Lasanta-Martínez, T.; Beguería, S. Mediterranean water resources in a global change scenario. Earth Sci. Rev. 2011, 105, 121–139. [Google Scholar] [CrossRef] [Green Version]
  48. Ben Mammou, A.; Louati, M. Évolution temporelle de l’envasement des retenues de barrages de Tunisie. Revue Sci. Leau 2007, 20, 201–210. (In French) [Google Scholar] [CrossRef] [Green Version]
  49. Massuel, S.; Feurer, D.; Ogilvie, A.; Calvez, R.; Rochette, R. Vers l’amélioration du bilan hydrologique des retenues collinaires par la prise de vue aéroportée légère. Available online: https://drone.teledetection.fr/resumes/33_Massuel_al-v2.pdf (accessed on 19 September 2016). (In French)
Figure 1. Estimated number of small reservoirs (SR) for several countries (based on national, non-exhaustive assessments in [6]).
Geosciences 06 00042 g001
Figure 2. Location of Merguellil upper catchment and its small reservoirs and those with the stage data and surface-volume relationships employed here.
Geosciences 06 00042 g002
Figure 3. Decision tree for the inventory of small reservoirs.
Geosciences 06 00042 g003
Figure 4. Availability of Landsat images for the Merguellil upper catchment.
Geosciences 06 00042 g004
Figure 5. Chain of treatments applied to 546 Landsat images (adapted from [12]).
Geosciences 06 00042 g005
Figure 6. Relationship between surface area and volume based on rating curves from 11 small reservoirs and the interSR relation (blue line) derived from linear regression.
Geosciences 06 00042 g006
Figure 7. B and β parameters for each of the 15 lakes.
Geosciences 06 00042 g007
Figure 8. Lake-specific S-V power relations against the interSR power relation (in grey).
Geosciences 06 00042 g008
Figure 9. Modelled evolution (black line) of the B and β parameters over time.
Geosciences 06 00042 g009aGeosciences 06 00042 g009b
Figure 10. Lake- and date-specific surface-volume relation against the interSR power relation adapted for silting over time (lake Gouazine).
Geosciences 06 00042 g010
Figure 11. Daily volumes for Gouazine lake over 2000–2014 based on: (i) observed stage data; (ii) Landsat data using a site-specific rating curve; (iii) Landsat data using the power relation adapted for silting; (iv) Landsat data using the power relation not adapted for silting.
Geosciences 06 00042 g011
Figure 12. Correlation on daily water volumes in three lakes between field data and remotely-sensed data using the power relation adapted for silting.
Geosciences 06 00042 g012
Figure 13. Correlation on mean annual volumes for three lakes between field data and remote sensing data using the power relation adapted for silting.
Geosciences 06 00042 g013
Figure 14. Error in the number of days water levels fall below a given volume for Gouazine (1999–2014).
Geosciences 06 00042 g014
Figure 15. Landsat-derived volumes for the subset of 12 ungauged lakes over 1999–2014. (a) Daily volumes; (b) mean daily volumes per year.
Geosciences 06 00042 g015
Figure 16. Mean interannual availability over 2007–2014 per lake over the whole year displayed as the mean ± 1 standard deviation.
Geosciences 06 00042 g016
Figure 17. Number of days for each lake that water volumes fell below a designated volume (up to 150,000 m3).
Geosciences 06 00042 g017
Figure 18. Number of drought days per lake (here, drought refers to days below 5000 m3 over the dry season). Pale red refers to results with silting, while dark red represents a best case scenario without silting.
Geosciences 06 00042 g018
Figure 19. Relationship between the initial capacity of each lake and water availability parameters. (a) Correlation between initial maximum capacity of lakes and mean daily volumes over April–September; (b) correlation between the initial maximum capacity of lakes and the mean number of drought days/year (here, droughts refer to volumes <5000 m3).
Geosciences 06 00042 g019aGeosciences 06 00042 g019b
Figure 20. Mean water availability of lakes within the Merguellil upper catchment.
Geosciences 06 00042 g020
Table 1. B and β values for S-V power relations for small reservoirs.
StudyRegionβB
Gourdin et al. [43]Cote d’Ivoire1.49530.00405
Cadier [42]Brazil1.58820.003549
Lacombe [10]Tunisia1.72990.001413
Liebe et al. [23]Ghana1.43670.00857
Sawunyama et al. [41]Limpopo1.32720.002308
Ogilvie (this study)Tunisia1.62820.003935
Table 2. RMSE and NRMSE values on daily volumes and mean annual volumes when using the site-specific surface-volume rating curves and the interSR power relation adapted for silting.
LakeDaily VolumeMean Annual Volume
RMSE (m3)NRMSERMSE (m3)NRMSE
Gouazine (2000–2014)
site specific S-V17,7000.1714,4000.14
interSR & silting27,9000.2716,3000.16
Fidh Ali (2000–2005)
site specific S-V14,2000.3013 1000.28
interSR & silting19,2000.4117,9000.38
Dekikira (2000–2008)
site specific S-V21,5000.1936 6000.33
interSR & silting32,2000.2828,1000.25

