
Identification of Multi-Style Hydrothermal Alteration Using Integrated Compositional and Topographic Remote Sensing Datasets


Abstract
:
1. Introduction
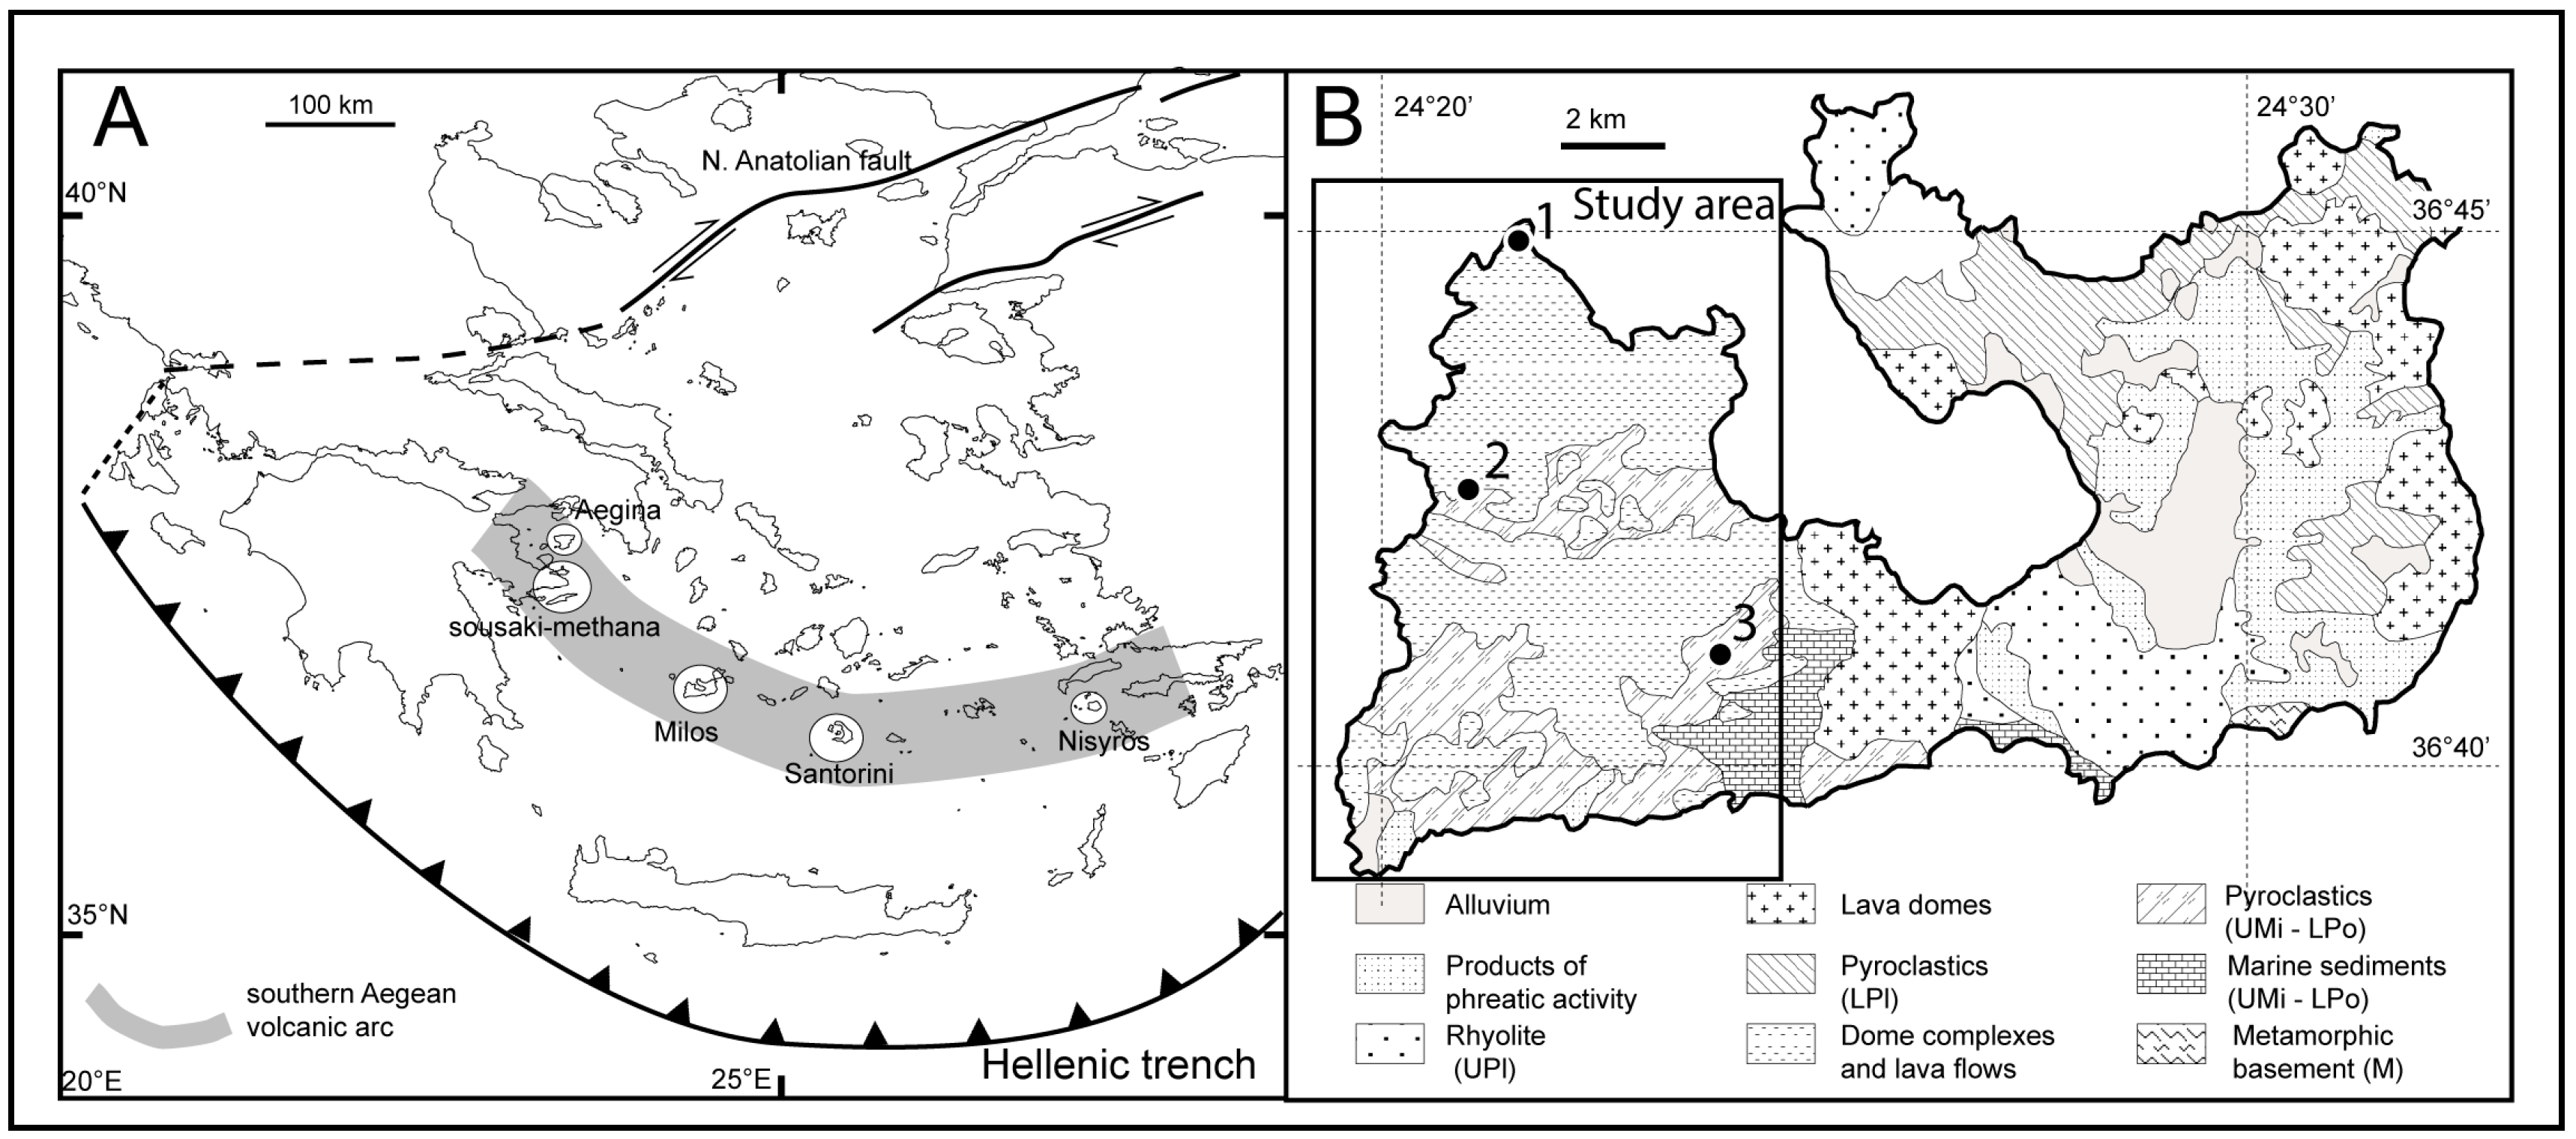
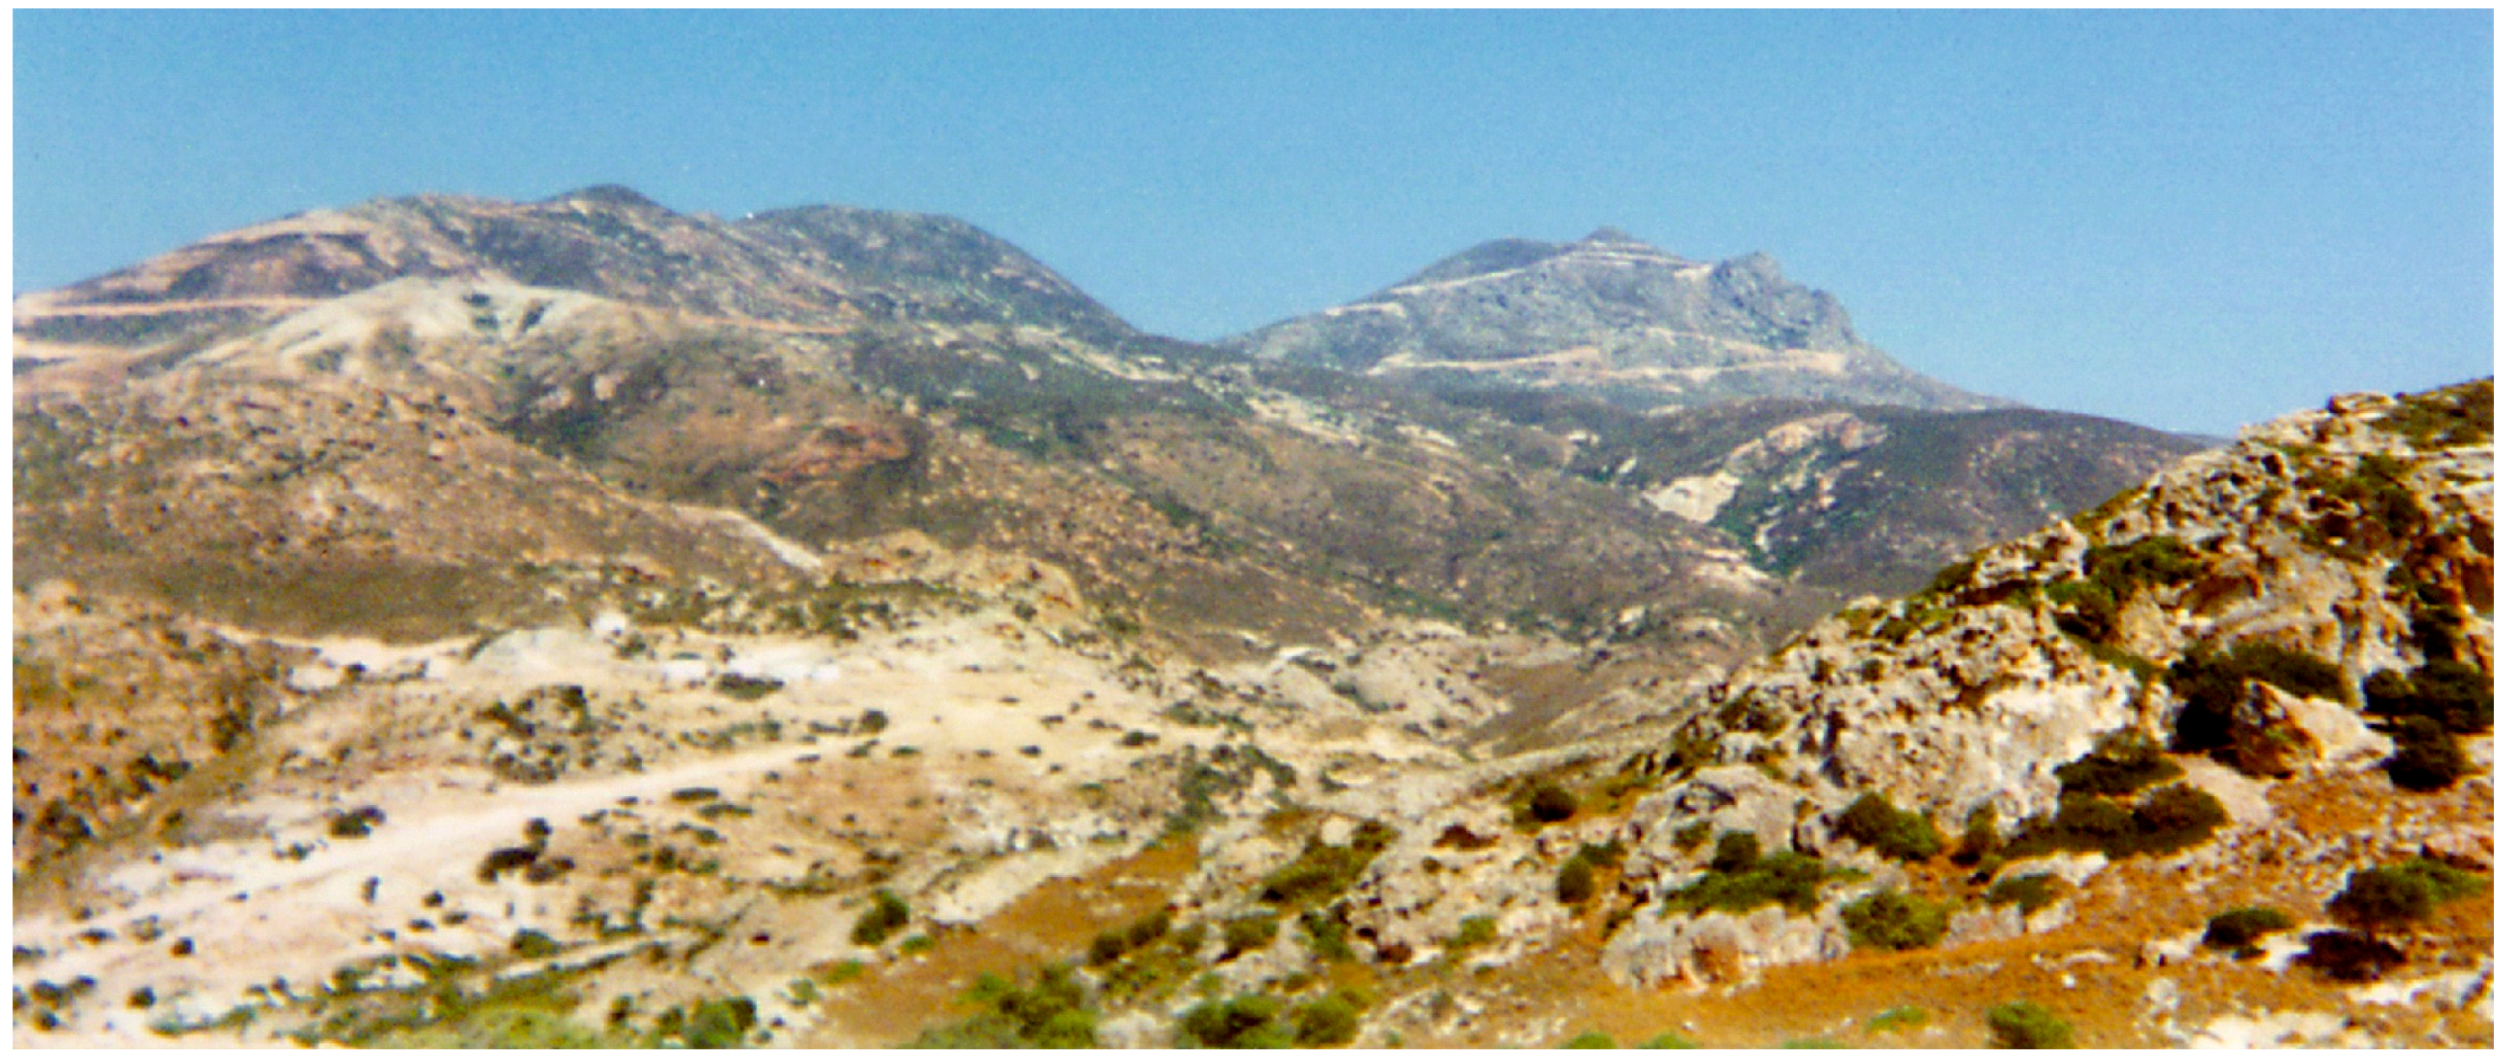
2. Geological Setting of the Study Area
3. Materials and Methods
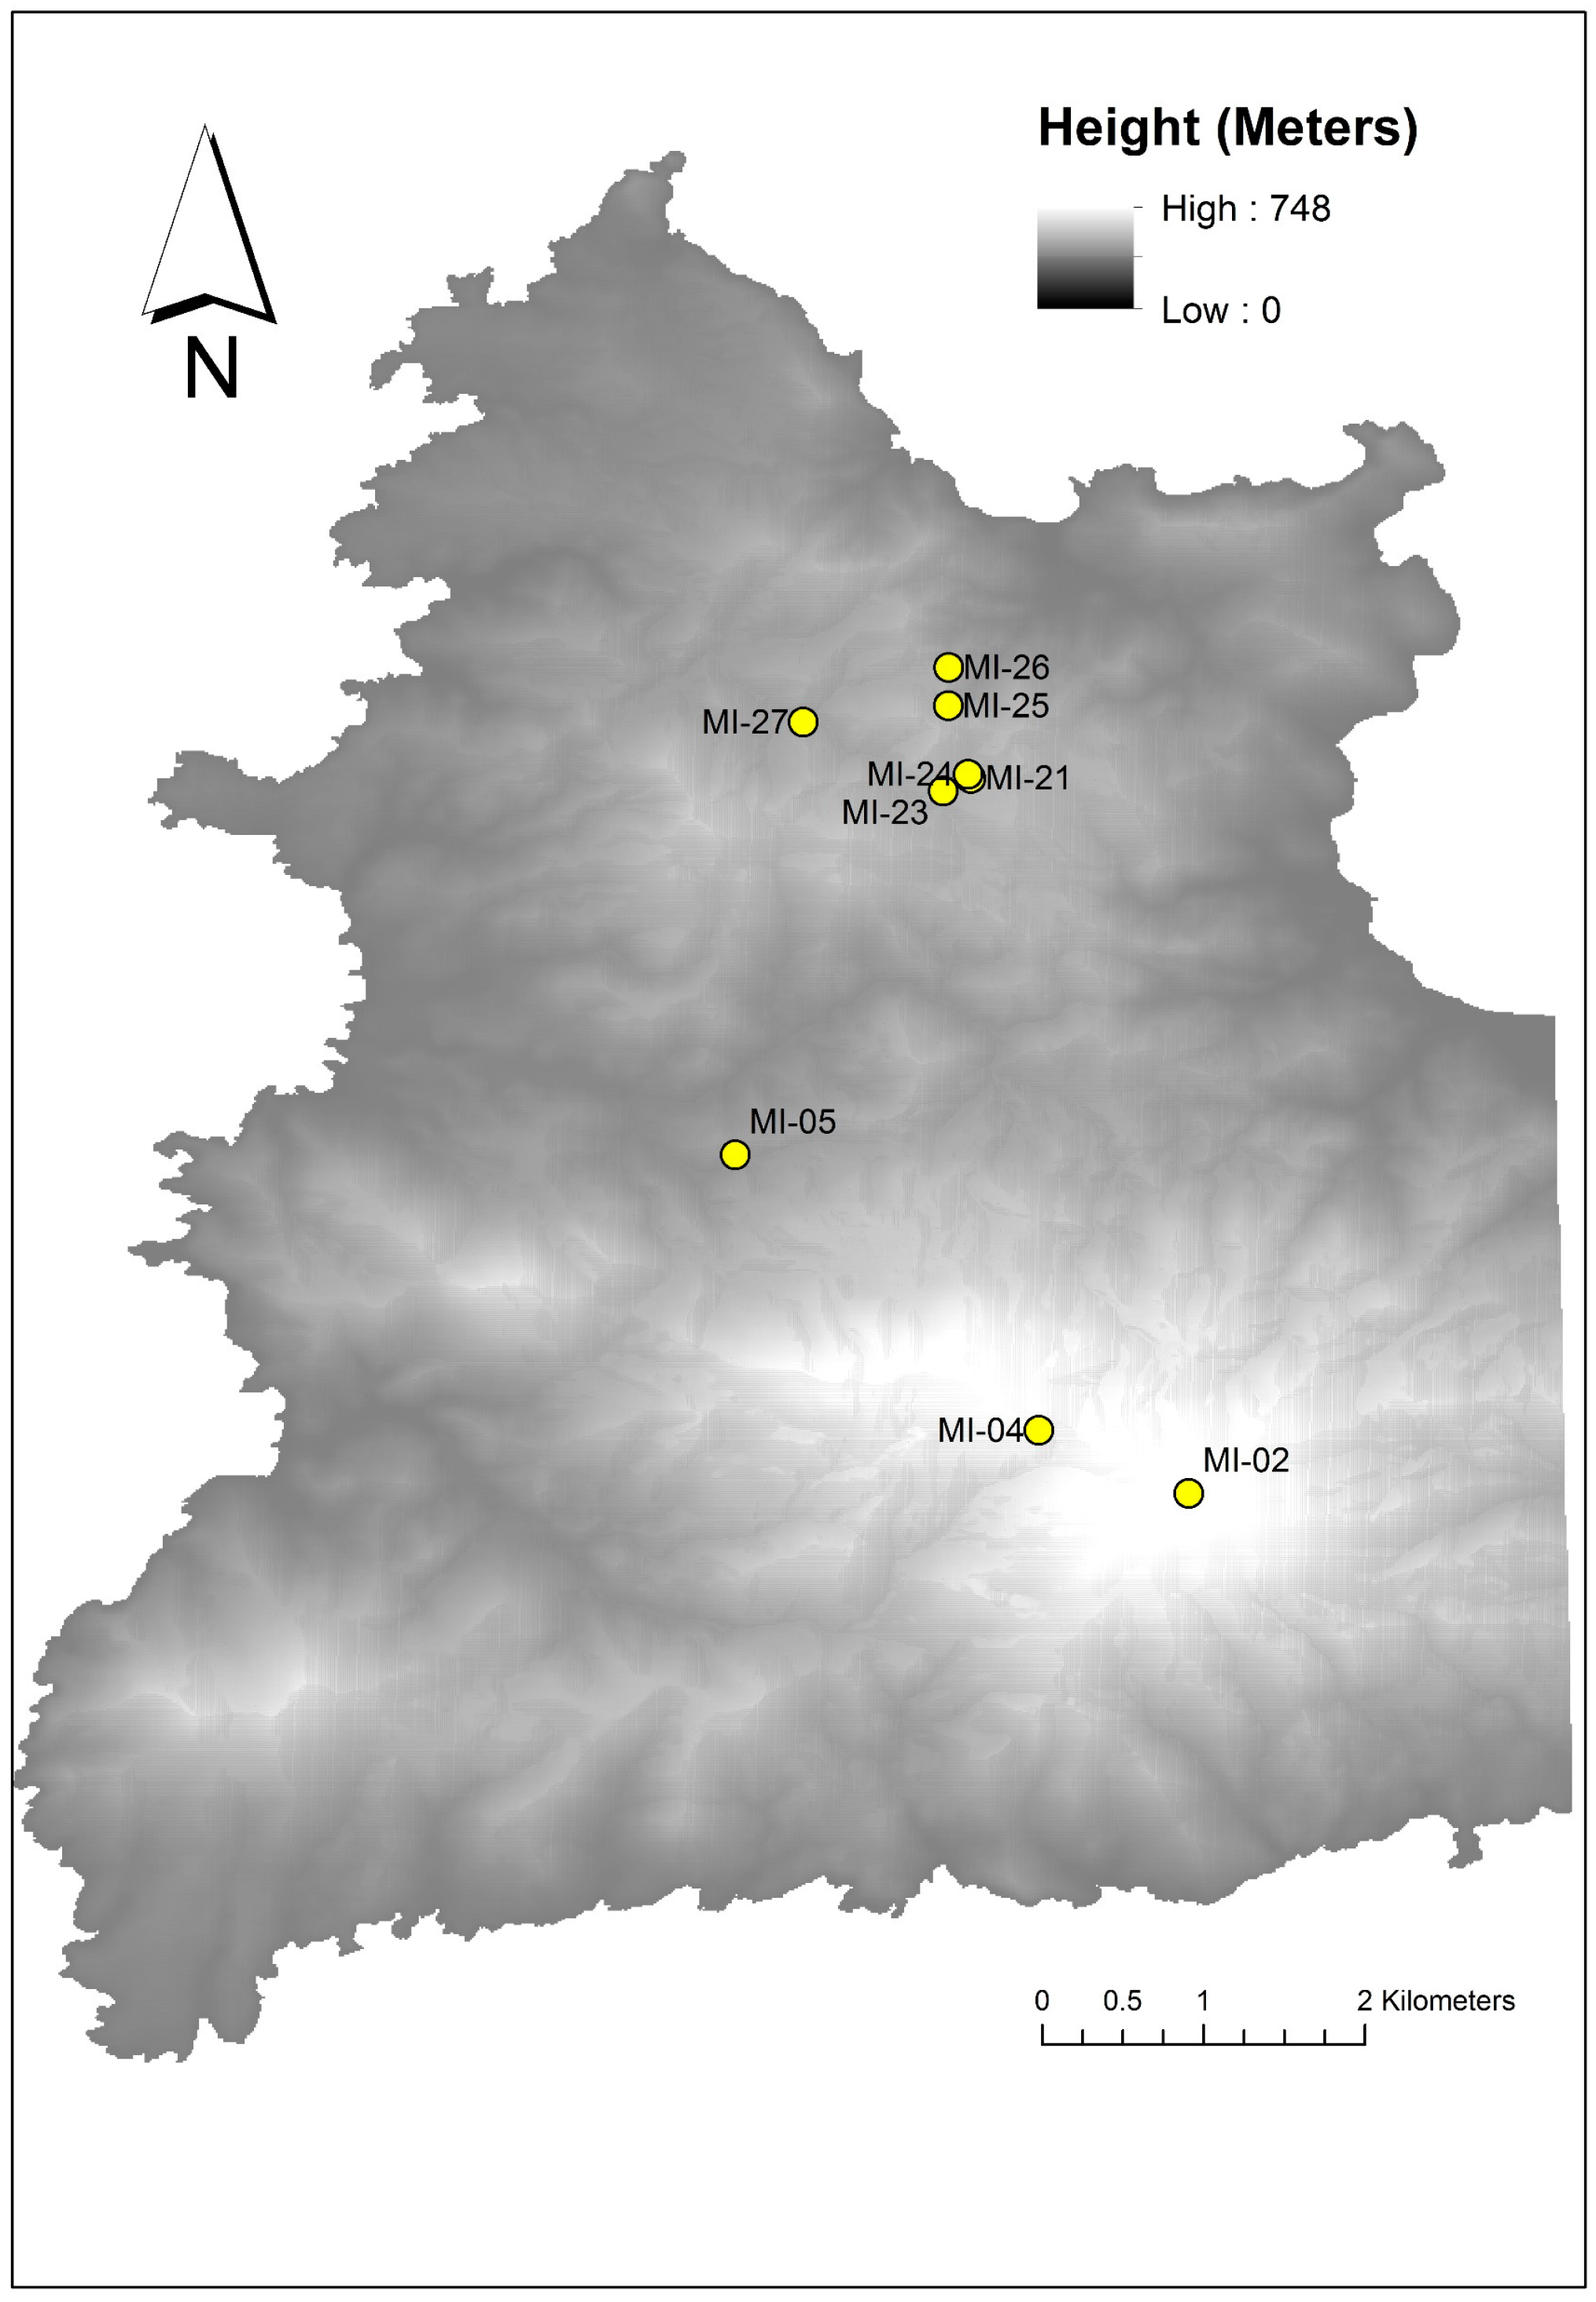
3.1. Field Mapping and XRD Analyses
3.2. VNIR-SWIR Reflectance Spectroscopy
3.3. ASTER Satellite Remote Sensing Dataset
3.4. ASTER Data Processing
4. Spectral Results
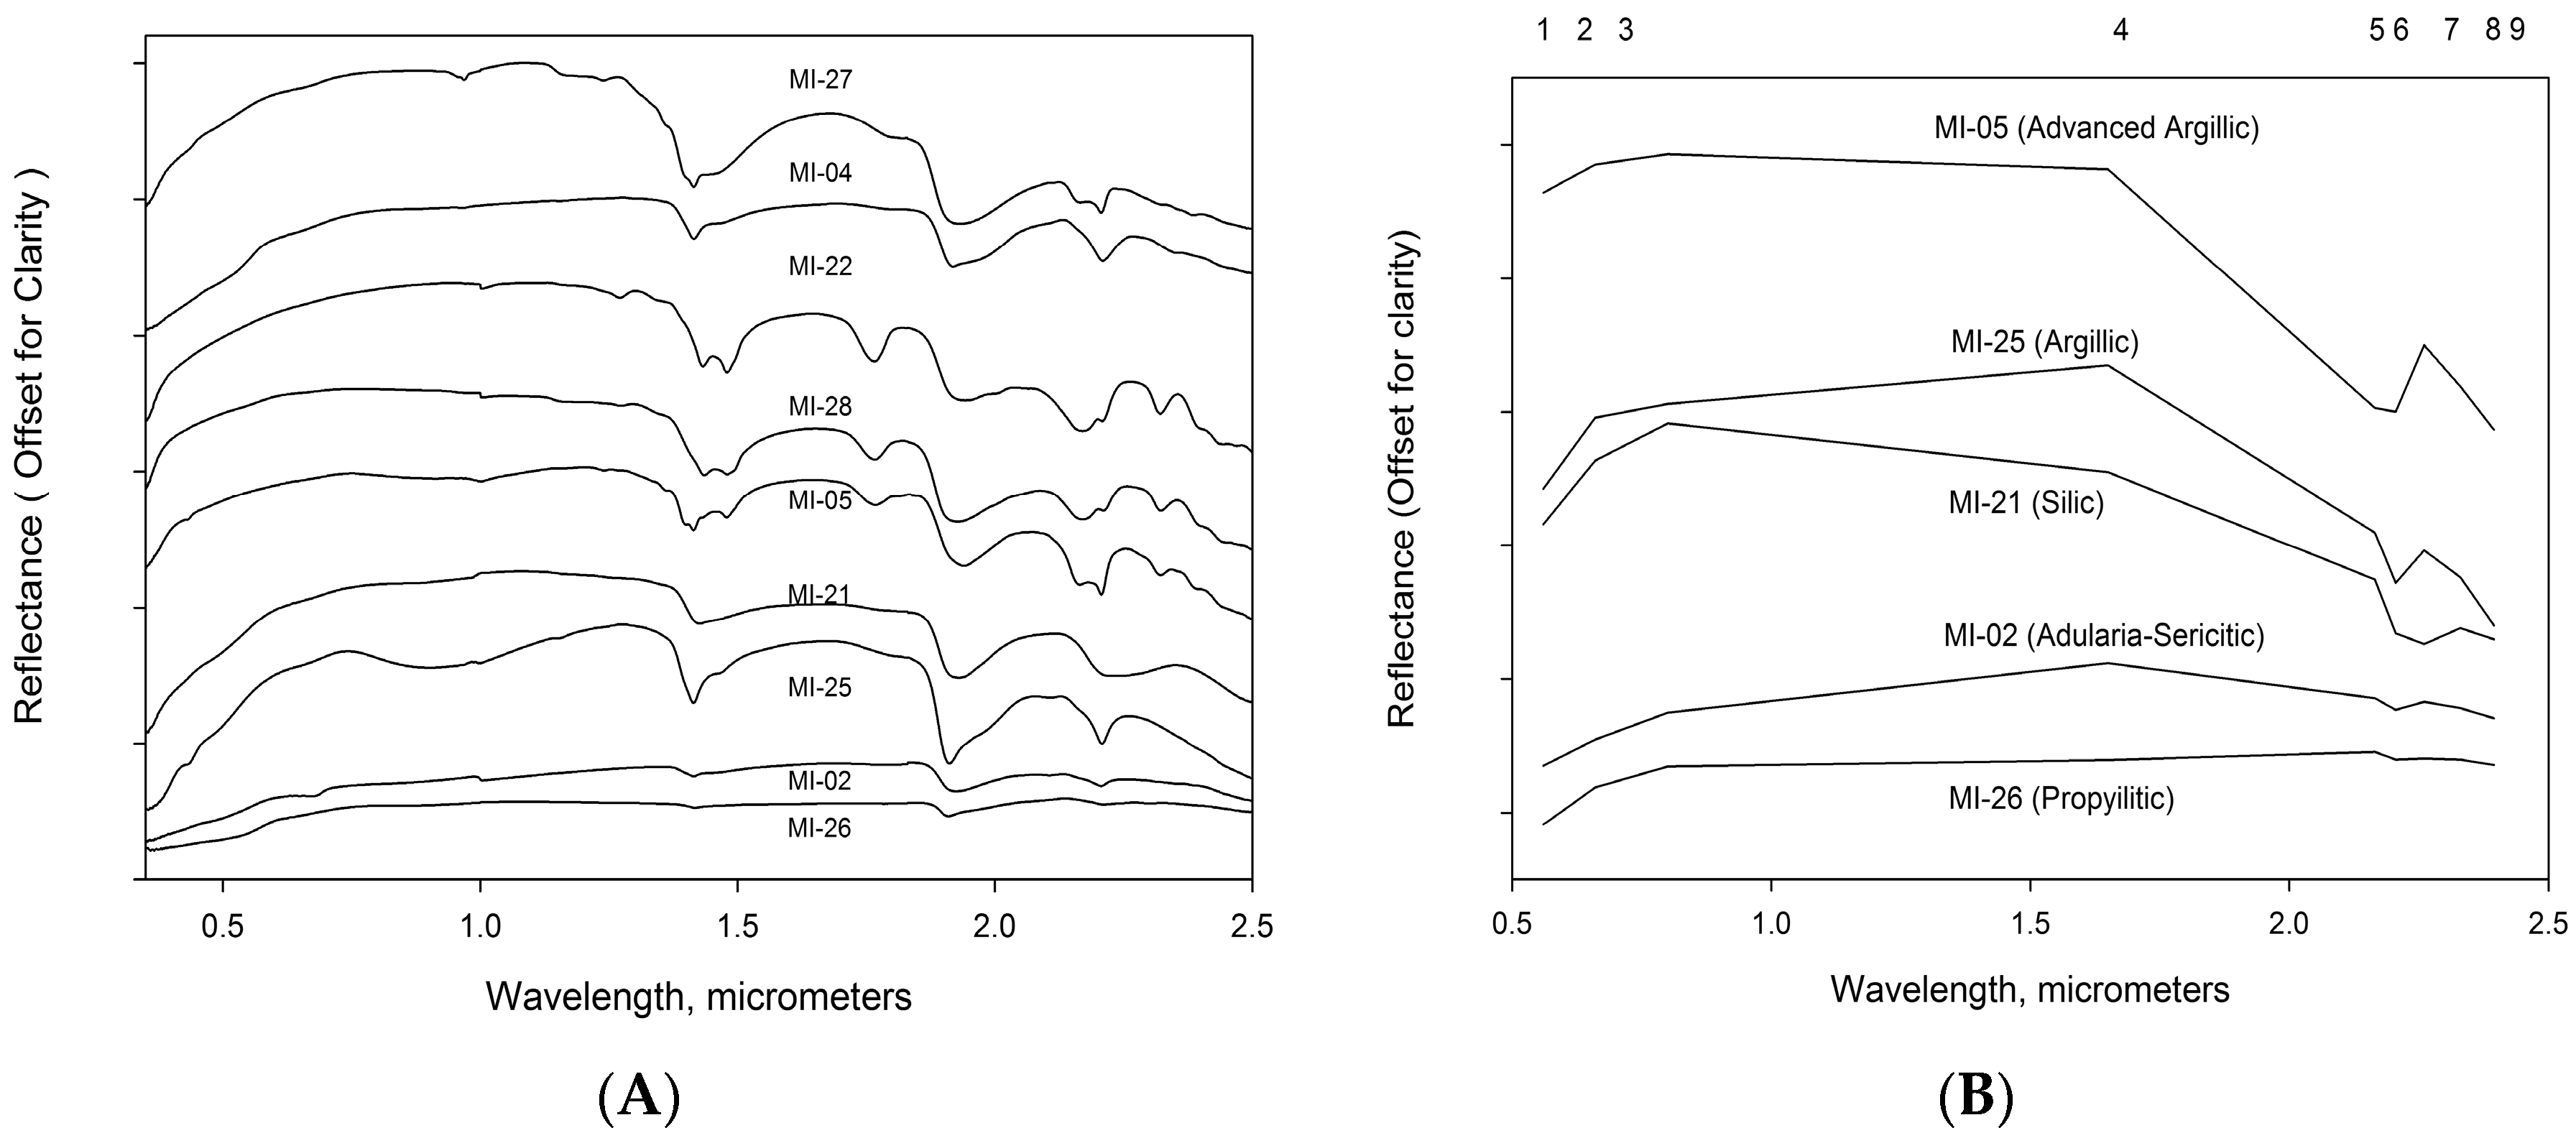
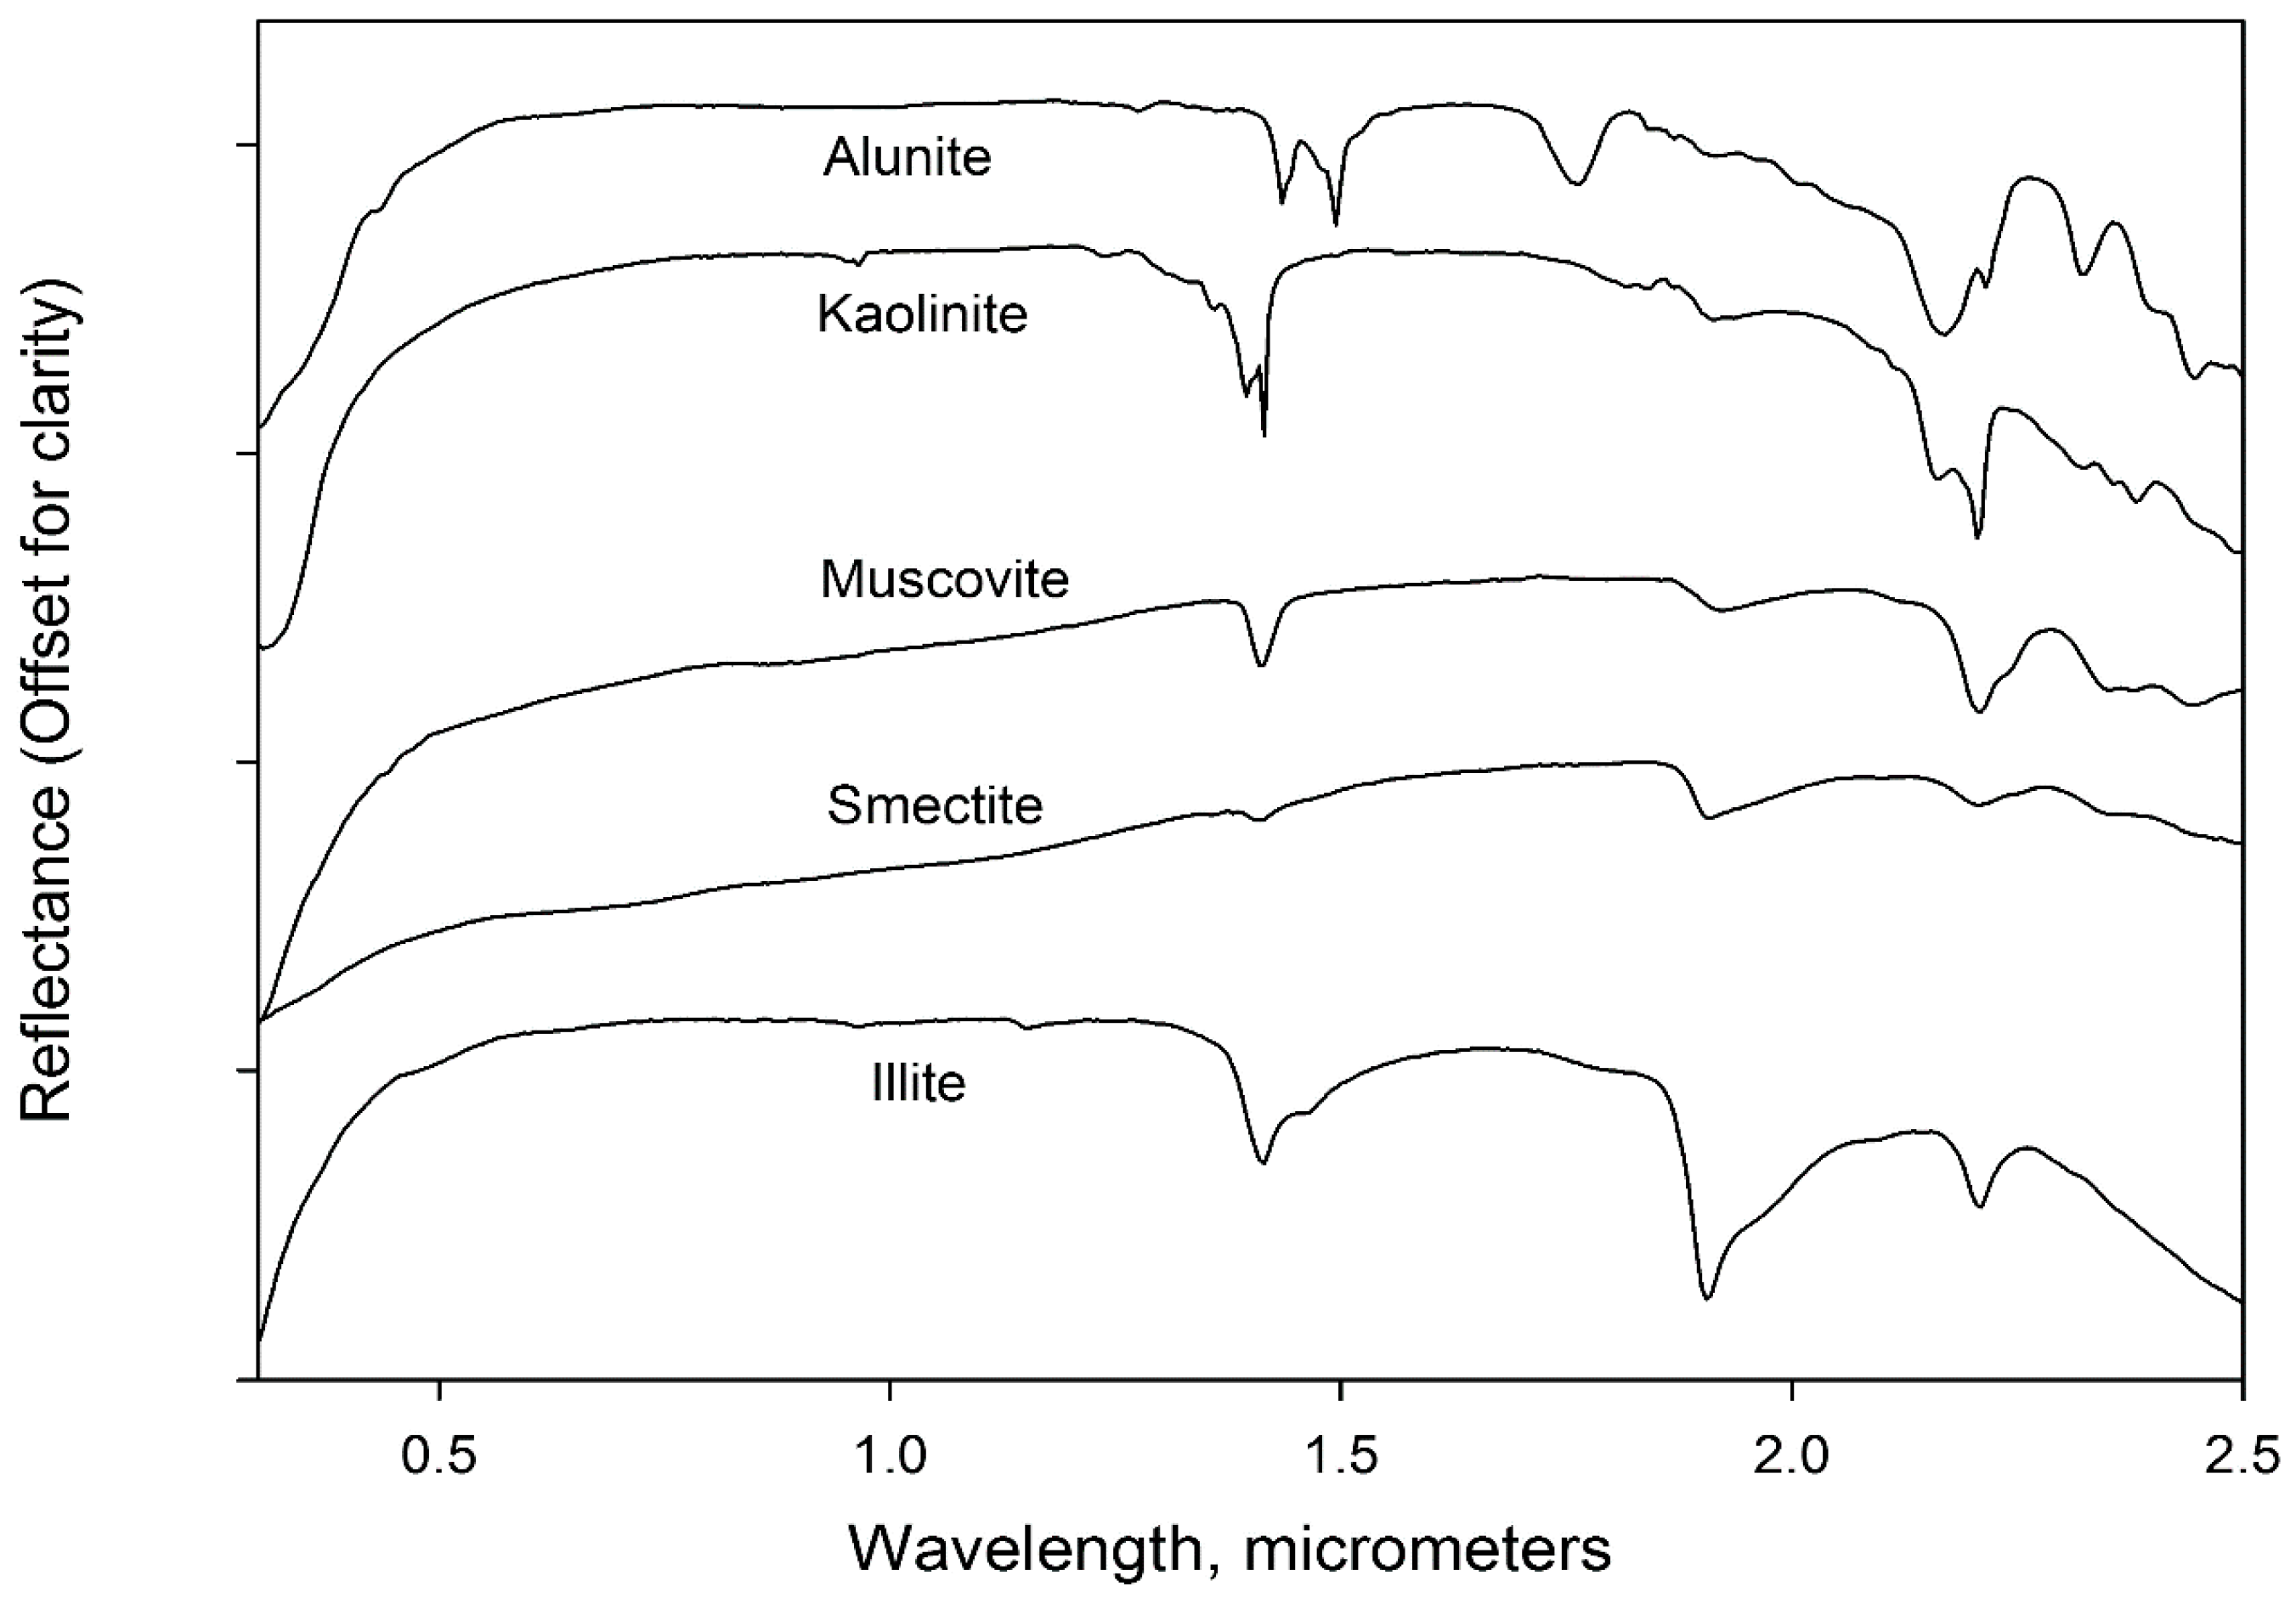
4.1. Spectral Reflectance
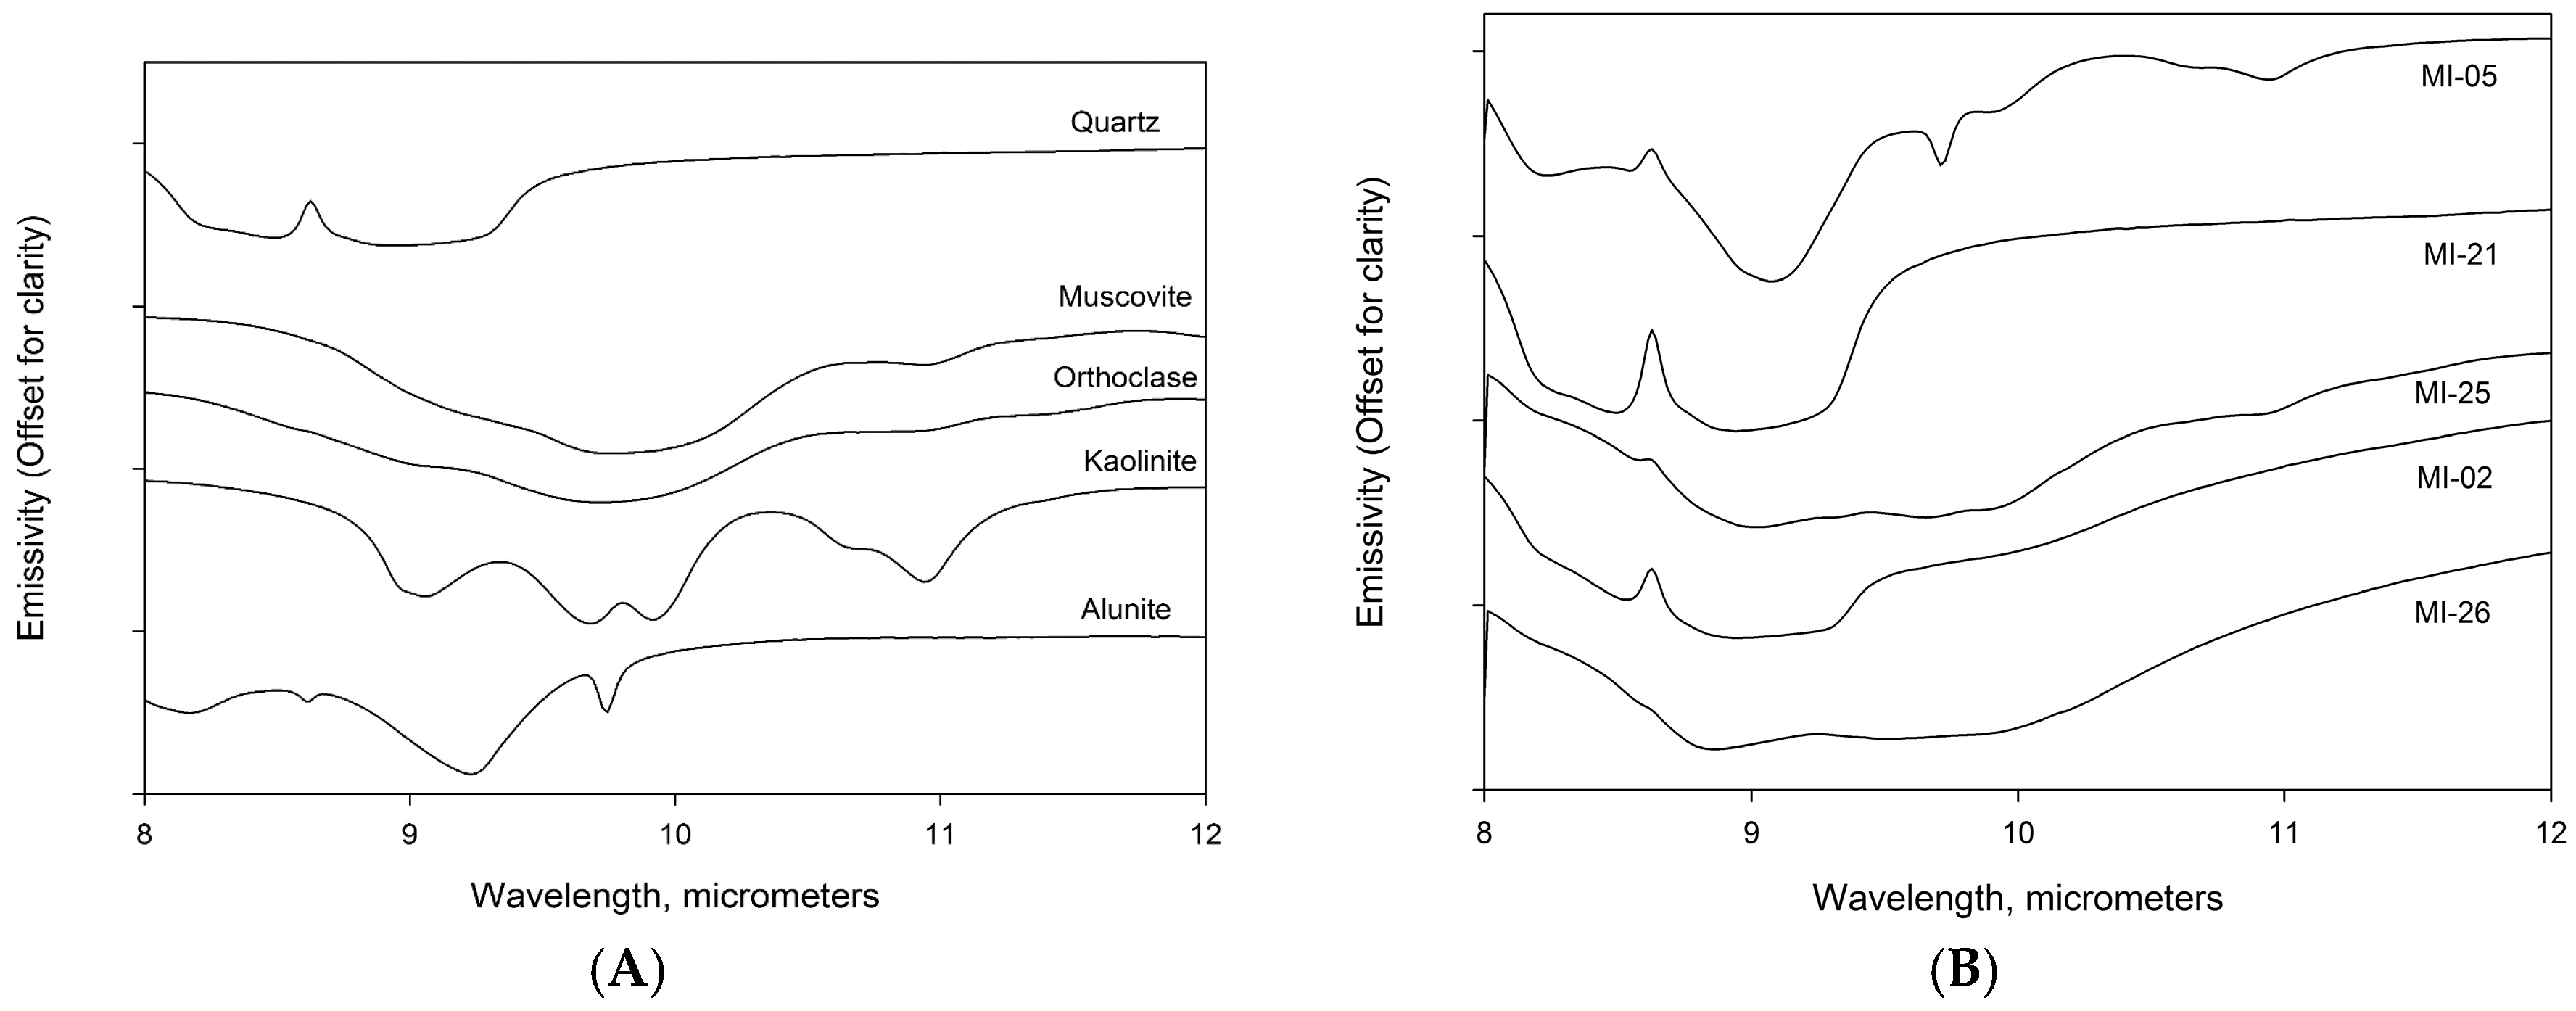
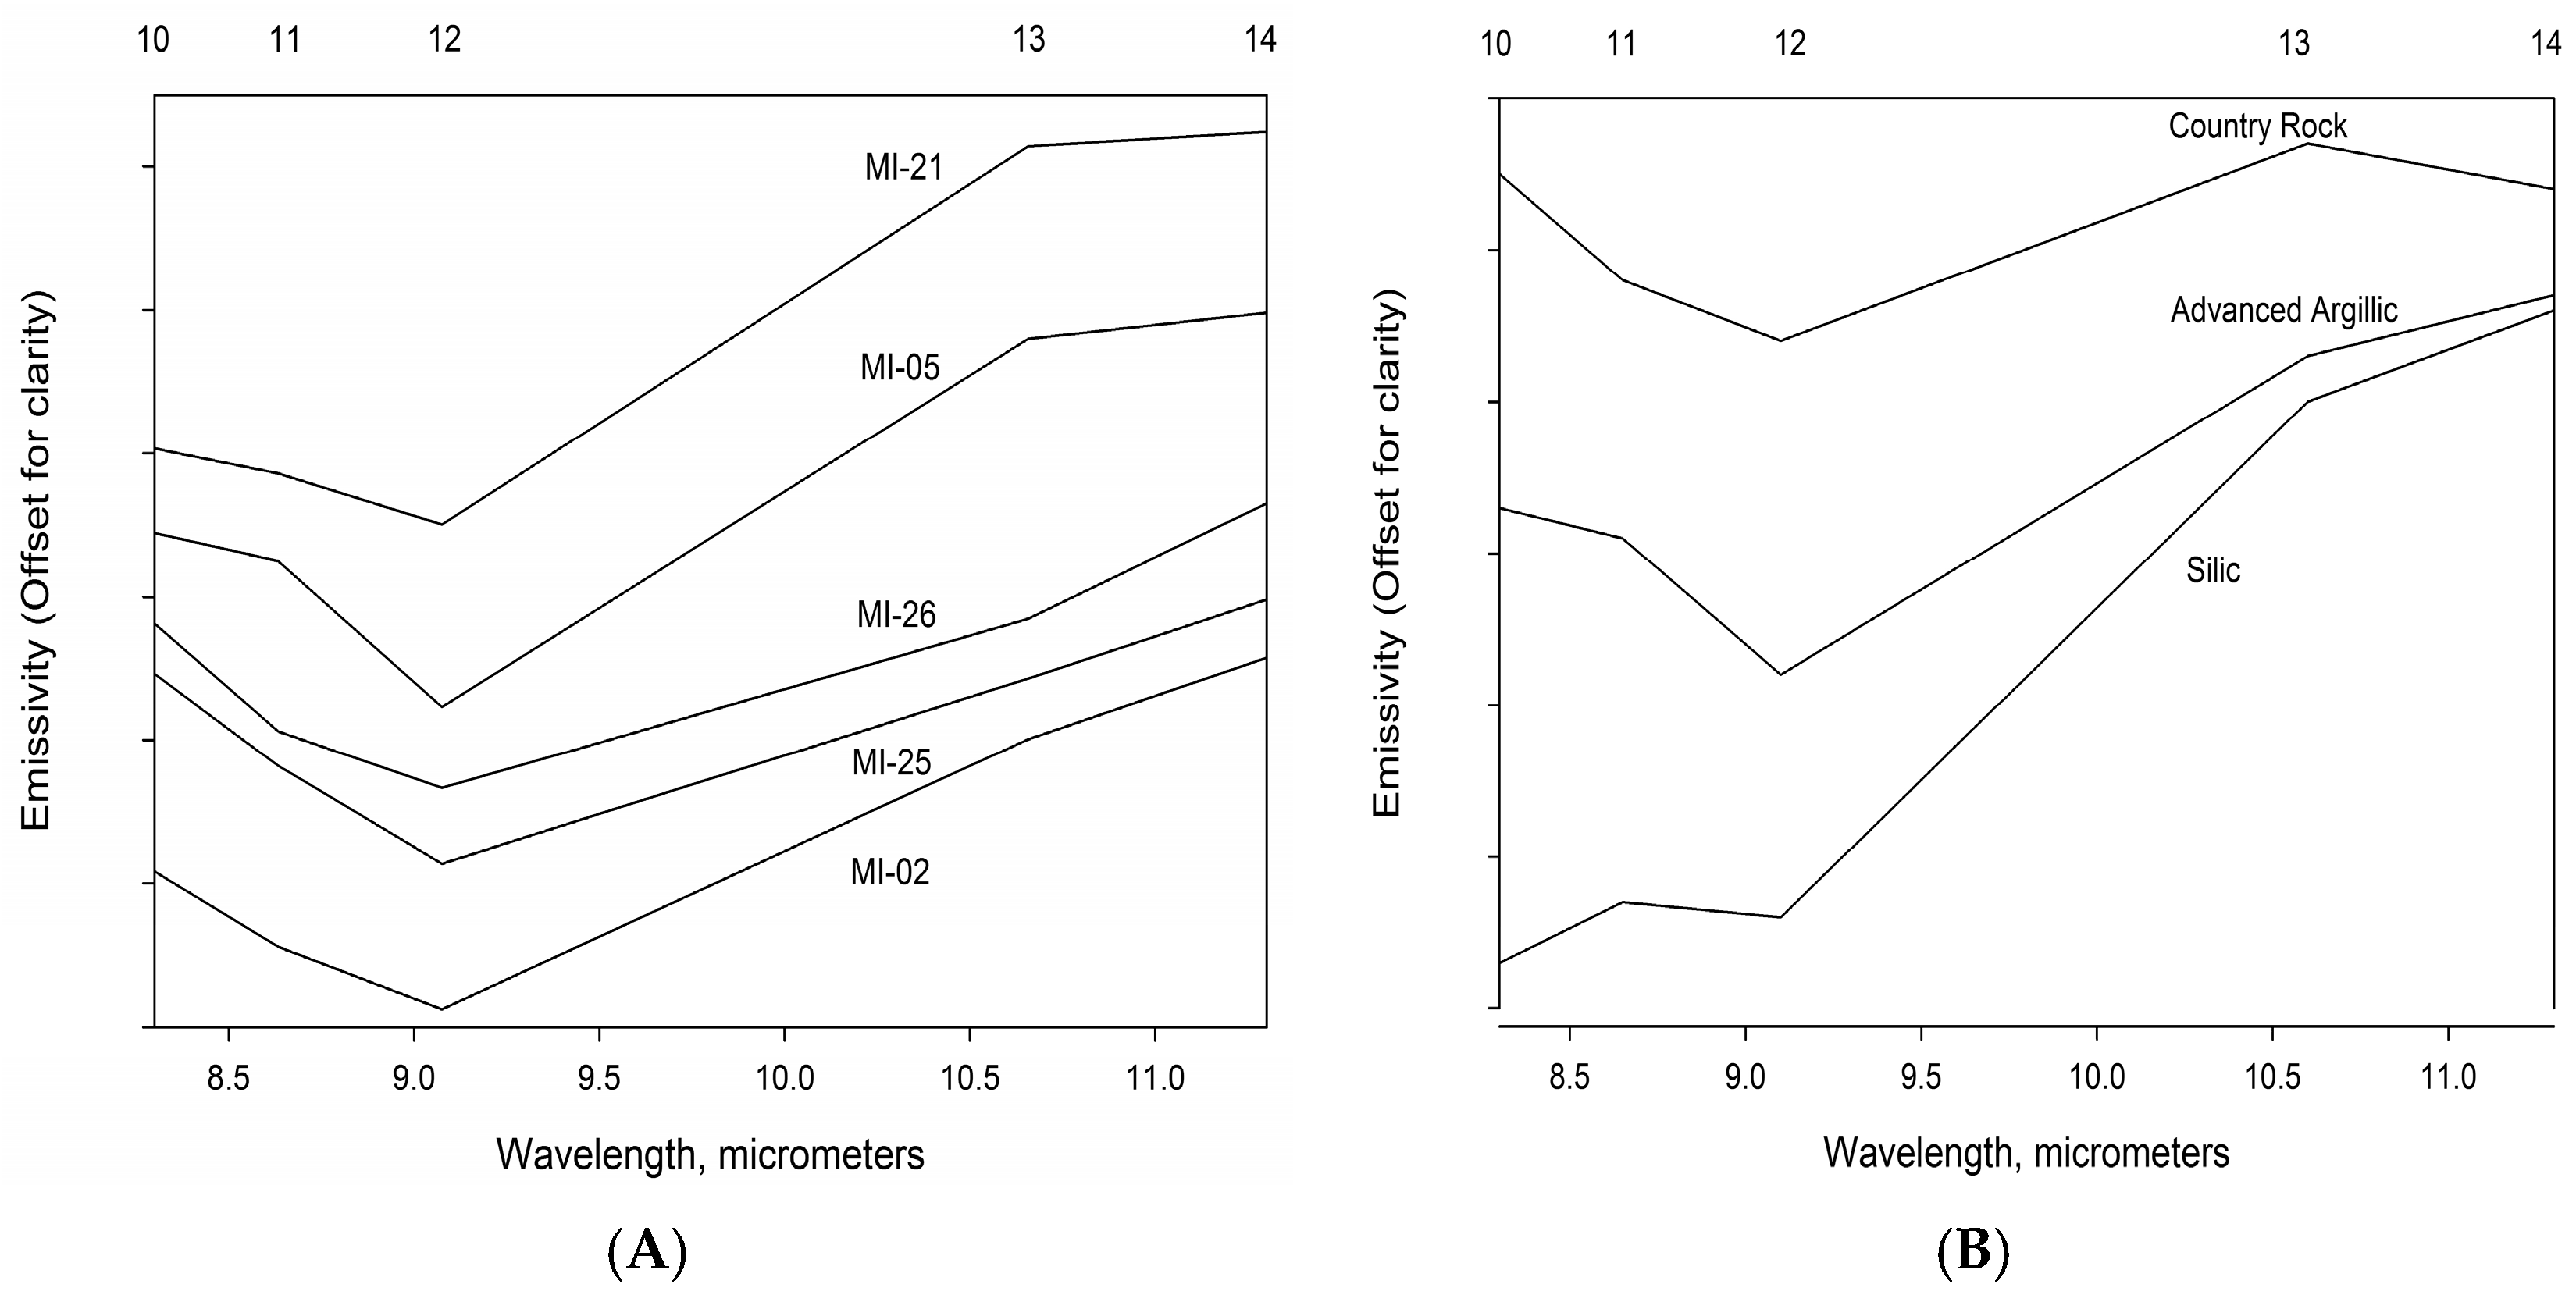
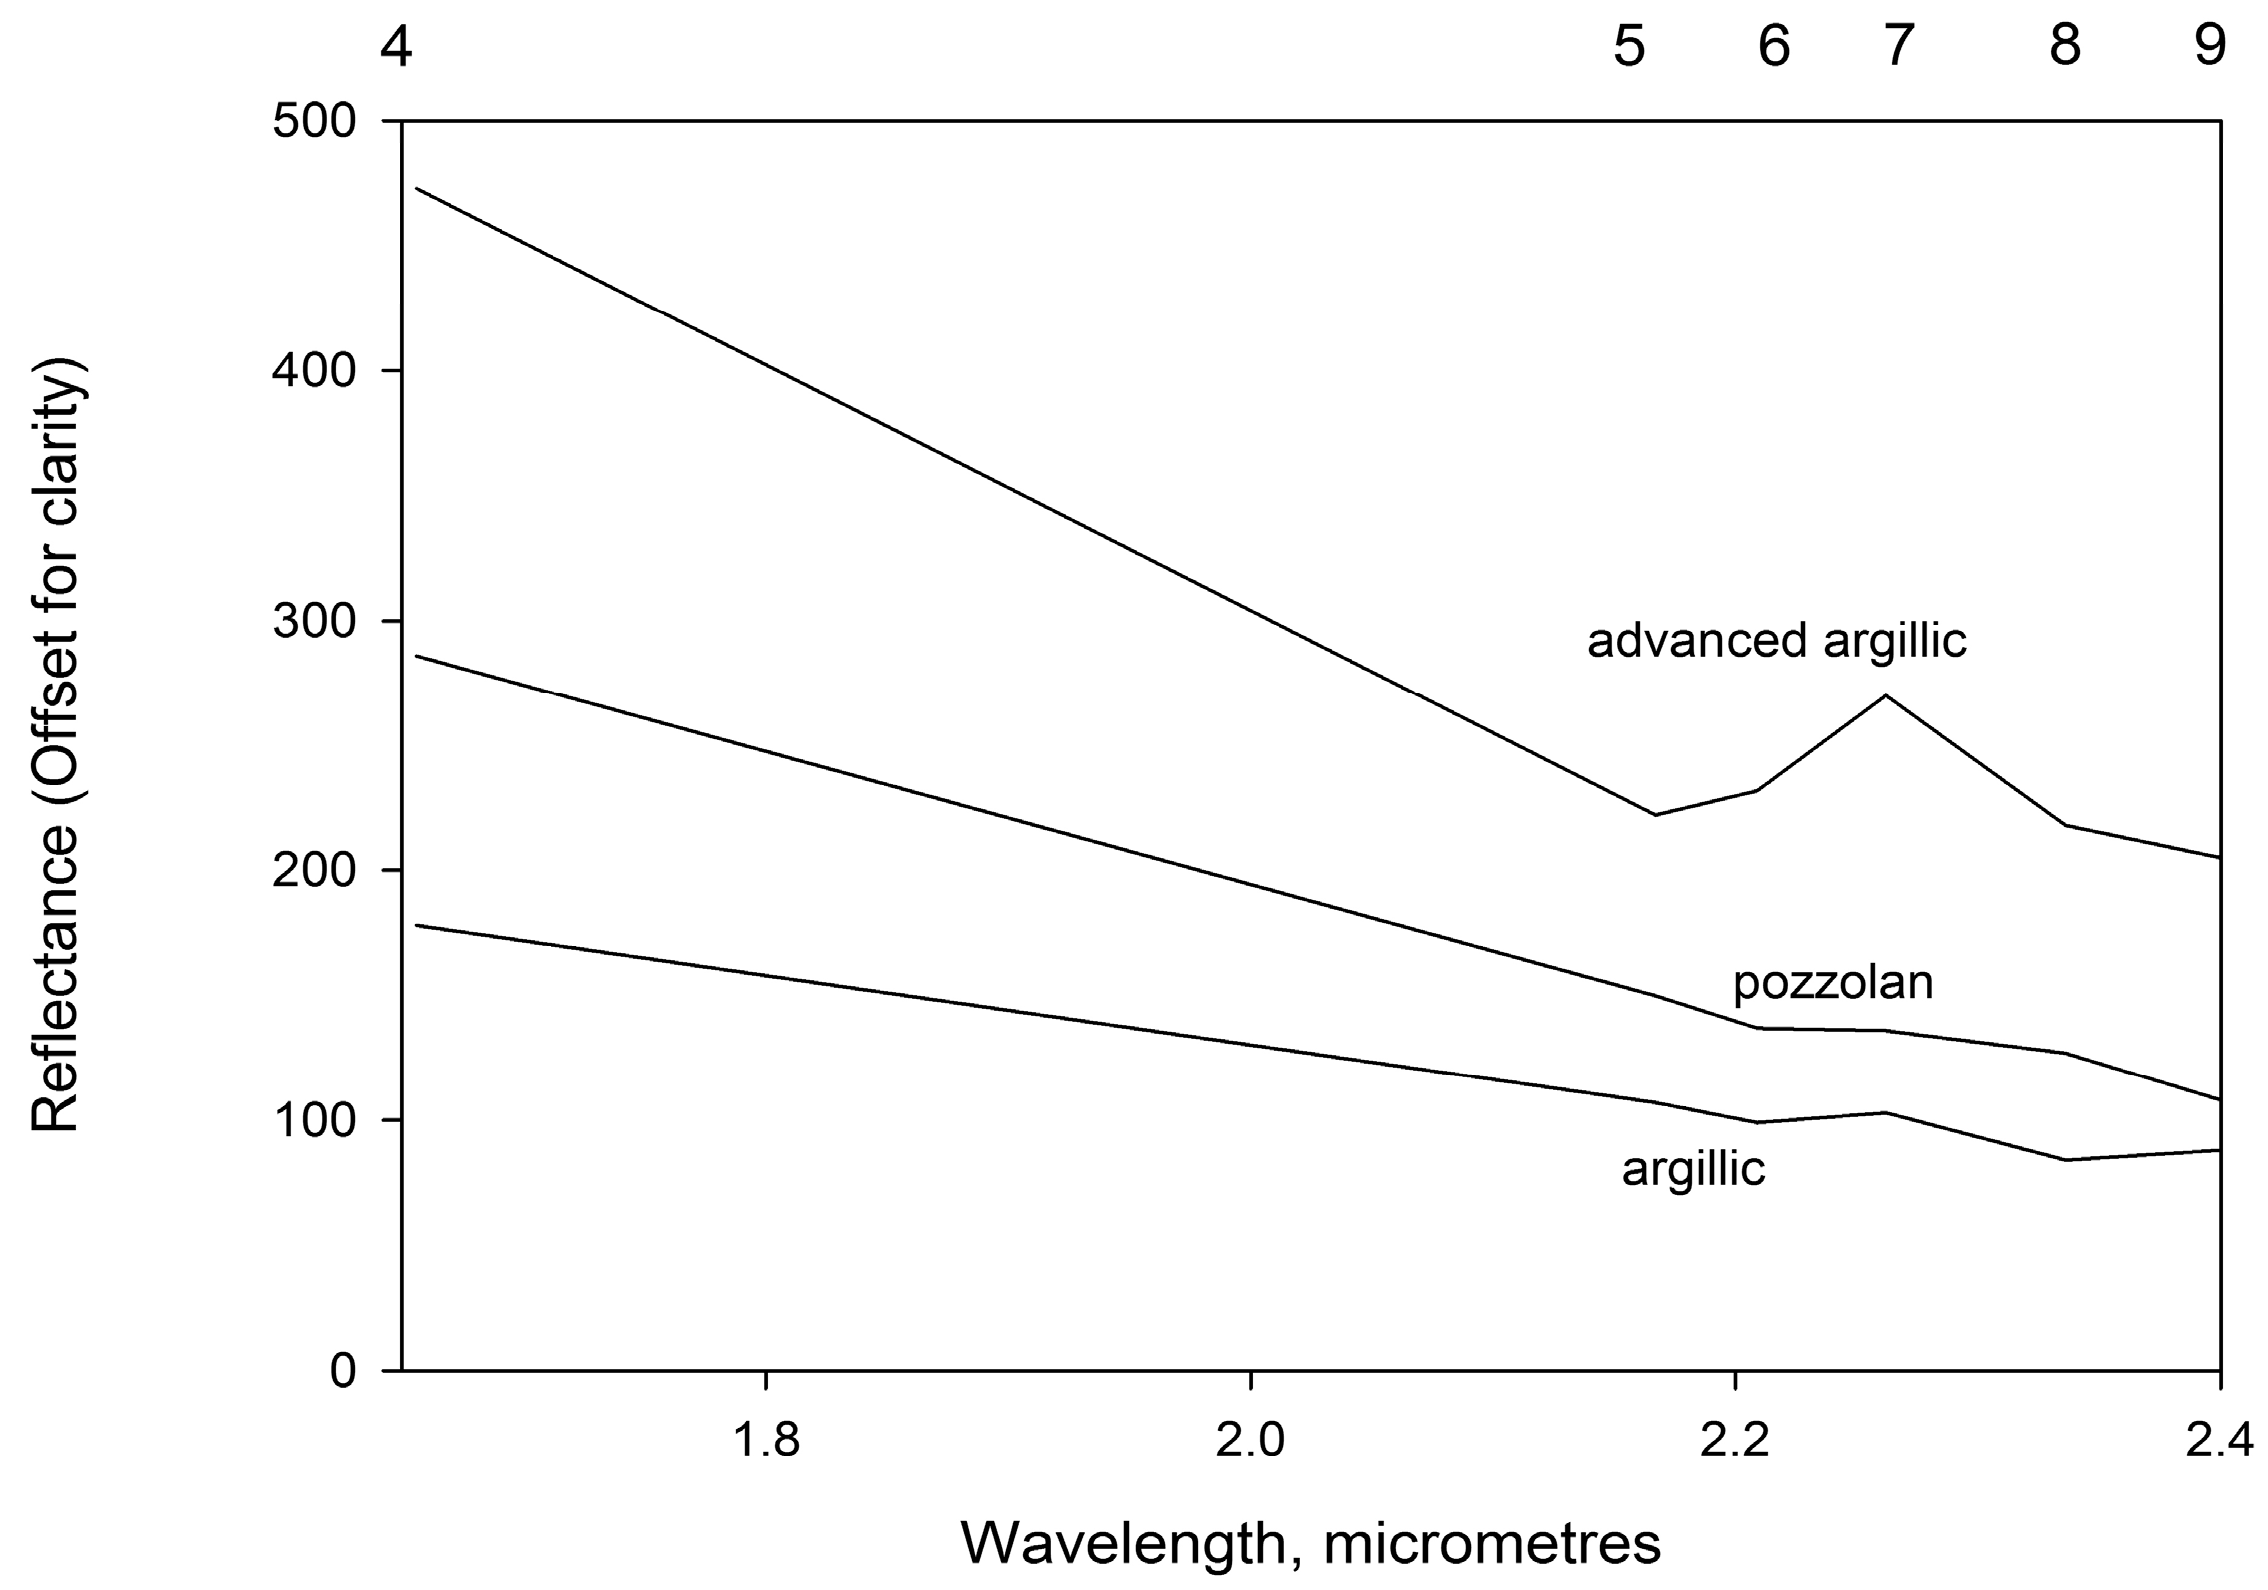
4.2. Spectral Emissivity
5. Results of ASTER Image Analysis
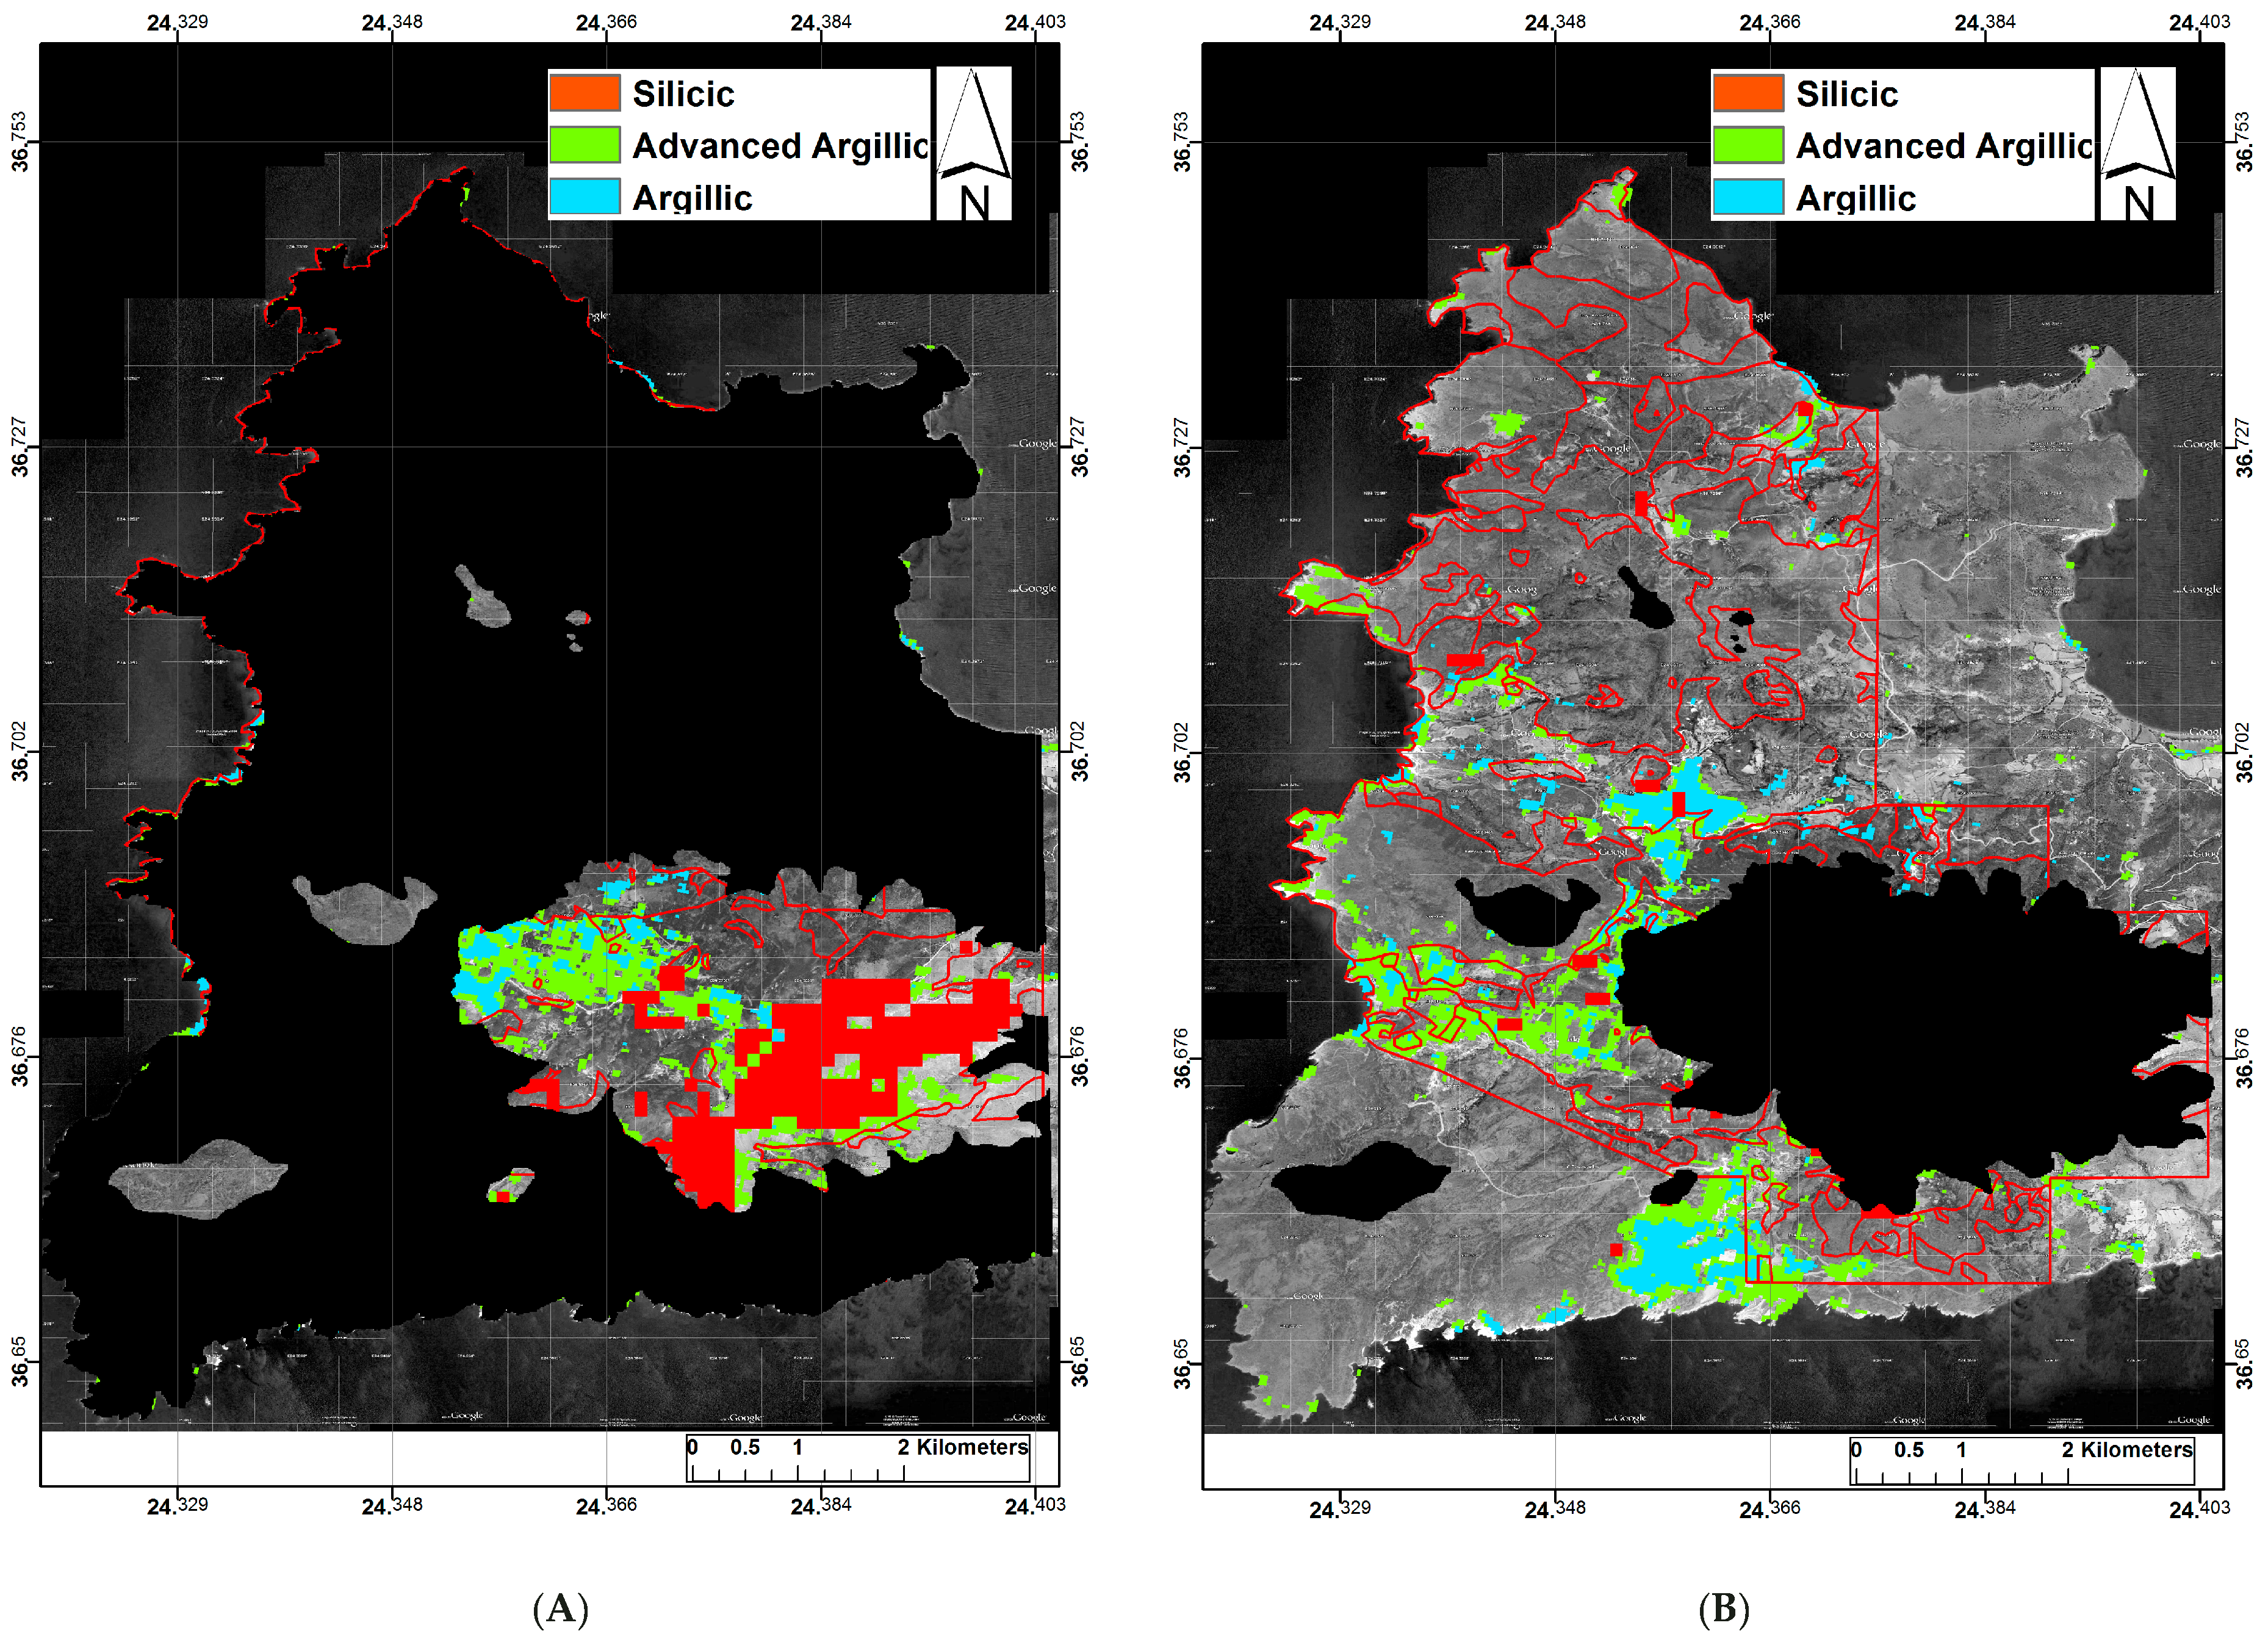
5.1. SWIR Data
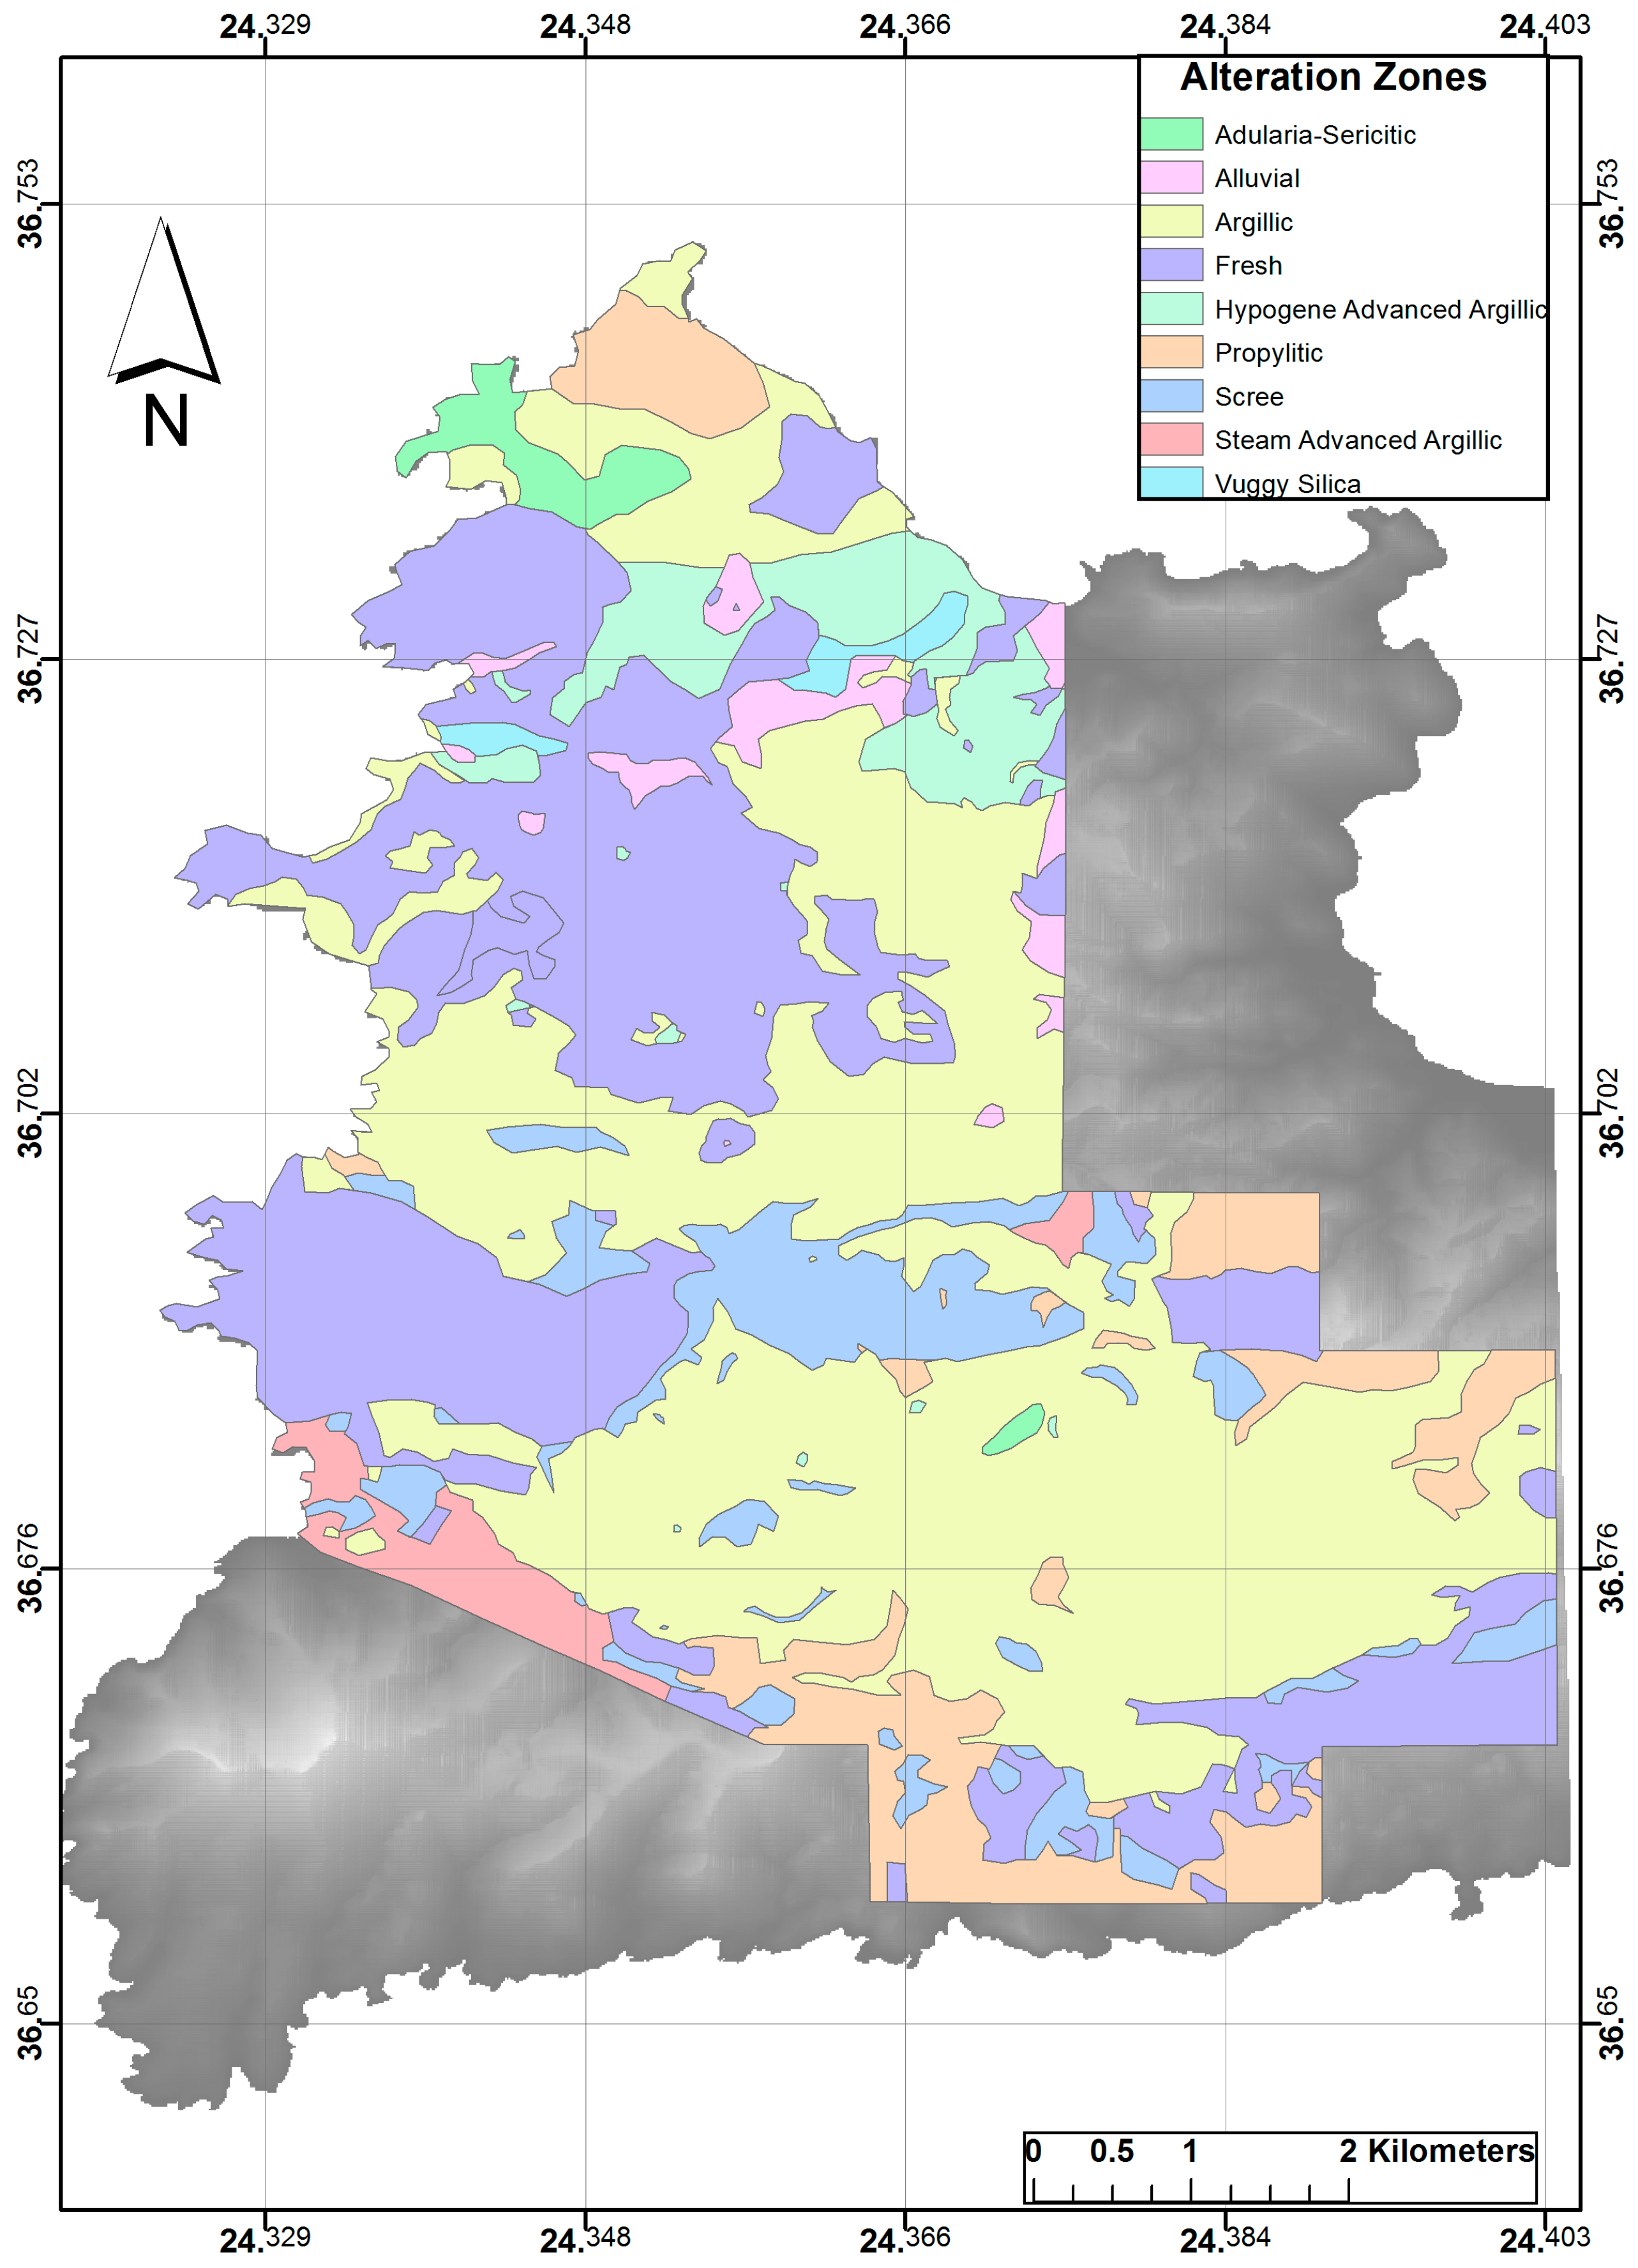
5.2. Results
5.3. TIR Data
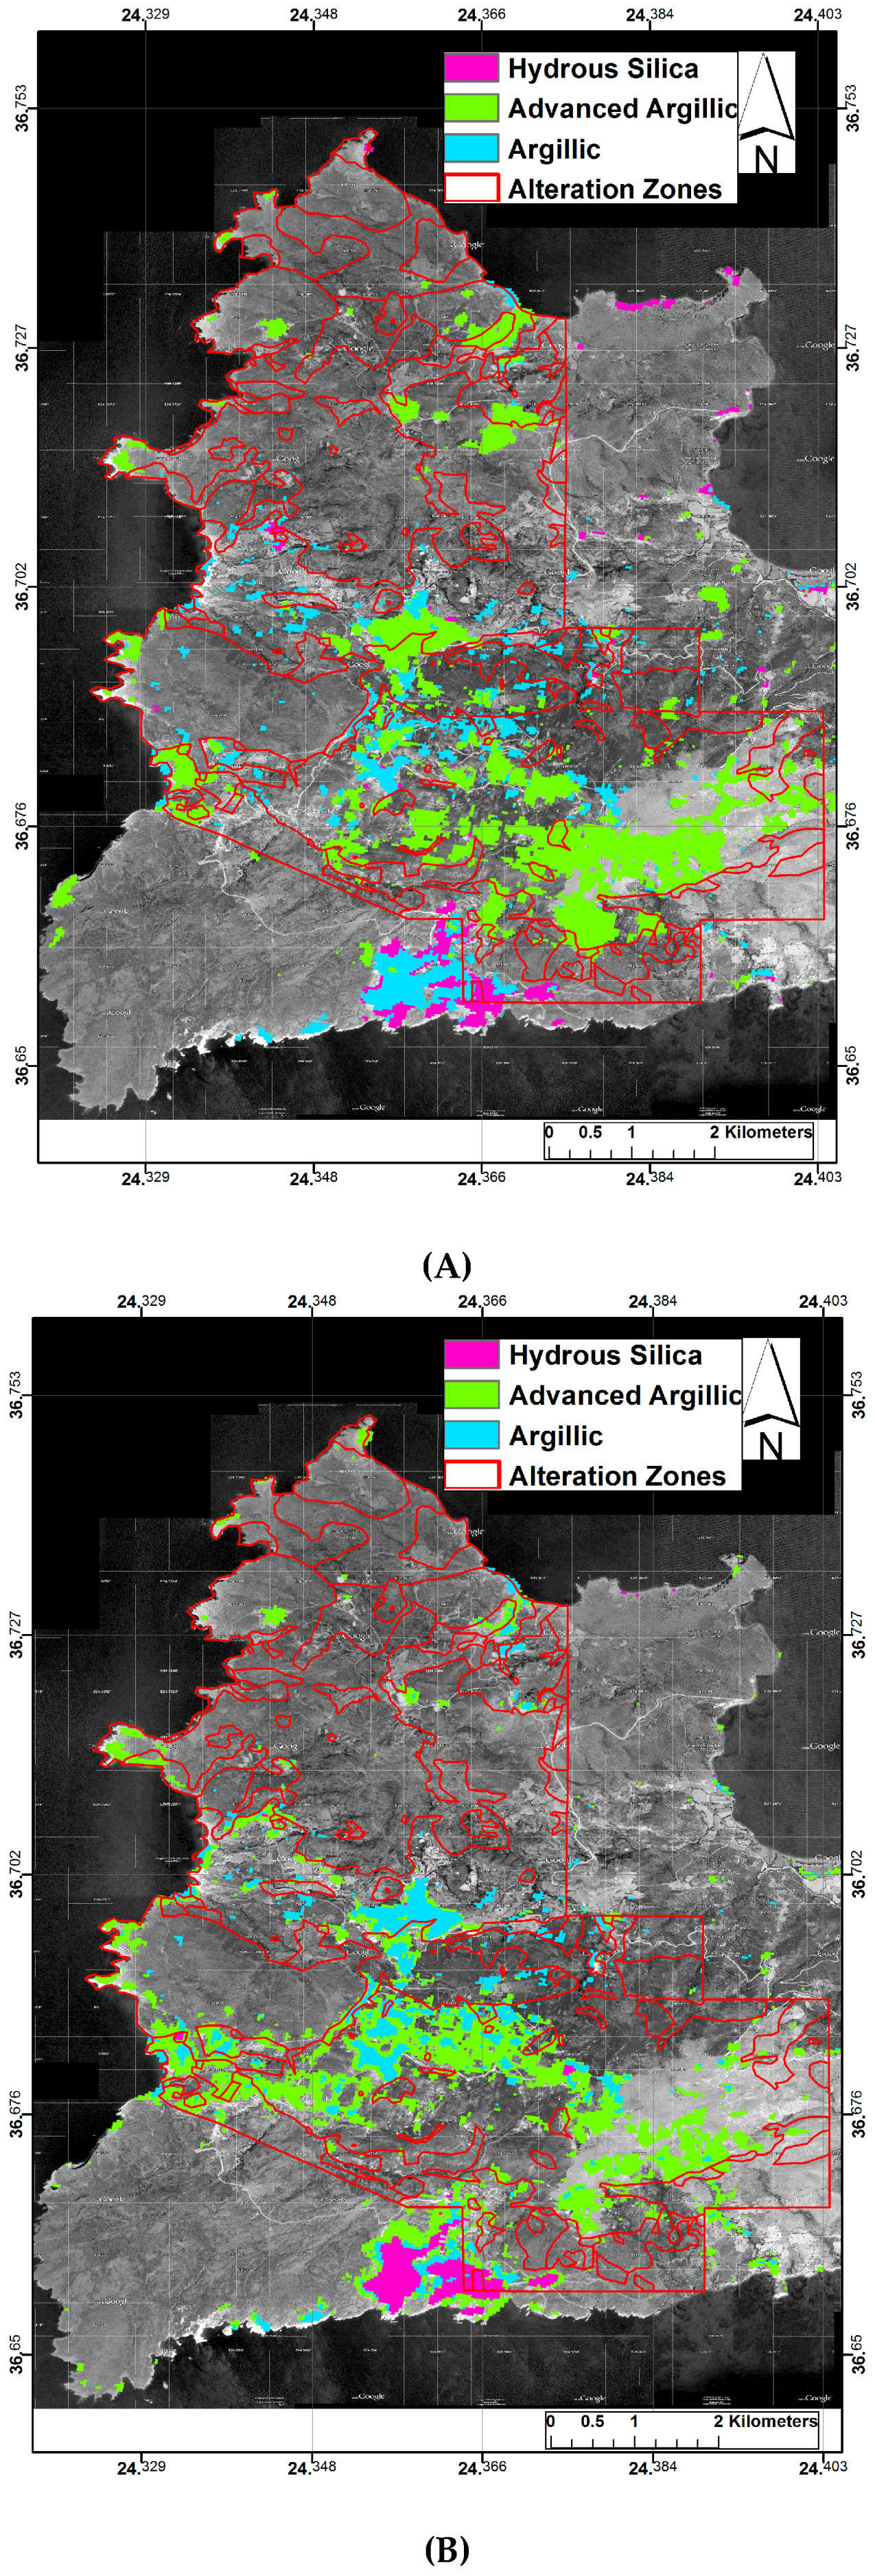
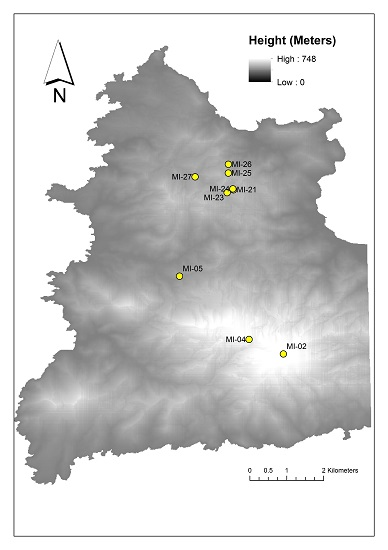
5.4. Integration of ASTER Mineralogical Maps with Topography
6. Discussion
7. Conclusions
Acknowledgments
Author Contributions
Conflicts of Interest
References
- Kilias, S.P. Microbial mat-related structures in the Quaternary Cape Vani manganese-oxide (-barite) deposit, NW Milos island, Greece. Microb. Mats Siliciclastic Depos. Syst. Time Soc. Sediment. Geol. Spec. Publ. 2012, 101, 97–110. [Google Scholar]
- Alfieris, D.; Voudouris, P.; Spry, P.G. Shallow submarine epithermal Pb–Zn–Cu–Au–Ag–Te mineralization on western Milos Island, Aegean Volcanic Arc, Greece: Mineralogical, geological and geochemical constraints. Ore Geol. Rev. 2013, 53, 159–180. [Google Scholar] [CrossRef]
- Naden, J.; Kilias, S.P.; Darbyshire, D.B.F. Active geothermal systems with entrained seawater as analogues for transitional continental magmato-ydrothermal and volcanic-hostedmassive sulfide mineralization—The example of Milos Island, Greece. Geology 2005, 33, 541–544. [Google Scholar] [CrossRef]
- Kilias, S.P.; Naden, J.; Cheliotis, I.; Shepherd, T.J.; Constandinidou, H.; Crossing, J.; Simos, I. Epithermal gold mineralisation in the active Aegean volcanic arc: The Profitis Ilias deposit, Milos Island, Greece. Miner. Depos. 2001, 36, 32–44. [Google Scholar] [CrossRef]
- Petersen, M.; Westhues, T.; Hannington, M.D.; Gemmell, J.B.; Sharpe, R.; Peters, M.; Strauss, H.; Lackschewitz, K.; Augustin, N.; Gibson, H.; et al. Drilling shallow-water massive sulfides at the Palinuro Volcanic Complex, Aeolian Island Arc, Italy. Econ. Geol. 2014, 109, 2129–2157. [Google Scholar] [CrossRef]
- Polymeanakou, P.N.; Godelitsas, A.; Argyraki, A.; Carey, S.; Gamalestsos, P.; Mertzimekis, T.J.; Stathopoulou, E.; Goettlicher, J.; Steininger, R.; Betzelou, K.; et al. New insights into hydrothermal vent processes in the unique shallow-submarine arc-volcano, Kolumbo (Santorini), Greece. Sci. Rep. 2013, 3. [Google Scholar] [CrossRef]
- Sherlock, R.L.; Roth, T.; Spooner, E.T.C.; Bray, C.J. Origin of the Eskay Creek precious metal-rich volcanogenic massive sulfide deposit: Fluid inclusion and stable isotope evidence. Econ. Geol. 1999, 94, 803–804. [Google Scholar] [CrossRef]
- Fujisada, H. Design and performance of ASTER instrument. Proc. SPIE 1995, 2583, 16–25. [Google Scholar]
- Hunt, G.R.; Ashley, P. Spectra of altered rocks in the visible and near infrared. Econ. Geol. 1979, 74, 1613–1629. [Google Scholar] [CrossRef]
- Clark, R.N.; Swayze, G.A.; Gallagher, A. Mapping minerals with imaging spectroscopy. US Geol. Surv. Off. Miner. Resour. Bull. 1993, 2039, 141–150. [Google Scholar]
- Abrams, M.; Hook, S.J. Simulated ASTER data for geologic studies. IEEE Trans. Geosci. Remote Sens. 1995, 33, 692–699. [Google Scholar]
- Ferrier, G.; Wadge, G. The application of imaging spectrometry data to mapping alteration zones associated with gold mineralization in southern Spain. Int. J. Remote Sens. 1996, 17, 331–350. [Google Scholar] [CrossRef]
- Ferrier, G.; White, K.; Griffiths, G.; Bryant, R.; Stefouli, M. The mapping of hydrothermal alteration zones on the island of Lesvos, Greece using an integrated remote sensing dataset. Int. Remote Sens. 2002, 23, 341–356. [Google Scholar] [CrossRef]
- Rowan, L.C.; Mars, J.C. Lithologic mapping in the mountain pass, California area using advanced spaceborne thermal emission and reflection radiometer (ASTER) data. Remote Sens. Environ. 2003, 84, 350–366. [Google Scholar] [CrossRef]
- Azizi, H.; Tarverdi, M.A.; Akbarpour, A. Extraction of hydrothermal alterations from ASTER SWIR data from east Zanjan, northern Iran. Adv. Space Res. 2010, 46, 99–109. [Google Scholar] [CrossRef]
- Haselwimmer, C.E.; Riley, T.R.; Liu, J.G. Assessing the potential of multispectral remote sensing for lithological mapping on the Antarctic Peninsula: Case study from Eastern Adelaide Island, Graham Land. Antarct. Sci. 2010, 22, 299–318. [Google Scholar] [CrossRef]
- Haselwimmer, C.E.; Riley, T.R.; Liu, J.G. Lithologic mapping in the Oscar II Coast area, Graham Land, Antarctic Peninsula using ASTER data. Int. J. Remote Sens. 2011, 32, 2013–2035. [Google Scholar] [CrossRef]
- Pour, A.M.; Hashim, M. The application of ASTER remote sensing data to porphyry copper and epithermal gold deposits. Ore Geol. Rev. 2012, 44, 1–9. [Google Scholar] [CrossRef]
- Rockwell, B.W. Description and Validation of an Automated Methodology for Mapping Mineralogy, Vegetation, and Hydrothermal Alteration Type from ASTER Satellite Imagery with Examples from the Sa Juan Mountains. In U.S. Geological Survey Scientific Investigations Map 3190; U.S. Geological Survey: Reston, VA, USA, 2012; p. 35. [Google Scholar]
- Van der Meer, F.; van der Werff, H.M.A.; van Ruitenbeek, F.J.A.; Hecker, C.A.; Bakker, W.H.; Noomen, M.F.; van der Meijde, M.; Carranza, E.J.M.; Boudewijn de Smeth, J.; Woldai, T. Multi- and hyperspectral geologic remote sensing: A review. Int. J. Appl. Earth Obs. Geoinform. 2012, 14, 112–128. [Google Scholar] [CrossRef]
- Salisbury, J.W. Infrared (2.1–25 um) spectra of minerals. In Johns Hopkins Studies in Earth and Space Sciences; Johns Hopkins University Press: Baltimore, MD, USA, 1991. [Google Scholar]
- Stewart, A.L.; McPhie, J. An upper Pliocene coarse pumice breccia generated by a shallow submarine explosive eruption, Milos, Greece. Bull. Volcanol. 2004, 66, 15–28. [Google Scholar] [CrossRef]
- Mars, J.C.; Rowan, L.C. Spectral assessment of new ASTER SWIR surface reflectance data products for spectroscopic mapping of rocks and minerals. Remote Sens. Environ. 2010, 114, 2011–2025. [Google Scholar] [CrossRef]
- Gillespie, A.; Rokugawa, S.; Matsunaga, T.; Cothern, J.; Hook, S.; Kahle, A. A temperature and emissivity separation algorithmfor advanced spaceborne thermal emission and reflection radiometer (ASTER) images. IEEE Trans. Geosci. Remote Sens. 1998, 36, 1113–1126. [Google Scholar] [CrossRef]
- Rockwell, B.W.; Hofstra, A.H. Identification of quartz and carbonate minerals across northern Nevada using ASTER thermal emissivity data—Implications for geologic mapping and mineral resource investigations in well-studied and frontier areas. Geosphere 2008, 4, 218–246. [Google Scholar] [CrossRef]
- Harsanyi, J.C.; Chang, C.I. Hyperspectral image classification and dimensionality reduction: An orthogonal subspace projection approach. IEEE Trans. Geosci. Remote Sens. 1994, 32, 779–785. [Google Scholar] [CrossRef]
- Baldridge, A.M.; Hook, S.J.; Grove, C.I.; Rivera, G. The ASTER Spectral Library Version 2.0. Remote Sens. Environ. 2009, 113, 711–715. [Google Scholar] [CrossRef]
- Boardman, J. Automating spectral unmixing of AVIRIS data using convex geometry concepts. In Summaries 4th Annual. JPL Airborne Geoscience Workshop; NASA Jet Propulsion Laboratory Publication 93–26: Boulder, CO, USA, 1993; Volume 1, pp. 11–14. [Google Scholar]
- Boardman, J.W. Leveraging the high dimensionality of AVIRIS data for improved subpixel target unmixing and rejection of false positives: Mixture tunded matched filtering. In Summaries of the Seventh JPL Airborne Geoscience Workshop; NASA Jet Propulsion Laboratory Publication 97–1: Boulder, CO, USA, 1998; pp. 55–56. [Google Scholar]
- Rowan, L.C.; Schmidt, R.G.; Mars, J.C. Distribution of hydrothermally altered rocks in the Reko Diq, Pakistan mineralized area based on spectral analysis of ASTER data. Remote Sens. Environ. 2006, 104, 74–87. [Google Scholar] [CrossRef]
- Christensen, P.R.; Bandfield, J.L.; Hamilton, V.E.; Howard, D.A.; Lane, M.D.; Piatek, J.L.; Stefanov, W.L. A thermal emission spectral library of rock-forming minerals. J. Geophys. Res. 2000, 105, 9735–9739. [Google Scholar] [CrossRef]


| Field Site | Sample Number | XRD Analyses: Minerals Present in % | Site Description |
|---|---|---|---|
| 1.1 | MI-02 | Orthoclase (38.7%), mica (7.6%), quartz (53.4%) | Vein material, adularia-sericite |
| 1.2 | MI-04 | Albite (13%), orthoclase (15%), halite (0.7%), kaolinite (1.5%), mica (11%), quartz (58.5%) | Altered volcanic |
| 1.3 | MI-05 | Alunite (21.8%), natro-alunite (14.8%), cristobalite (8.5%), tridymite (3.2%), kaolinite (17%), quartz (34.5%) | Kaolinite mine, advanced argillic |
| 3.1 | MI-21 | Quartz (99.7%) | Silicified, silicious sinter |
| 3.1 | MI-22 | Alunite (29.2%), natro-alunite (9.3%), quartz (61.2%) | ltered volcanics |
| 3.2 | MI-25 | amorphous (22.7%), andesine (8.7%), sanidene (16.3%), Cristobalite (26%), kaolinite (5.9%), smectite (6.3%), quartz (13.7%) | Argillic, volcanics sericitic to advanced argillic |
| 3.3 | MI-26 | Andesine (52.7%), sanidene (14.7%), cristobalite (22.1%), hematite (1.8%), quartz (5%), smectite present | Propylitic, volcanics |
| 3.4 | MI-27 | Barite (7.6%), halite (1.1%), kaolinite (70.6%), quartz (20.7%) | Kaolinite quarry |
| 3.5 | MI-28 | Alunite (22.4%), natro-alunite (18.2%), cristobalite (23.7%), tridymite (28.6%), quartz (6.7%) | Silica cap rock |
| Waverange | VNIR | SWIR | TIR | |||
|---|---|---|---|---|---|---|
| Band number and spectral bandwidths (μm) | 1 | 0.520–0.600 | 4 | 1.600–1.700 | 10 | 8.125–8.475 |
| 2 | 0.630–0.690 | 5 | 2.145–2.185 | 11 | 8.475–8.825 | |
| 3N | 0.780–0.860 | 6 | 2.185–2.225 | 12 | 8.925–9.275 | |
| 3B | 0.780–0.860 | 7 | 2.235–2.285 | 13 | 10.250–10.950 | |
| 8 | 2.295–2.365 | 14 | 10.950–11.650 | |||
| 9 | 2.360–2.430 | |||||
| Spatial Resolution (m) | 15 | 30 | 90 | |||
| Index | Band Ratios |
|---|---|
| Alunite-Kaolinite-Pyrophyllite | (4 + 6)/5 |
| Sericitic-Illite-Smectite | (5+7)/6 |
| Hydrous Silica-Jarosite-Sericite | (5 + 8)/(6 + 7) |
| Quartz Index | (11/10 + 12) × 13/14) |
© 2016 by the authors; licensee MDPI, Basel, Switzerland. This article is an open access article distributed under the terms and conditions of the Creative Commons Attribution (CC-BY) license (http://creativecommons.org/licenses/by/4.0/).
Share and Cite
Ferrier, G.; Naden, J.; Ganas, A.; Kemp, S.; Pope, R. Identification of Multi-Style Hydrothermal Alteration Using Integrated Compositional and Topographic Remote Sensing Datasets. Geosciences 2016, 6, 36. https://doi.org/10.3390/geosciences6030036
Ferrier G, Naden J, Ganas A, Kemp S, Pope R. Identification of Multi-Style Hydrothermal Alteration Using Integrated Compositional and Topographic Remote Sensing Datasets. Geosciences. 2016; 6(3):36. https://doi.org/10.3390/geosciences6030036
Chicago/Turabian StyleFerrier, Graham, Jon Naden, Athanassios Ganas, Simon Kemp, and Richard Pope. 2016. "Identification of Multi-Style Hydrothermal Alteration Using Integrated Compositional and Topographic Remote Sensing Datasets" Geosciences 6, no. 3: 36. https://doi.org/10.3390/geosciences6030036
APA StyleFerrier, G., Naden, J., Ganas, A., Kemp, S., & Pope, R. (2016). Identification of Multi-Style Hydrothermal Alteration Using Integrated Compositional and Topographic Remote Sensing Datasets. Geosciences, 6(3), 36. https://doi.org/10.3390/geosciences6030036