Article

Screening the Resilience of Short-Rotation Woody Crops to Climate Change

Department of Forestry, Michigan State University, 126 Natural Resources Building, East Lansing, MI 48824-1222, USA
Geosciences 2016, 6(1), 7; https://doi.org/10.3390/geosciences6010007
Submission received: 3 December 2015 / Revised: 8 January 2016 / Accepted: 19 January 2016 / Published: 26 January 2016
(This article belongs to the Special Issue Climate Change and Geosciences)

Abstract

:
Sustainable woody biofeedstock production systems require a reliable supply of woody biomass that could be affected by future climate change. However, there is limited understanding of the climatic sensitivity of short rotation woody crops, such as hybrid aspens. The general objective of this study is to identify climatically resilient hybrid aspen clones for woody biomass feedstock development. Specifically, tree-ring analysis methods (dendrochronology) were used to quantify the influence of climate on stem growth rates of hybrid aspens by measuring year-to-year changes in tree-ring width from different cultivars of hybrid aspen and relating annual growth patterns with past instrumental climate records (i.e., temperature and moisture index). Tree-ring analysis was conducted on a full-sib progeny plantation of different cultivars of hybrid aspens (Populus × smithii derived from different geographical variants of aspen parents: trembling aspen (Populus tremuloides) and bigtooth aspen (Populus grandidentata) located on Michigan State University property in the Sandhill Research Area (42.7°N latitude; 84.5°W longitude). Overall, the hybrid aspen families examined in this study were more sensitive to moisture related stressors compared to a weaker or no response to temperature stressors. By the end of the 21st century (2071–2100), 11 out of the 18 hybrid aspen families will be vulnerable to future changes in moisture stress, while the remaining families were screened to be resilient to future changes in moisture stress.

1. Introduction

Rising energy costs and the non-renewable nature of petroleum based energy sources have created the rationale to develop renewable energy sources [1,2]. Woody biomass is a renewable resource that can serve as a feedstock to produce electricity and heat (bioenergy), as well as liquid fuels such as ethanol (biofuels) which in turn helps displace fossil fuel use [3,4]. If properly managed, woody biomass feedstocks for bioenergy and biofuels production have the potential to be carbon neutral [5].
The most common species used for short rotation forestry occur in the genus Populus and Salix [3,4,5]. In particular, hybrid poplars have been tapped as an important biofeedstock resource in which productivity gains can be realized over very short rotations of less than 10 years [5,6]. Hybrid poplars are derived from both natural and anthropogenic crosses among poplar species [7]. In the North-Central United States, the potential yield of hybrid poplar plantations can reach 27–45 m3·ha−1·yr−1 [8]. However, there is limited understanding of the climatic sensitivity (e.g., degree of drought tolerance) of hybrid poplars [5]. Most genetic tree-improvement programs are geared towards improving growth traits (e.g., height, diameter, volume) [9,10] without consideration of the climatic effects on such growth traits. Effects of climatic factors have been examined for hybrid poplars [11,12] and generally consist of short term (<5 years) ecophysiological studies [13,14,15,16,17]. Headlee et al. [18] parameterized a process-based model called Physiological Principles Predicting Growth (3-PG) to estimate mean annual biomass productivity of hybrid poplars and the model was partly driven by climatic parameters.
Tree-ring analyses represent an alternative and insightful approach to reveal past climatic drivers of tree growth at longer term time scales [19,20,21], and has been an underutilized tool to assess climatic sensitivity of hybrid poplars although it has been applied to poplar species, in particular trembling aspen (Populus tremuloides Michx.) [22,23,24]. A previous study examined the physiological ecology of hybrid aspens in Michigan [25].
There is a growing need for identifying hybrid aspen genotypes that are resilient to future climatic change [3,4,26,27]. The objective of this study is to elucidate the impact of future climate change over the 21st century on different genotypes of hybrid aspen planted in a Michigan State University (MSU) research property in the Lower Peninsula region of Michigan. The study is pertinent to advancing knowledge in geosciences since it examines the interactions between the terrestrial biosphere, atmosphere, and hydrosphere. The study provides strategic understanding to adapt forest land management practices to climate change in order to secure the future sustainability of forest resources.

2. Methods

2.1. Study Area and Field Sampling
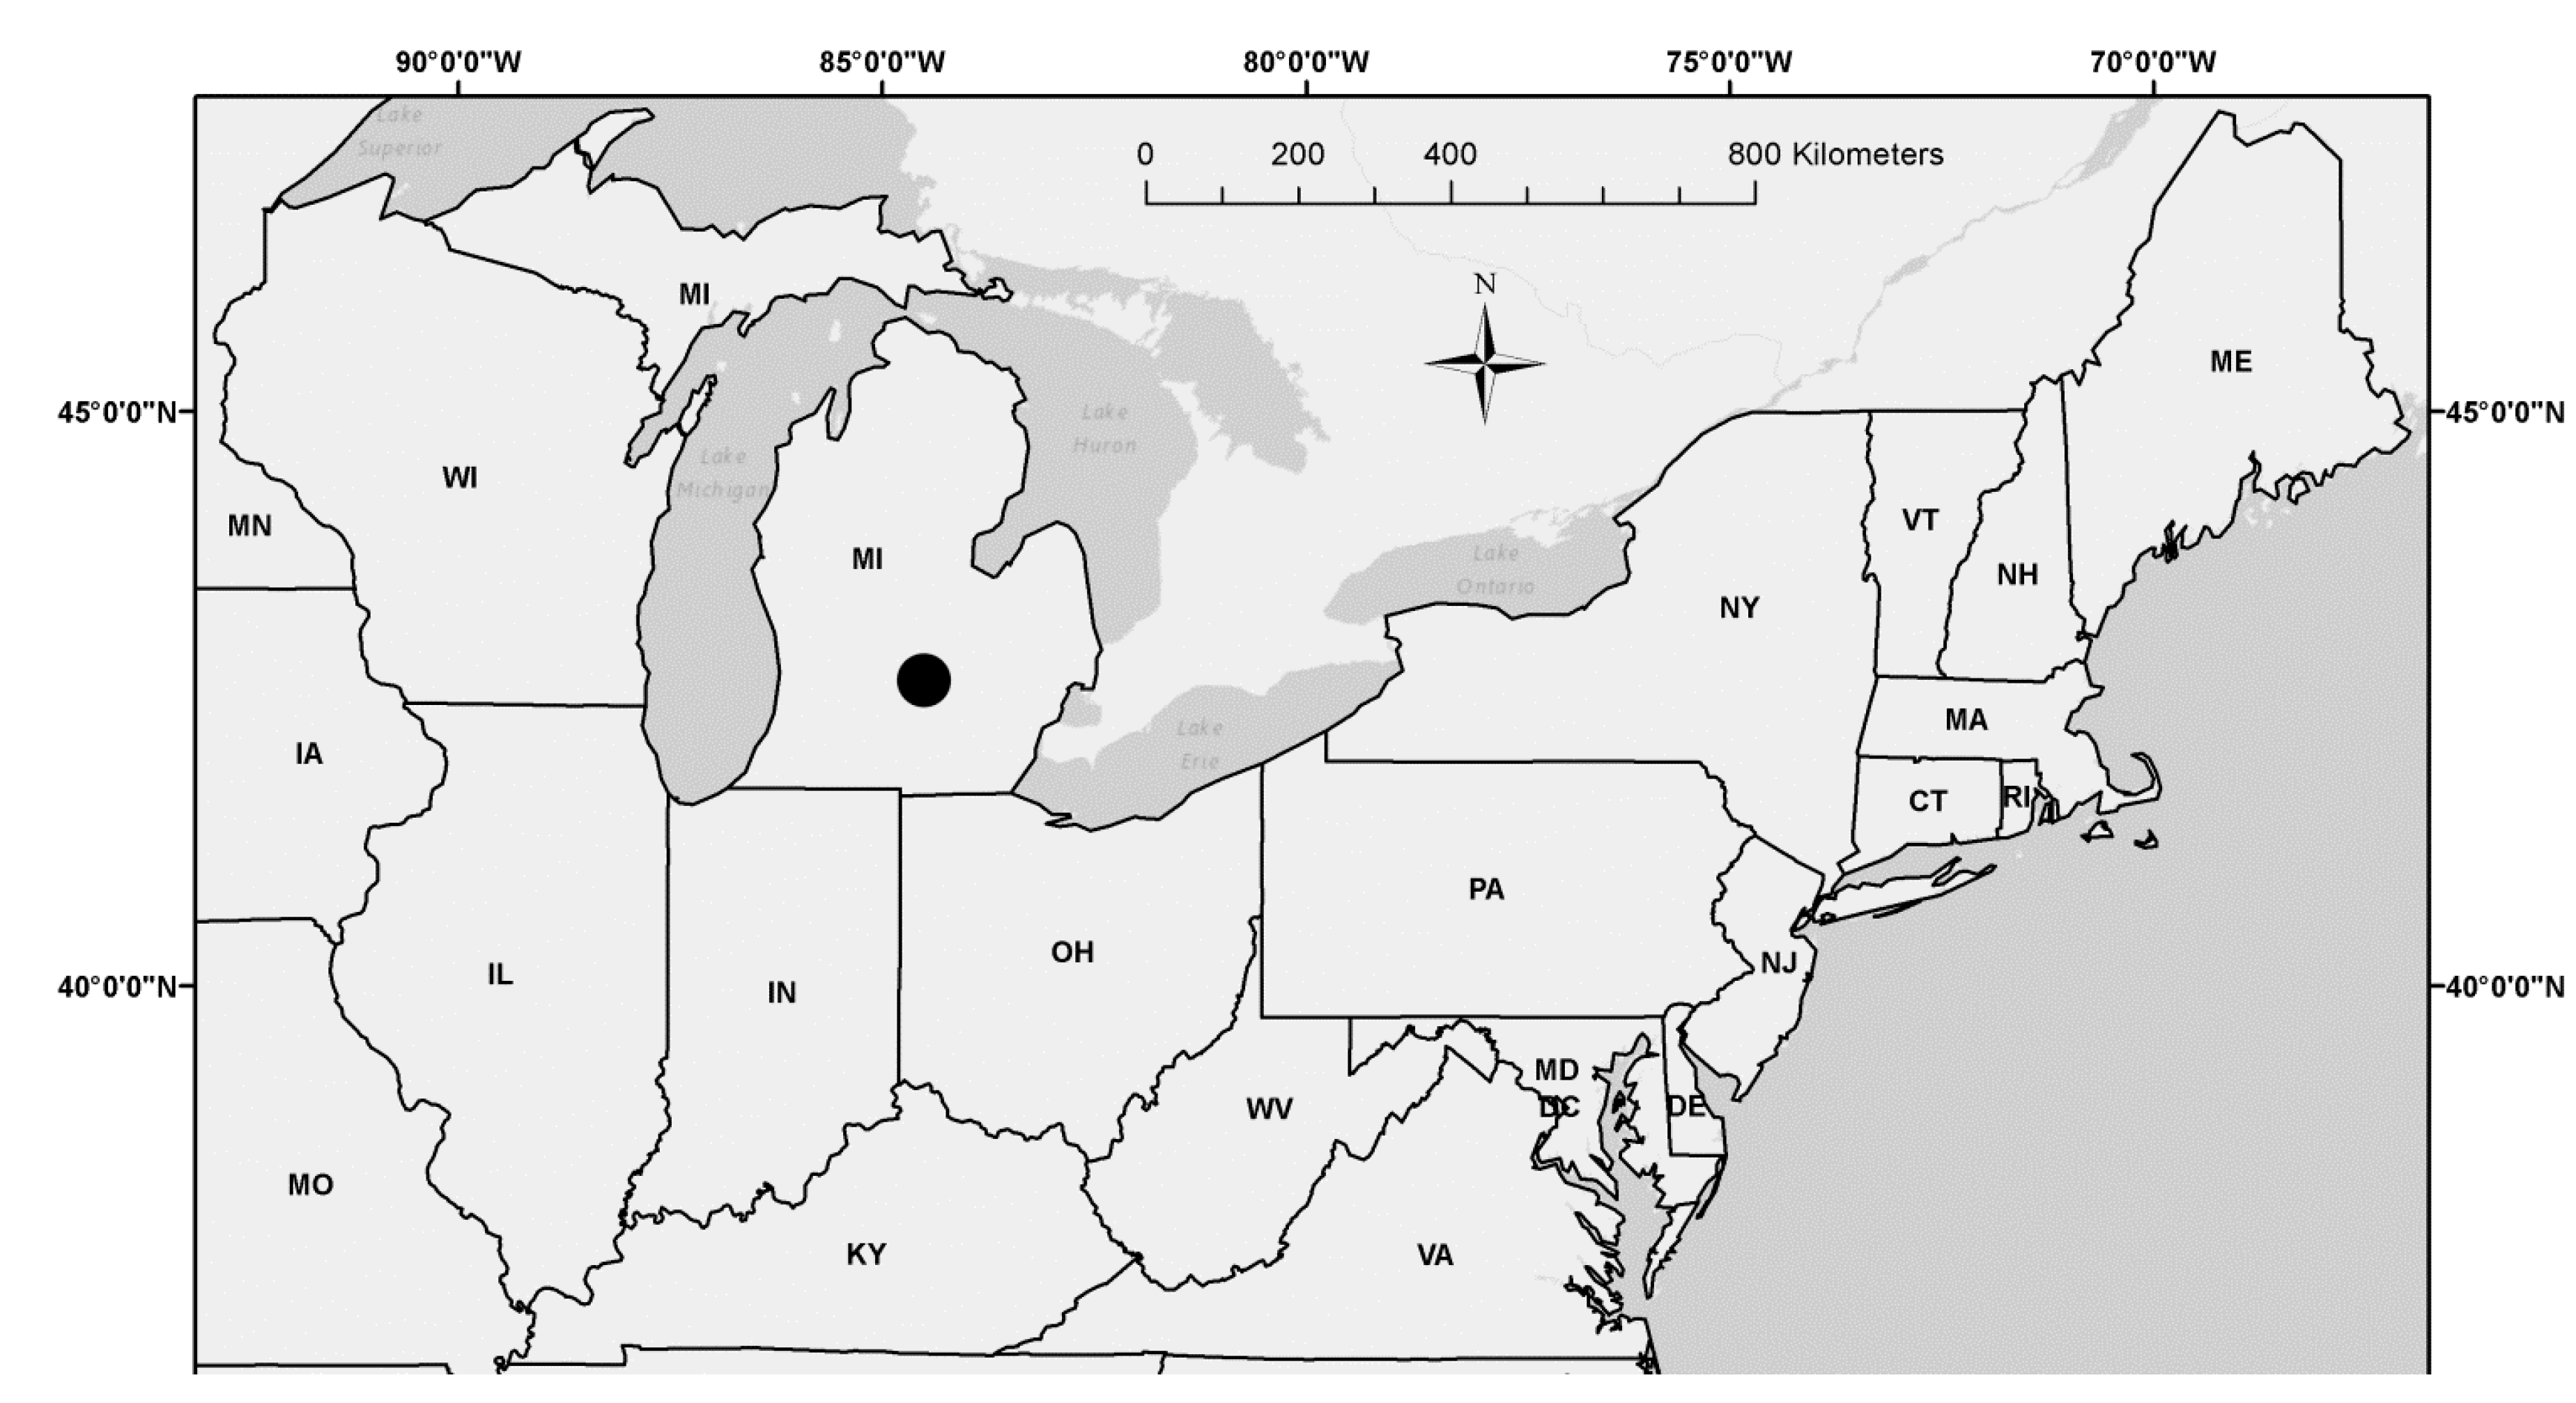
This study was conducted in the Michigan State University (MSU) Sandhill Research Area (SRA: 42.7°N latitude; 84.5°W longitude) located in East Lansing in Ingham County, Michigan (Figure 1; Table 1). Pollen and branches with female catkins from natural stands of aspen parents (i.e., trembling aspen (Populus tremuloides Michx.) [28] and bigtooth aspen (Populus grandidentata Michx.) [29]) derived from different geographical localities were genetically crossed (Populus grandidentata × P. tremuloides) and a full-sib progeny test plantation of hybrid aspen (Populus × smithii Boivin) [7] was established at the field experiment location in April of 1982 [26,27]. Full-sib progeny testing involves a controlled pollination in which both the maternal and paternal parents are known [10]. Family members from each full-sub maternal and paternal genetic cross have 50% of their genes in common.
Figure 1. Hybrid aspen (P. × smithii) full-sib families sampled from a plantation located in Sandhill Research Area managed by Michigan State University (●) in Ingham County, Michigan (MI). Standard state abbreviations shown for neighboring states in the Northeastern United States.
Geosciences 06 00007 g001
Each of the original 56 hybrid aspen families were planted in a randomized complete block design with six replications [30,31]. Nursery stock (1-0) was initially grown in greenhouses and then machine planted with a revised cultiplanter in April 1982 at a spacing of 2.44 m between row and 1.83 m between trees in the same row. In the year prior to planting, site preparation consisted of mowing vegetation with a rotary mower in August 1981 combined with spraying with glyphosate herbicide (application rate of 7 L/ha) in 1 m wide strips 3–4 weeks later. After spring planting, seedlings were spot-sprayed with glyphosate herbicide in July 1982 to control invading grasses.
According to the nearest meteorological station (East Lansing 4S, MI2395) and for the reference period of 1971–2000, mean annual temperature was 8.3 °C with warmest mean monthly temperatures in July (21.4 °C) and coldest mean monthly temperatures occurring in January (−5.8 °C) [32]. Total annual precipitation was 782 mm with most precipitation occurring in August (85.9 mm). Soil conditions at SRA are a fine sandy loam [30,31]. Grasses and perennial weeds constitute the dominant understory vegetation at this site.
Full-sib families of hybrid aspen still represented by at least two surviving members (i.e., at least two out of the six replicates) by the end of the 2009 growing season were selected for additional sampling in the spring of 2010. Consequently, a total of 18 full-sib families of hybrid aspen were sampled. The hybrid aspen trees in each of these full-sib families were sampled with an increment borer from the stem region at breast height (1.3 m) and two increment cores were obtained from opposite sides of each tree (180° apart). Diameter at Breast Height (DBH) was measured with diameter tape, and total tree height was measured with a laser hypsometer.

2.2. Sample Processing and Dendrochronological Measurements

All wood increment cores were processed according to standard dendrochronological techniques and sanded with progressively finer grades of sandpaper to highlight annual rings [33]. All samples within each full-sib family were visually crossdated under a binocular microscope to identify any missing and/or false double rings [34]. All samples were digitally scanned at an optical resolution of 1200 dpi. Annual ring width was measured using an image analysis software-based system (CooRecorder and DendroScan: Cybis Elektronik and Data AB, Sweden). Difficult sections of some increment cores containing extremely narrow rings were measured with a stage micrometer coupled with a stereo microscope to an accuracy of 0.001 mm (Velmex: Bloomfield, NY, USA).
Annual ring measurements were converted to annual basal area increment values (cm2∙year−1). At the end of each growth year, annual ring width measurements from each increment core of each tree was converted to cumulative measures of diameter inside bark (DIB). If coring missed the pith, the missing radius was estimated from the difference of half of the diameter outside bark (DOB) taken in the field and total cumulative radial measurements plus bark retained in each core [35]. Cumulative basal area values were derived from cumulative DIB values and the formula for the area of a circle. Annual basal area increment values (cm2∙year−1) were obtained by subtracting cumulative basal area in the previous year (t-1) from the current year (t).

2.3. Growth-Climate Analyses

Monthly climate data were obtained from the meteorological station (East Lansing 4S, MI2395) nearest to the MSU Sandhill Research Area over the record period of 1953–2009 [32]. However, climate records were interrupted in 2009 leading to many missing values. Consequently, subsequent growth-climate analyses did not include the year 2009. The primary climate variables provided included mean monthly temperature and total monthly precipitation. These primary variables were used as the basis to produce a synthetic monthly climatic moisture index (CMI) variable calculated as precipitation subtract potential evapotranspiration (PET) [36]. Monthly values of PET are primarily a function of mean vapor pressure deficit which in turn is estimated from monthly temperature. Consequently, CMI combines the effects of both precipitation and temperature on soil moisture regimes. Since tree growth may respond more strongly to climatic variables at the seasonal scale, monthly climatic variables were converted to seasonal 2-month and 3-month periods (temperature variables averaged during the seasonal periods, and moisture index variables were summed during the seasonal periods). The raw climate data (monthly and seasonal) was expressed as anomalies in °C (mean temperature) and cm (CMI) from their respective mean for the reference period of 1971–2000 [37].
Interannual basal area increment time series for each increment core were standardized to remove age-related trends [21]. Standardization was based on applying a linear, locally weighted regression (Loess) with a neighborhood span equivalent to 10 years using the function “Loess” (package STATS) in the program R [38,39]. The 10-year neighborhood window for determining the Loess regression estimate for growth of a certain year is the growth in the 10 nearest years. Growth in the years closer to the year of estimate are weighted much heavier than years farther away using a tricubic weighting formula [38,39]. Each year, basal area index (BAI) was calculated as the ratio of their observed versus predicted values from the Loess model. BAI values derived from the two increment cores of each tree were averaged together then summarized further by determining averages for each full-sib family of Populus × smithii.
Relationships between annual BAI and past climate records (both monthly and seasonal variables) were assessed using step-wise multiple linear regression techniques (18) across all 18 full-sib families of hybrid aspen and for all families combined. The multiple regression analysis was conducted using the function stepAIC (package MASS) in the program R [38,39]. The regression model selected for each climate variable set (TAV, CMI) and at each scale (monthly and seasonal periods) was selected based on minimizing the value of Akaike’s information criterion (AIC) [40]. The regression analyses were conducted over two growing seasons, from April of the prior year (t-1) to October of the current year (t) ) and over a 22-year period (1987–2008). Standardized (β) partial regression coefficients were also calculated to help assess the relative importance of the predictor variables in each regression model [41].

2.4. Growth Projections under Future Climate Change Scenarios

The predicted change in climate for three periods in the 21st century (2010–2039, 2040–2069, and 2070–2099) relative to the climatic normal (CN) period of 1971–2000 were obtained for East Lansing from the Canadian Centre for Climate Modelling and Analysis (CCCma) [42]. CCCma incorporates output from the second generation coupled global climate model (CGCM3). The climate change scenarios considered here were based on CGCM3 forced with IPCC [43] A1B emission scenario. Specifically, the A1B scenario involves energy use that is balanced across all sources; that is, there is no heavy reliance on one particular energy source. CCCma provides output of climate change scenarios for all calendar months and for all primary climate variables including mean temperature and precipitation.
The regression model for each full-sib family of hybrid aspen was applied to the regional climate change variables to project growth for the three periods in the 21st century under the A1B climate change scenarios. Since the regression models for BAI and temperature were generally not significant, the projected BAI was based on the regression models for CMI applied the future climate change scenario. The significance of the projected growth estimates were examined in comparison to a 95% confidence interval of the mean expected BAI for the period 1991–2008. The mean estimate of growth was calculated by entering in values of zero for the predictor variables in the regression models of TAV and PPT and therefore is equivalent to the value of the constant of the regression models. The standard error of the mean (SE) required to calculate the length of the confidence interval was based on the SE of the observed values of BAI for the period 1987–2008 for each full-sib family. Projected BAI for the climate scenario periods were also expressed as percentage change relative to the mean BAI for the reference period of 1987–2008.

3. Results

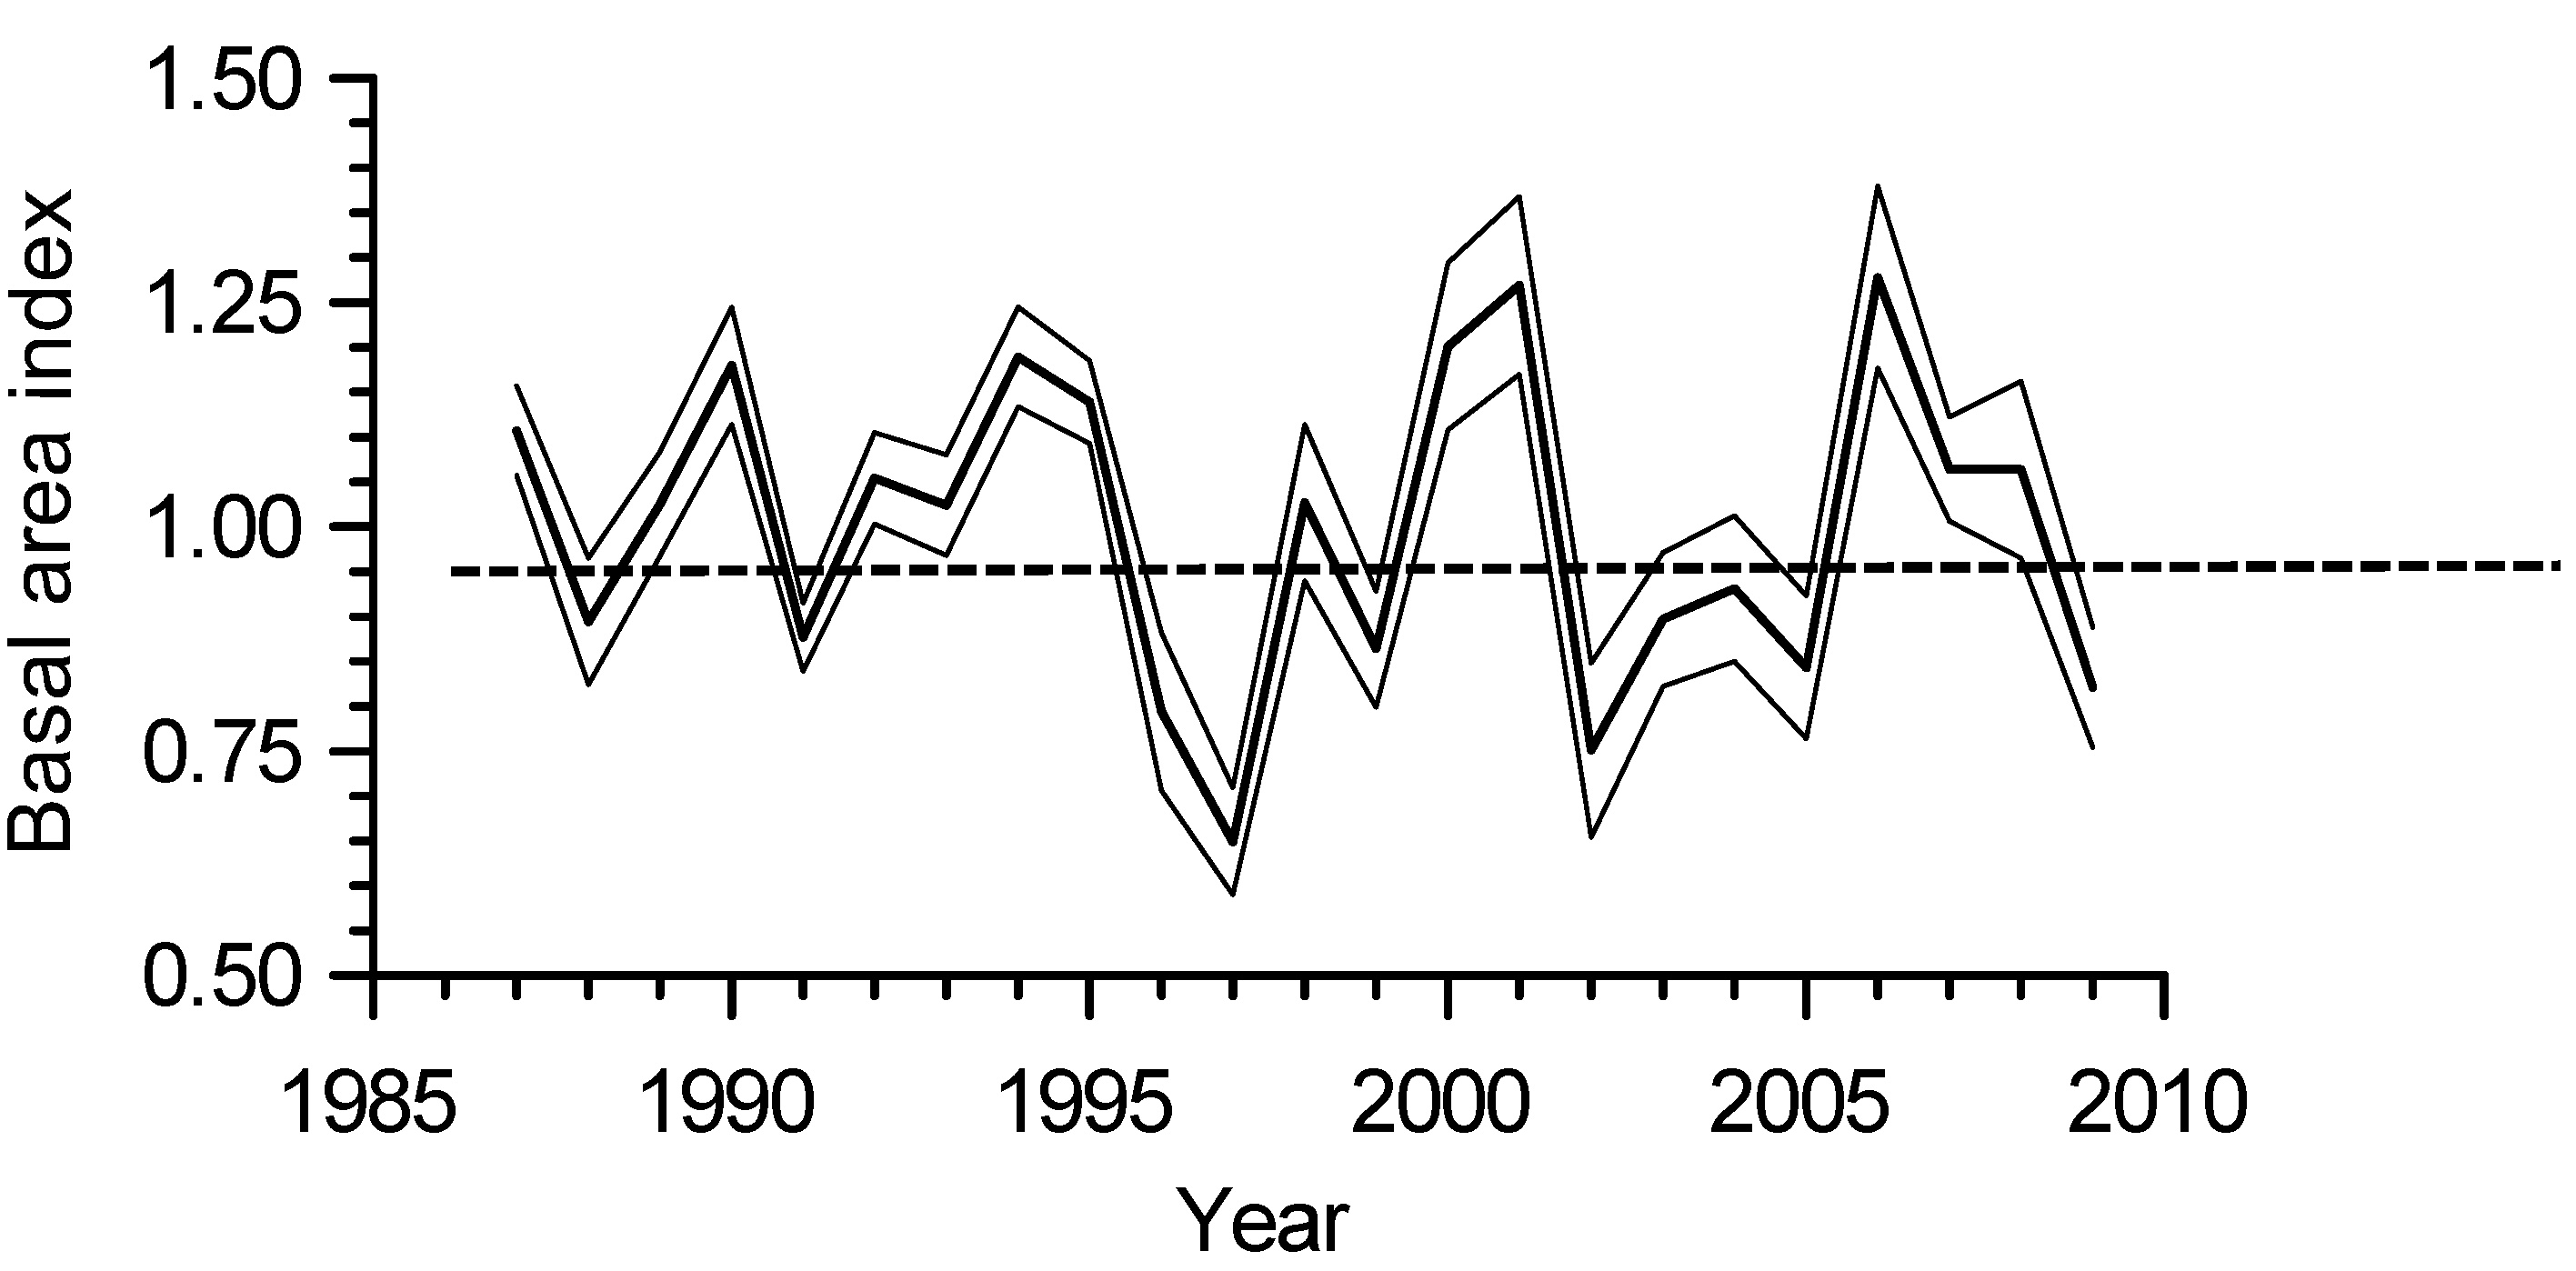
The hybrid aspen full-sib family with largest diameter and basal area was CAL_WEX, and the family with lowest basal area was MAR_CLA2 (Table 1). The main periods of reduced interannual basal area growth occurred between 1996–1998 and 2002–2005 (Figure 2).
Table 1. Growth characteristics of the 18 full-sib families of hybrid aspen. The hybrid aspen families are sorted from the family with the highest diameter and basal area (CAL_WEX) to the family with the smallest values (MAR-CLA2).
Full-Sib FamilyGenetic Acc. No.Diameter (cm)Height (m)Basal Area (m2)
CAL_WEX56-6-7735.222.60.0983
LAK_MAR27-38-2731.124.60.0772
BRA_CLA4-9-1030.023.40.0729
GLA_GLA14-21-1329.622.20.0689
IOS_GLA24-33-1328.521.20.0671
VAN_IRO78-44-3428.118.50.0651
SAG_CHI76-40-1528.421.20.0631
MAR_CLA132-45-1027.519.70.0591
CAL_IRO57-6-3427.121.00.0585
WEX_BEN81-46-827.220.70.0585
MAR_OAK33-45-3226.417.10.0567
CHI_KAL8-14-2125.820.00.0533
ROS_OAK44-71-3225.417.80.0517
MON_VAN70-31-7322.416.80.0401
GLA_CHI12-21-822.419.90.0393
OGE_GLA73-33-2220.815.50.0375
MAR_ING28-43-1619.316.70.0299
MAR_CLA229-43-1019.317.60.0294
Mean All--26.319.80.0570
Note: Genetic Acc. No. = Accession number of full-sib family followed by accessions numbers of maternal and paternal parents. The hybrid aspen families are sorted from the family with the highest diameter and basal area (CAL_WEX) to the family with the smallest values (MAR_CLA2).
Figure 2. Basal area index (BAI) growth chronology of all 18 full-sib families of hybrid aspen (Populus × smithii) combined (bold line) and the lower and upper limits of a 95% confidence interval of the mean (thin lines).
Geosciences 06 00007 g002
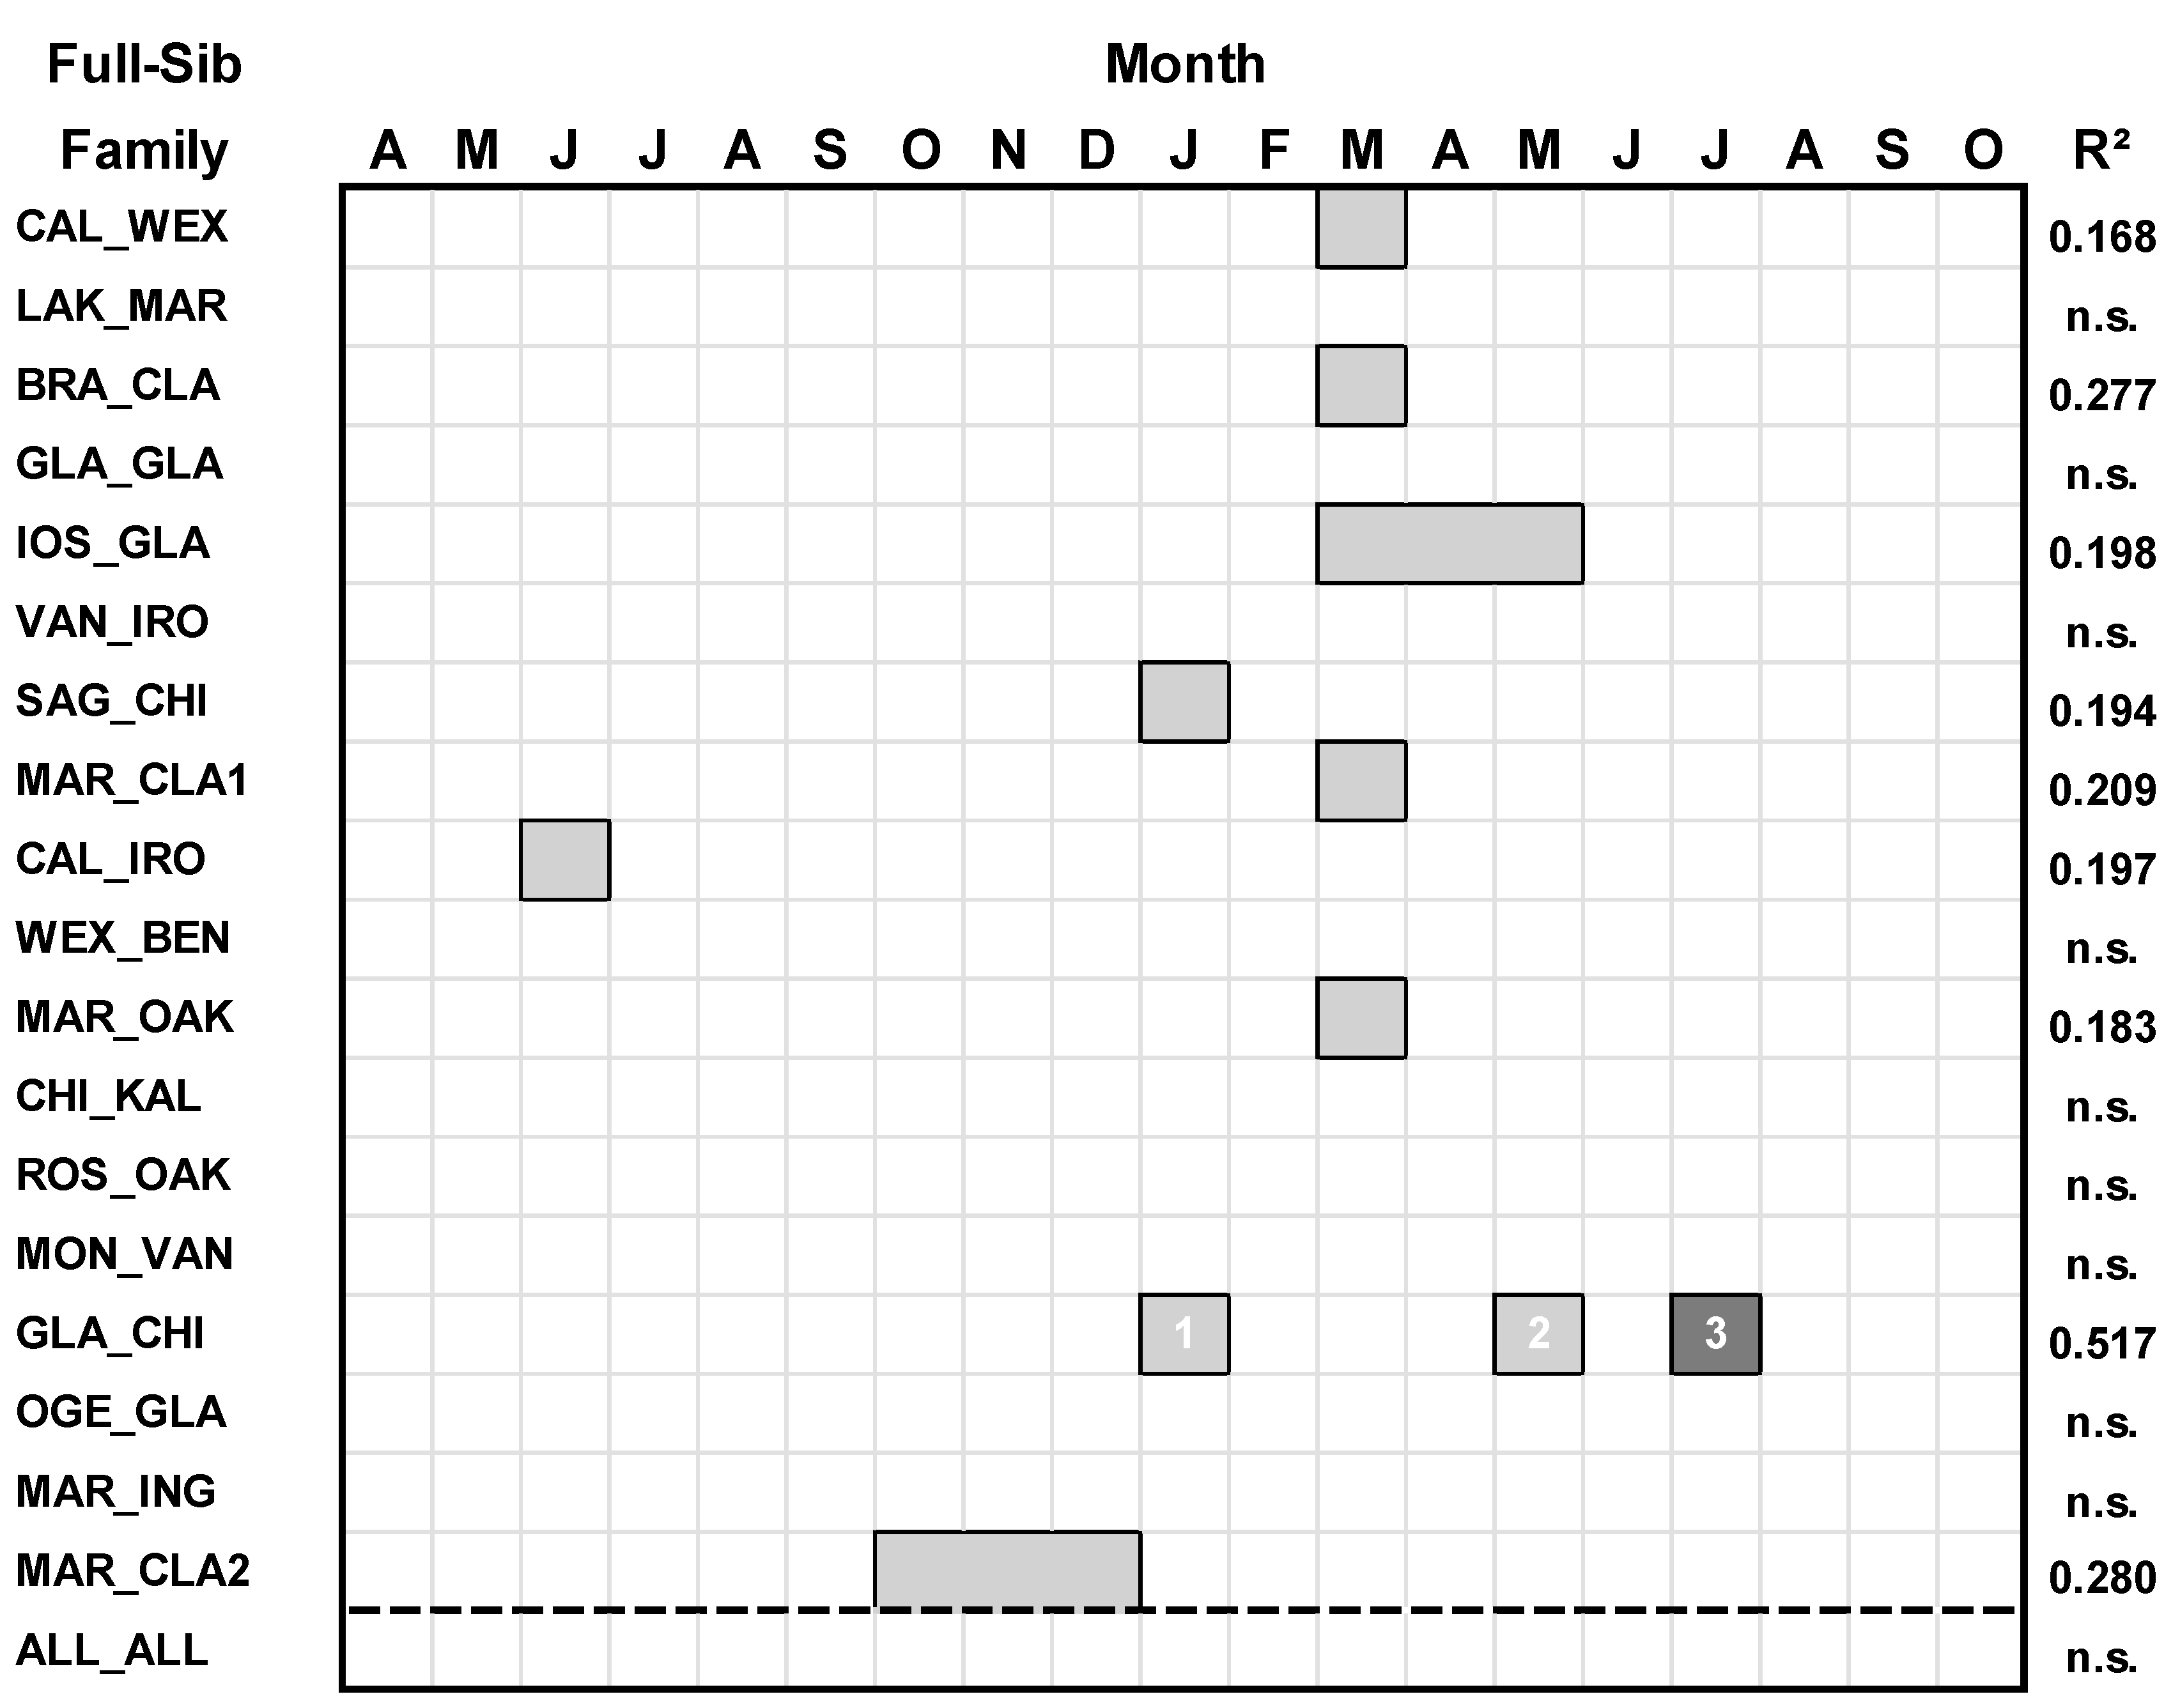
Only nine of 18 of the full-sib families of hybrid aspen responded to mean temperature variables (Table 2; Figure 3). For all full-sib families combined, there was no significant response to temperature (p > 0.05).
Table 2. Coefficients of regression models relating radial growth of hybrid aspen families to temperature variables. Climate variables (V) are identified in Figure 3.
FamilyCV1V2V3V4
CAL_WEX0.9870.455 (0.0494)------
LAK_MARn.s.--------
BRA_CLA0.9920.558 (0.0661)------
GLA_GLAn.s.--------
IOS_GLA0.9840.486 (0.0825)------
VAN_IROn.s.--------
SAG_CHI0.9510.482 (0.0381)------
MAR_CLA11.0050.497 (0.0527)------
CAL_IRO0.9680.485 (0.0892)------
WEX_BENn.s.--------
MAR_OAK0.9750.471 (0.0671)------
CHI_KALn.s.--------
ROS_OAKn.s.--------
MON_VANn.s.--------
GLA_CHI0.9440.593 (0.0419)−0.46 (0.0741)0.347 (0.0346)0.294 (0.0475)
OGE_GLAn.s.--------
MAR_INGn.s.--------
MAR_CLA20.9830.56 (0.0695)------
ALL_ALLn.s.--------
Note: The first term in the regression model is the constant (C). The regression terms (V1-V4) are listed in descending order according to the ranking of the absolute values of the standardized (β) regression coefficients [41], and values in parentheses represent the corresponding partial regression coefficients (cf. Figure 3). n.s. = not significant.
Figure 3. Regression models between Basal Area Index (BAI) and temperature variables for each family of hybrid aspen and all families combined. Climate variables spanned April of the prior year (t-1) to October of the current year(t)). For each regression model, predictor climate variables having a positive relationship with growth are denoted by light gray boxes, and predictor climate variables having a negative relationship with growth are denoted by darker gray. The numbers within the boxes denote the ranking of the climate variables according to their standardized regression (β) coefficient (highest = rank 1).
Geosciences 06 00007 g003
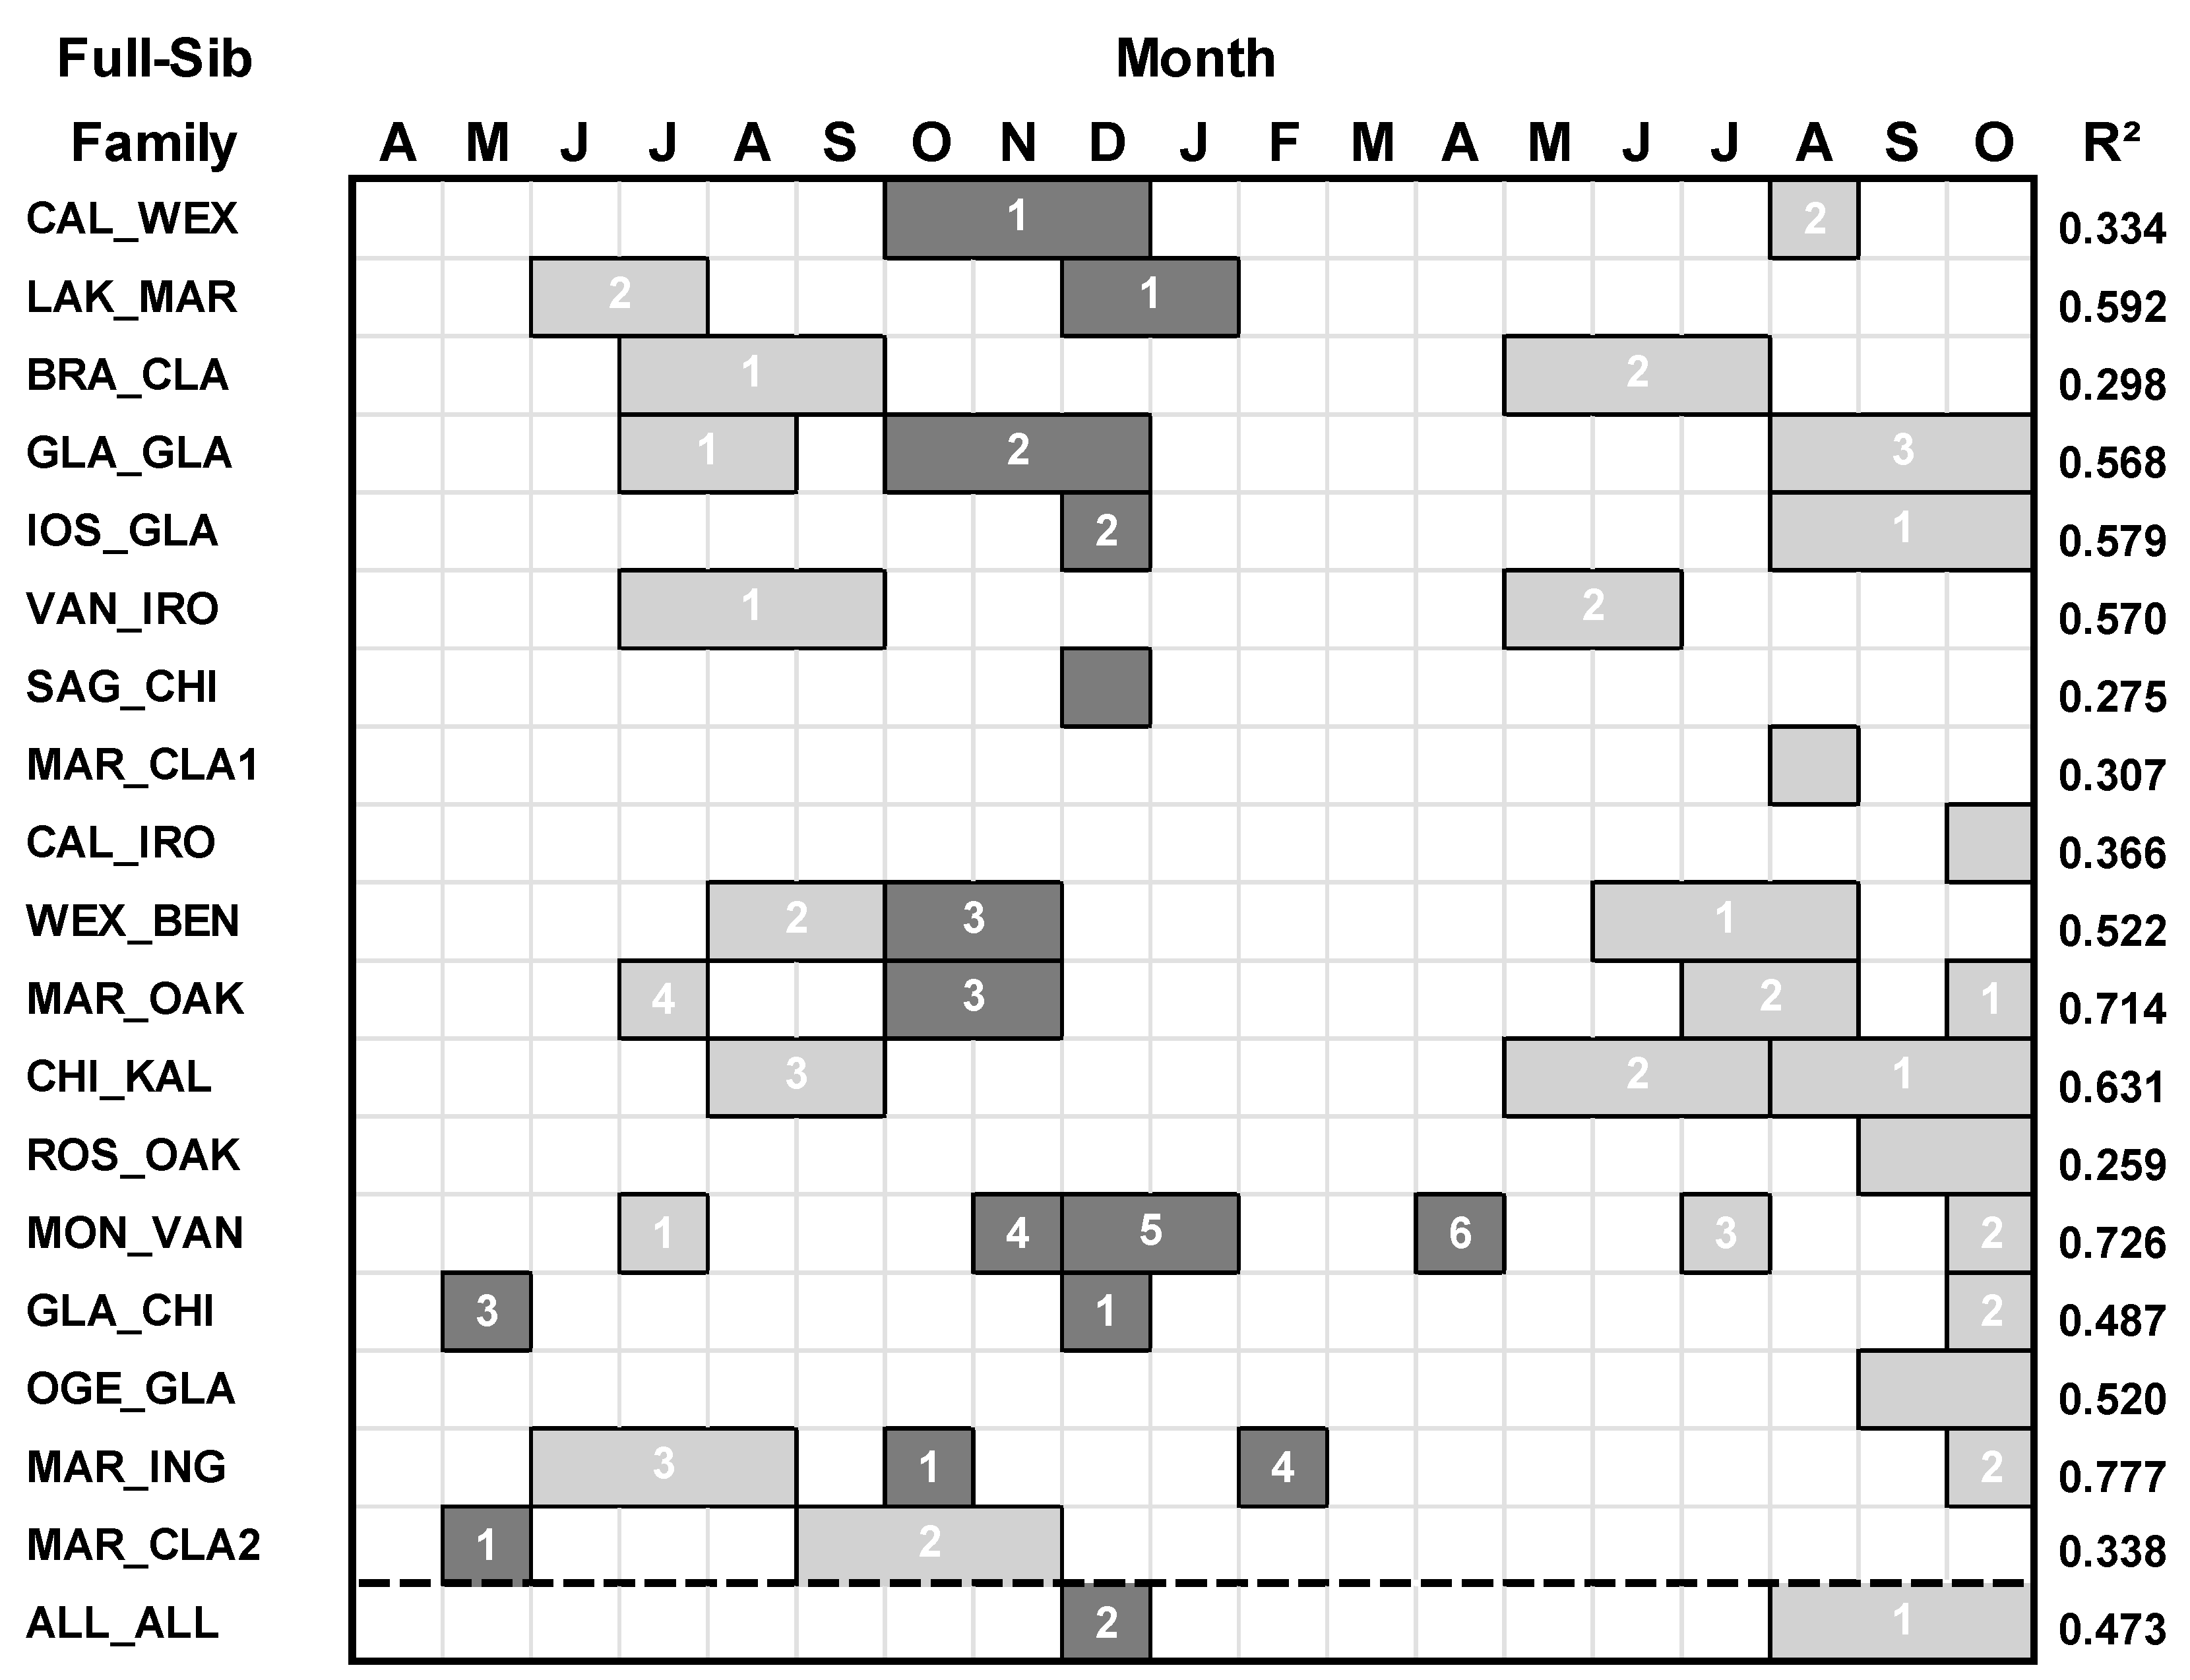
All of the 18 families of hybrid aspen responded to the moisture index variables (Table 3; Figure 4). Except for the GLA_CHI family, all of the families that responded to temperature had a stronger response with the moisture index in terms of the amount of explained variance in the BAI of growth. For all families combined, basal area growth responded primarily to 3-month seasonal moisture index from August to October of the current year (t), and secondarily to December moisture index of the previous year (t-1).
Figure 4. Regression models between basal area index (BAI) and moisture index variables for each family of hybrid aspen and all families combined. Climate variables spanned April of the prior year (t-1) to October of the current year (t). For each regression model, predictor climate variables having a positive relationship with growth are denoted by light gray boxes, and predictor climate variables having a negative relationship with growth are denoted by darker gray. The numbers within the boxes denote the ranking of the climate variables according to their standardized regression (β) coefficient (highest = rank 1).
Geosciences 06 00007 g004
Future climate in the 21st century is characterized by progressive warming to about 4.1 °C under the A1B climate change scenario with the extent of warming being slighter higher during the winter compared to the summer (Table 4). Climate change projections also indicated that moisture index will decrease by the middle (2041–2070) and final projection period (2071–2100) during the summer and annually.
Table 3. Coefficients of regression models relating radial growth of hybrid aspen families to climate moisture index variables. Climate variables (V) are identified in Figure 4.
FamilyCV1V2V3V4V5V6
CAL_WEX0.985−0.45 (0.017)0.422 (0.0185)--------
LAK_MAR0.950−0.651 (0.0455)0.617 (0.0182)--------
BRA_CLA0.9980.549 (0.0146)0.432 (0.0105)--------
GLA_GLA0.9770.485 (0.0167)−0.342 (0.013)0.325 (0.0078)------
IOS_GLA0.9290.61 (0.0164)−0.42 (0.0671)--------
VAN_IRO0.9950.735 (0.0167)0.507 (0.0115)--------
SAG_CHI0.886−0.556 (0.0865)----------
MAR_CLA11.0280.583 (0.0249)----------
CAL_IRO0.9910.63 (0.0387)----------
WEX_BEN1.0070.515 (0.0117)0.481 (0.0117)−0.307 (0.0117)------
MAR_OAK0.9720.592 (0.0436)0.501 (0.0223)−0.354 (0.0195)0.262 (0.0151)----
CHI_KAL0.9820.451 (0.0139)0.594 (0.0173)0.402 (0.0141)------
ROS_OAK1.0160.542 (0.0123)----------
MON_VAN0.9260.569 (0.0384)0.582 (0.0309)−0.306 (0.0262)0.323 (0.017)−0.307 (0.0229)−0.211 (0.0119)
GLA_CHI0.919−0.526 (0.073)0.384 (0.0212)−0.364 (0.0121)------
OGE_GLA1.0300.737 (0.0316)----------
MAR_ING1.0040.429 (0.0244)−0.498 (0.0286)0.386 (0.0094)−0.303 (0.0338)----
MAR_CLA21.027−0.41 (0.0095)0.403 (0.0074)--------
ALL_ALL0.9530.554 (0.0106)−0.396 (0.0452)--------
Note: The first term in the regression model is the constant (C). The regression terms (V1–V4) are listed in descending order according to the ranking of the absolute values of the standardized (β regression coefficients [41], and values in parentheses represent the corresponding partial regression coefficients (cf. Figure 4).
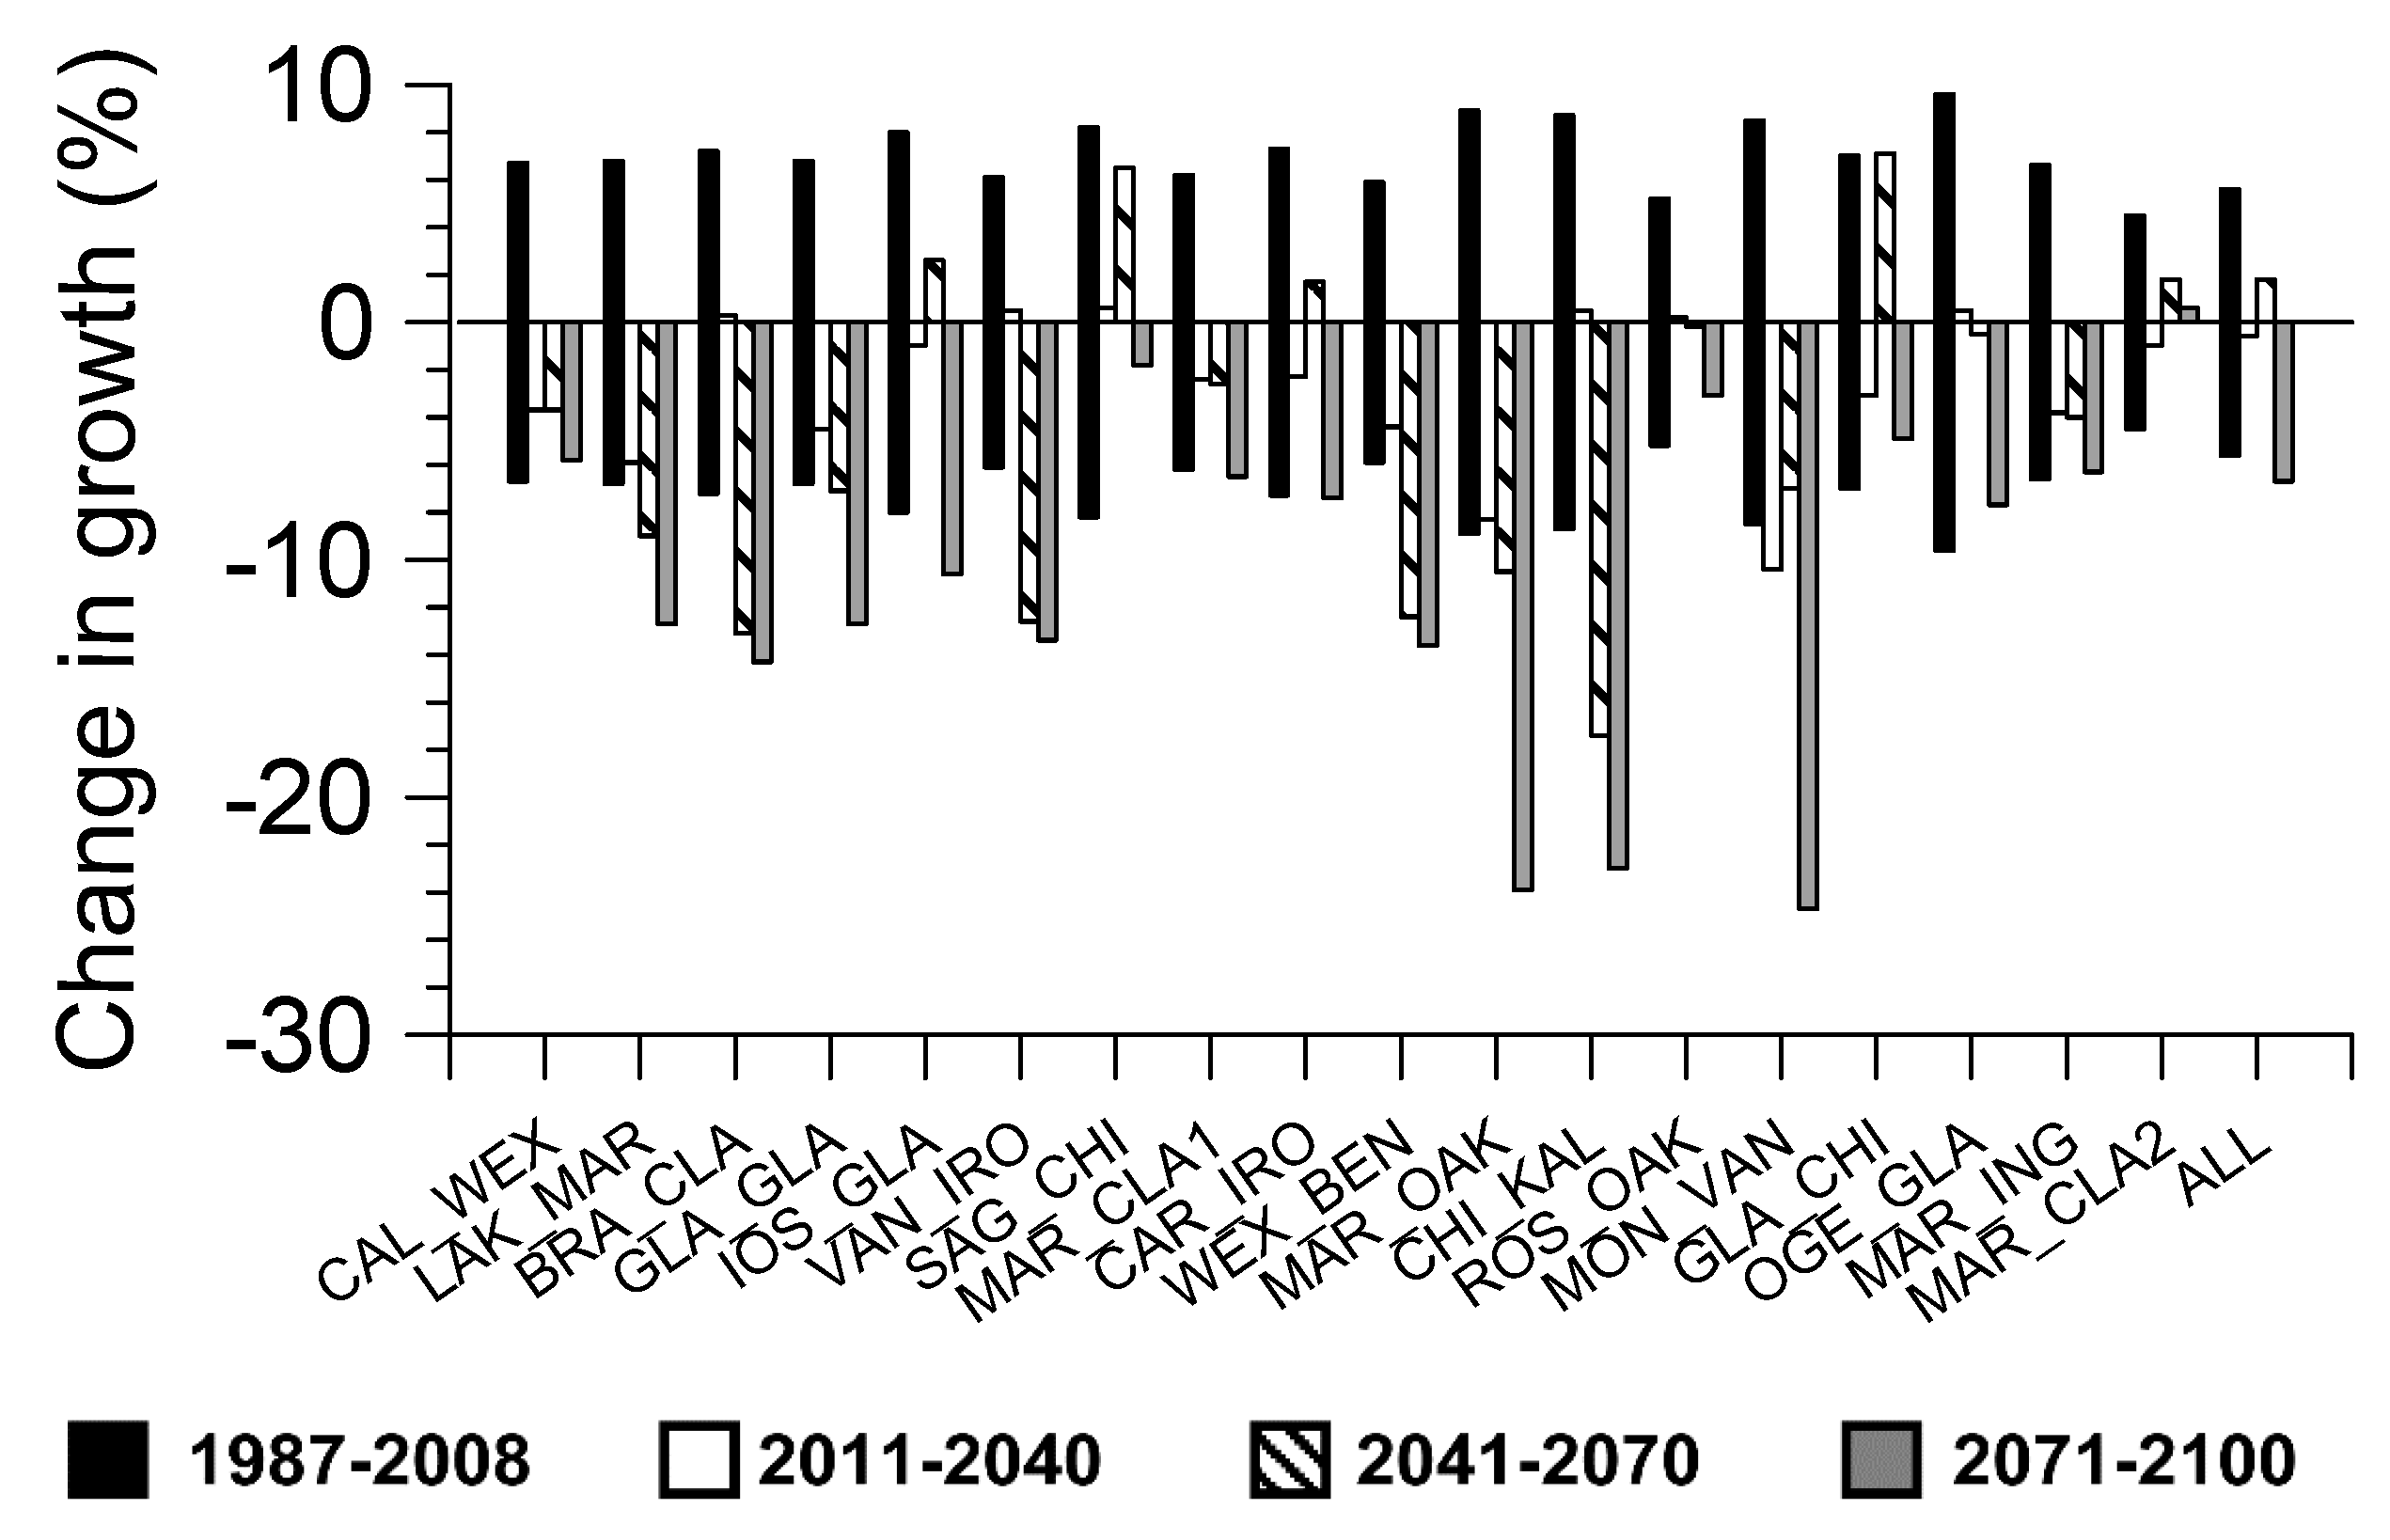
Growth during the first projection period of 2011–2040 was significantly less than the historical reference period (1987–2008) for only one of the hybrid aspen families (i.e., MON_VAN) (Figure 5). Significant reductions in growth for the second projection period (2041–2070) compared to the historical reference period was observed for seven of the hybrid aspen families, while there was a significant increase in growth for one family (i.e., GLA_CHI). By the final projection period (2071–2100) there was significant growth reductions in 11 of the families and for all families combined.
Table 4. Forecasted characteristics in climate variables derived from a general circulation model (GCM: CCCma, CGCM3, IPCC A1B).
Seasonal and Future Projection PeriodTemperature (°C)Climate Moisture Index (cm)
(a) Summer
2011–20401.10.4
2041–20702.8−9.9
2071–21003.8−10.1
(b) Winter
2011–20401.82.9
2041–20703.60.2
2071–21004.42.1
(c) Annual
2011–20401.62.7
2041–20703.2−9.3
2071–21004.1−9.8
Note: Climate variables are expressed as anomalies relative to the normal reference period of 1971–2000. Summer (sum.) is defined as the 4-month period of May-August; winter (win.) is defined as 4-month period of November-February; and annual (ann.) is the 12-month period of January–December. CCCma = Canadian Center for Climate Modeling and Analysis [42]; CGCM3 = 3rd generation general circulation model; IPCC A1B = Intergovernmental Panel of Climate Change emission scenario [43].
Figure 5. Projected percent change of growth for each hybrid aspen family and all families combined under the IPCC A1B climate change scenario and based on moisture index regression models. A 95% confidence interval of growth for the period of 1987–2008 is also shown.
Geosciences 06 00007 g005

4. Discussion

The full-sib families of hybrid aspen in Michigan were more affected by the moisture index compared to a weaker or lack of a significant response to temperature variables. In particular, the dendroclimatic modeling indicated that growth was primarily affected by the degree of late summer to fall moisture stress and the degree of winter harshness. Chhin [25] has provided a detailed explanation of the potential underlying ecophysiological mechanisms for these hybrid aspen families.
To be economically feasible, growth and yield of hybrid aspens needs to be accurately accounted for, and possible perturbations in biomass supply due to changes in climate must be accounted for to minimize risk in economic investments. Growth projections for the early projection period of 2011–2040 indicate that there is still time to adapt to future changes in climate. All full-sib families of hybrid aspen considered in this study could still be safely deployed within the planning horizon for the rotation periods ending near 2040.
For the middle projection period of 2041–2700, more selective management decisions will need to made about safe deployment of the different genotypes of hybrid aspen. By this middle projection period seven of the families are no longer considered resilient to climatic stress and plantation managers should refrain from deploying them further unless management practices are utilized to limit drought stress (i.e., via irrigation) [4].
By the final projection period of 2071–2100, 11 of the hybrid aspen genotypes will no longer be resilient to climatic stress, and forest managers should refrain from deploying them unless financial resources are available to utilize management practices to relieve climatic stress. A more proactive management approach could include thinning operations to limit resource competition for light and other site resources such as soil moisture and nutrients [26,44]. To address the potential vulnerability of single species monocultures to climate change and concerns for forest biodiversity, it has been proposed that species mixtures be used in plantation establishment and management to reduce this risk [26].
While the current study showed mainly negative growth projections for hybrid aspen; in contrast, other studies of short-rotation wood crop have indicated positive projections of plantation growth under future climatic warming. For instance, Lasch et al. [3] used a process-based model (4C, FORESEE: forest ecosystems in a changing environment) to model forest dynamics of plantations of aspen (Populus tremula L.) established on former agricultural lands in Germany, and showed that mean annual woody biomass yield increased for a projected period of 2034–2055.
New genotypes of short-rotation woody crops are constantly being produced and tested for desirable traits as a result of genetic tree improvement programs [14,16]. New genotypes that are identified to have shortcomings (i.e., low productivity, disease susceptibility, climate sensitivity) will likely not be maintained that far into the future. The study provides advanced understanding in geosciences since it examined the interactions between the terrestrial biosphere, atmosphere, and hydrosphere. The study promotes adaptation of forest land management practices to future climate change in order to safeguard the sustainability of forest resources.

5. Conclusions

Overall, the hybrid aspen families examined in this study were more sensitive to moisture related stressors compared to a weaker or no response to temperature stressors. By the end of the 21st century (2071–2100), 11 out of the 18 hybrid aspen families will be vulnerable to future changes in moisture stress. The other seven out of the 18 hybrid aspen families were identified to be resilient to future changes in moisture stress. This study demonstrated an effective procedure based on dendroclimatic methods to screen the resilience of a short rotation wood crop under a future scenario of climate change.

Acknowledgments

The author is thankful for the initial planning and establishment of the hybrid aspen stand by Gregory Reighard, James Hanover and Donald Dickmann. Thanks also go to John Willis, Eric David, Paul Bloese, and Randy Klevickas for their assistance in the field and laboratory data collection. This study was funded by the Michigan State University AgBioResearch (Project # MICL06016).

Conflicts of Interest

The author declares no conflict of interest.

References

  1. Eriksson, H.M.; Hall, J.P.; Helynen, S. Rationale for forest energy production. In Bioenergy from Sustainable Forestry; Richardson, J., Bjorheden, R., Hakkila, P., Lowe, A.T., Smith, C.T., Eds.; Kluwer Academic Publishers: Dordrecht, The Netherlands, 2002; pp. 1–17. [Google Scholar]
  2. Ohlrogge, J.; Allen, D.; Berguson, B.; DellaPenna, D.; Shachar-Hill, Y.; Stymne, S. Driving on biomass. Science 2009, 324, 1019–1020. [Google Scholar] [CrossRef] [PubMed]
  3. Lasch, P.; Kollas, C.; Rock, J.; Suckow, F. Potentials and impacts of short-rotation coppice plantation with aspen in Eastern Germany under conditions of climate change. Reg. Environ. Chang. 2010, 10, 83–94. [Google Scholar] [CrossRef]
  4. Quinn, L.D.; Straker, K.C.; Guo, J.; Kim, S.; Thapa, S.; Kling, G.; Lee, D.K.; Voigt, T.B. Stress-tolerant feedstocks for sustainable bioenergy production on marginal land. Bioenerg. Res. 2015, 8, 1081–1100. [Google Scholar] [CrossRef]
  5. Calfapietra, C.; Gielen, B.; Karnosky, D.; Ceulemans, R.; Mugnozza, G.S. Response and potential of agroforestry crops under global change. Environ. Pollut. 2010, 158, 1095–1104. [Google Scholar] [CrossRef] [PubMed]
  6. Dickmann, D.I. Silviculture and biology of short-rotation woody crops in temperature regions: Then and now. Biomass Bioenergy 2006, 30, 696–705. [Google Scholar] [CrossRef]
  7. Demeritt, M.E., Jr. Poplar Hybrids (Populus L.). Available online: http://www.na.fs.fed.us/spfo/pubs/silvics_manual/volume_2/populus/populus.htm (accessed on 1 August 2010).
  8. Riemenschneider, D.E.; Berguson, W.E.; Dickmann, D.I.; Hall, R.B.; Isebrands, J.G.; Mohn, C.A.; Stanosz, G.C.; Tuskan, G.A. Poplar breeding and testing strategies in the north-central U.S.: Demonstration of potential yield and consideration of future research needs. For. Chron. 2001, 77, 245–253. [Google Scholar] [CrossRef]
  9. Pliura, A.; Zhang, S.Y.; MacKay, J.; Bousquet, J. Genotypic variation in wood density and growth traits of poplar hybrids at four clonal trials. For. Ecol. Manag. 2007, 238, 92–106. [Google Scholar] [CrossRef]
  10. White, T.L.; Addams, W.T.; Neale, D.B. Forest Genetics; CABI Publishing: Oxfordshire, UK, 2007. [Google Scholar]
  11. Robison, D.; Raffa, K.F. Productivity, drought tolerance and pest status of hybrid Populus: Tree improvement and silvicultural implications. Biomass Bioenergy 1998, 14, 1–20. [Google Scholar] [CrossRef]
  12. Zalesny, R.S., Jr.; Hall, R.B.; Zalesny, J.A.; McMahon, B.G.; Berguson, W.E.; Stonosz, G.R. Biomass and genotype × environment interactions of Poplulus energy crops in the midwestern United States. Bioenergy Res. 2009, 2, 106–1222. [Google Scholar] [CrossRef]
  13. Zalesny, R.S., Jr.; Hall, R.B.; Bauer, E.O.; Riemenschneider, D.E. Soil temperature and precipitation affect the rooting ability of dormant hardwood cuttings of Populus. Silvae Genet. 2005, 54, 47–58. [Google Scholar]
  14. Monclus, R.; Dreyer, E.; Villar, M.; Delmotte, F.M.; Delay, D.; Petit, J.-M.; Barbaroux, C.; le Thiec, D.; Brechet, C.; Brignolas, F. Impact of drought on productivity and water use efficiency in 29 genotypes of Populus deltoides × Populus nigra. New Phytol. 2006, 169, 765–777. [Google Scholar] [CrossRef] [PubMed]
  15. Giovannelli, A.; Deslauriers, A.; Fragnelli, G.; Scaletti, L.; Castro, G.; Rossi, S.; Crivellaro, A. Evaluation of drought response of two poplar clones through high resolution analysis of stem growth. J. Exp. Bot. 2007, 58, 2673–2683. [Google Scholar] [CrossRef] [PubMed]
  16. Monclus, R.; Villar, M.; Barbaroux, C.; Bastien, C.; Fichot, R.; Delmotte, F.M.; Delay, D.; Petit, J.-M.; Brechet, C.; Dreyer, E. Productivity, water-use efficiency and tolerance to moderate water deficit correlate in 33 poplar genotypes from a Populus deltoides × Populus trichocarpa F1 progeny. Tree Physiol. 2009, 29, 1329–1339. [Google Scholar] [CrossRef] [PubMed]
  17. Pulkkinen, P.; Vaario, L.-M.; Koivuranta, L.; Stenvall, N. Elevated temperature effects on germination and early growth of European aspen (Populus tremula), hybrid aspen (P. tremula × P. tremuloides) and their F2-hybrids. Eur. J. For. Res. 2013, 132, 791–800. [Google Scholar] [CrossRef]
  18. Headlee, W.L.; Zalesny, R.S., Jr.; Donner, D.M.; Hall, R.B. Using a process-based model (3-PG) to predict and map hybrid poplar biomass productivity in Minnesota and Wisconsin, USA. Bioenergy Res. 2013, 6, 196–210. [Google Scholar] [CrossRef]
  19. Vaganov, E.A.; Hughes, M.K.; Shashkin, A.V. Growth Dynamics of Conifer Tree Rings: Images of Past and Future Environments; Ecological Studies 183; Springer-Verlag: Berlin, Germany, 2006. [Google Scholar]
  20. Fritts, H.C. Tree Rings and Climate; Academic Press: London, UK, 1976. [Google Scholar]
  21. Chhin, S.; Hogg, E.H.; Lieffers, V.J.; Huang, S. Potential effects of climate change on the growth of lodgepole pine across diameter size classes and ecological regions. For. Ecol. Manag. 2008, 256, 1692–1703. [Google Scholar] [CrossRef]
  22. Hogg, E.H.; Brandt, J.P.; Michaelian, M. Impacts of a regional drought on the productivity, dieback, and biomass of western Canadian aspen forests. Can. J. For. Res. 2008, 38, 1373–1384. [Google Scholar] [CrossRef]
  23. Leonelli, G.; Denneler, B.; Bergeron, Y. Climate sensitivity of trembling aspen radial growth along a productivity gradient in northeastern British Columbia, Canada. Can. J. For. Res. 2008, 38, 1211–1222. [Google Scholar] [CrossRef]
  24. Huang, J.; Tardif, J.C.; Bergeron, Y.; Denneler, B.; Berninger, F.; Girardin, M.P. Radial growth response of four dominant boreal tree species to climate along a latitudinal gradient in the eastern Canadian boreal forest. Glob. Chang. Biol. 2009, 16, 711–731. [Google Scholar] [CrossRef]
  25. Chhin, S. Influence of climate on the growth of hybrid poplar in Michigan. Forests 2010, 1, 209–229. [Google Scholar] [CrossRef]
  26. Pawson, S.M.; Brin, A.; Brockerhoff, E.G.; Lamb, D.; Payn, T.W.; Paquette, A.; Parrotta, J.A. Plantation forests, climate change and biodiversity. Biodivers. Conserv. 2013, 22, 1203–1227. [Google Scholar] [CrossRef]
  27. Zalesny, R.S., Jr.; Headlee, W.L. Developing woody crops for the enhancement of ecosystem services under changing climates in the north central United States. J. For. Environ. Sci. 2015, 31, 78–90. [Google Scholar] [CrossRef]
  28. Laidly, P.R. Bigtooth Aspen (Populus grandidentata Michx.). Available online: http://www.na.fs.fed.us/pubs/silvics_manual/volume_2/populus/grandidentata.htm (accessed on 3 December 2015).
  29. Perala, D.A. Quaking Aspen (Populus tremuloides Michx.). Available online: http://www.na.fs.fed.us/pubs/silvics_manual/volume_2/populus/tremuloides.htm (accessed on 3 December 2015).
  30. Reighard, G.L. Physiological Genetics Studies of Populus Grandidentata, Populus Tremuloides, and Their Hybrid, Populus X smithii. Ph.D. Thesis, Michigan State University, East Lansing, MI, USA, 1984. [Google Scholar]
  31. Reighard, G.L.; Hanover, J.W. Progeny testing of native aspens and their hybrids for biomass production in Michigan. In Tree Improvement and Genetics—Northeastern Forest Tree Improvement Conference—1985; West Virginia University: Morgantown, WV, USA, 1985; pp. 5–22. [Google Scholar]
  32. National Climatic Data Center. Monthly Suface Data; National Climatic Data Center: Asheville, NC, USA, 2010. [Google Scholar]
  33. Stokes, M.A.; Smiley, T.L. An Introduction to Tree-Ring Dating; The University of Arizona Press: Tuscon, AZ, USA, 1996. [Google Scholar]
  34. Yamaguchi, D.K. A simple method for cross-dating increment cores from living trees. Can. J. For. Res. 1991, 21, 414–416. [Google Scholar] [CrossRef]
  35. Metsaranta, J.M.; Lieffers, V.J. Using dendrochronology to obtain annual data for modelling stand development: A supplement to permanent sample plots. Forestry 2009, 82, 163–173. [Google Scholar] [CrossRef]
  36. Hogg, E.H. Temporal scaling of moisture and the forest-grassland boundary in western Canada. Agric. For. Meteorol. 1997, 84, 115–122. [Google Scholar] [CrossRef]
  37. Jones, P.D.; Hulme, M. Calculating regional climatic time series for temperature and precipitation: methods and illustrations. Int. J. Clim. 1996, 16, 361–377. [Google Scholar] [CrossRef]
  38. Venables, W.N.; Ripley, B.D. Modern Applied Statistics with S, 4th ed.; Springer: New York, NY, USA, 2002. [Google Scholar]
  39. R Core Team. R: A Language and Environment for Statistical Computing; R Foundation for Statistical Computing: Vienna, Austria, 2014. [Google Scholar]
  40. Burnham, K.P.; Anderson, D.R. Model Selection and Multimodel Inference: A Practical Information-Theoretic Approach; Springer-Verlag: New York, NY, USA, 2002; p. 488. [Google Scholar]
  41. Zar, J.H. Biostatistical Analysis, 4th ed.; Prentice Hall: Upper Saddle River, NI, USA, 1999; p. 663. [Google Scholar]
  42. Flato, G.M.; Boer, G.J. Warming asymmetry in climate change simulations. Geophys. Res. Lett. 2001, 28, 195–198. [Google Scholar] [CrossRef]
  43. Intergovernmental Panel On Climate Change. Climate Change 2007: The Physical Science Basis; IPCC WGI Fourth Assessment Report; Cambridge University Press: Cambridge, UK, 2007. [Google Scholar]
  44. Magruder, M.; Chhin, S.; Palik, B.; Bradford, J.B. Thinning increases climatic resilience of red pine. Can. J. For. Res. 2013, 43, 878–889. [Google Scholar] [CrossRef]