1. Introduction
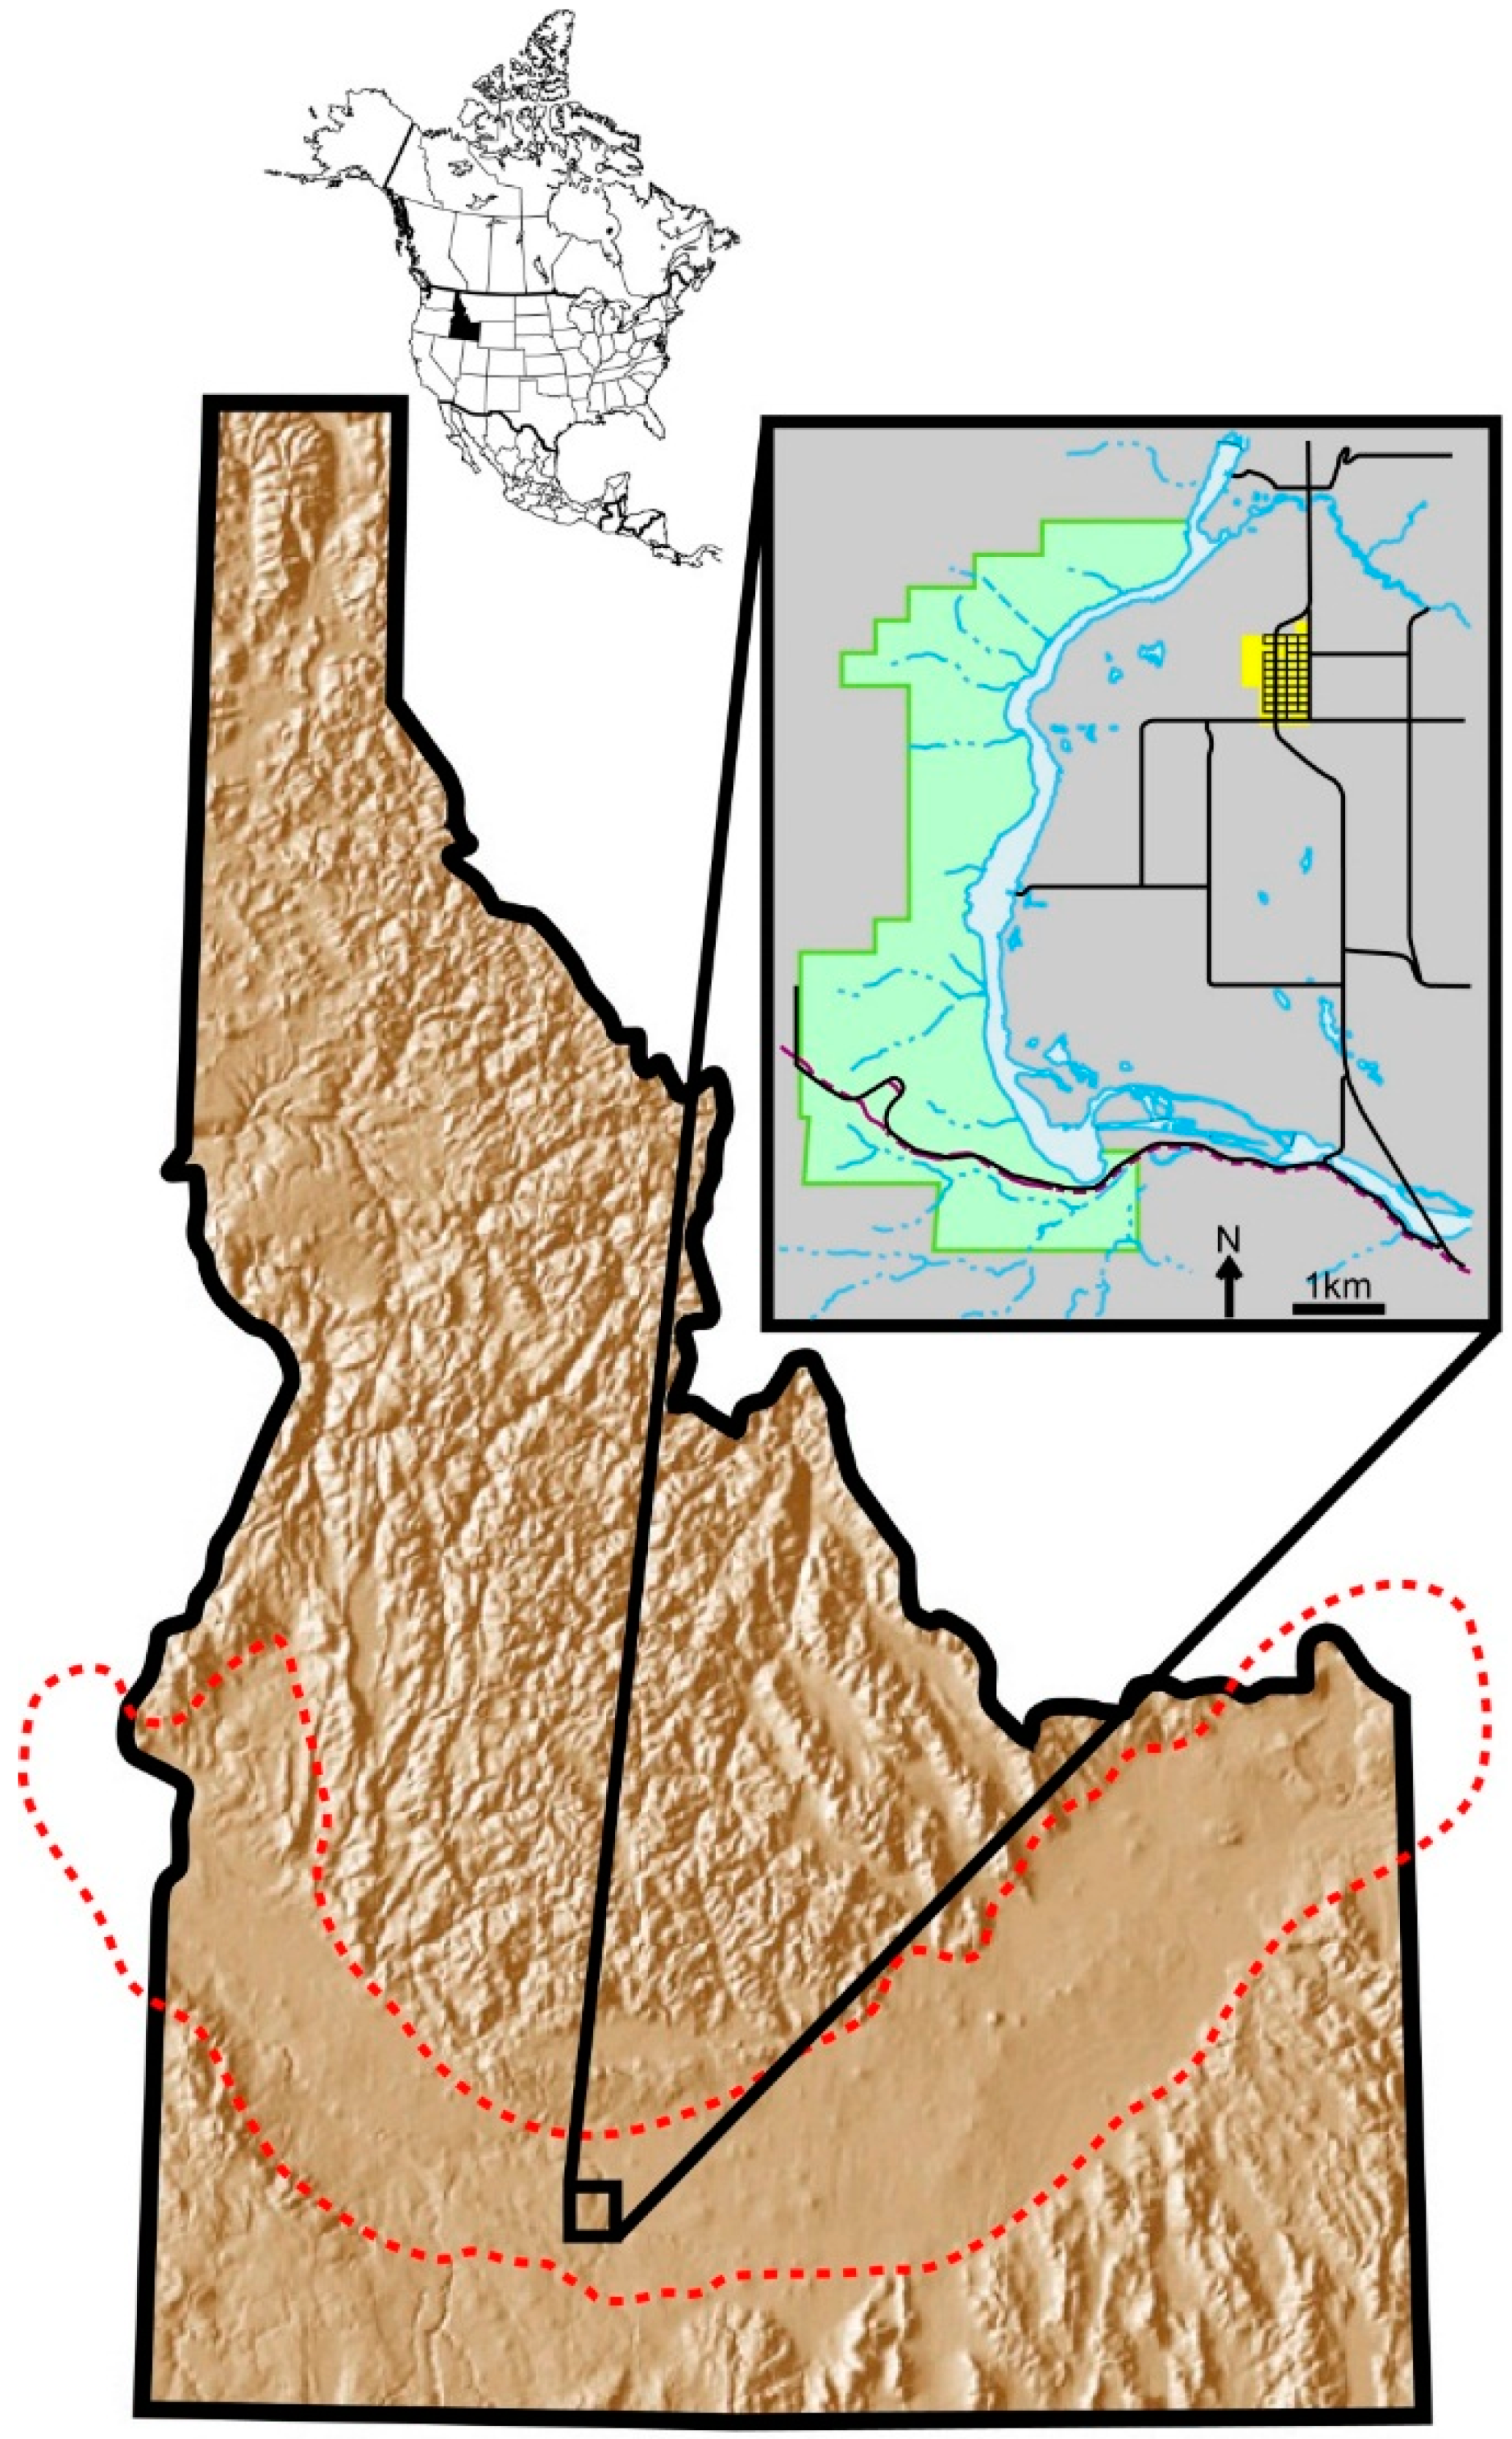
Hagerman Fossil Beds National Monument (HAFO) in southern Idaho (
Figure 1) is internationally significant because it is one of the richest sources of Pliocene vertebrates. Hundreds of localities within the exposed beds of the Glenns Ferry Formation have produced many thousands of fossil mammals housed at museums across the United States [
1]. These localities range in age from about 4.2 to 3.1 Ma [
2]. This is the first in a series of notes that document the stratigraphic distribution of fossil mammals at HAFO. Comparisons are here made with the estimated paleoclimate during the Pliocene represented in the Glenns Ferry Formation. This study examines the distribution of carnivorans at HAFO, but the relative paucity of those fossils, compared to some other groups, means that future studies may have important implications for the interpretations below.
There are at least 54 species of mammals at HAFO, including 17 species of carnivorans [
1]. Eight species of carnivorans were named on holotypes from HAFO; of these, six are still valid. Publication on these specimens began in the 1930s [
3,
4,
5], but comprehensive description of the carnivorans from HAFO was completed much later [
6]. The taxonomy of these species is reviewed elsewhere with a discussion on their geographic distributions [
1].
2. Materials and Methods
In spite of the species-level diversity and overall number of mammalian fossils at HAFO, the number of specimens referable to carnivorans is low; only 361 fossils were recognized during the preparation of this manuscript. Only specimens with well-established locality data were included in this study. Additionally, only specimens that could be identified to species, or as
Taxidea sp. or
Homotherium sp. (the sparse material does not allow for more specific identification), were used. The 256 specimens used here are listed in
Supplementary file (
List S1). (Collections of fossils at HAFO have continued since the data in this manuscript were collected, resulting in additional specimens, particularly mustelids [
9], and the possible addition of two carnivoran taxa [
10].)
Although a Minimum Number of Individuals (MNI) is commonly preferred in analysis of abundance in a fauna (e.g., Lyman [
11]), it is not an empirical observational unit such as the number of identifiable specimens (NISP). In fact, the MNI must be calculated from the NISP, and the method involved can include various criteria [
12]. In the case of a single locality with abundant fossils, comparisons of MNI instead of NISP can give significantly different results. However, at HAFO there are hundreds of localities, so the MNI would have to be calculated for each locality because it is unlikely that different localities will contain specimens from the same individual. Because the ratio of localities to specimens is so high, about two to one, and no localities are especially abundant with carnivorans, the MNI and NISP of carnivorans at HAFO are similar. In fact, Bjork [
6] examined 196 carnivoran fossils, but calculated an MNI of 173. In this particular case, use of NISP instead of MNI has little impact on the results.
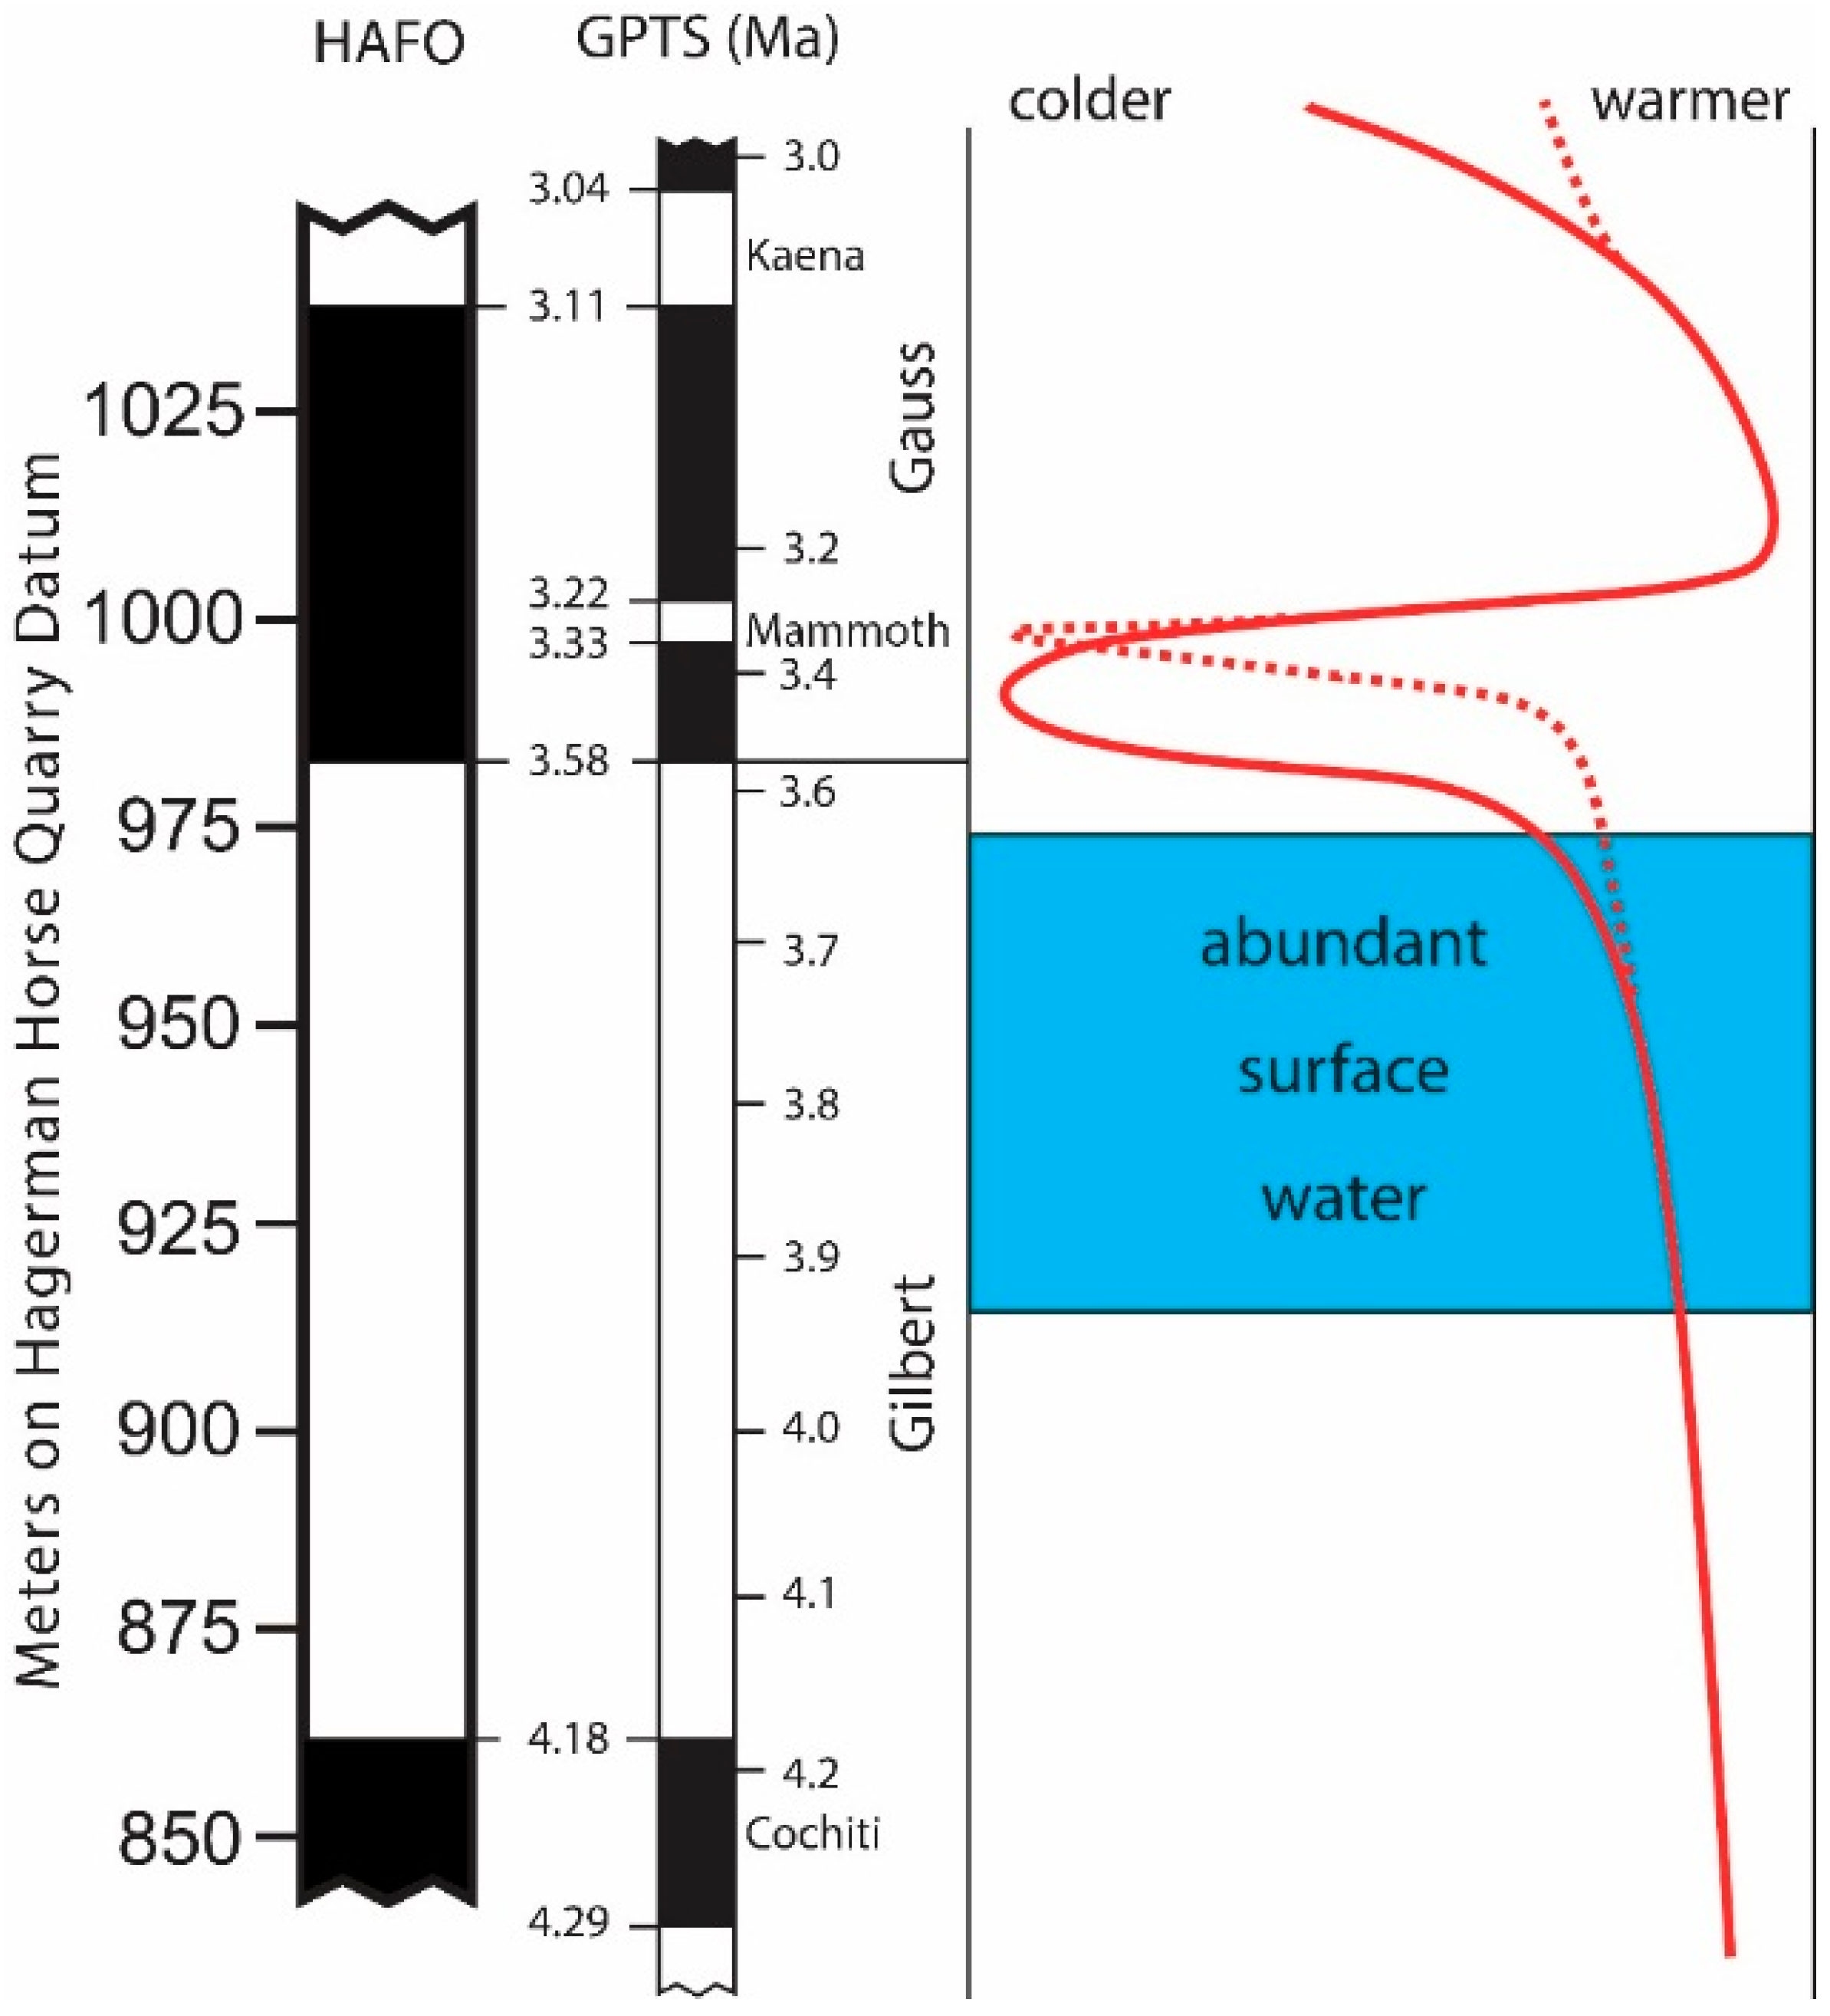
Proxy data for paleoecological interpretations for HAFO (
Figure 2) follow Ruez [
13]. Stratigraphic distribution of specimens is based on placement of localities on the Hagerman Horse Quarry (HHQ) datum (sensu Ruez [
2]). This facilitates comparison of sites across HAFO. Specimen and species abundances were plotted at 1-m intervals with a sliding window of 20 m for the stratigraphic span encompassing the majority of localities at HAFO: 900 to 1005 m on the HHQ datum, or about 4.0 to 3.2 Ma. By using a sliding window some detail may be lost, but the pattern will more accurately reflect overall trends and not be as subject to distorting spikes from particularly fossiliferous localities. Further, the sliding window acknowledges that there is difficulty in placing some localities stratigraphically.
Institutional abbreviations: HAFO, Hagerman Fossil Beds National Monument (Hagerman, ID, USA); IMNH, Idaho Museum of Natural History (Pocatello, ID, USA); UMMP, University of Michigan Museum of Paleontology (Ann Arbor, MI, USA); USNM, United States National Museum (Washington, DC, USA).
3. Results
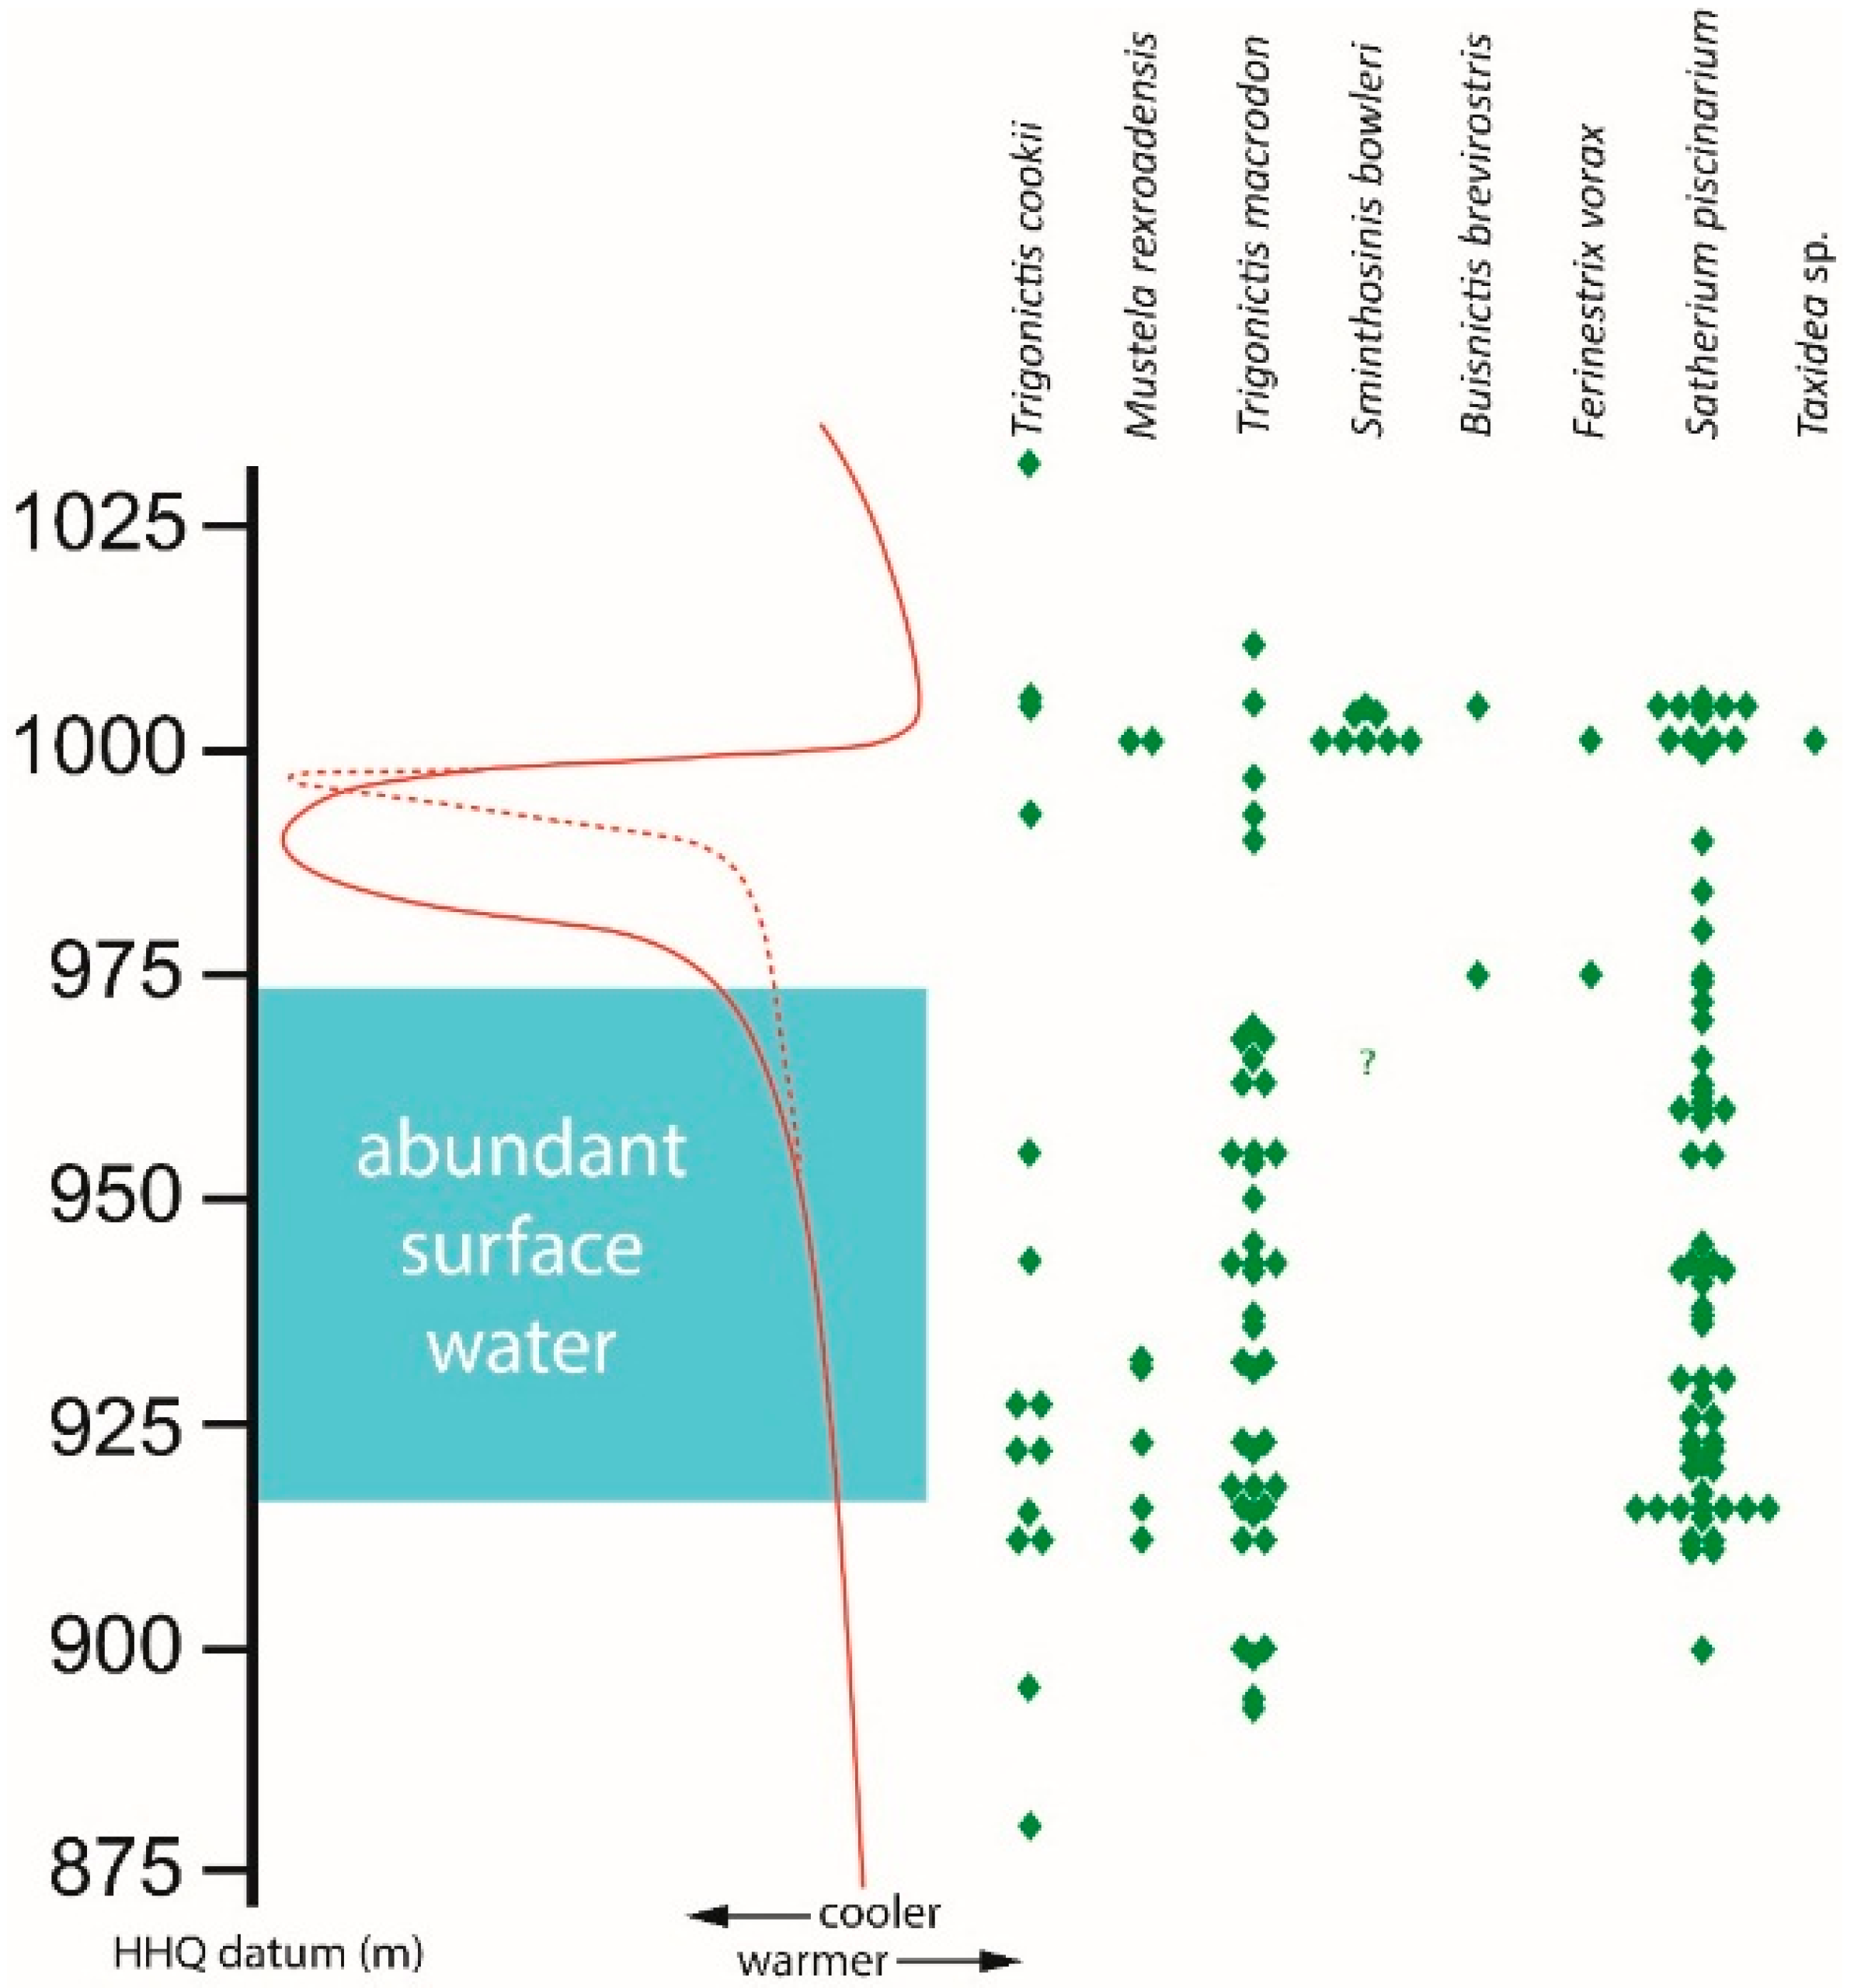
Three mustelids,
Trigonictis cookii,
Trigonictis macrodon, and
Satherium piscinarium, have stratigraphic ranges of more than 100 m (>0.82 myr) each at HAFO; a fourth,
Mustela rexroadensis, extends for almost 90 m (0.73 myr;
Figure 3). The ranges for three of these long-persisting taxa,
T. cookii,
M. rexroadensis, and
T. macrodon, contain significant gaps coinciding with the transition from an interval of abundant surface water to one lacking surface water; that interval also is marked by dramatic cooling. The most abundant mustelid,
S. piscinarium, does not exhibit such a significant gap, but the number of specimens of this species is reduced within that interval. It is within that interval that two other mustelids,
Buisnictis breviramus and
Ferinestrix vorax, first appear at HAFO.
Sminthosinis bowleri and
Taxidea sp. first appear at the end of an abrupt warming at HAFO. Another specimen of
S. bowleri, from about 35 m (~0.45 myr) lower in the Glenns Ferry Formation, was identified previously [
6], but this edentulous partial maxilla (UMMP 51681) is also similar in size and morphology to
T.
cookii. That specimen does not have any diagnostic characters allowing for referral to either
S. bowleri or
T. cookii.
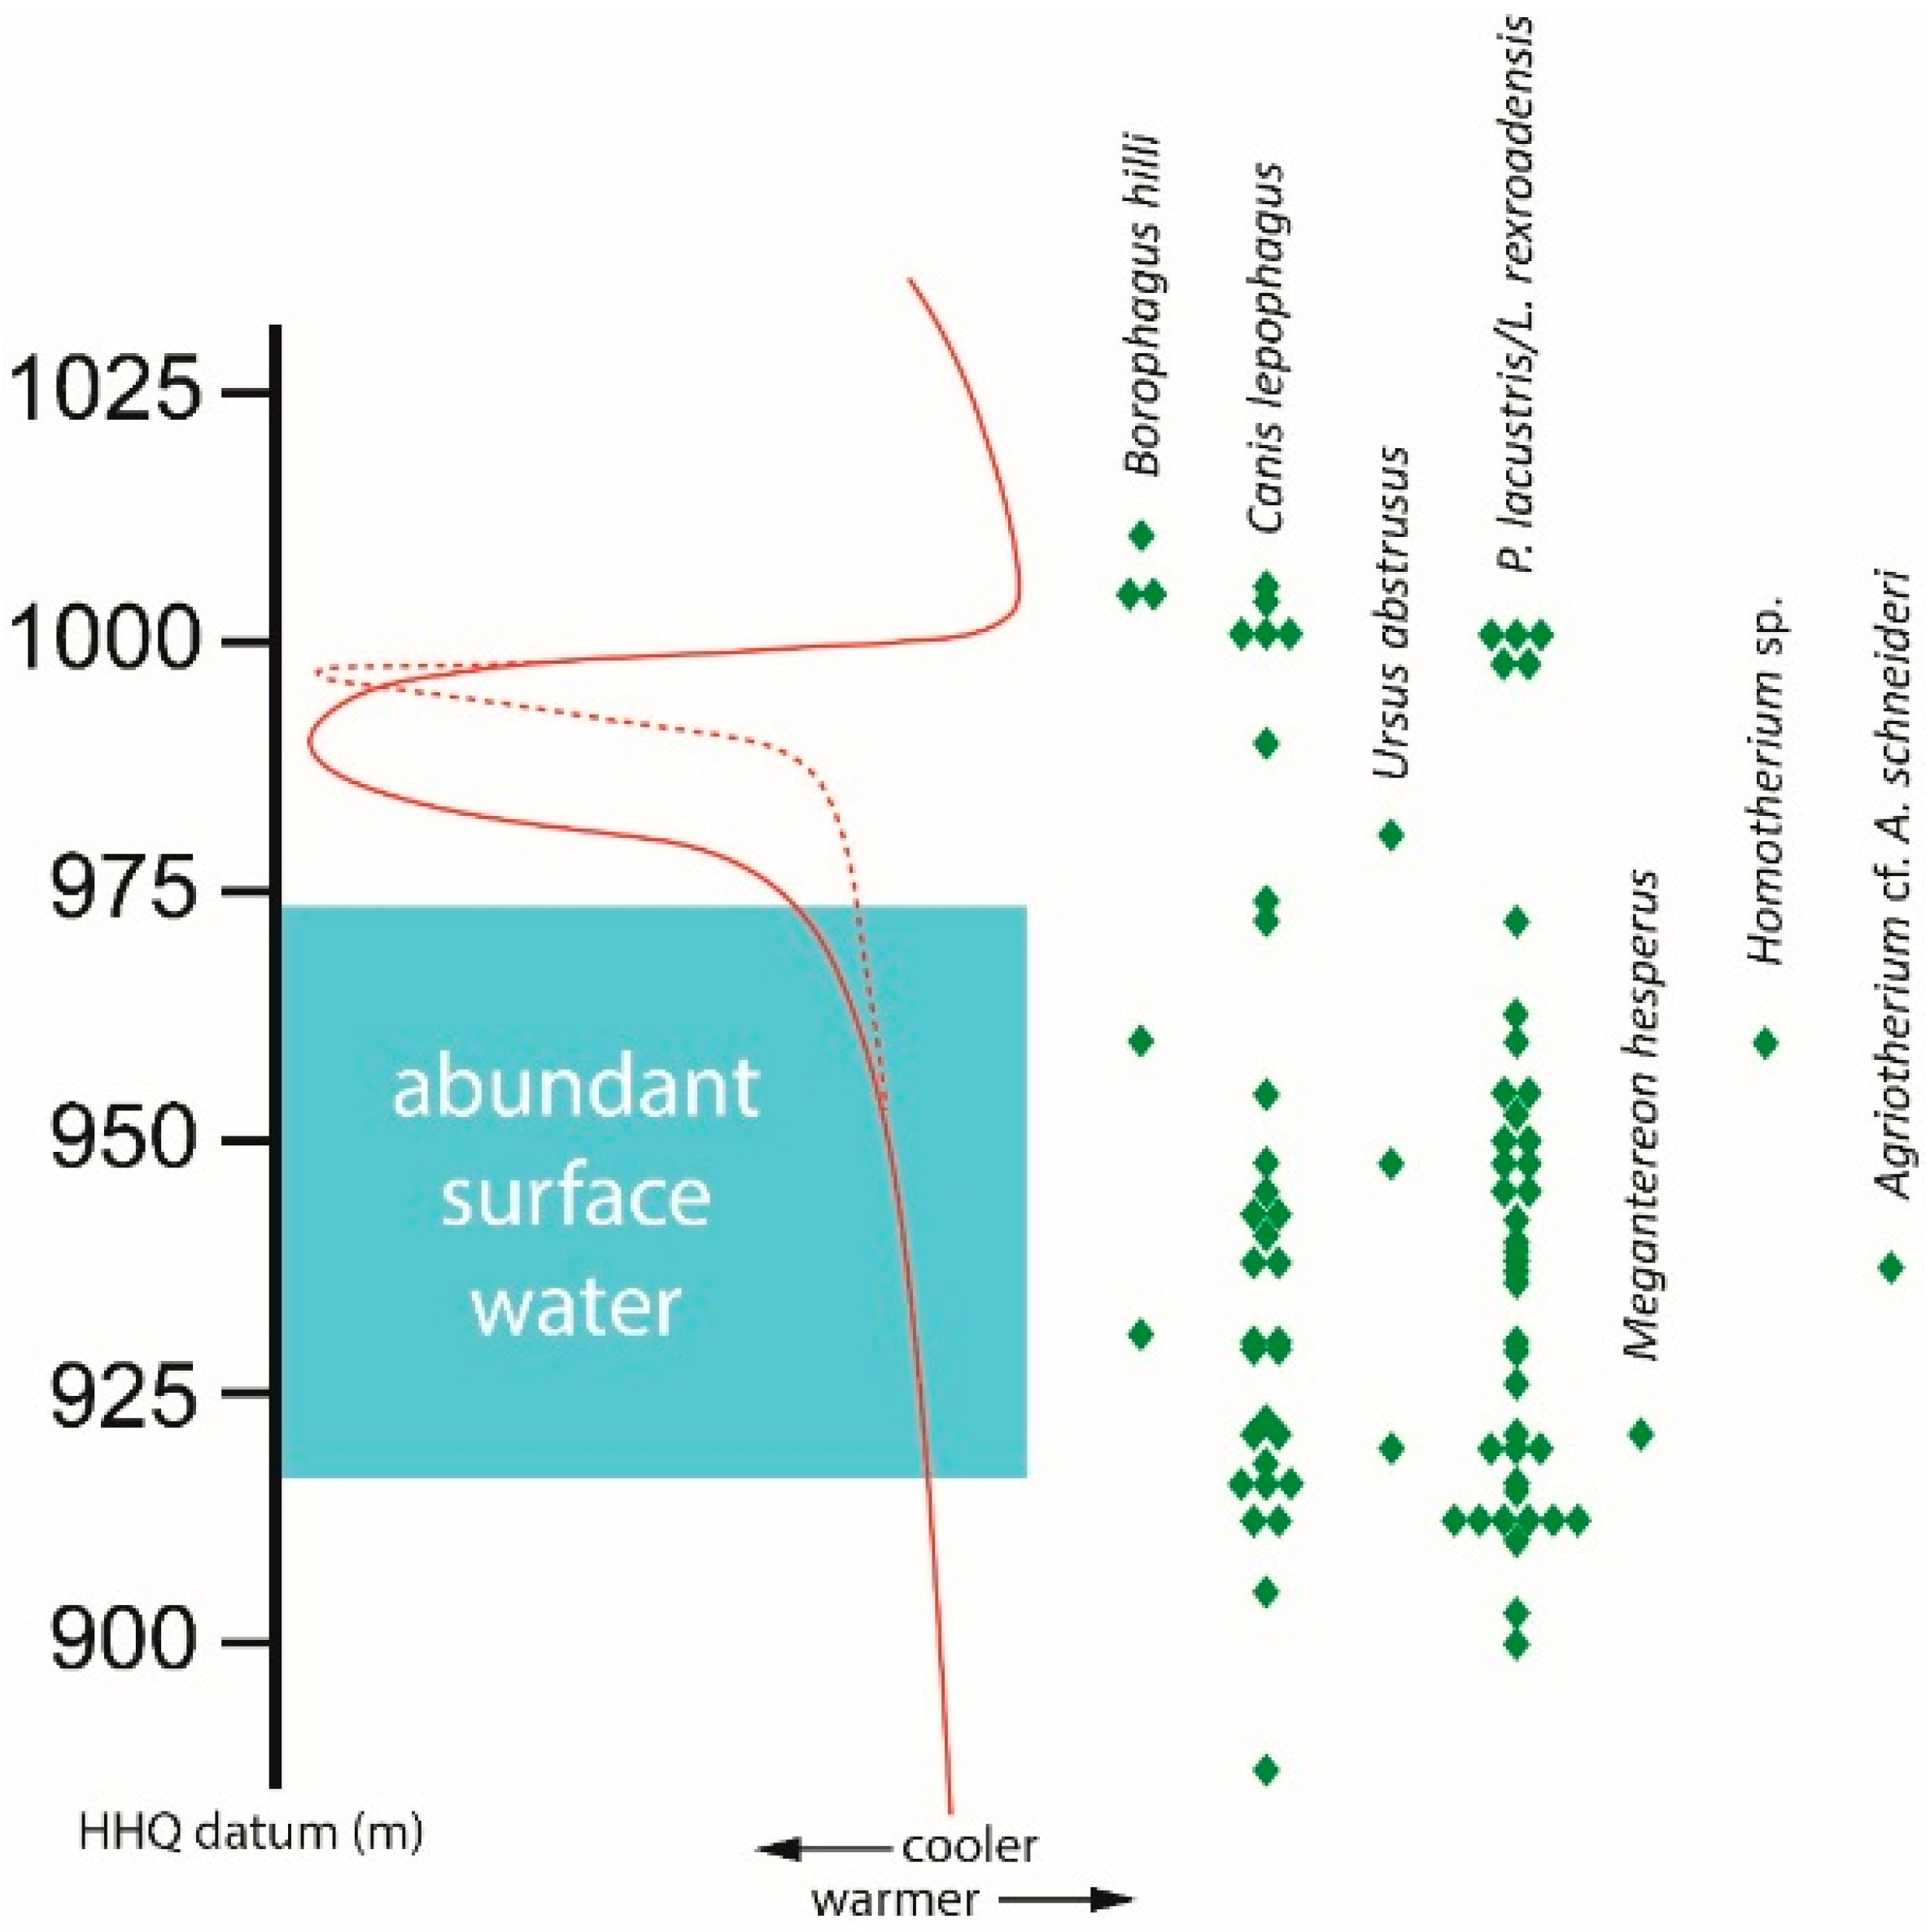
Two large felids,
Megantereon hesperus and
Homotherium sp., are known from only one specimen each with precise stratigraphic data; the single fossil representing
Miracinonyx inexpectatus (USNM 12613) lacks locality data and is therefore excluded from this analysis. Two small felids,
Puma lacustris and
Lynx rexroadensis, are known from HAFO, but they are extremely similar in skeletal morphology. Most elements of these species cannot be distinguished, and unfortunately the ones that have diagnostic characters do not have associated stratigraphic data. Therefore, these two cats are plotted together in
Figure 4.
Large carnivorans (canids, ursids, felids) known from multiple specimens with stratigraphic data all have a long temporal range at HAFO. Canis lepophagus and P. lacustris/L. rexroadensis have ranges of more than 100 m (>0.82 myr). Even rare species such as Borophagus hilli, known from only five fossils with precise field data, and Ursus abstrusus, known from only three specimens, have stratigraphic distributions of 80 m (0.69 myr) and 62 m (0.33 myr), respectively.
As in the case of some mustelids, two of the above large carnivorans have gaps in their record that correspond to the end of abundant surface water and the beginning of pronounced cooling. There is a 26 m (0.39 myr) gap in the distribution of P. lacustris/L. rexroadensis. A 45 m (0.51 myr) gap occurs in the range of the specimens of B. hilli, but again, that species is known from few fossils at HAFO. The range of Canis lepophagus does not include this significant gap, but localities within the cool interval only produced a single specimen. Records of U. abstrusus occur in intervals both with and without abundant surface water, but all are known prior to the abrupt cooling event at HAFO. The specimens of Megantereon hesperus, Homotherium sp., and Agriotherium cf. A. schneideri occur during warm periods of abundant surface water.
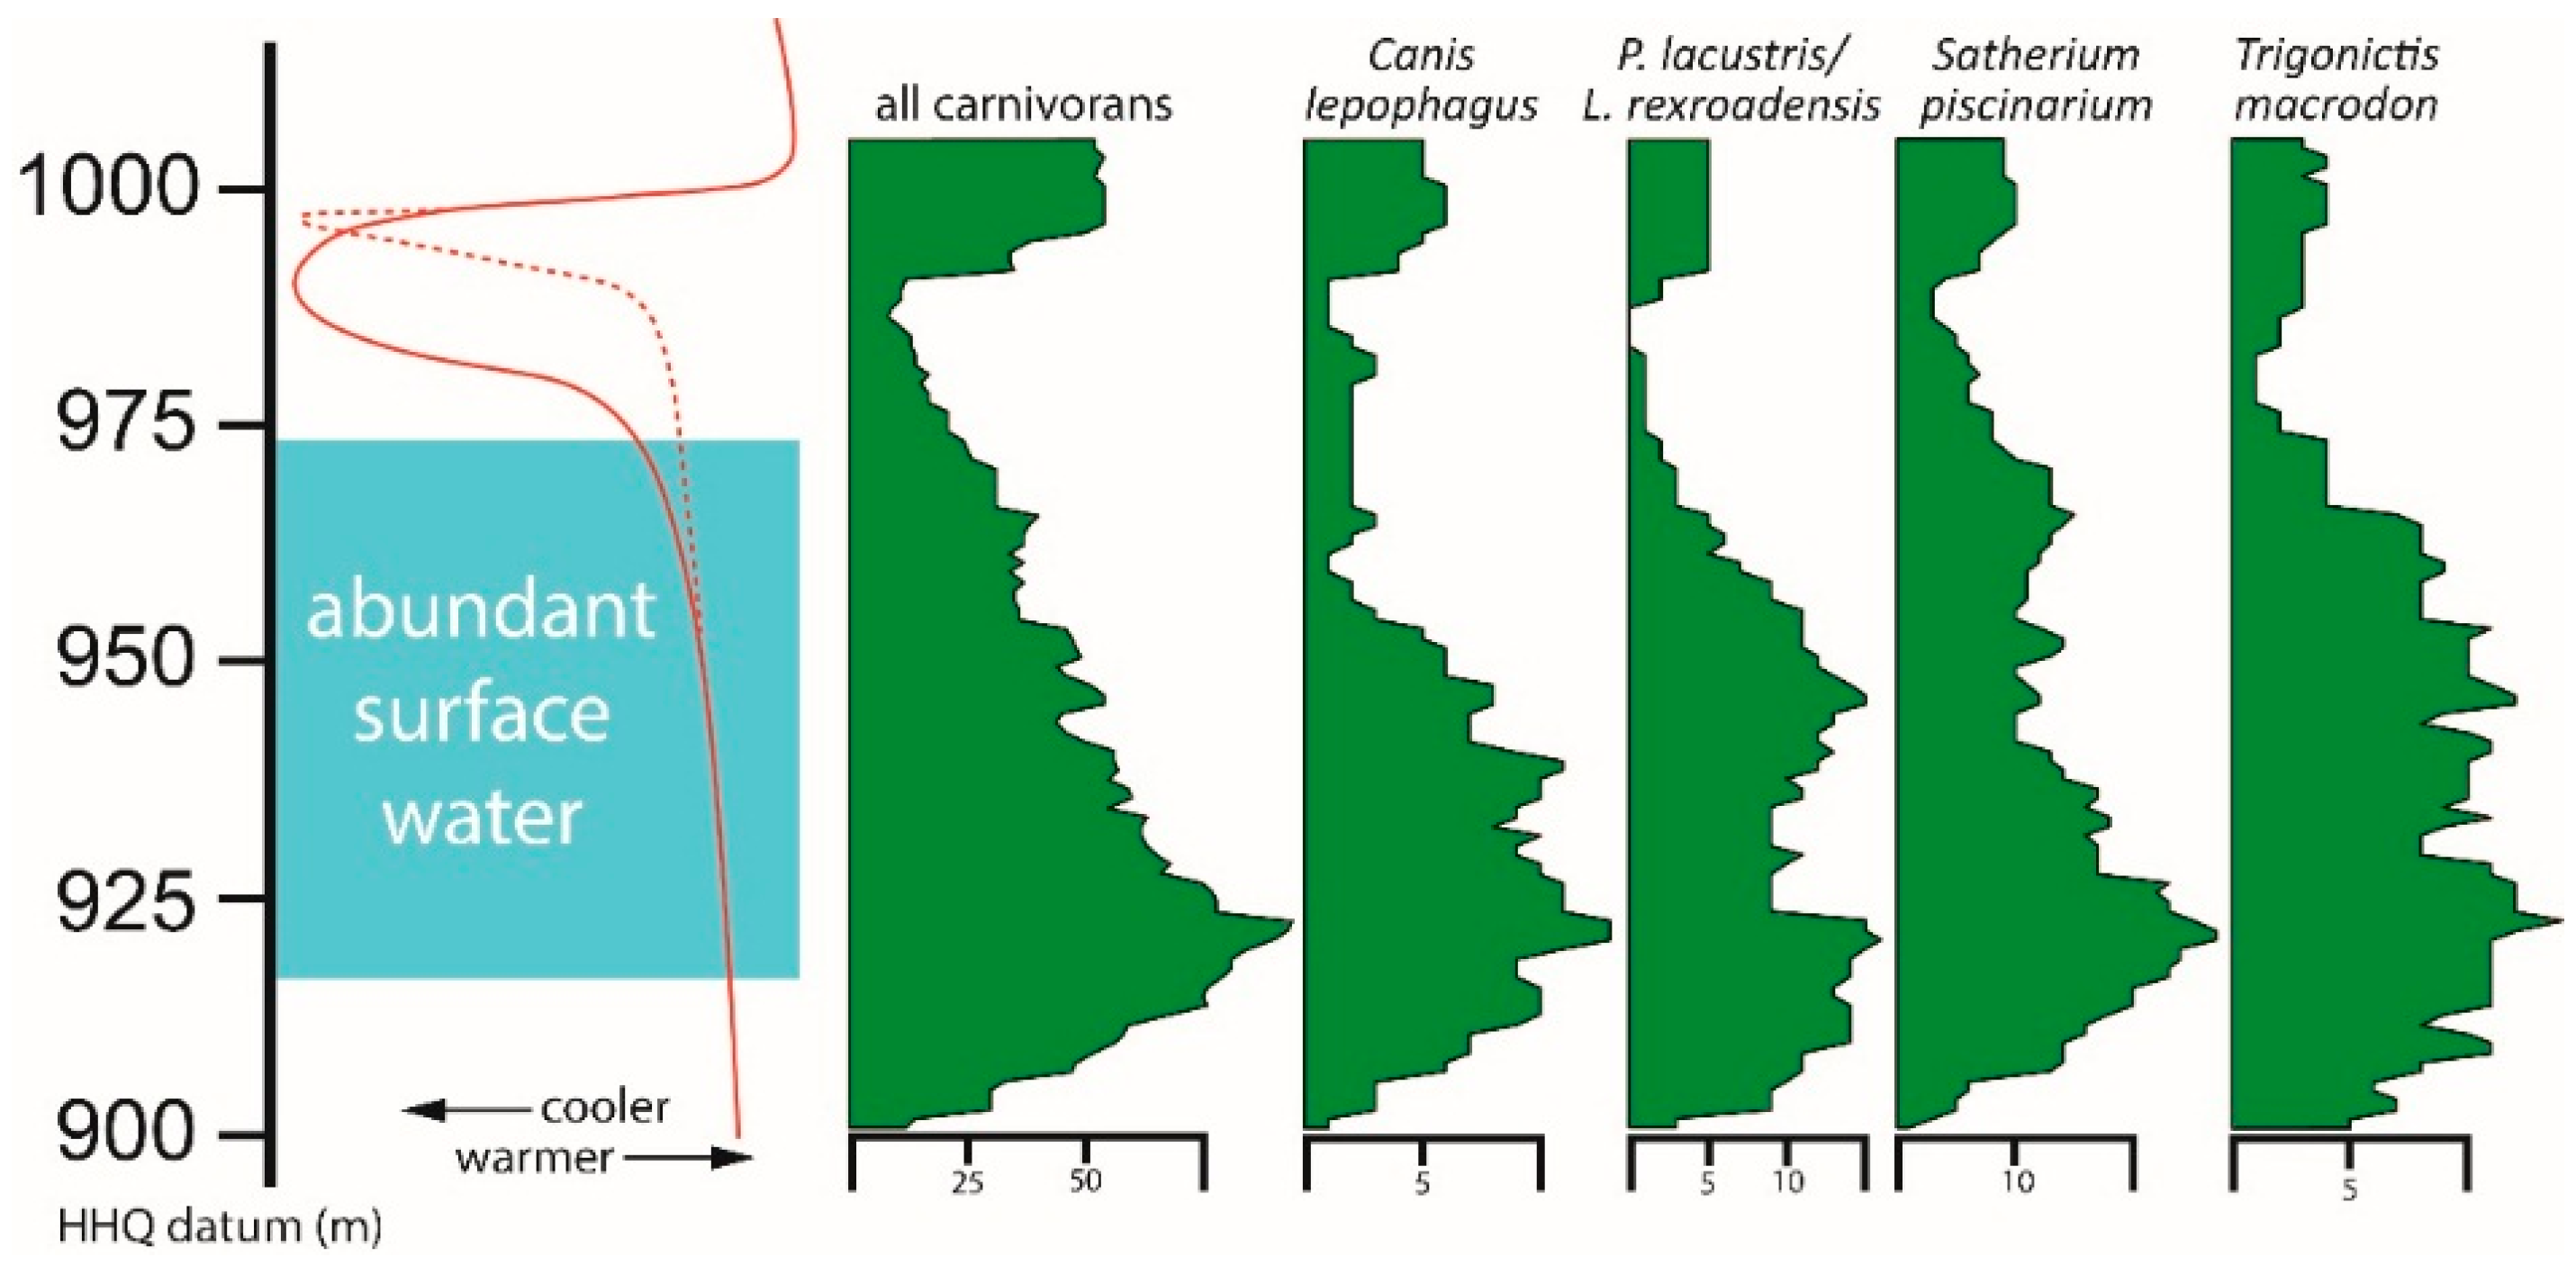
Specimen abundance of the four most abundant taxa were examined and compared to the pattern of all carnivorans combined (
Figure 5). Overall, the pattern for each species is similar to that for all carnivorans combined. This pattern, in turn, corresponds closely to the temperature trend at HAFO.
Specimen-level abundances for C. lepophagus and P. lacustris/L. rexroadensis decreased during the interval of slow climatic cooling. Patterns for S. piscinarium and T. macrodon show a delayed response, more closely matching the end of abundant surface water and the onset of rapid temperature decrease. The abundance of P. lacustris/L. rexroadensis is also decreased low in the stratigraphic section, near the bottom of the interval of abundant surface water.
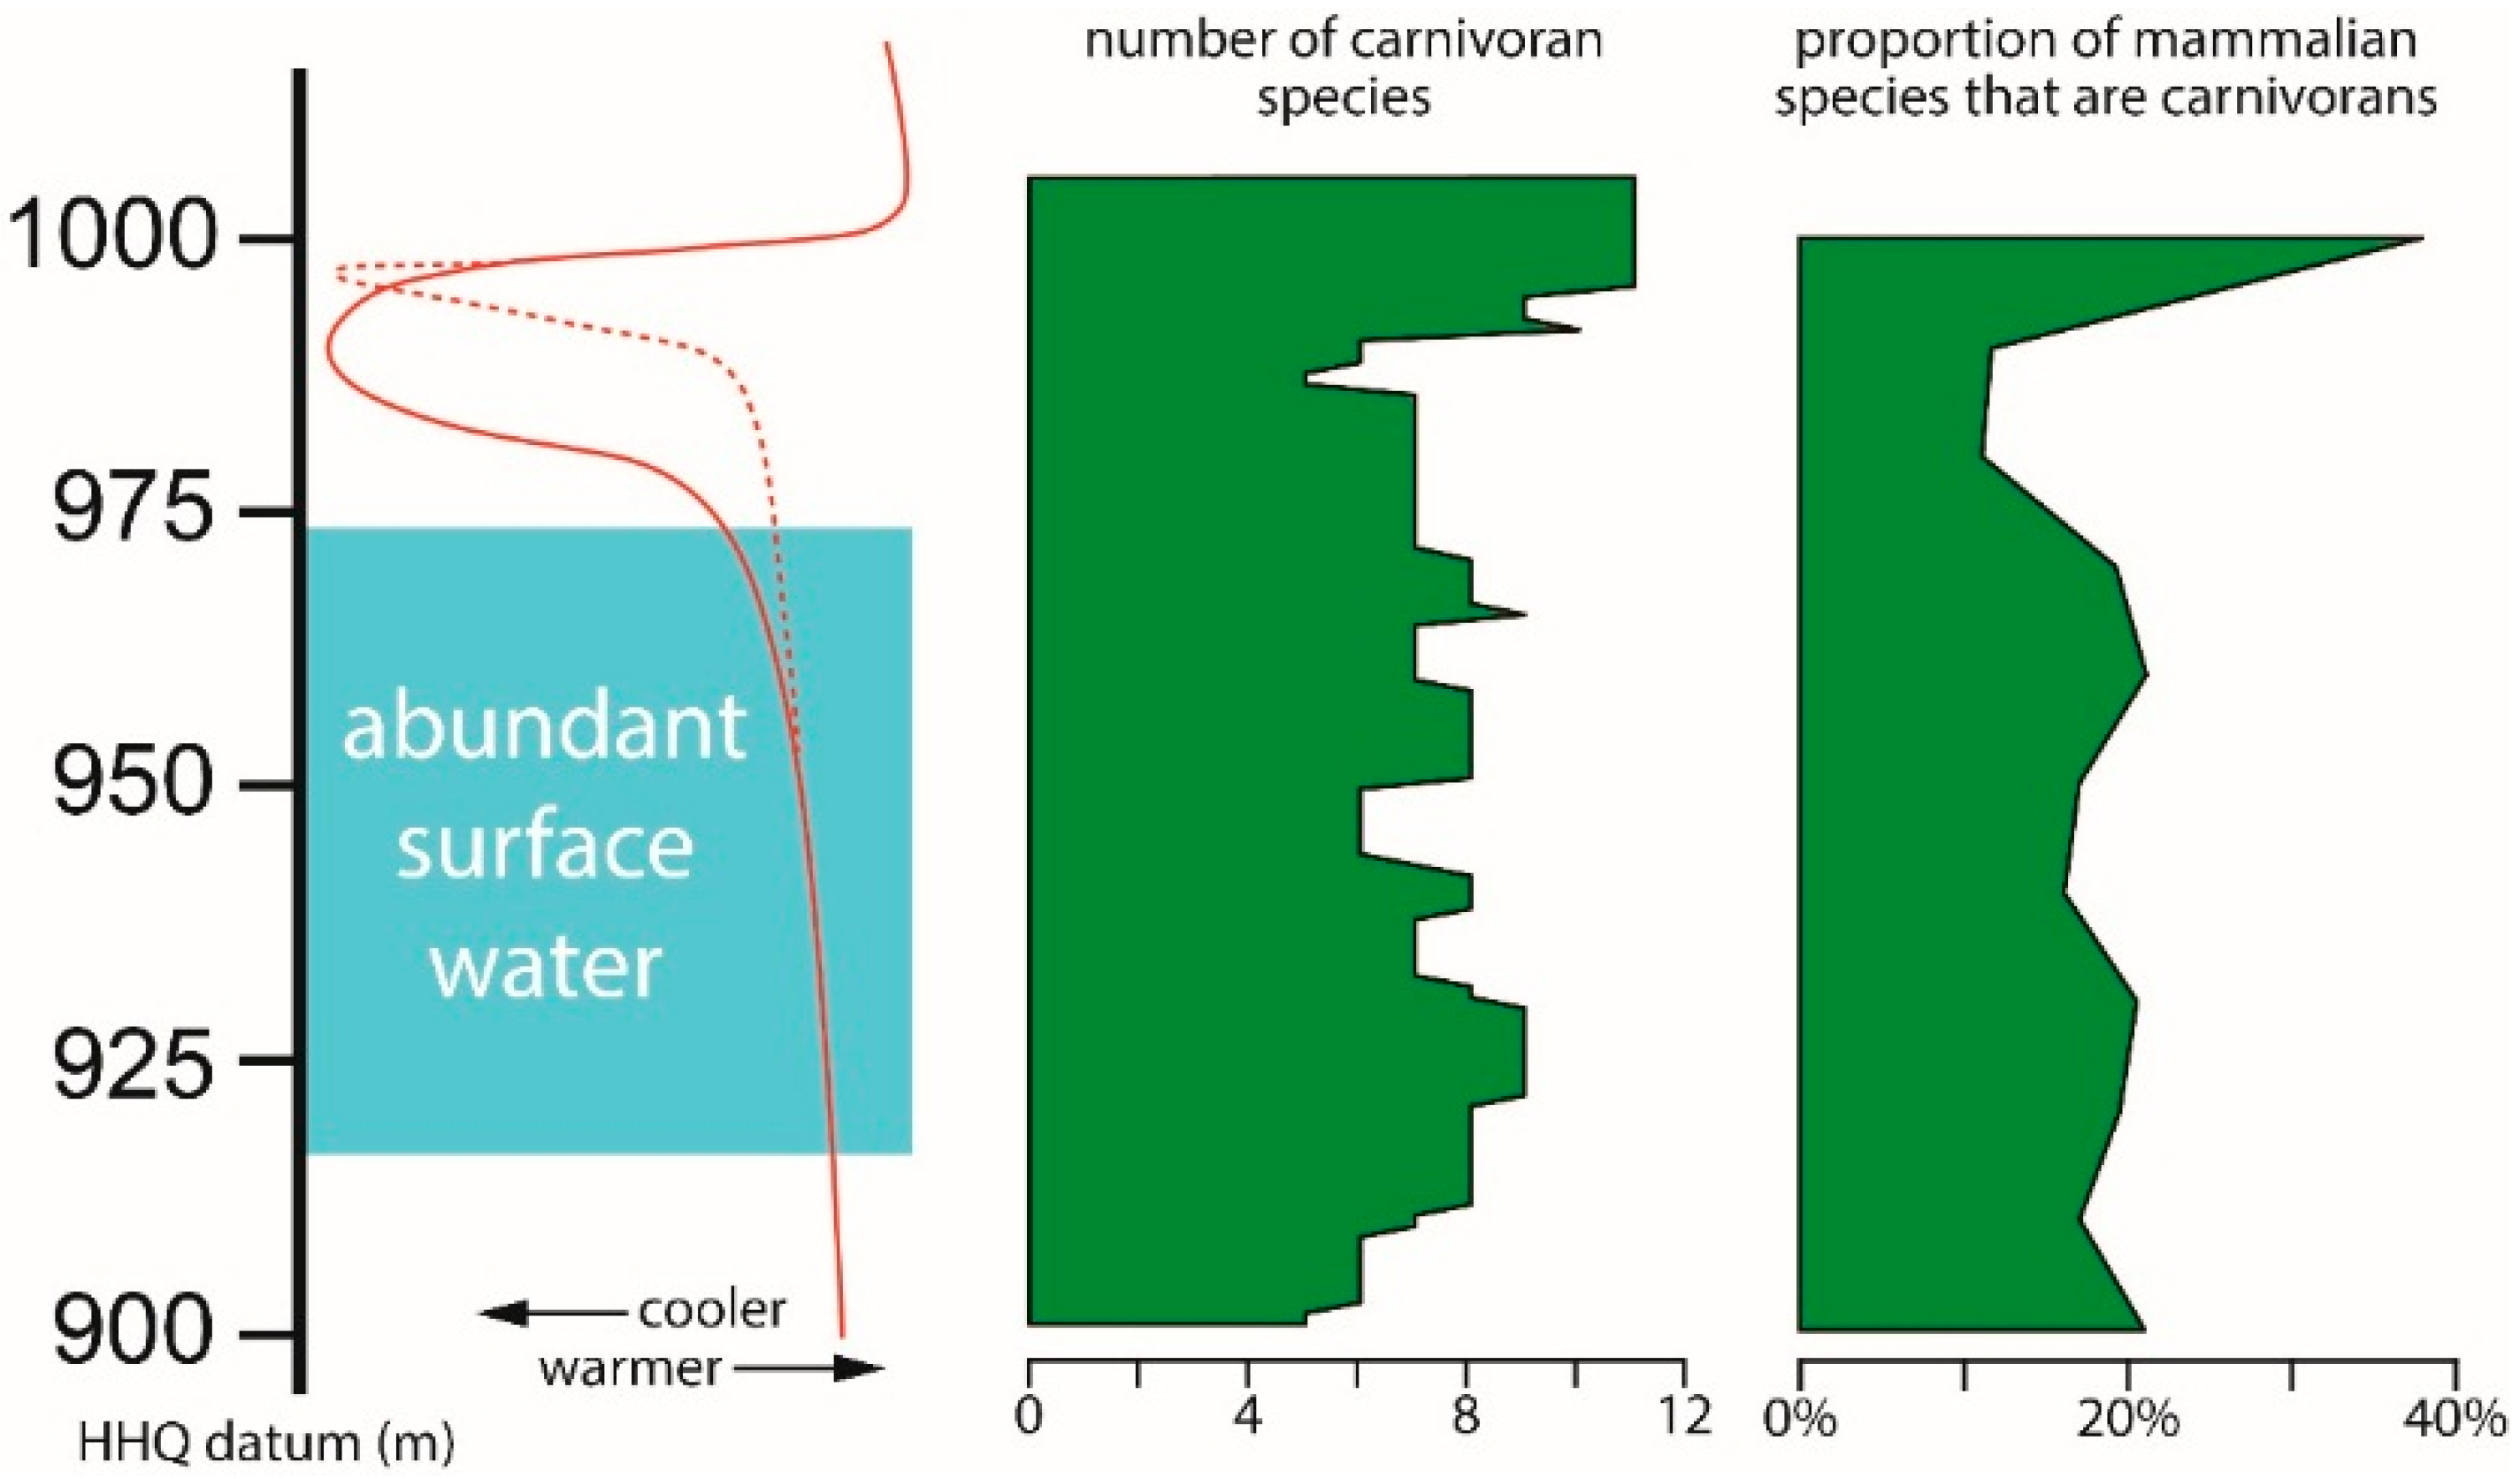
The number of carnivoran species is relatively constant throughout most of the HAFO section, until the very top of the section (
Figure 6). The pattern is similar, but more pronounced, when the number of carnivoran species is plotted as a proportion of all mammalian species. Both the absolute and relative abundance of carnivoran species have a positive correlation with the estimated temperature trend.
4. Conclusions
Beginning at about the 975 m stratigraphic level there is a faunal change at HAFO that coincides with the end of abundant surface water and a decrease in temperature. At this point, two mustelids,
S. bowleri and
F. vorax, first appear at HAFO. Mustelids reach their peak diversity at the warm, dry interval around 1000 m, while the diversity of large carnivorans is highest lower in the section, during an interval of abundant surface water as suggested by sedimentological data [
2].
Among the abundant carnivorans, the specimen abundance of C. lepophagus begins a sharp decline with an increasing rate of cooling at 950 m; distribution of this species is seemingly unaffected by the presence or absence of abundant surface water. Likewise, P. lacustris/L. rexroadensis shows a reducing abundance of specimens before the end of the wet interval, and additionally has reduced numbers of specimens low in the section with abundant surface water. The abundance of T. macrodon does not decrease markedly until the end of the wet interval, where it actually increases through the continued cooling. Distribution of T. macrodon is here suggested as more dependent on the presence of surface water/moisture than temperature. The abundance of S. piscinarium appears linked to both temperature and surface moisture. The number of specimens decreases at the end of the wet interval, as in T. macrodon, but continues to decrease, matching the temperature curve.
Correlation of specimen and species abundance with estimated temperature at HAFO is not the result of a lack of fossiliferous localities in the cool interval [
2]. However, in modern environments warmer temperatures and wetter environments are correlated with increased carnivoran species diversity and higher numbers of individuals [
15]; some Quaternary faunas also seem to follow this trend (e.g., Dayan [
16]). Species richness in the carnivoran assemblage from HAFO is relatively constant through intervals of varying temperature and levels of aridity, until the sharp increase in temperature near the top of the section where the assemblage becomes more speciose. The study of Pliocene and Pleistocene carnivorans from east Africa documents the highest species diversity during an interval from 3.3 to 3.0 Ma [
17]; this range that corresponds to the age of the sediments containing the spike of carnivoran richness at HAFO.
Although the fossil richness of localities throughout HAFO will vary, calculating the relative abundance of carnivoran species as a proportion of all mammalian species adjusts for this difference. The lowest proportion of carnivorans occurred in the dry cool interval, and the highest occurred with the rapid return to warm temperatures. Analysis of Pleistocene mammalian faunas from Italy also showed decreased predator/prey ratios with cooler temperatures [
18]; however, unlike HAFO, the ratios in the Italian faunas result from increased herbivore richness during cold times [
19]. In contrast to those studies, the proportion of carnivorans in the mammalian fauna of Hayonim Cave in Israel is at both the highest and the lowest during cold intervals [
16]. This disparity of results suggests that the correlation of temperature and relative abundance of carnivorans at HAFO may not be the result of impacts on carnivorans, but on other aspects of the faunas.
Changes documented here for HAFO primarily occur in association with the end of abundant surface water and onset of rapid cooling. Even though this interval persisted for about 300 ky until the return of warm temperatures, the carnivoran assemblage proved resilient, at least in part. At least five species were present early at HAFO, disappeared during the rapid cooling, and reappeared afterwards. Specimen abundance also rebounded with the return to warmer temperatures. Three large carnivorans did not reappear after the rapid cooling, but they are known from only a few total specimens.
The carnivoran assemblage at HAFO did differ following the interval of rapid change. In particular, the mustelid diversity greatly increased. For the earliest ~600 ky, there were only four mustelid species represented at HAFO; once the temperature warmed again, eight species of mustelids occurred. This increase is not merely a result of increased overall mammalian diversity at HAFO, because the relative abundance of carnivoran species is double that of earlier times at HAFO. Unfortunately, the distribution of localities does not allow the determination of whether these ecological changes persisted long-term or were a brief response to the rapid warming. There are few deposits of the Glenns Ferry Formation at HAFO that are stratigraphically higher than the rapid warming event. However, future collections may help refine our picture of carnivoran changes with climate at HAFO.
Acknowledgments
This work comprised a portion of my doctoral dissertation, and I appreciate the input of ChrisBell (The University of Texas at Austin (UT)), Greg McDonald (U.S. National Park Service (NPS)), Tim Rowe (UT), Jim Sprinkle (UT), Richard Zakrzewski (Fort Hays State University), and the UT paleontology graduate students for their suggestions and support. Assess to collections at HAFO were facilitated by Phil Gensler (NPS) and Greg McDonald; Bill Akersten (Idaho Museum of Natural Hisotory (IMNH)) and Mary Thompson (IMNH) provided access to materials at IMNH. Funding for my visits to Idaho was provided by The University of Texas at Austin Department of Geological Sciences, Geology Foundation, and Graduate School.
Conflicts of Interest
The author declares no conflict of interest.
Abbreviations
The following abbreviations are used in this manuscript:
| GPTS | Geomagnetic Polarity Time Scale |
| HAFO | Hagerman Fossil Beds National Monument (Hagerman, ID, USA) |
| myr | Million Years |
| IMNH | Idaho Museum of Natural History (Pocatello, ID, USA) |
| UMMP | University of Michigan Museum of Paleontology (Ann Arbor, MI, USA) |
| USNM | United States National Museum (Washington, DC, USA) |
References
- Ruez, D.R., Jr. Revision of the Blancan (Pliocene) mammals from Hagerman Fossil Beds National Monument, Idaho. J. Idaho Acad. Sci. 2009, 45, 1–143. [Google Scholar]
- Ruez, D.R., Jr. Framework for stratigraphic analysis of Pliocene fossiliferous deposits at Hagerman Fossil Beds National Monument, Idaho. Rocky Mt. Geol. 2009, 44, 33–70. [Google Scholar] [CrossRef]
- Gazin, C.L. New felids from the Upper Pliocene of Idaho. J. Mammal. 1933, 14, 251–256. [Google Scholar] [CrossRef]
- Gazin, C.L. Upper Pliocene mustelids from the Snake River basin of Idaho. J. Mammal. 1934, 15, 137–149. [Google Scholar] [CrossRef]
- Gazin, C.L. Notes on fossil mustelids from the upper Pliocene of Idaho and Texas. J. Mammal. 1937, 18, 363–364. [Google Scholar] [CrossRef]
- Bjork, P.R. The Carnivora of the Hagerman local fauna (late Pliocene) of southwestern Idaho. Trans. Am. Philos. Soc. 1970, 60, 3–54. [Google Scholar] [CrossRef]
- Leeman, W.P. Development of the Snake River Plain-Yellowstone Plateau Province, Idaho and Wyoming: An overview and petrologic model. In Cenozoic Geology of Idaho; Bonnichsen, B., Breckenridge, R.M., Eds.; Idaho Department of Lands, Bureau of Mines and Geology: Moscow, ID, USA, 1982; Volume 26, pp. 155–177. [Google Scholar]
- Digital Atlas of Idaho. Available online: http://imnh.isu.edu/digitalatlas/index.htm (accessed 30 December 2015).
- Prassack, K. Current and future research on the paleoecology and taphonomy of Pliocene musteloids from Hagerman Fossil Beds National Monument. In Proceedings of the 10th Conference on Fossil Resources, Rapid City, SD, USA, 13–15 May 2014.
- Prassack, K. Pliocene musteloid diversity and paleoecology at Hagerman Fossil Beds National Monument. Meeting Program. In Proceedings of the 74th Annual Meeting of Society of Vertebrate Paleontology, Berlin, Germany, 5–8 November 2014.
- Lyman, R.L. Quantitative units and terminology in zooarchaeology. Am. Antiq. 1994, 59, 36–71. [Google Scholar] [CrossRef]
- Klein, R.G.; Cruz-Uribe, K. The Analysis of Animal Bones from Archaeological Sites; University of Chicago Press: Chicago, IL, USA, 1984. [Google Scholar]
- Ruez, D.R., Jr. Middle Pliocene paleoclimate in the Glenns Ferry Formation of Hagerman Fossil Beds National Monument, Idaho: A baseline for evaluating faunal change. J. Idaho Acad. Sci. 2006, 42, 1–16. [Google Scholar]
- Berggren, W.A.; Kent, D.V.; Swisher, C.C., III; Aubry, M.-P. A revised Cenozoic geochronology and chronostratigraphy. In Geochronology, Time Scales and Global Stratigraphic Correlation; Berggren, W.A., Kent, D.V., Aubry, M.-P., Hardenbol, J., Eds.; Society for Sedimentary Geology (SEPM): Tulsa, OK, USA, 1995; Volume 54, pp. 129–212. [Google Scholar]
- Waide, R.B.; Willig, M.R.; Steiner, C.F.; Mittelbach, G.; Gough, L.; Dodson, S.I.; Juday, G.P.; Parmenter, R. The relationship between productivity and species richness. Annu. Rev. Ecol. Syst. 1999, 30, 257–300. [Google Scholar] [CrossRef]
- Dayan, T. Carnivore diversity in the late Quaternary of Israel. Quat. Res. 1994, 41, 343–349. [Google Scholar] [CrossRef]
- Werdelin, L.; Lewis, M.E. Plio-Pleistocene Carnivora of eastern Africa: Species richness and turnover patterns. Zool. J. Linn. Soc. 2005, 144, 121–144. [Google Scholar] [CrossRef]
- Palombo, M.R.; Raia, P.; Giovinazzo, C. Early-middle Pleistocene structural changes in mammalian communities from the Italian Peninsula. In Early-Middle Pleistocene Transitions: The Land-Ocean Evidence; Head, M.J., Gibbard, P.L., Eds.; The Geological Society Publishing House: Bath, UK, 2005; Volume 247, pp. 251–262. [Google Scholar]
- Mussi, M.; Palombo, M.R. Les carnivores du Pliocène supérieur et du Pléistocène de la peninsula italienne: Quelles implications pour le peuplement humain. Rev. Paleobiol. 2005, 23, 597–609. [Google Scholar]
© 2016 by the author; licensee MDPI, Basel, Switzerland. This article is an open access article distributed under the terms and conditions of the Creative Commons by Attribution (CC-BY) license (http://creativecommons.org/licenses/by/4.0/).


