
Actual Evapotranspiration in the Al-Khazir Gomal Basin (Northern Iraq) Using the Surface Energy Balance Algorithm for Land (SEBAL) and Water Balance


Abstract
:
1. Introduction
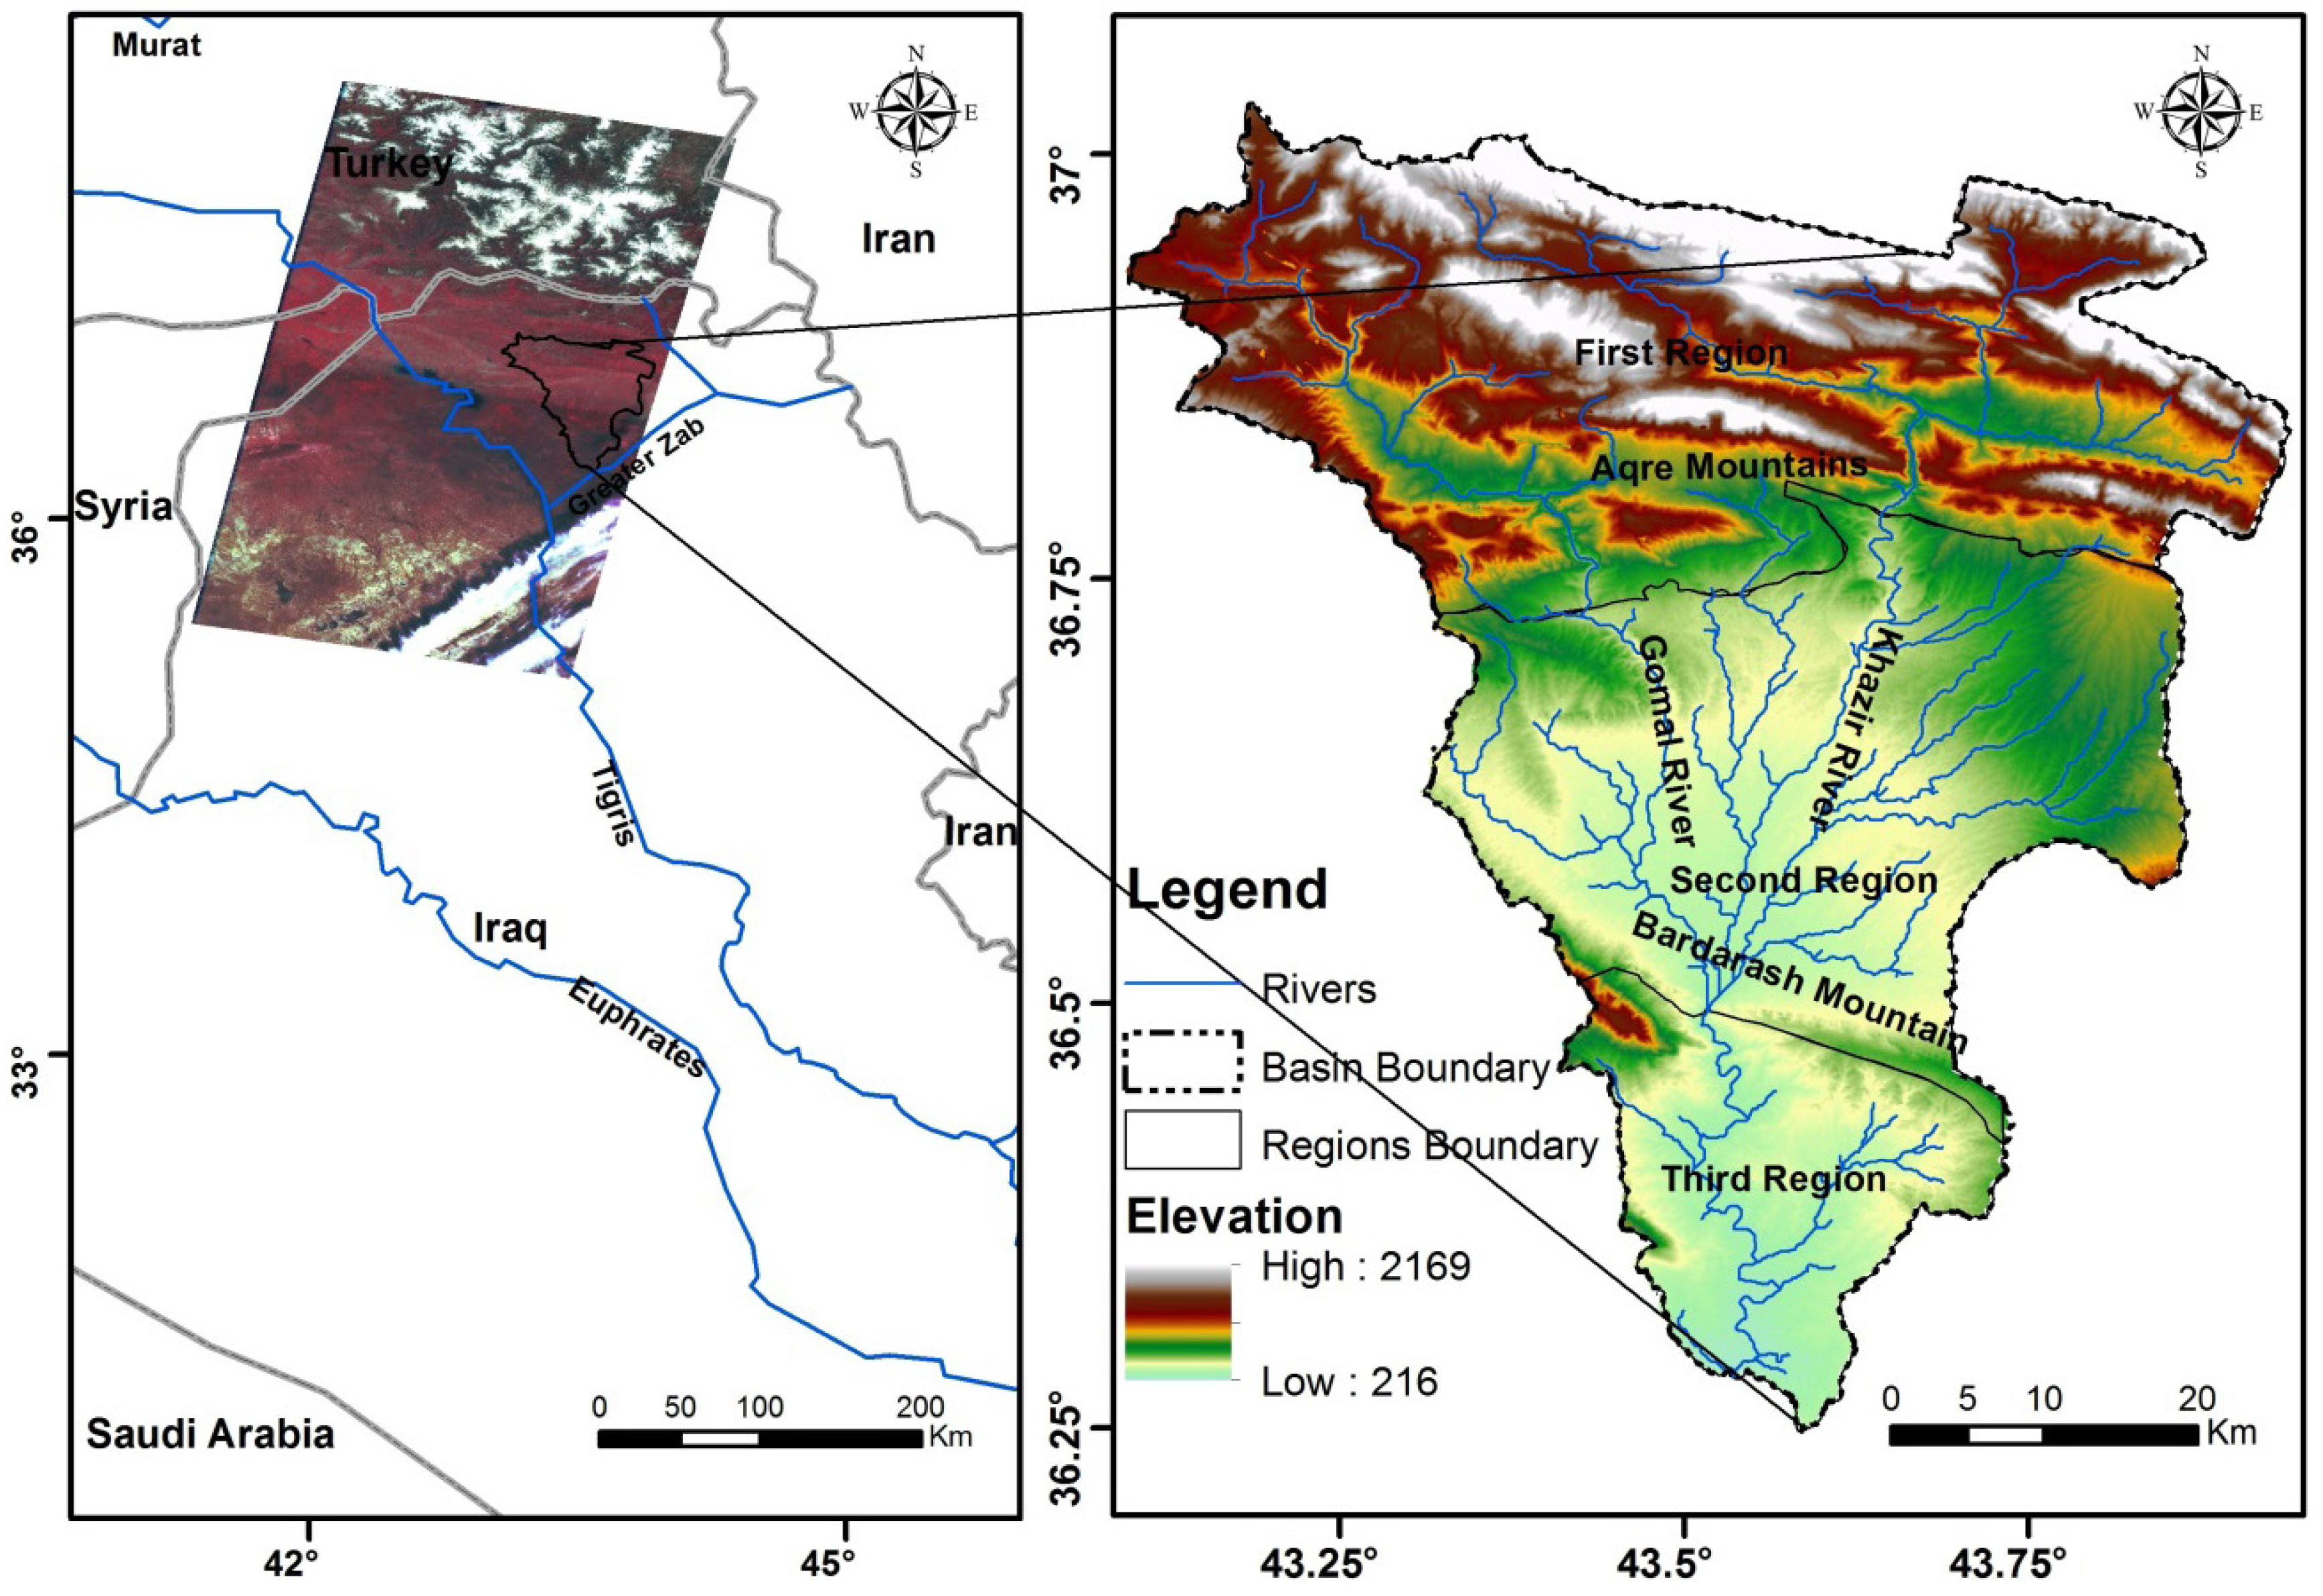
2. Study Area

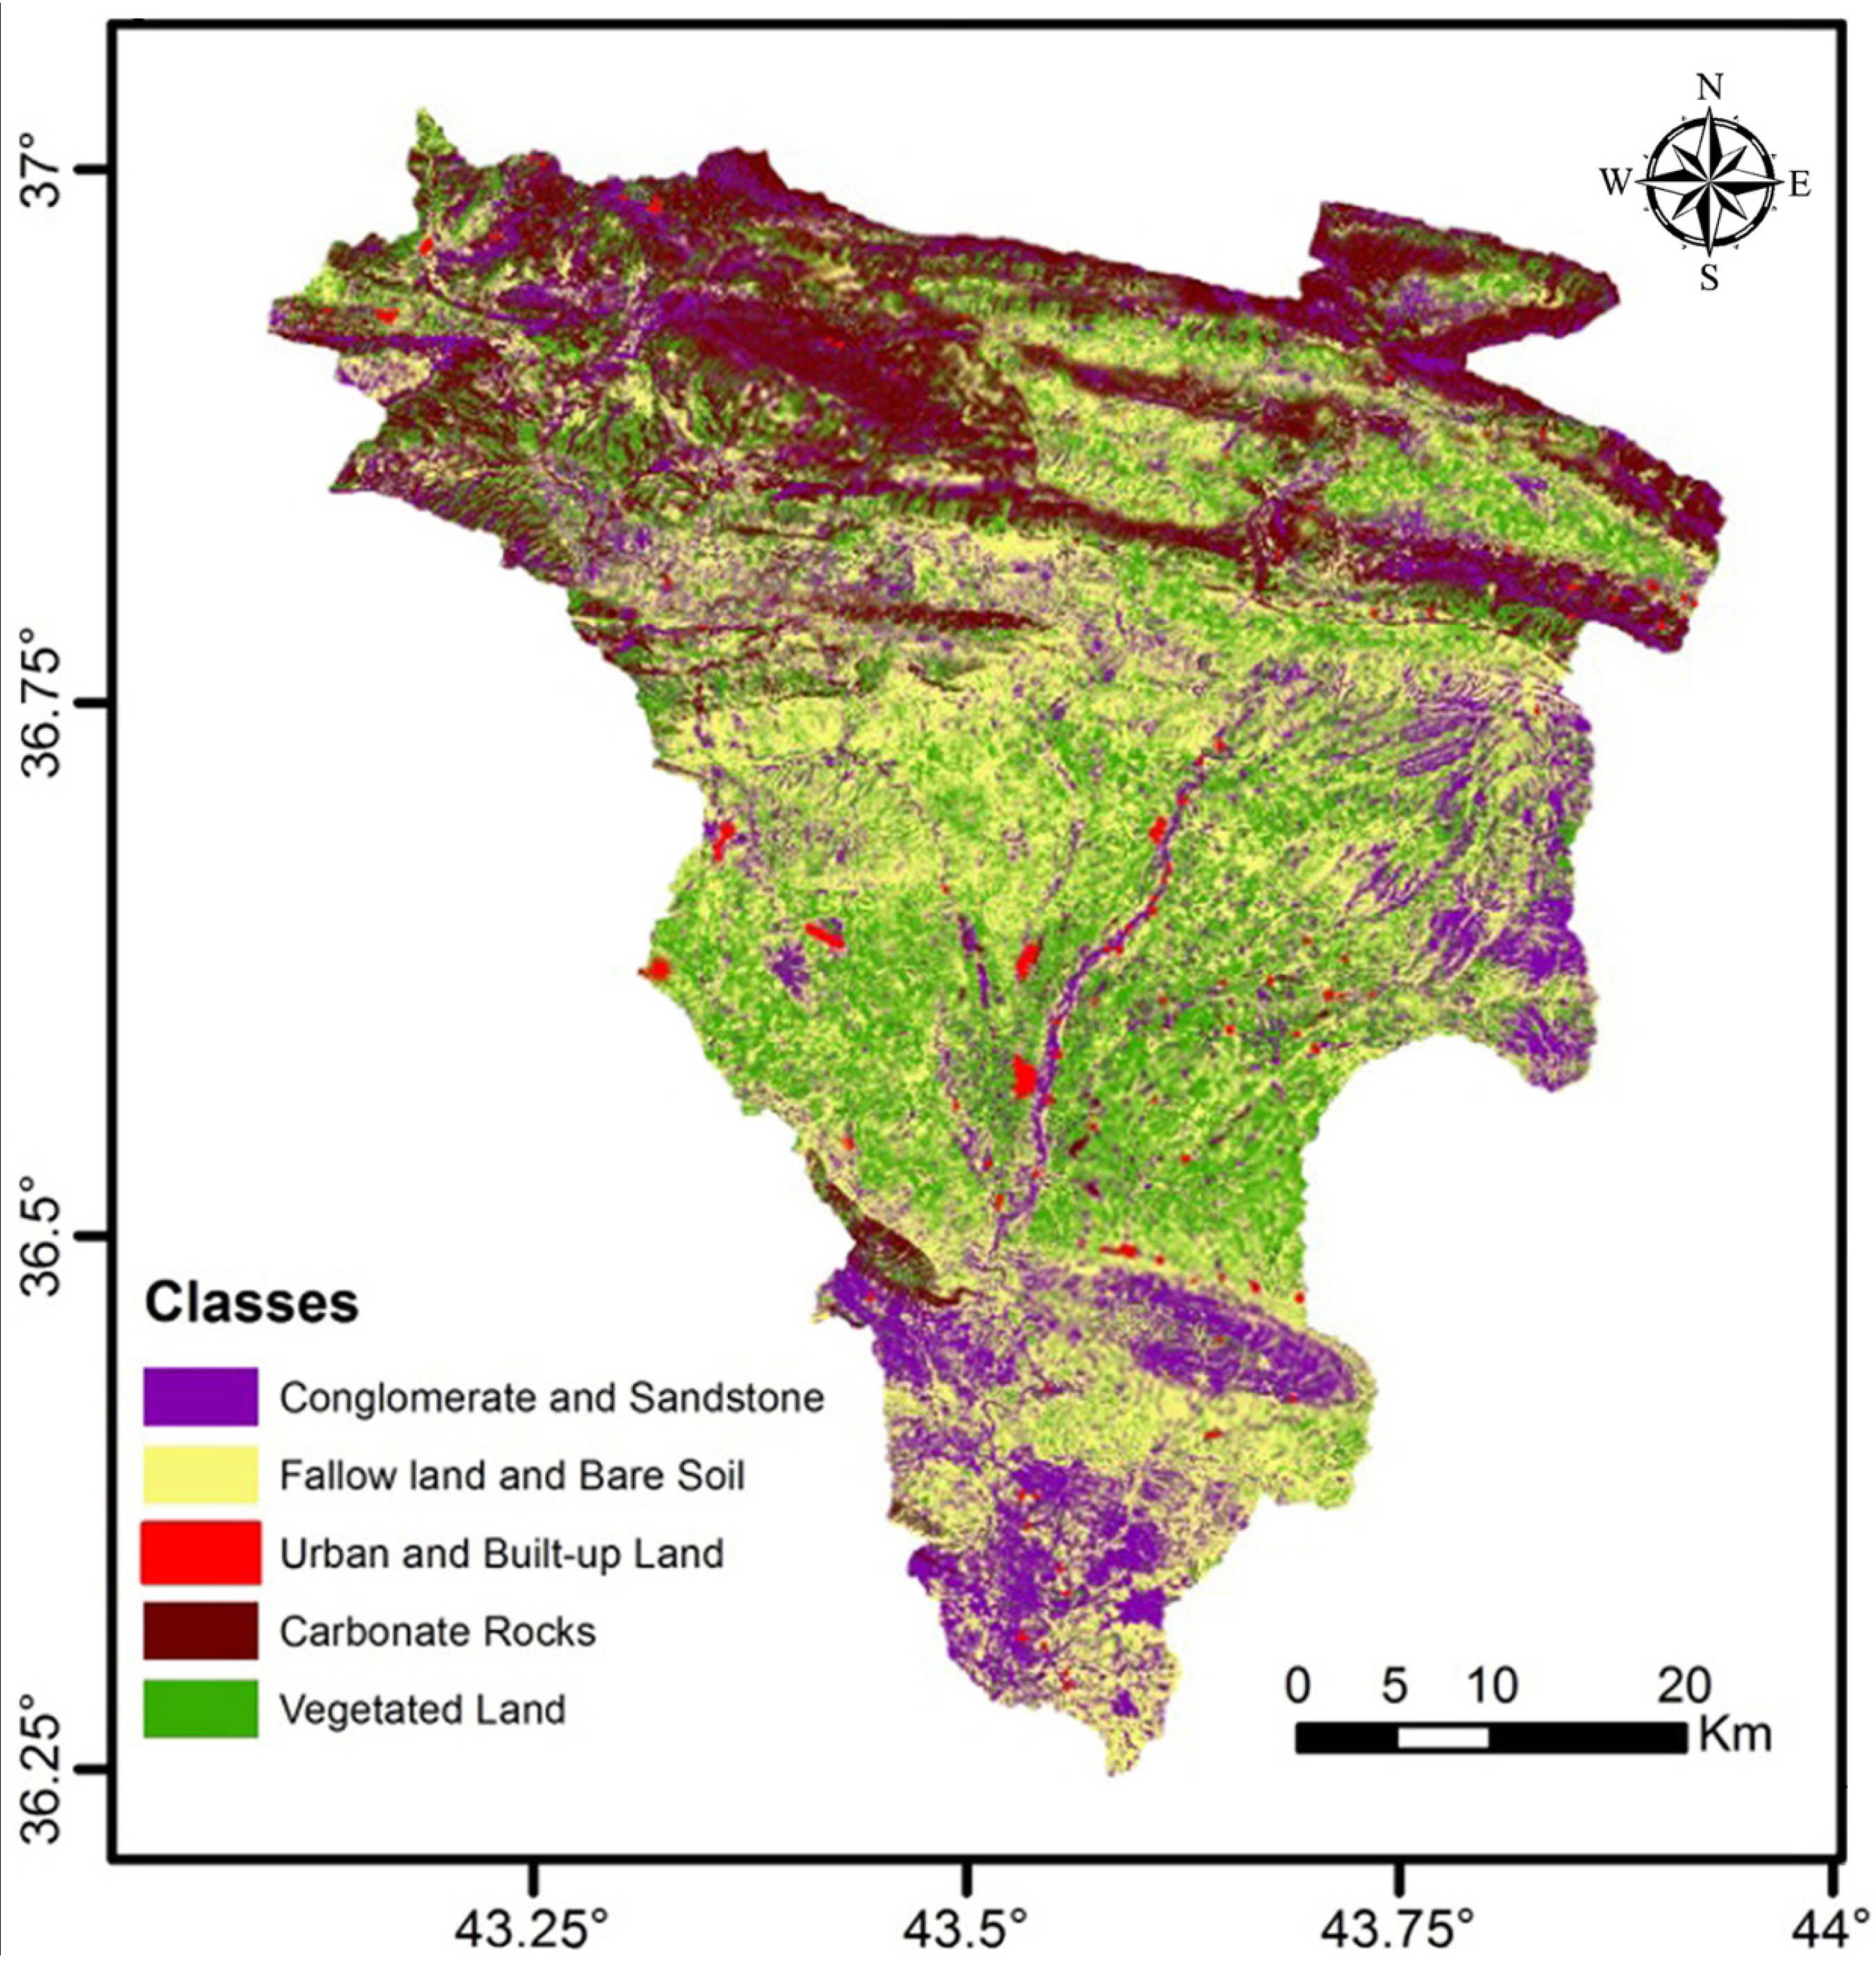
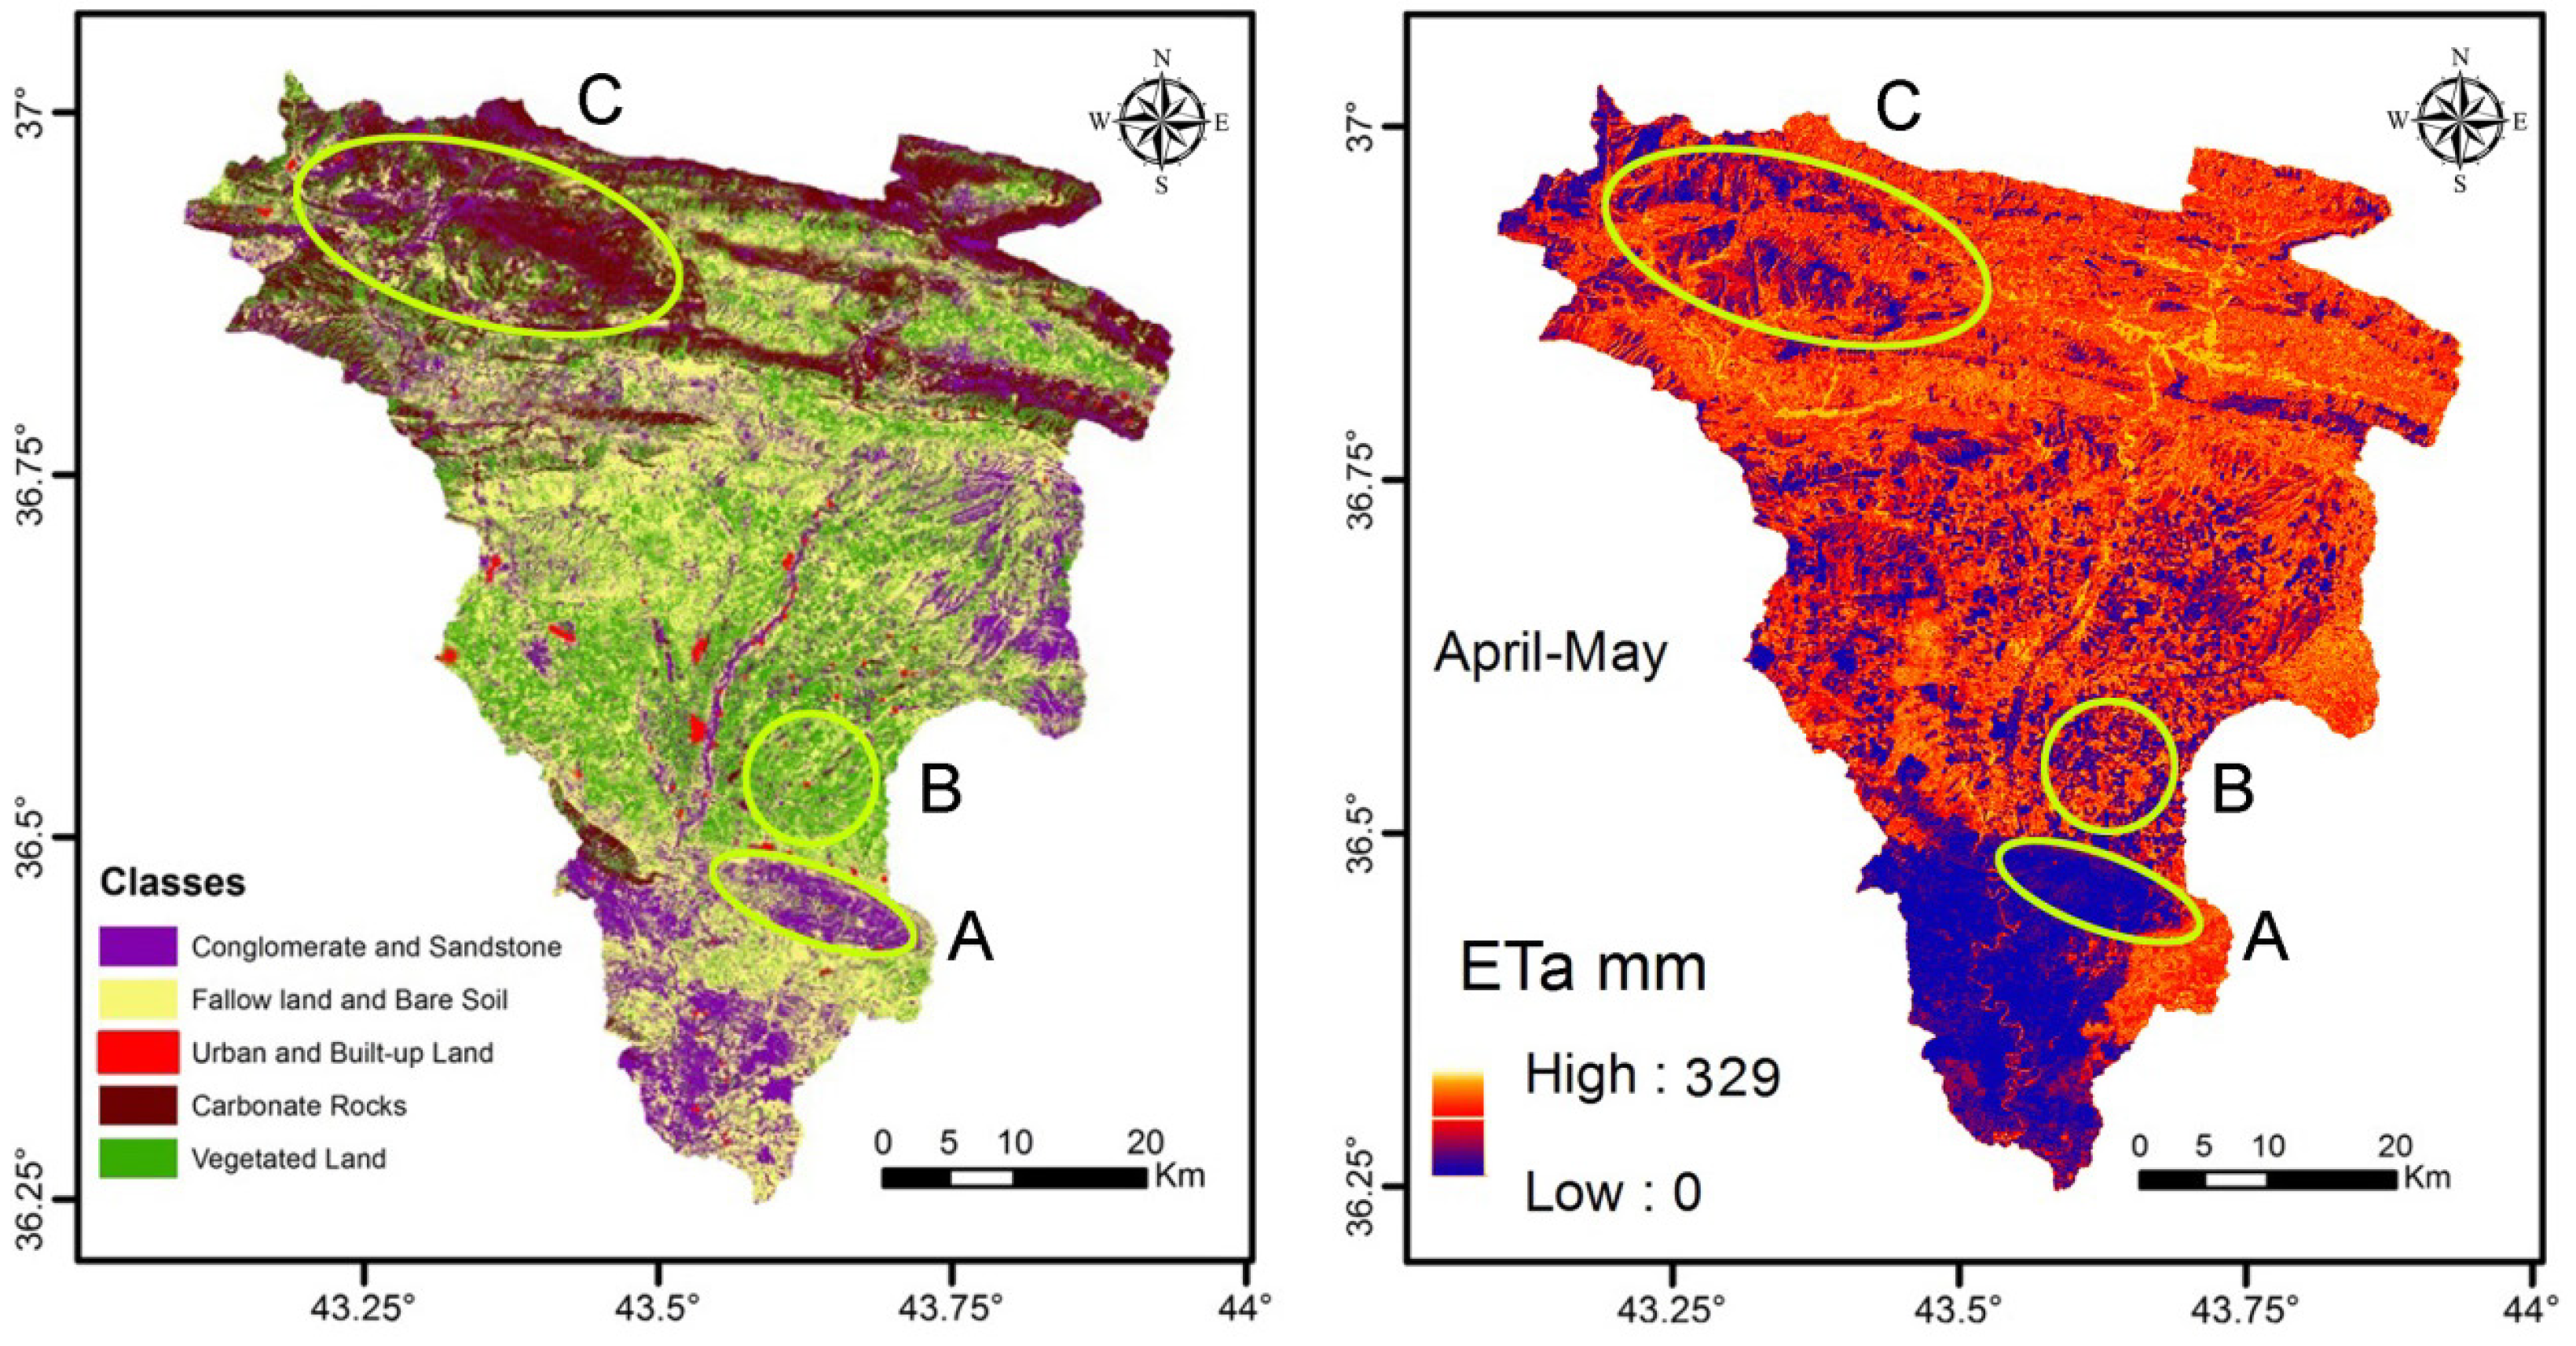
3. Land Use Land Cover

4. Methodology
4.1. Surface Energy Balance Algorithm for Land (SEBAL)
4.2. Water Balance
- (1)
- Determination of significant and insignificant components.
- (2)
- Quantification of individual components.
- (3)
- Presentation in the final form of a water balance equation.
Uncertainty Analysis in the Water Balance
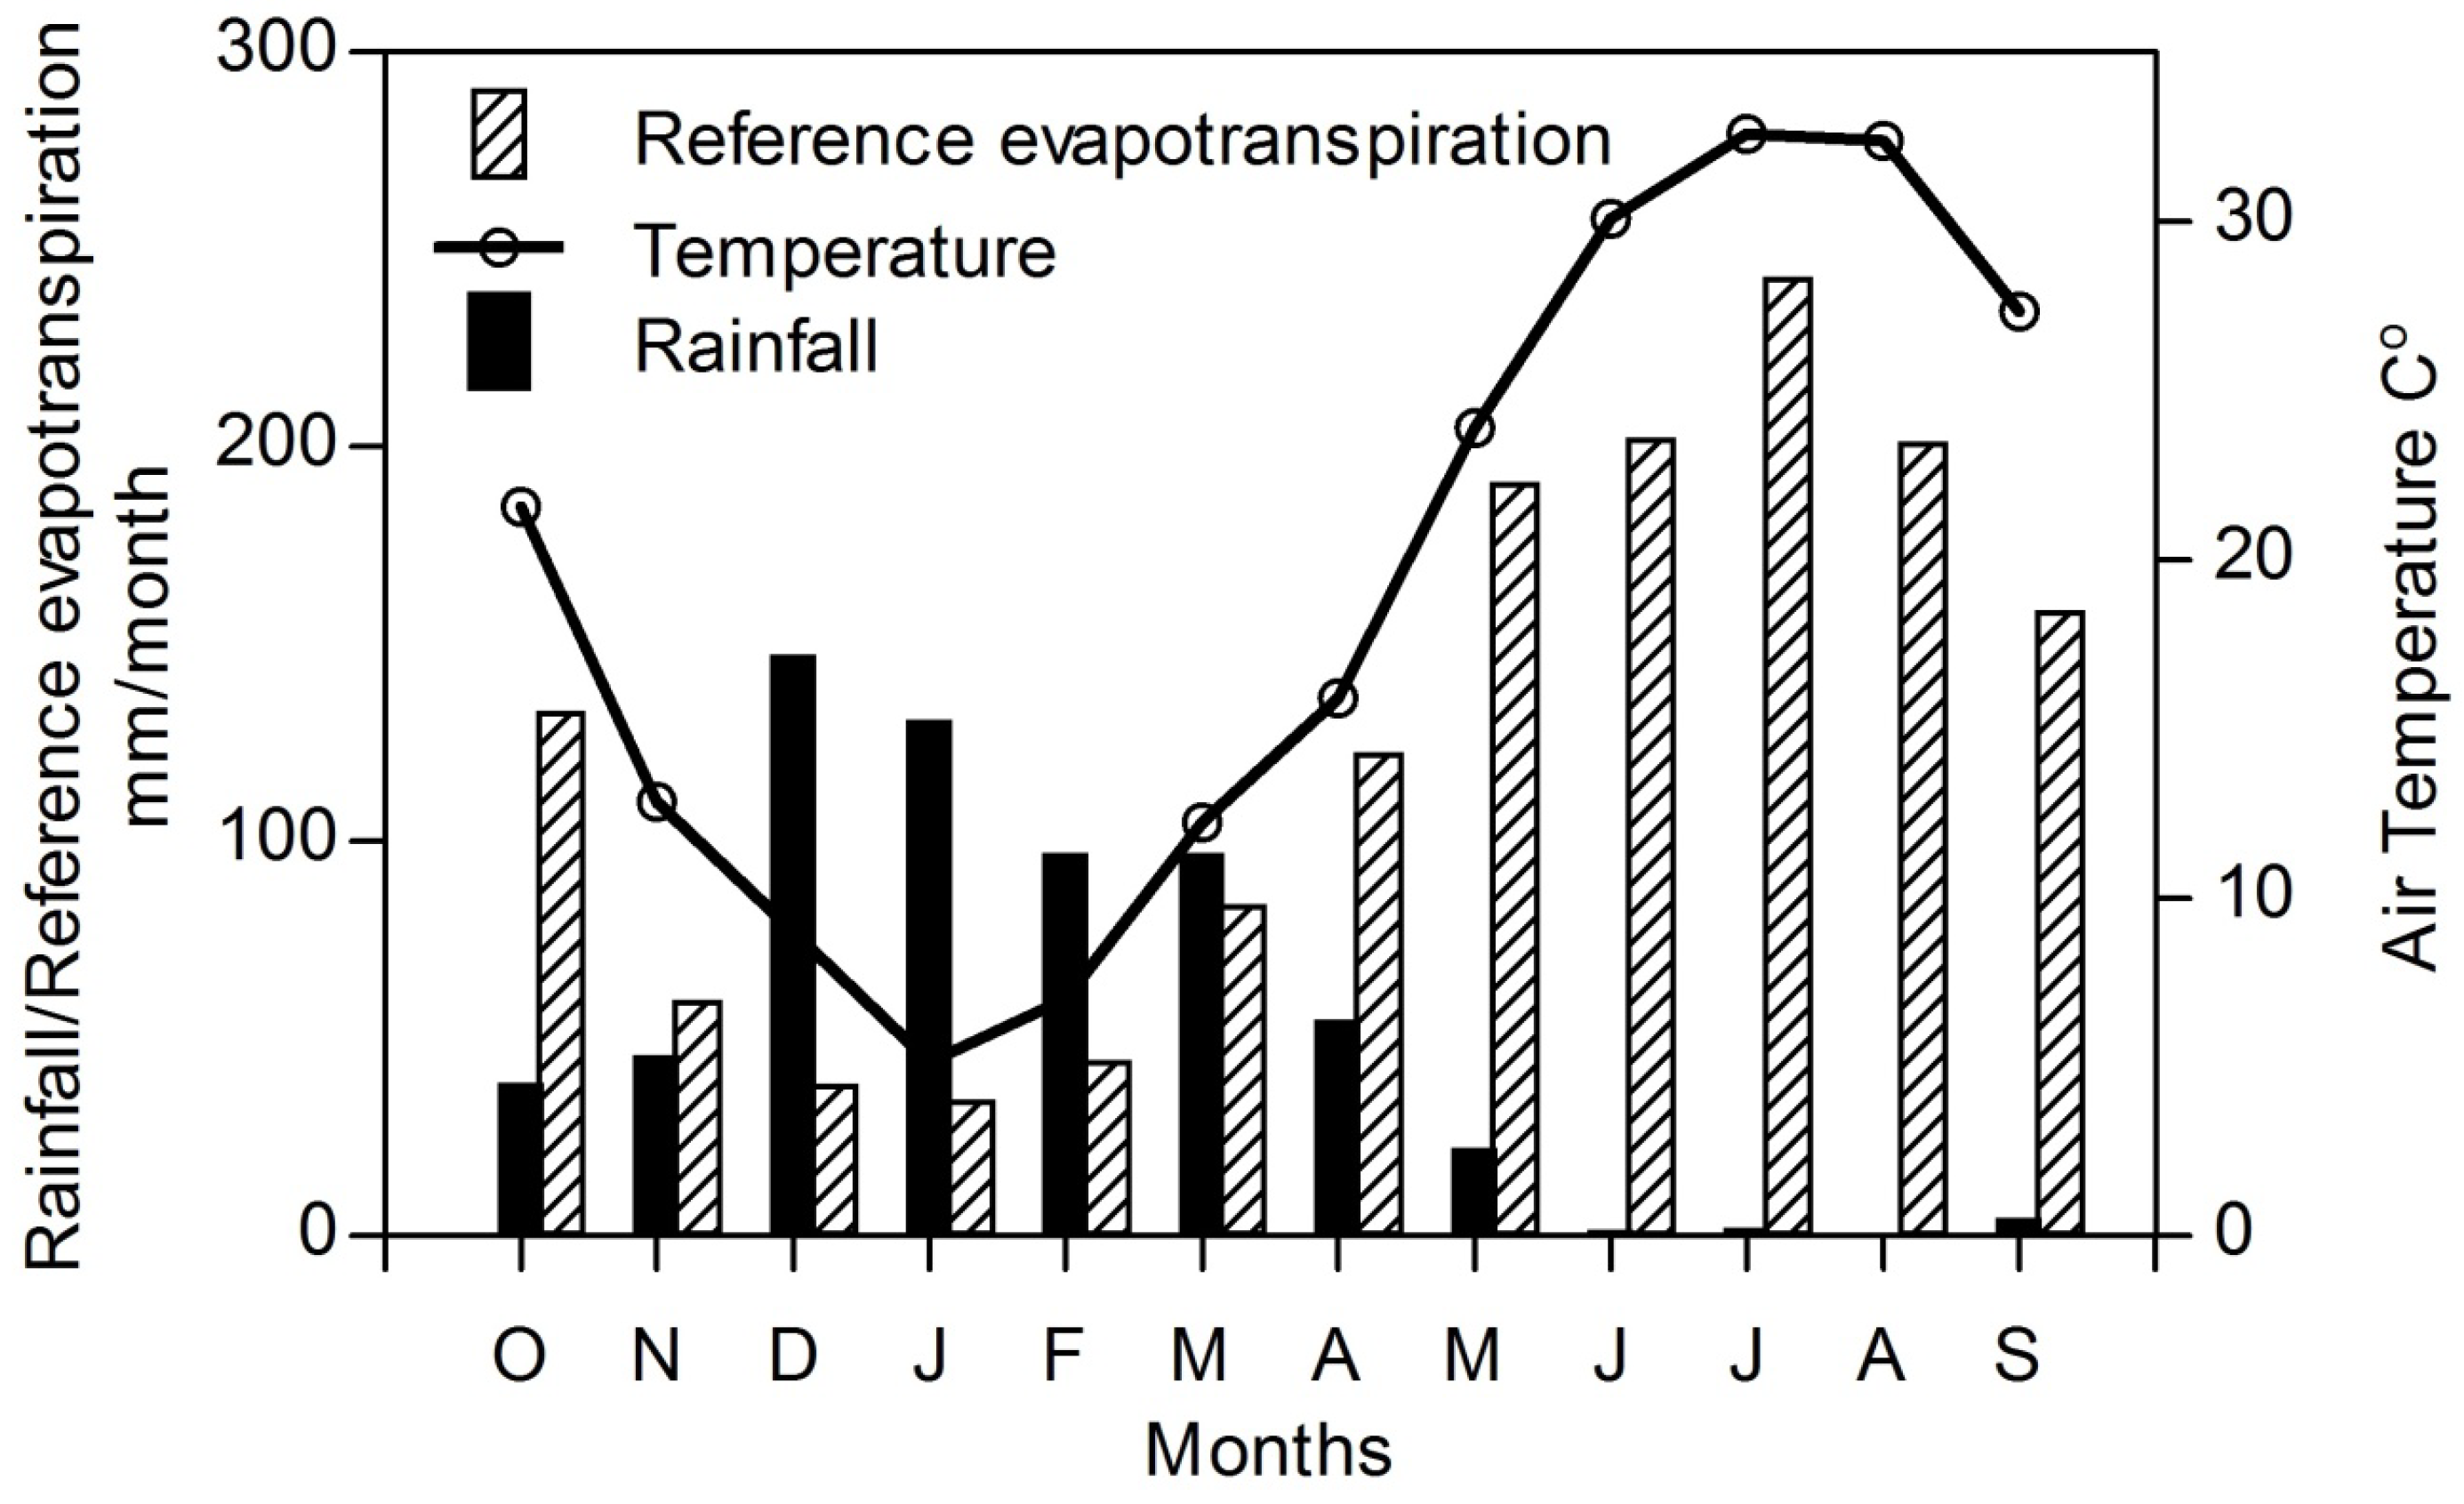
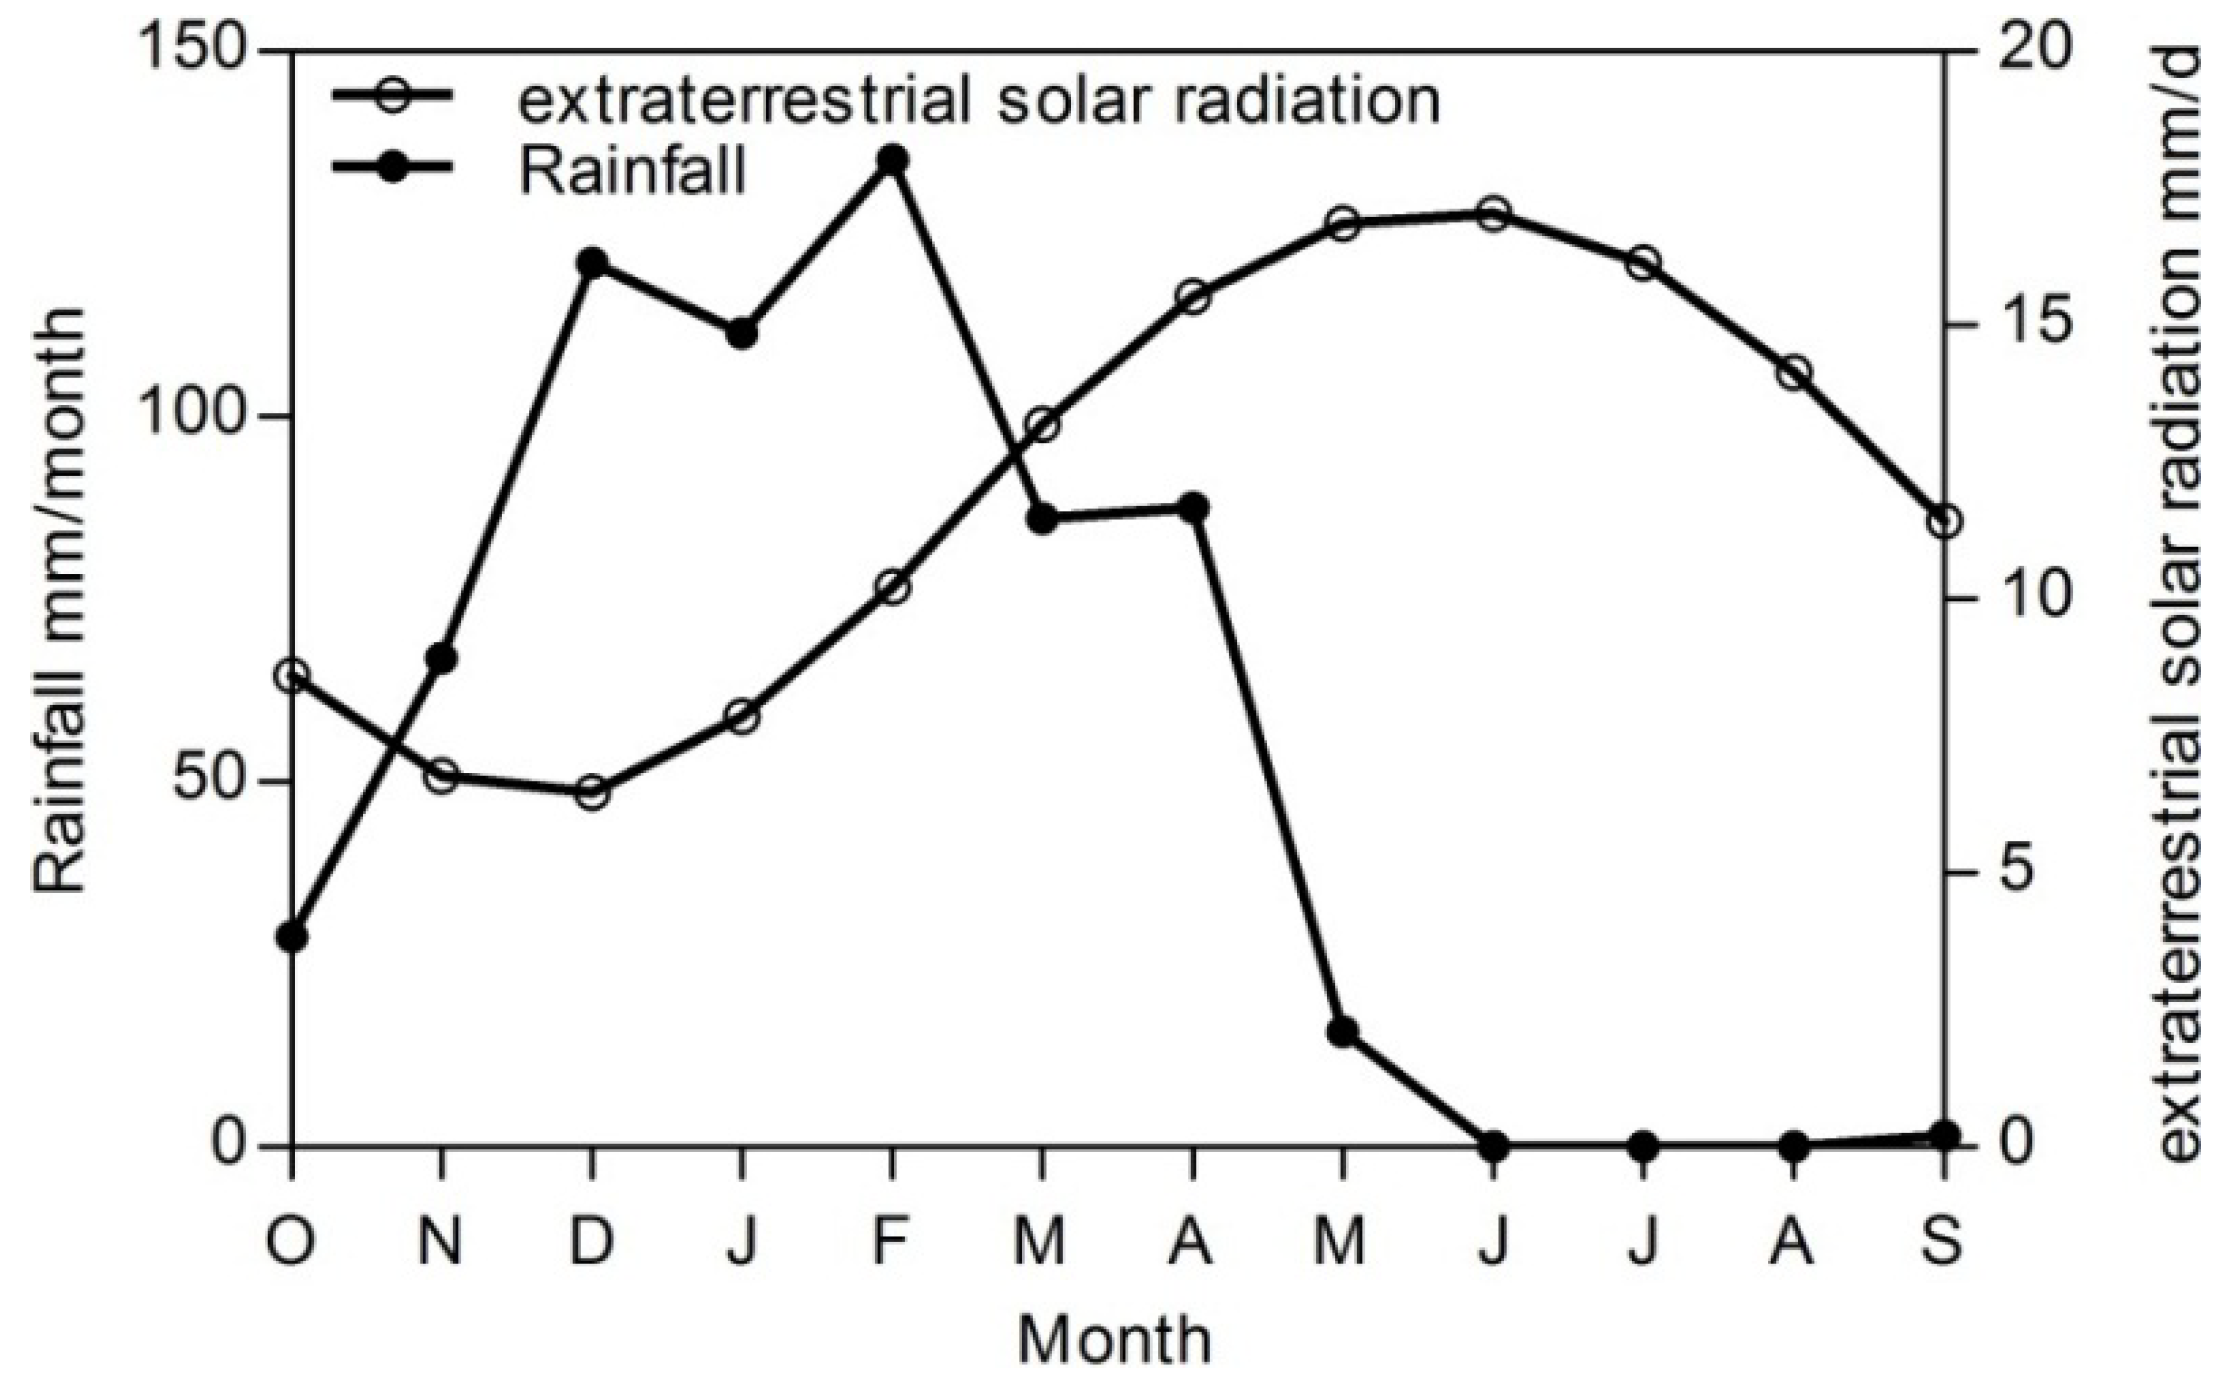
5. Results and Discussion
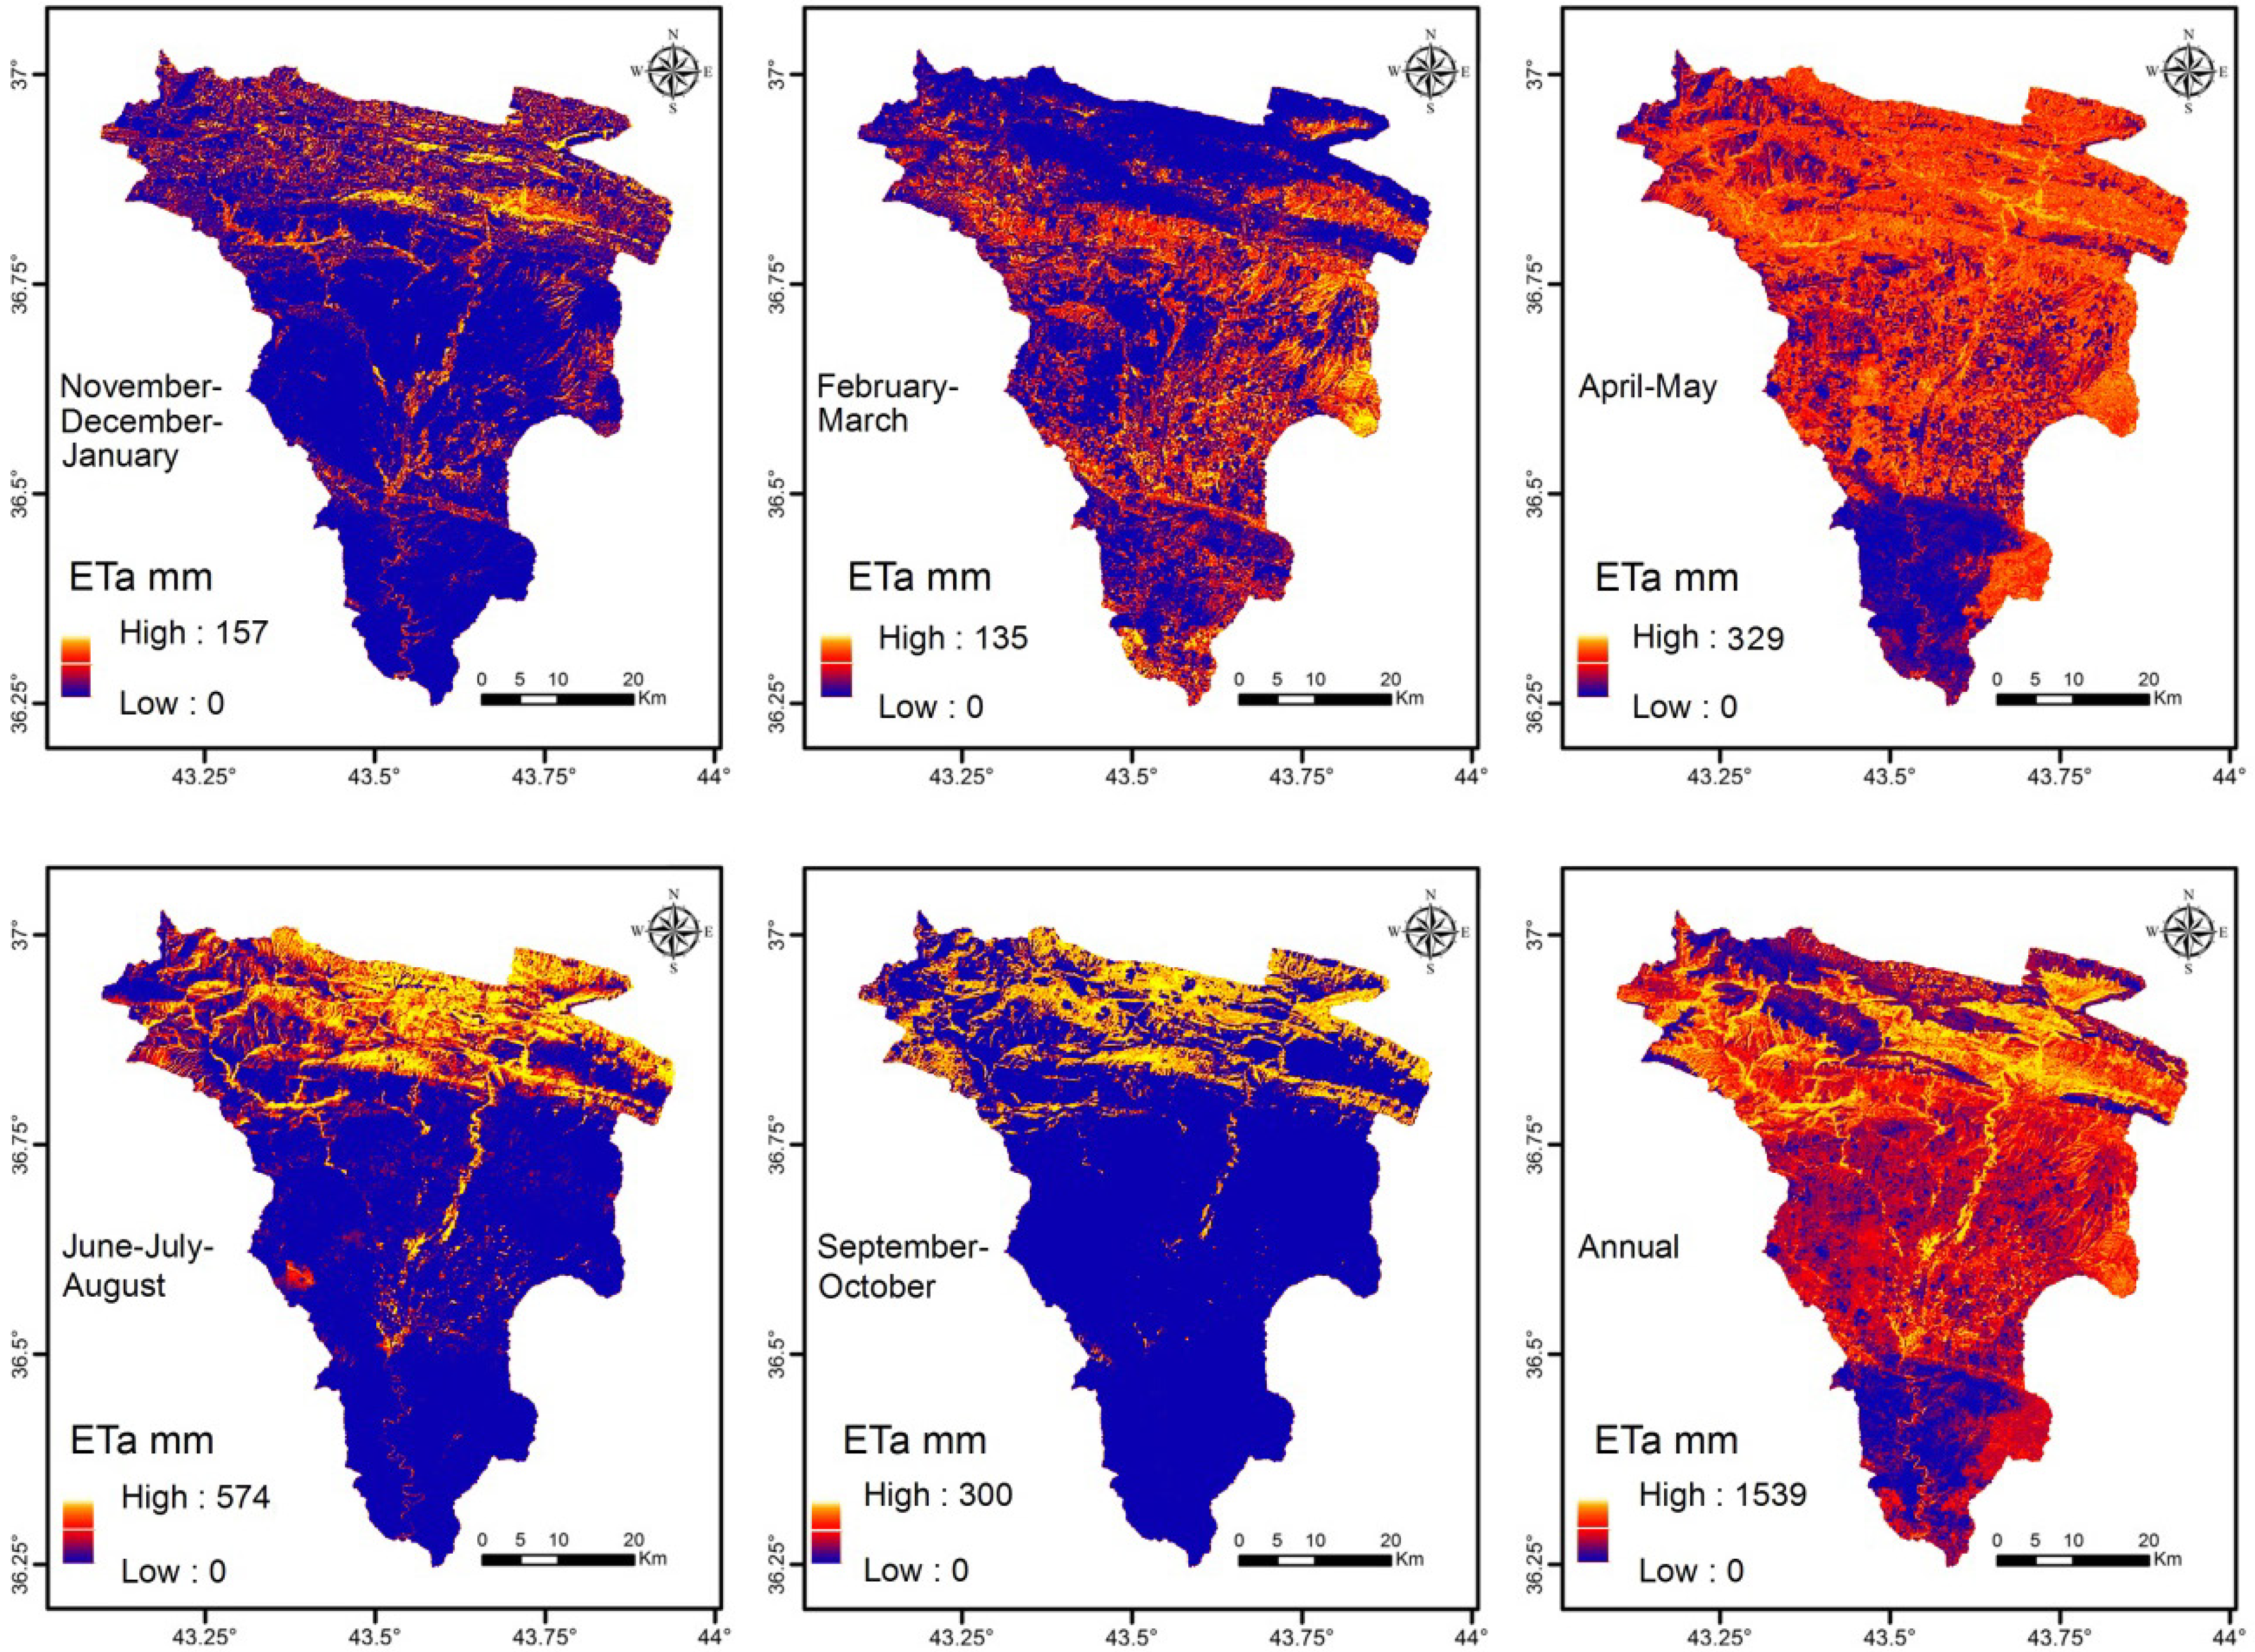
5.1. SEBAL


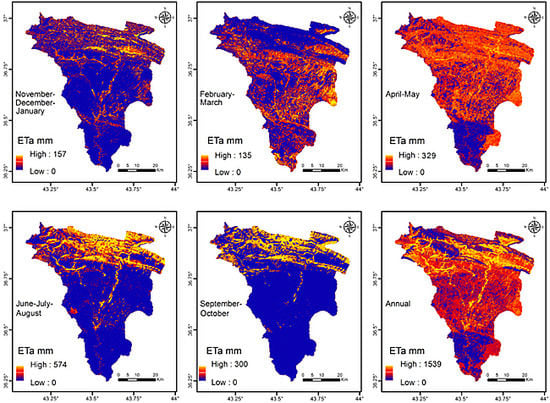
| Statistical Parameter | November–January | February–March | April–May | June–August | September–October |
|---|---|---|---|---|---|
| Minimum (mm) | 0 | 0 | 0 | 0 | 0 |
| Maximum (mm) | 157 | 135 | 329 | 574 | 300 |
| Mean (mm) | 80 | 87 | 152 | 61 | 35 |
| SD (mm) | 31 | 34 | 94 | 118 | 69 |
| Skewness | 2 | 1 | 0.4 | 1.7 | 2 |
| Kurtosis | 6 | 2.8 | 1.5 | 4.7 | 5.8 |
| Sum (mm) | 257,373,721 | 277,286,162 | 491,000,135 | 196,540 | 112,452,822 |
| Acquisition Date | Minimum ETa (SEBAL) mm/day | Maximum ETa (SEBAL) mm/day | Mean ETa (SEBAL) mm/day | SD | Coeff. of Variation | ETr mm/day |
|---|---|---|---|---|---|---|
| 9 March 2007 | 1.9 | 3.3 | 2.2 | 0.6 | 0.3 | 2.72 |
| 5 May 2007 | 3.8 | 6.8 | 5.35 | 0.95 | 0.18 | 6.14 |
| 21 July 2007 | 5.2 | 7.4 | 6.5 | 0.9 | 0.14 | 7.82 |
| 23 September 2007 | 3.8 | 5.6 | 4.8 | 0.4 | 0.083 | 5.27 |
| 21 November 2006 | 1.2 | 2.3 | 1.45 | 0.45 | 0.31 | 1.98 |
Visual Comparison

5.2. Water Balance
6. Conclusions
Acknowledgments
Author Contributions
Conflicts of Interest
References
- Oki, T.; Kanae, S. Global Hydrological Cycles and World Water Resources. Science 2006, 313, 1068–1072. [Google Scholar] [CrossRef] [PubMed]
- Bastiaanssen, W.; Noordman, E.; Pelgrum, H.; Davids, G.; Thoreson, B.; Allen, R. SEBAL Model with Remotely Sensed Data to Improve Water-Resources Management under Actual Field Conditions. J. Irrig. Drain. Eng. 2005, 131, 85–93. [Google Scholar] [CrossRef]
- Kalma, J.D.; McVicar, T.R.; McCabe, F.M. Estimating Land Surface Evaporation: A Review of Methods Using Remotely Sensed Surface Temperature Data. Surv. Geophys. 2008, 29, 421–469. [Google Scholar] [CrossRef]
- Gowda, P.; Chavez, J.; Colaizzi, P.; Evett, S.; Howell, T.; Tolk, J. ET mapping for agricultural water management: Present status and challenges. Irrig. Sci. 2008, 26, 223–237. [Google Scholar] [CrossRef]
- Santos, C.A.C.; Bezerra, B.G.; Silva, B.B.; Rao, T.V.R. Assessment of daily actual evapotranspiration with SEBAL and S-SEBI algorithms in cotton crop. Rev. Bras. Meteorol. 2010, 25, 383–392. [Google Scholar] [CrossRef]
- Yang, Y.; Shang, S.; Jiang, L. Remote sensing temporal and spatial patterns of evapotranspiration and the responses to water management in a large irrigation district of North China. Agric. For. Meteorol. 2012, 164, 112–122. [Google Scholar] [CrossRef]
- Wang, X.-G.; Wang, W.; Huang, D.; Yong, B.; Chen, X. Modifying SEBAL Model Based on the Trapezoidal Relationship between Land Surface Temperature and Vegetation Index for Actual Evapotranspiration Estimation. Remote Sens. 2014, 6, 5909–5937. [Google Scholar] [CrossRef]
- Aqrawi, Z.A.A. Hydrological and Hydrogeological Study of the Etot-Aloka Basin, Dohuk Governorate, Iraqi Kurdistan Region. Ph.D. Thesis, University of Salahadin, Erbil, Iraq, 2003. [Google Scholar]
- Al-Manmi, D.A. Water Resources Management in Rania Area, Sulaimaniyah NE-Iraq. Ph.D. Thesis, University of Baghdad, Baghdad, Iraq, 2008. [Google Scholar]
- Shwani, S.O. Hydrogeology and Hydrochemistry of Bashtapa Sub-Basin in Erbil Governorate Kurdistan Region-Iraq. Master’s Thesis, University of Salahadin, Erbil, Iraq, 2008. [Google Scholar]
- Thornthwaite, C.W.; Wilm, H.G. Report of the Committee on Transpiration and Evaporation. Trans. Am. Geophys. Union. 1944, 25, 686–693. [Google Scholar]
- Kharrufa, N.S. Simplified equation for evapotranspiration in arid regions. Hydrol. Sonderh. 1985, 5, 39–47. [Google Scholar]
- Penman, H.L. Natural evaporation from open water, bare soil, and grass. Proc. R. Soc. Lond. 1948, 193, 120–146. [Google Scholar] [CrossRef]
- Allen, R.; Irmak, A.; Trezza, R.; Hendrickx, J.M.H.; Bastiaanssen, W.; Kjaersgaard, J. Satellite-based ET estimation in agriculture using SEBAL and METRIC. Hydrol. Process. 2011, 25, 4011–4027. [Google Scholar] [CrossRef]
- Park, A.B.; Colwell, R.N.; Meyers, V.F. Resource Survey by Satellite; Science Fiction Coming True. Yearb. Agric. 1968, 1968, 13–19. [Google Scholar]
- Jackson, R.D. Remote sensing of vegetation characteristics for farm management. Proc. SPIE 1984, 475, 81–96. [Google Scholar]
- Norman, J.; Kustas, W.; Humes, K. A two-source approach for estimating soil and vegetation energy fluxes from observations of directional radiometric surface temperature. Agric. For. Meteorol. 1995, 77, 263–293. [Google Scholar] [CrossRef]
- Bastiaanssen, W.G.M.; Menenti, M.; Feddes, R.A.; Holtslag, A.A.M. A remote sensing surface energy balance algorithm for land (SEBAL). Part1. Formulation. J. Hydrol. 1998, 212–213, 198–212. [Google Scholar] [CrossRef]
- Roerink, G.J.; Su, Z.; Menenti, M. S-SEBI: A simple remote sensing algorithm to estimate the surface energy balance. Phys. Chem. Earth Part B Hydrol. Ocean Atmos. 2000, 25, 147–157. [Google Scholar] [CrossRef]
- Su, Z. The Surface Energy Balance System (SEBS) for estimation of turbulent heat fluxes. Hydrol. Earth Syst. Sci. 2002, 6, 85–99. [Google Scholar] [CrossRef]
- Sanchez, J.M.; Kustas, W.P.; Caselles, V.; Anderson, M.C. Modelling surface energy fluxes over maize using a two-source patch model and radiometric soil and canopy temperature observations. Remote Sens. Environ. 2008, 112, 1130–1143. [Google Scholar] [CrossRef]
- Miralles, D.G.; Holmes, T.R.H.; de Jeu, R.A.M.; Gash, J.H.; Meesters, A.G.; Dolman, C.A. Global land-surface evaporation estimated from satellite-based observations. Hydrol. Earth Syst. Sci. 2011, 15, 453–469. [Google Scholar] [CrossRef]
- Mu, Q.; Zhao, M.; Running, S.W. Improvements to a MODIS Global Terrestrial Evapotranspiration Algorithm. Remote Sens. Environ. 2011, 115, 1781–1800. [Google Scholar] [CrossRef]
- Long, D.; Singh, V.P. A Two-source Trapezoid Model for Evapotranspiration (TTME) from satellite imagery. Remote Sens Environ. 2012, 121, 370–388. [Google Scholar] [CrossRef]
- Yang, Y.; Shang, S. A hybrid dual-source scheme and trapezoid framework–based evapotranspiration model (HTEM) using satellite images: Algorithm and model test. J. Geophys. Res. Atmos. 2013, 118, 2284–2300. [Google Scholar] [CrossRef]
- Farah, H.O. Estimation of Regional Evaporation under Different Weather Conditions from Satellite and Meteorological Data: A Case Study in the Naivasha Basin Kenya; Wageningen University: Wageningen, The Netherland, 2001. [Google Scholar]
- Surface Energy Balance Algorithms for Land (SEBAL). Available online: ftp://ftp.funceme.br/Cospar_Funceme_2010/CLASS_DAY_04.11.2010/LAB/quixere/quixere/Final%20Sebal%20Manual.pdf (accessed on 13 April 2015).
- Hemakumara, H.M.; Chandrapala, L.; Moene, A.F. Evapotranspiration fluxes over mixed vegetation areas measured from large aperture scintillometer. Agric Water Manag. 2003, 58, 109–122. [Google Scholar] [CrossRef]
- Al-Sam, S.; Hanna, F. Evaluation of Groundwater Resources in Al-Khazir Gomal Basin. Report No. 1270. Unpublished Report. GEOSURV: Baghdad, Iraq, 1981. [Google Scholar]
- Jassas, H.; Merkel, B. Estimating Groundwater Recharge in the Semiarid Al-Khazir Gomal Basin, North Iraq. Water 2014, 6, 2467–2481. [Google Scholar] [CrossRef]
- Anderson, J.R.; Hardy, E.E.; Roach, J.T.; Witmer, R.E. A Land Use and Land Cover Classification System for Use with Remote Sensor Data; U.S. Government Printing Office: Washington, DC, USA, 1976.
- Allen, R.G.; Pereira, L.A.; Raes, D.; Smith, M. Crop Evapotranspiration: Guidelines for Computing Crop Water Requirements; Food and Agriculture Organization (FAO): Rome, Italy, 1998. [Google Scholar]
- Bastiaanssen, W.G.M. SEBAL-based sensible and latent heat fluxes in the irrigated Gediz Basin, Turkey. J. Hydrol. 2000, 229, 87–100. [Google Scholar] [CrossRef]
- Tasumi, M. Progress in Operational Estimation of Regional Evapotranspiration Using Satellite Imagery. Ph.D. Thesis, University of Idaho, Moscow, ID, USA, 2003. [Google Scholar]
- Allen, B.R.G.; Morse, A.; Tasumi, M.; Trezza, R.; Bastiaanssen, W.; Wright, J.L. Evapotranspiration from a Satellite-Based Surface Energy Balance for the Snake Plain Aquifer in Idaho. Calif. Water Plan Update 2005, 4, 162–175. [Google Scholar]
- Shuttleworth, W.J.; Gurney, R.J.; Hsu, A.Y.; Ormsby, J.P. FIFE: The Variation in Energy Partitioning at Surface Flux Sites; IAHS Publication: Wallingford, UK, 1989. [Google Scholar]
- Brutsaert, W.; Sugita, M. Application of self preservation in the diurnal evolution of the surface budget to determine daily evaporation. J. Geophys. Res. 1992, 97, 377–382. [Google Scholar]
- Trezza, R. Evapotranspiration Using a Satellite-Based Surface Energy Balance with Standardized Ground Control. Ph.D. Thesis, Utah State University, Logan, UT, USA, 2002. [Google Scholar]
- Chavez, J.; Neale, C.; Prueger, J.; Kustas, W. Daily evapotranspiration estimates from extrapolating instantaneous airborne remote sensing ET values. Irrig. Sci. 2008, 27, 67–81. [Google Scholar] [CrossRef]
- Singh, R.K.; Liu, S.; Tieszen, L.L.; Suyker, A.E.; Verma, S.B. Estimating seasonal evapotranspiration from temporal satellite images. Irrig. Sci. 2012, 30, 303–313. [Google Scholar] [CrossRef]
- Crago, R.D. Conservation and variability of the evaporative fraction during the daytime. J. Hydrol. 1996, 180, 173–194. [Google Scholar] [CrossRef]
- Bastiaanssen, W.G.M.; Ahmad, M.D.; Chemin, Y. Satellite surveillance of evaporative depletion across the Indus Basin. Water Resour. Res. 2002, 38, 1273. [Google Scholar]
- Bastiaanssen, W.G.M.; Pelgrum, H.; Wang, J.; Ma, Y.; Moreno, J.F.; Roerink, G.J. A remote sensing surface energy balance algorithm for land (SEBAL): Part 2: Validation. J. Hydrol. 1998, 212–213, 213–229. [Google Scholar] [CrossRef]
- Rushton, K.R.; Ward, C. The estimation of groundwater recharge. J. Hydrol. 1979, 41, 345–361. [Google Scholar] [CrossRef]
- Kerr, Y. Soil moisture from space: Where are we? Hydrogeol. J. 2007, 15, 117–120. [Google Scholar] [CrossRef]
© 2015 by the authors; licensee MDPI, Basel, Switzerland. This article is an open access article distributed under the terms and conditions of the Creative Commons Attribution license (http://creativecommons.org/licenses/by/4.0/).
Share and Cite
Jassas, H.; Kanoua, W.; Merkel, B. Actual Evapotranspiration in the Al-Khazir Gomal Basin (Northern Iraq) Using the Surface Energy Balance Algorithm for Land (SEBAL) and Water Balance. Geosciences 2015, 5, 141-159. https://doi.org/10.3390/geosciences5020141
Jassas H, Kanoua W, Merkel B. Actual Evapotranspiration in the Al-Khazir Gomal Basin (Northern Iraq) Using the Surface Energy Balance Algorithm for Land (SEBAL) and Water Balance. Geosciences. 2015; 5(2):141-159. https://doi.org/10.3390/geosciences5020141
Chicago/Turabian StyleJassas, Hussein, Wael Kanoua, and Broder Merkel. 2015. "Actual Evapotranspiration in the Al-Khazir Gomal Basin (Northern Iraq) Using the Surface Energy Balance Algorithm for Land (SEBAL) and Water Balance" Geosciences 5, no. 2: 141-159. https://doi.org/10.3390/geosciences5020141
APA StyleJassas, H., Kanoua, W., & Merkel, B. (2015). Actual Evapotranspiration in the Al-Khazir Gomal Basin (Northern Iraq) Using the Surface Energy Balance Algorithm for Land (SEBAL) and Water Balance. Geosciences, 5(2), 141-159. https://doi.org/10.3390/geosciences5020141