Article

Sorption of Lithium on Bentonite, Kaolin and Zeolite

Department of Geology, Chair of Hydrogeology, Technische Universität Bergakademie Freiberg, Gustav-Zeuner-Str. 12, 09599 Freiberg, Germany
*
Author to whom correspondence should be addressed.
These authors contributed equally to this work.
Geosciences 2015, 5(2), 127-140; https://doi.org/10.3390/geosciences5020127
Submission received: 6 January 2015 / Revised: 18 March 2015 / Accepted: 2 April 2015 / Published: 14 April 2015

Abstract

:
Li sorption was studied on natural bentonite, kaolin and zeolite in batch experiments at variable Li and Na concentrations (0, 1.5, 15, 150, 750 mM LiCl and 0.01, 0.1, 1, 3, 5 M NaCl). The solid-to-solution ratio was 1:4 and pH ranged from 2 to 10. Maximum Li sorption was determined at 0.01 M NaCl and 750 mM LiCl concentration in solution. It was 3800 ± 380 ppm, 1300 ± 130 ppm and 3900 ± 390 ppm on bentonite, kaolin and zeolite, respectively, which is in the average to upper range typical for clay minerals. Under these conditions, kaolin was saturated with Li, whereas Li in bentonite and zeolite occupied only about 55%–79% and 9%–26% of the typical cation exchange capacity (CEC) of smectites and zeolites, respectively. This is explained by differences in the way Li is bound in the materials studied. Li sorption on bentonite was independent of pH due to strong pH buffering. Above pH 5, kaolin was transformed to gibbsite, which completely changed its Li sorption capabilities. Extremely low as well as extremely high pH destabilized the crystal lattice of zeolite. All in all it was shown that, under the studied conditions, Li sorption on the studied materials occurs in detectable quantities. So, clay minerals and zeolites can act as a sink for Li if Li concentrations in solution are sufficiently high.

1. Introduction

Li is a lithophile metallic element [1] whose average concentration in the earth’s upper crust is around 20 ppm by weight [2]. During magmatic processes it can replace Mg2+ and Fe2+. Therefore, it is concentrated in the crystal lattice of ferromagnesian silicates and is enriched in pegmatitic rocks [3], which serve as exploitable Li resources. During weathering or hydrothermal processes, Li as a very mobile element that can be released from parent rock material and carried away by water. Li dissolved in water behaves extremely conservatively, because there are no limiting mineral phases for Li, and because Li is the cation that is most easily displaced by ion exchange [4]. However, there is a limited possibility of Li sorption by organic matter as well as by clay minerals and other phyllosilicates [5,6,7]. In hydrologically closed basins, such as Salar de Uyuni (Bolivia), and many other salars around the world, Li can be enriched as a result of evaporation. If climatic conditions are arid, salars can be formed through precipitation of halite. The remaining brine, in some cases, contains extremely high Li concentrations, which nowadays makes these brines an important resource for the industrial production of Li besides pegmatites [2]. Investigations in Salar de Uyuni (Bolivia) showed that the concentrations of Li in the brines of the salar vary between 100 and 4000 mg/L [8,9]. Similar observations are reported from other salars, but so far no explanations have been reported for the large concentration differences that are in some way contradictory to the theory that Li behaves conservatively and, therefore, should be more or less equally distributed throughout the salar. Clay minerals are ubiquitous in nature. They also occur in the highly saline systems of salars to whose basins they are transported by feeding rivers. Evidence for the hypothesis that clay minerals may be one reason for elevated Li concentrations in Salar de Uyuni can be deduced from the fact that the highest Li concentrations are observed at the inlet points of the Rio Grande, the major tributary to this salar. This river contains high loads of sediments and clay minerals. To understand the possible role of clay minerals for Li binding in systems of variable ionic strength, Li sorption on bentonite, kaolin and zeolite was studied in this work using simple batch experiments.

2. Materials and Methods

2.1. Clay Minerals and Zeolite Used

For this study, three different materials were used: a natural bentonite from Morocco, a certified reference material (CRM) kaolin from Ukraine, and a natural zeolite from Turkey. These materials are abundant and widespread in nature [10,11]. Their mineral composition can be found in Table 1.
The bentonite was delivered as uniform powder, the kaolin was available as compressed pellets, and the zeolite as a solid of heterogeneous grain size, ranging from fine- to average-sized gravel. To ensure a comparable and uniform grain size of the materials used, the kaolin was crushed to a powder by hand using a porcelain mortar and pestle, and the zeolite was crushed using an electrodynamic high-voltage pulsed power process (Labor-Fragmentieranlage selFrag Lab) with grinding levels decreasing from <1000 µm via 80–250 µm to <80 µm as the last step. All experiments were performed as free-drift experiments.
Table 1. Composition, origin and distributor of the certified minerals used. Porosity characteristics for bentonite (surface area, pore volume and pore diameter) and surface characteristics have been determined in a previous study [12]. The mineral composition in % by weight was determined with XRD.
Natural MaterialMineral Composition
Mineral% by Weight
Bentonite (from Morocco, IBECCO) Obtained from the Federal Institute for Geosciences and Natural Resources (BGR) in Hannover (Germany).Montmorillonite80.3
Plagioclase12.1
Orthoclase5.5
Cristobalite5.5
Quartz0.9
Kaolin (from Ukraine) Supplied from the Ukrainian Kaolin Company.Kaolinite87
Quartz3
Potassium feldspar3
Mixed layer7
Zeolite (from Turkey) Supplied from the company ZEOnatura.Clinoptilolite88–95
Feldspars3–5
Montmorillonite2–5
Muscovite0–3
Cristobalite0–2

2.2. Salt Solutions Used

The solutions used for the actual sorption batch experiments contained LiCl (Chempur Feinchemikalien und Forschungsbedarf GmbH, Karlsruhe, Germany) and NaCl (Merck KGaA, Darmstadt, Germany) at different concentrations (0, 1.5, 15, 150, 750 mM LiCl and 0.01, 0.1, 1, 3, 5 M NaCl). Each LiCl concentration was combined with each NaCl concentration and examined in an individual experiment. The only combination that proved impossible was 750 mM LiCl and 5 M NaCl because this high salt load could not be dissolved.
In 100 mL acid-washed PE plastic bottles, each single combination was prepared and pH adjusted to 6 and 8, respectively, in order to examine both pH values in individual experiments. The solutions’ pH was adjusted with 0.1M HCl (prepared using a 37%, pro analysis HCl, Merck, Darmstadt, Germany) and 0.1 M NaOH (Merck, Darmstadt, Germany). These chemicals were used to avoid adding other ions to the solution.

2.3. Desorption and Leaching of Li from the Minerals

In pre-tests it was assessed how much Li is released by the chosen minerals. In each experiment, 2.5 g of the respective material was leached with 10 mL of 0.1 M and 1 M HNO3 (65% Merck, Darmstadt, Germany) in 15 mL PP centrifuge tubes (Scienova GmbH, 07745 Jena, Germany). Desorption experiments were done using NaCl (0.01, 0.1, 1, 3, and 5 M, respectively) and the same type of tubes and solid-to-solution ratio. Despite the composition of the solution, the experimental procedure was the same as described in Section 2.4.

2.4. Sorption Experiments

Exactly 2.5 g of the respective material, bentonite, kaolin or zeolite, were filled into 15 mL PP centrifuge tubes (Scienova GmbH, 07745 Jena, Germany) and mixed with 10 mL of solutions containing LiCl and NaCl. Each LiCl concentration was combined with each NaCl concentration, as described before, and examined in an individual experiment. All experiments were conducted twice: once at pH 6 and once at pH 8.
The mixtures were homogenized by hand and then shaken in a horizontal shaker (mLw THY 2) for 24 h at highest level of speed to prevent settling. After that the centrifuge tubes with the suspensions in them were centrifuged by using an mLw T5 centrifuge at 6000 rpm. The gained solution was then manually micro-filtrated using cellulose acetate membrane filters of 0.2 µm pore size (Sartorius Stedim Biotech GmbH, Goettingen, Germany).
The filter sheets were used only once. After each filter process, the filter holders were disassembled, cleaned with milli-Q, then dried with paper and reassembled anew. In addition to this procedure, it was necessary to use a syringe with a canula for extracting the liquid from the narrow centrifuge tubes. After each filter process, these instruments were also cleaned and dried.

2.5. Li Analysis with ICP-MS

The filtrates from the sorption experiments as well as from leaching experiments were analyzed for Li by ICP-MS (Thermo, X-Series II, Quadrupol). Prior to the measurements, 100 µL of internal standard (65% HNO3 + 5 ppm Ge + 1 ppm Rh + 1 ppm Re) were added to each 10 mL filtrate. This was done because the samples greatly differed in their salt concentration (especially NaCl). The added internal standard compensates the matrix dependency of the measurements and improves the nebulization of the samples. Each sample was then analyzed either using standard mode, KED (kinetic energy discrimination) mode or both. In most cases standard mode was used. KED mode was chosen mainly for samples that either contained high Li concentrations, high salt loads or both to reduce the risk of harming the detector. Detection limits for Li were 1 ppb with standard mode and 50 ppb with KED mode. The total analytical error is in the range of ±10%.

3. Results

3.1. Li Release from the Untreated Solids

Table 2 summarizes how much Li was released from the un-treated solids after having agitated them with 0.1 M and 1 M HNO3 and NaCl (0.01, 0.1, 1, 3, 5 M, at pH 6 and 8) for 24 h. Li release by HNO3 is within the range of Li release by differently concentrated NaCl. Li release by NaCl generally increases with increasing NaCl concentration in the salt solution used for agitation. It is lowest for kaolin and highest for zeolite.
Table 2. Li release from the studied solids after agitation with HNO3 (0.1, 1 M) and NaCl (0.01, 0.1, 1, 3, 5 M).
SolidLi Release (µeq/100 G) By Agitation With
0.1 M HNO31M HNO3NaCl at pH 6NaCl at pH 8
Min. ReleaseMax. ReleaseMin. ReleaseMax. Release
Bentonite4.7 ± 0.54.8 ± 0.51.4 ± 0.150 ±50.5 ± 0.0593 ± 9
Kaolin2.5 ± 0.31.5 ± 0.20.4 ± 0.0419 ± 24.3 ± 0.47.8 ± 0.8
Zeolite11.5 ± 1.218.3 ± 1.87.7 ± 0.845 ± 56.5 ± 0.7 31 ± 3

3.2. Absolute Li Sorption

From all combinations of Li and Na concentration tested, maximum absolute Li sorption was:
- 55 ± 6 meq/100 gi.e., 3800 ± 380 ppm  for bentonite
- 18 ± 1 meq/100 gi.e., 1300 ± 130 ppm  for kaolin
- 56 ± 6 meq/100 gi.e., 3900 ± 390 ppm  for zeolite
Maximum absolute Li sorption was achieved when the salt solutions used for the batch experiments contained 0.001 M NaCl and 750 mM LiCl. This means that sorption was maximal when Li concentration was highest and Na concentration was lowest.

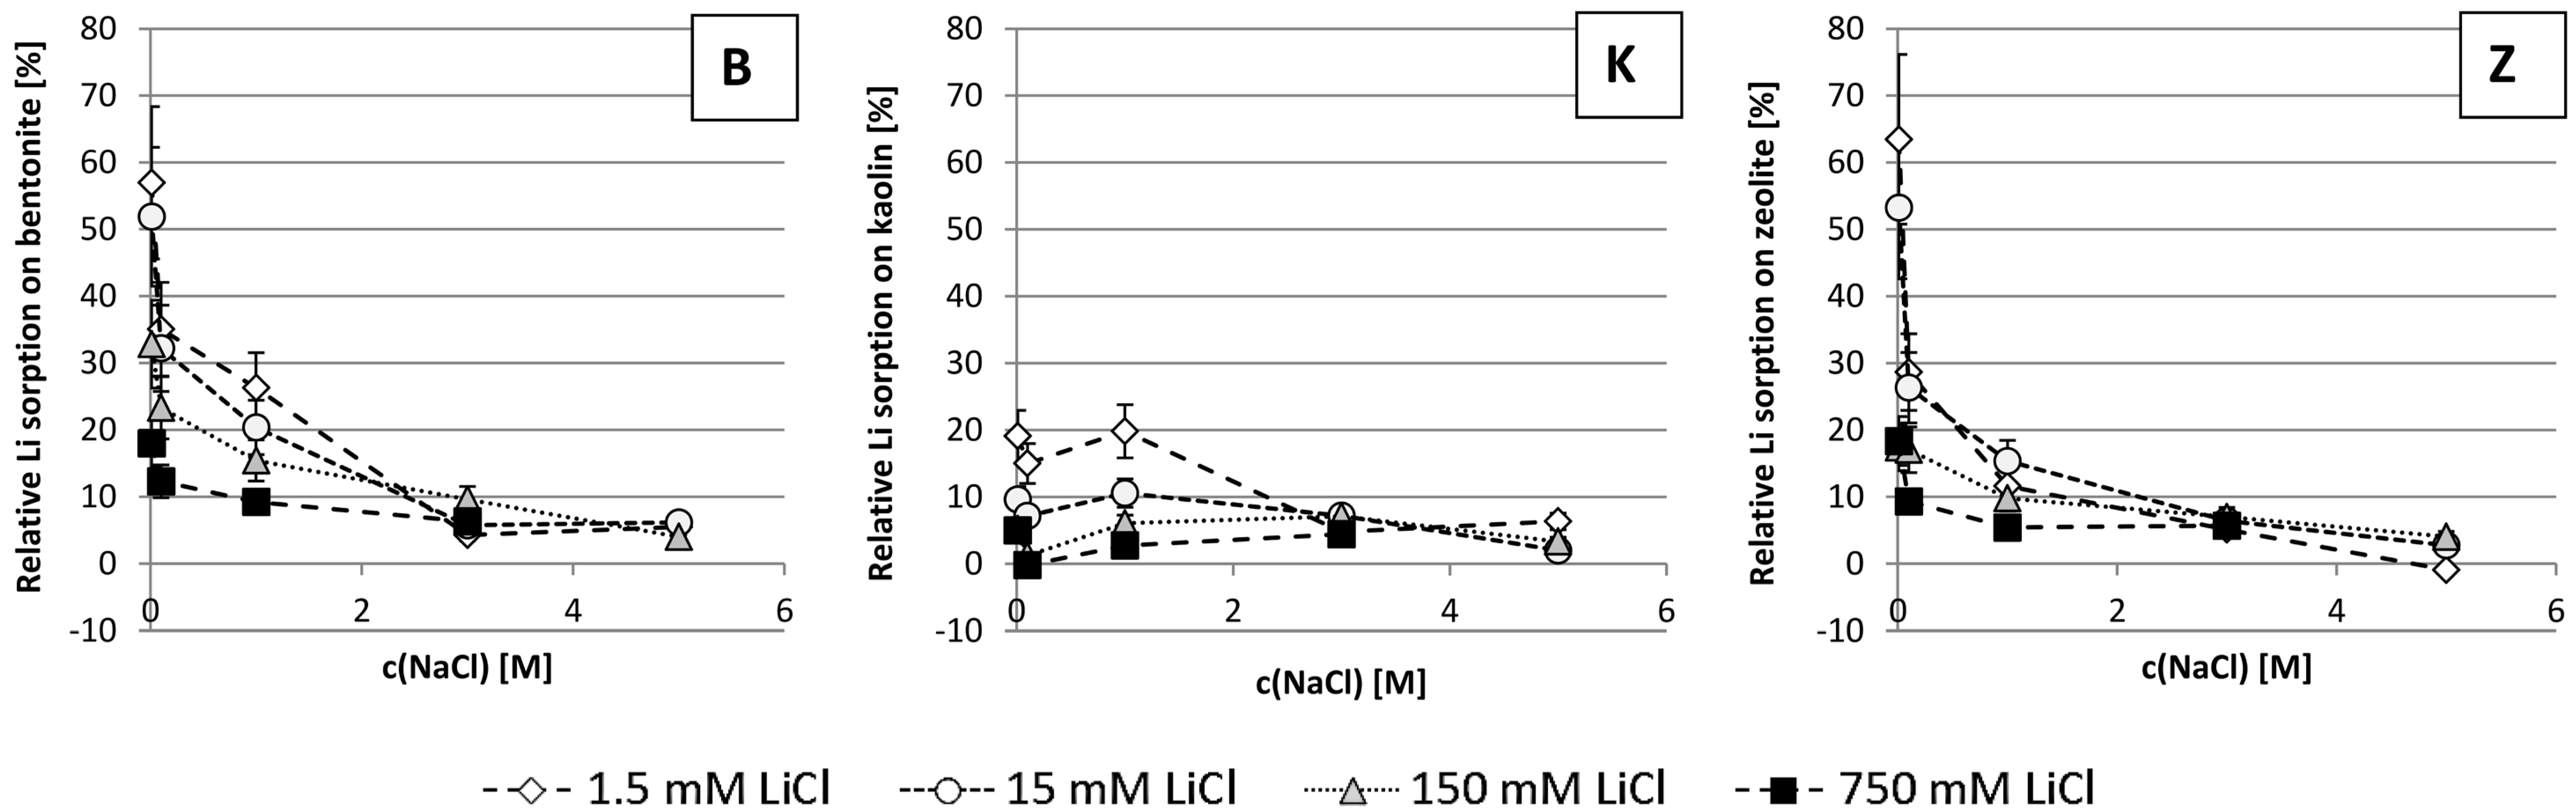
3.3. Relative Li Sorption

Figure 1 shows the relative Li sorption on the studied solids. Relative means the fraction of Li of the original salt solution that was sorbed on the solids, expressed in percent. Relative Li sorption is highest for zeolite (up to 65%), followed by bentonite (up to 55%) and kaolin (up to 20%).
Figure 2 shows the release of cations from the studied minerals at pH 6 and at different NaCl concentrations in the salt solutions used for agitating the minerals with. All three solids mainly release Ca, Mg and K.

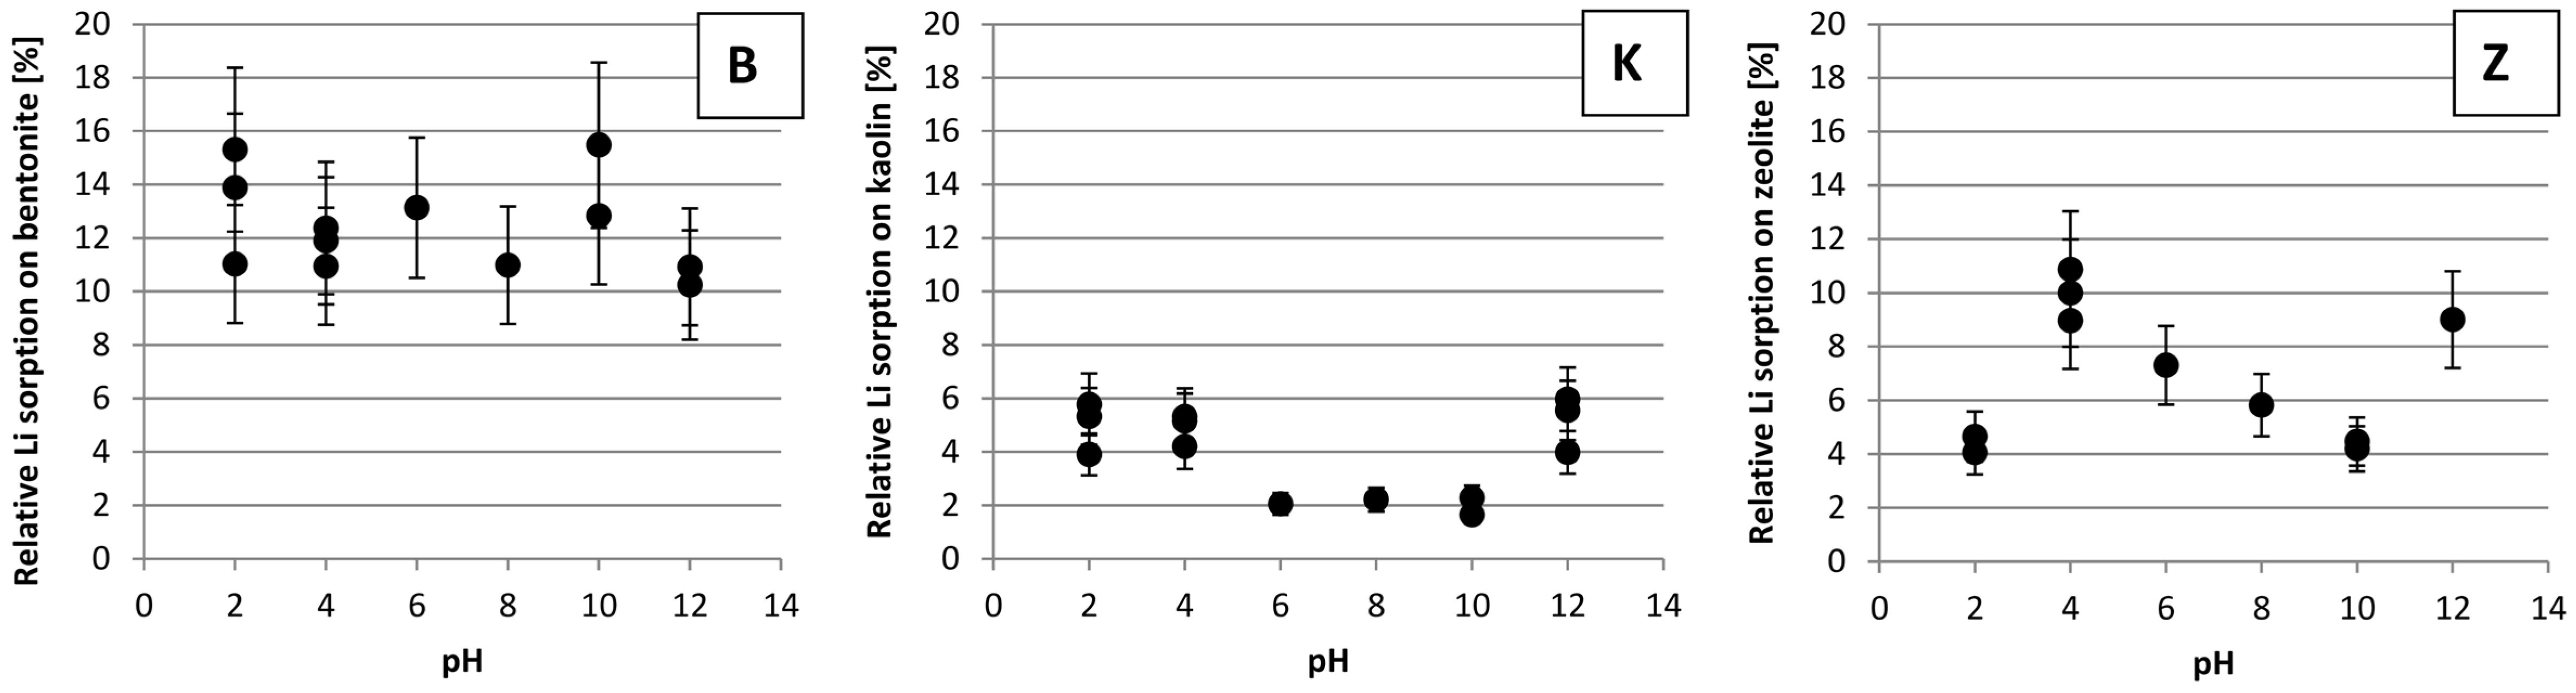
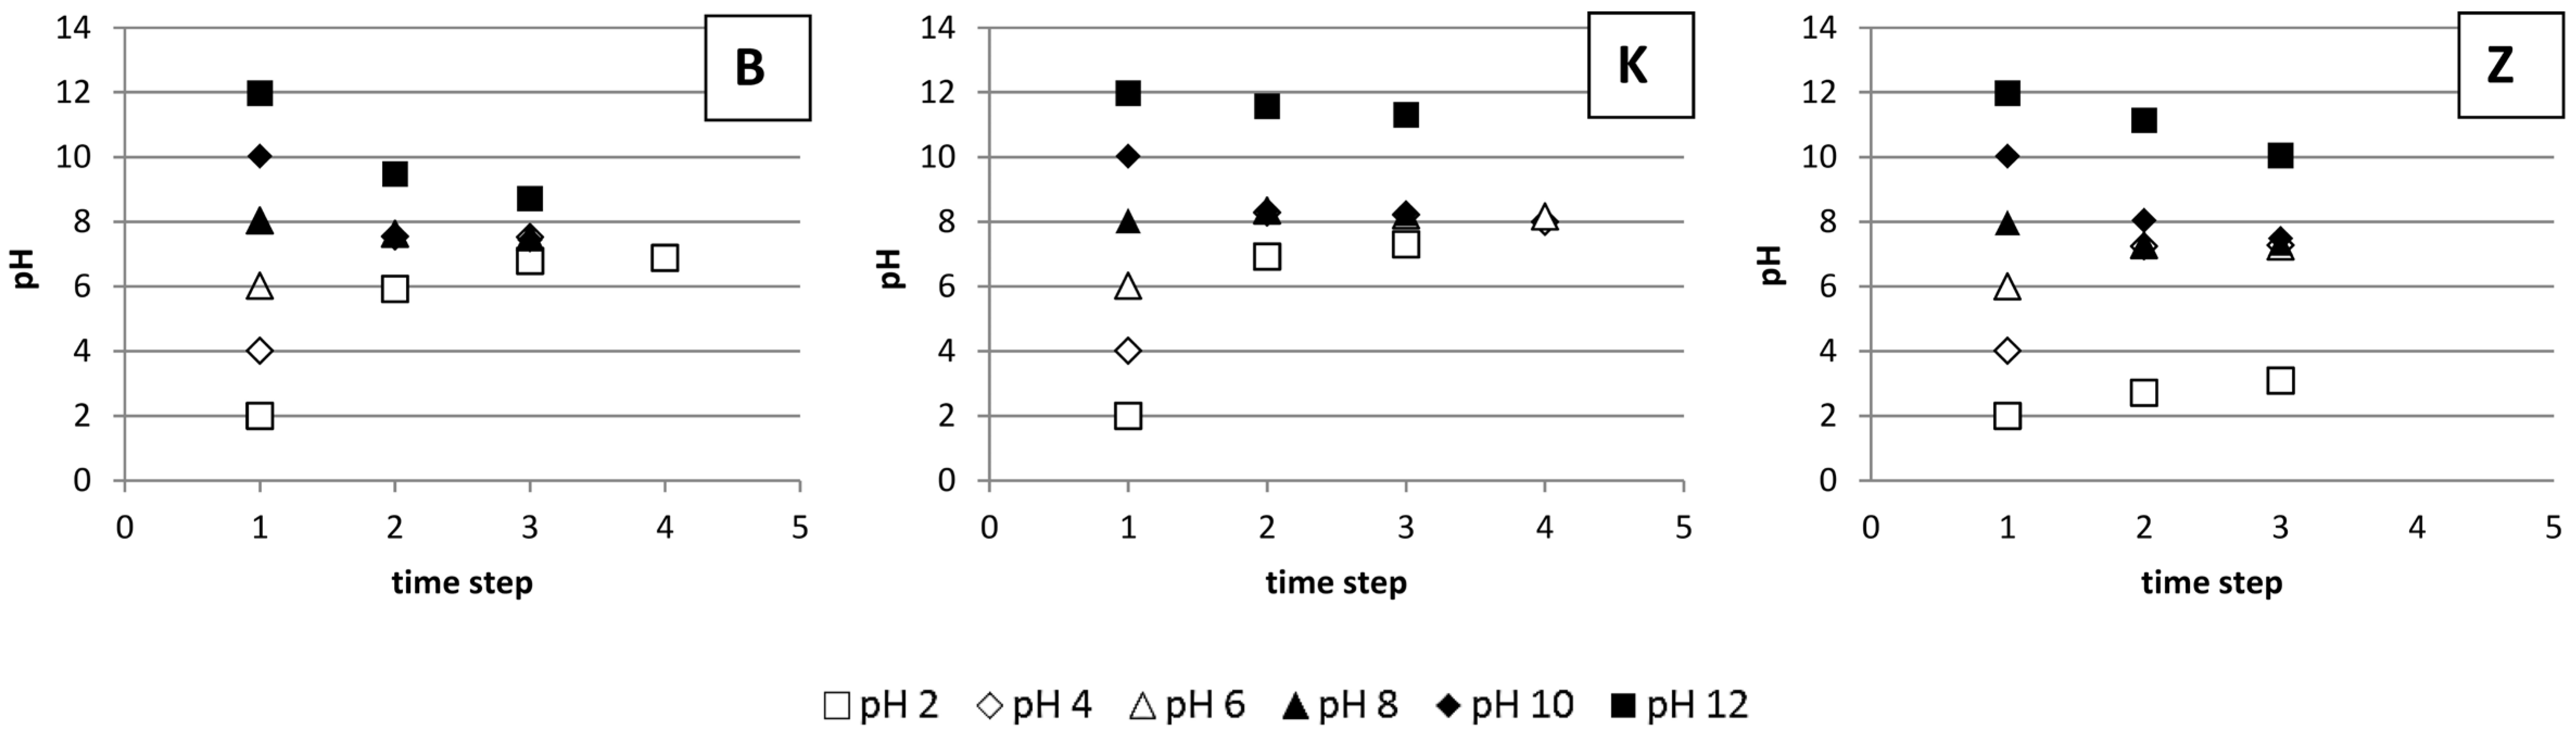
3.4. The Impact of pH on Li Sorption

Figure 3 shows the relative Li sorption on the studied solids, at 15 mM LiCl and 1 M NaCl in the salt solution, as a function of pH. Li sorption on bentonite varies between about 8% and 19%. Relative sorption on kaolin is highest at pH 2, 4 and 10 with 3% to 7%. From pH 6 to 10 it is only about 1% to 3%.
Sorption on zeolite increases from about 3%–5% at pH 2, to 7%–13% at pH 4, then it steadily decreases to 3%–5% again at pH 10 and finally rises again to about 7%–11% at pH 12.
Figure 4 shows the change in pH over time during Li sorption experiments on bentonite (B), kaolin (K) and zeolite (Z) using solutions containing 15 mM LiCl and 1 M NaCl and starting pH values ranging from 2 to 12. The pH in all three materials approaches a value that lies between the starting pH values examined. In the bentonite samples, the approach of a common pH is fastest; in the zeolite samples it is slowest.
Figure 1. Relative Li sorption on bentonite (B), kaolin (K) and zeolite (Z), respectively, as a function of sodium concentration in the initial salt solution used for the batch experiments (Relative means, the fraction of Li of the original salt solution that was sorbed on the solids; negative values indicate desorption).
Geosciences 05 00127 g001
Figure 2. Cation release after NaCl addition (0.01/0.1/1/3/5 M) from bentonite (B), kaolin (K) and zeolite (Z) at pH 6 (Na release could not be considered due to its high background concentration in the solutions used for the experiments. The diagrams are based on cation release in mol/kg solid.).
Geosciences 05 00127 g002
Figure 3. Relative Li sorption on bentonite (B), kaolin (K) and zeolite (Z), respectively, at 15 mM LiCl and 1 M NaCl in the salt solution as a function of pH in the initial salt solution used for the batch experiments (relative means, the fraction of Li of the original salt solution that was sorbed on the solids; for pH 6 and 8, only one sample per pH was tested but the filtrate was analyzed multiple times and means were calculated; for all other pH values the sorption experiments were done more than once).
Geosciences 05 00127 g003
Figure 4. Change in pH over time for Li sorption experiments on bentonite (B), kaolin (K) and zeolite (Z) at 15 mM LiCl and 1 M NaCl in the salt solution and starting pH between 2 and 12. The time steps are: 1—before adding the solid; 2—after having added the solid and homogenized the mixture; 3—after shaken for 24 h and centrifugation; and 4—some minutes later.
Geosciences 05 00127 g004

4. Discussion

4.1. Li Release from the Untreated Solids

Generally one would expect Li release by HNO3 (shown in Table 2) to be higher than the release by NaCl because of mineral decomposition and mobilization of Li from the minerals’ inner structure in addition to from its surface. As this is not the case, it is likely that Li is mainly attached to the surface of the minerals studied as an outer sphere complex or close to their surfaces in a diffuse ion swarm, as supported by [13].
As mentioned in Section 3.1, increasing the NaCl concentration in the salt solution used for agitating the solids with generally resulted in an increase in Li release. The great variation in Li mobilization when using NaCl might be due to heterogeneity (especially for the natural materials bentonite and zeolite), high salt loads in the solutions, and analytical inaccuracies (detection limit vs. dilution).
Comparing the Li release of the different solids used, it can be seen that it is lowest and most uniform for kaolin (in this study a CRM kaolin was used) and highest for zeolite.
Nevertheless, Li release is around four orders of magnitude below the Li sorption during the experiments (see Section 3.2). Therefore, Li initially bound in and on the minerals is not further considered.

4.2. Absolute Li Sorption

The Li contents of the solids after the sorption experiments (see Section 3.2) are much higher than those commonly found in igneous rocks (22–56 ppm) or sedimentary rocks (17–46 ppm) [4]. Yet they are within the average to upper range typical for clay minerals (7–6000 ppm, [14]). The highest absolute Li sorption results were achieved when the availability of Li (i.e., the Li concentration in the salt solutions used) was highest, and the presence of competing cations (i.e., Na concentration) was lowest.
Typical cation exchange capacities (CEC) at pH 7 found in literature [15,16] are:
-
70–100 meq/100 g for smectites (the mineral group to which montmorillonite belongs)
-
3–15 meq/100 g for kaolinite (the main constituent of kaolin)
-
220–620 meq/100 g for zeolites (depending on the type of zeolite)
So, it seems like kaolin was more or less completely saturated with Li after the sorption experiment. As opposed to that Li sorption on bentonite and zeolite, respectively, was only 55% to 79% and 9% to 26% of the typical CEC of smectites and zeolites, respectively, if literature values are regarded. That great discrepancy can be explained by:
- Differences in grain size
Kaolin and bentonite were present as fine powder while zeolite was probably the coarsest material used even after grinding.
- Differences in the availability of the cation exchange places for Li
With an ionic radius of 76 pm, Li is the smallest of all alkali metals (34% and 82% smaller than Na and K, respectively). However, its hydrate envelope is the thickest (264 pm). It is 52% and 181% thicker than that of Na and K, respectively, and makes Li the thickest of the hydrated alkali metal cations [3,17]. Therefore, Li mainly binds at the outside surface of minerals unless they are heated [18]. In kaolin exchange places only exist at unsatisfied valences on edges of the structural units and are therefore available for Li. In montmorillonite (the main constituent of bentonite) and clinoptilolite (the main constituent of zeolite) exchange places also exist within the layers and are therefore not or only partly available for Li.
- Differences in purity of the materials used
The bentonite used only consists of about 80% montmorillonite. The rest of it consists of feldspars, cristobalite and quartz which have a much lower cation exchange capacity (CEC) and will consequently lower the total CEC. For the zeolite it is similar. As kaolinite, the main constituent of kaolin, has a very low CEC, the admixtures in the kaolin used (23% of the total mass) probably increase the CEC that a pure kaolinite would have (see Table 1).
- The availability of CEC data and the method used for CEC determination
The materials used are no pure minerals but mixtures as shown in Table 1. Therefore, their actual CEC will deviate from literature values. Furthermore, depending on the method used for CEC determination the analytically found CEC will differ.

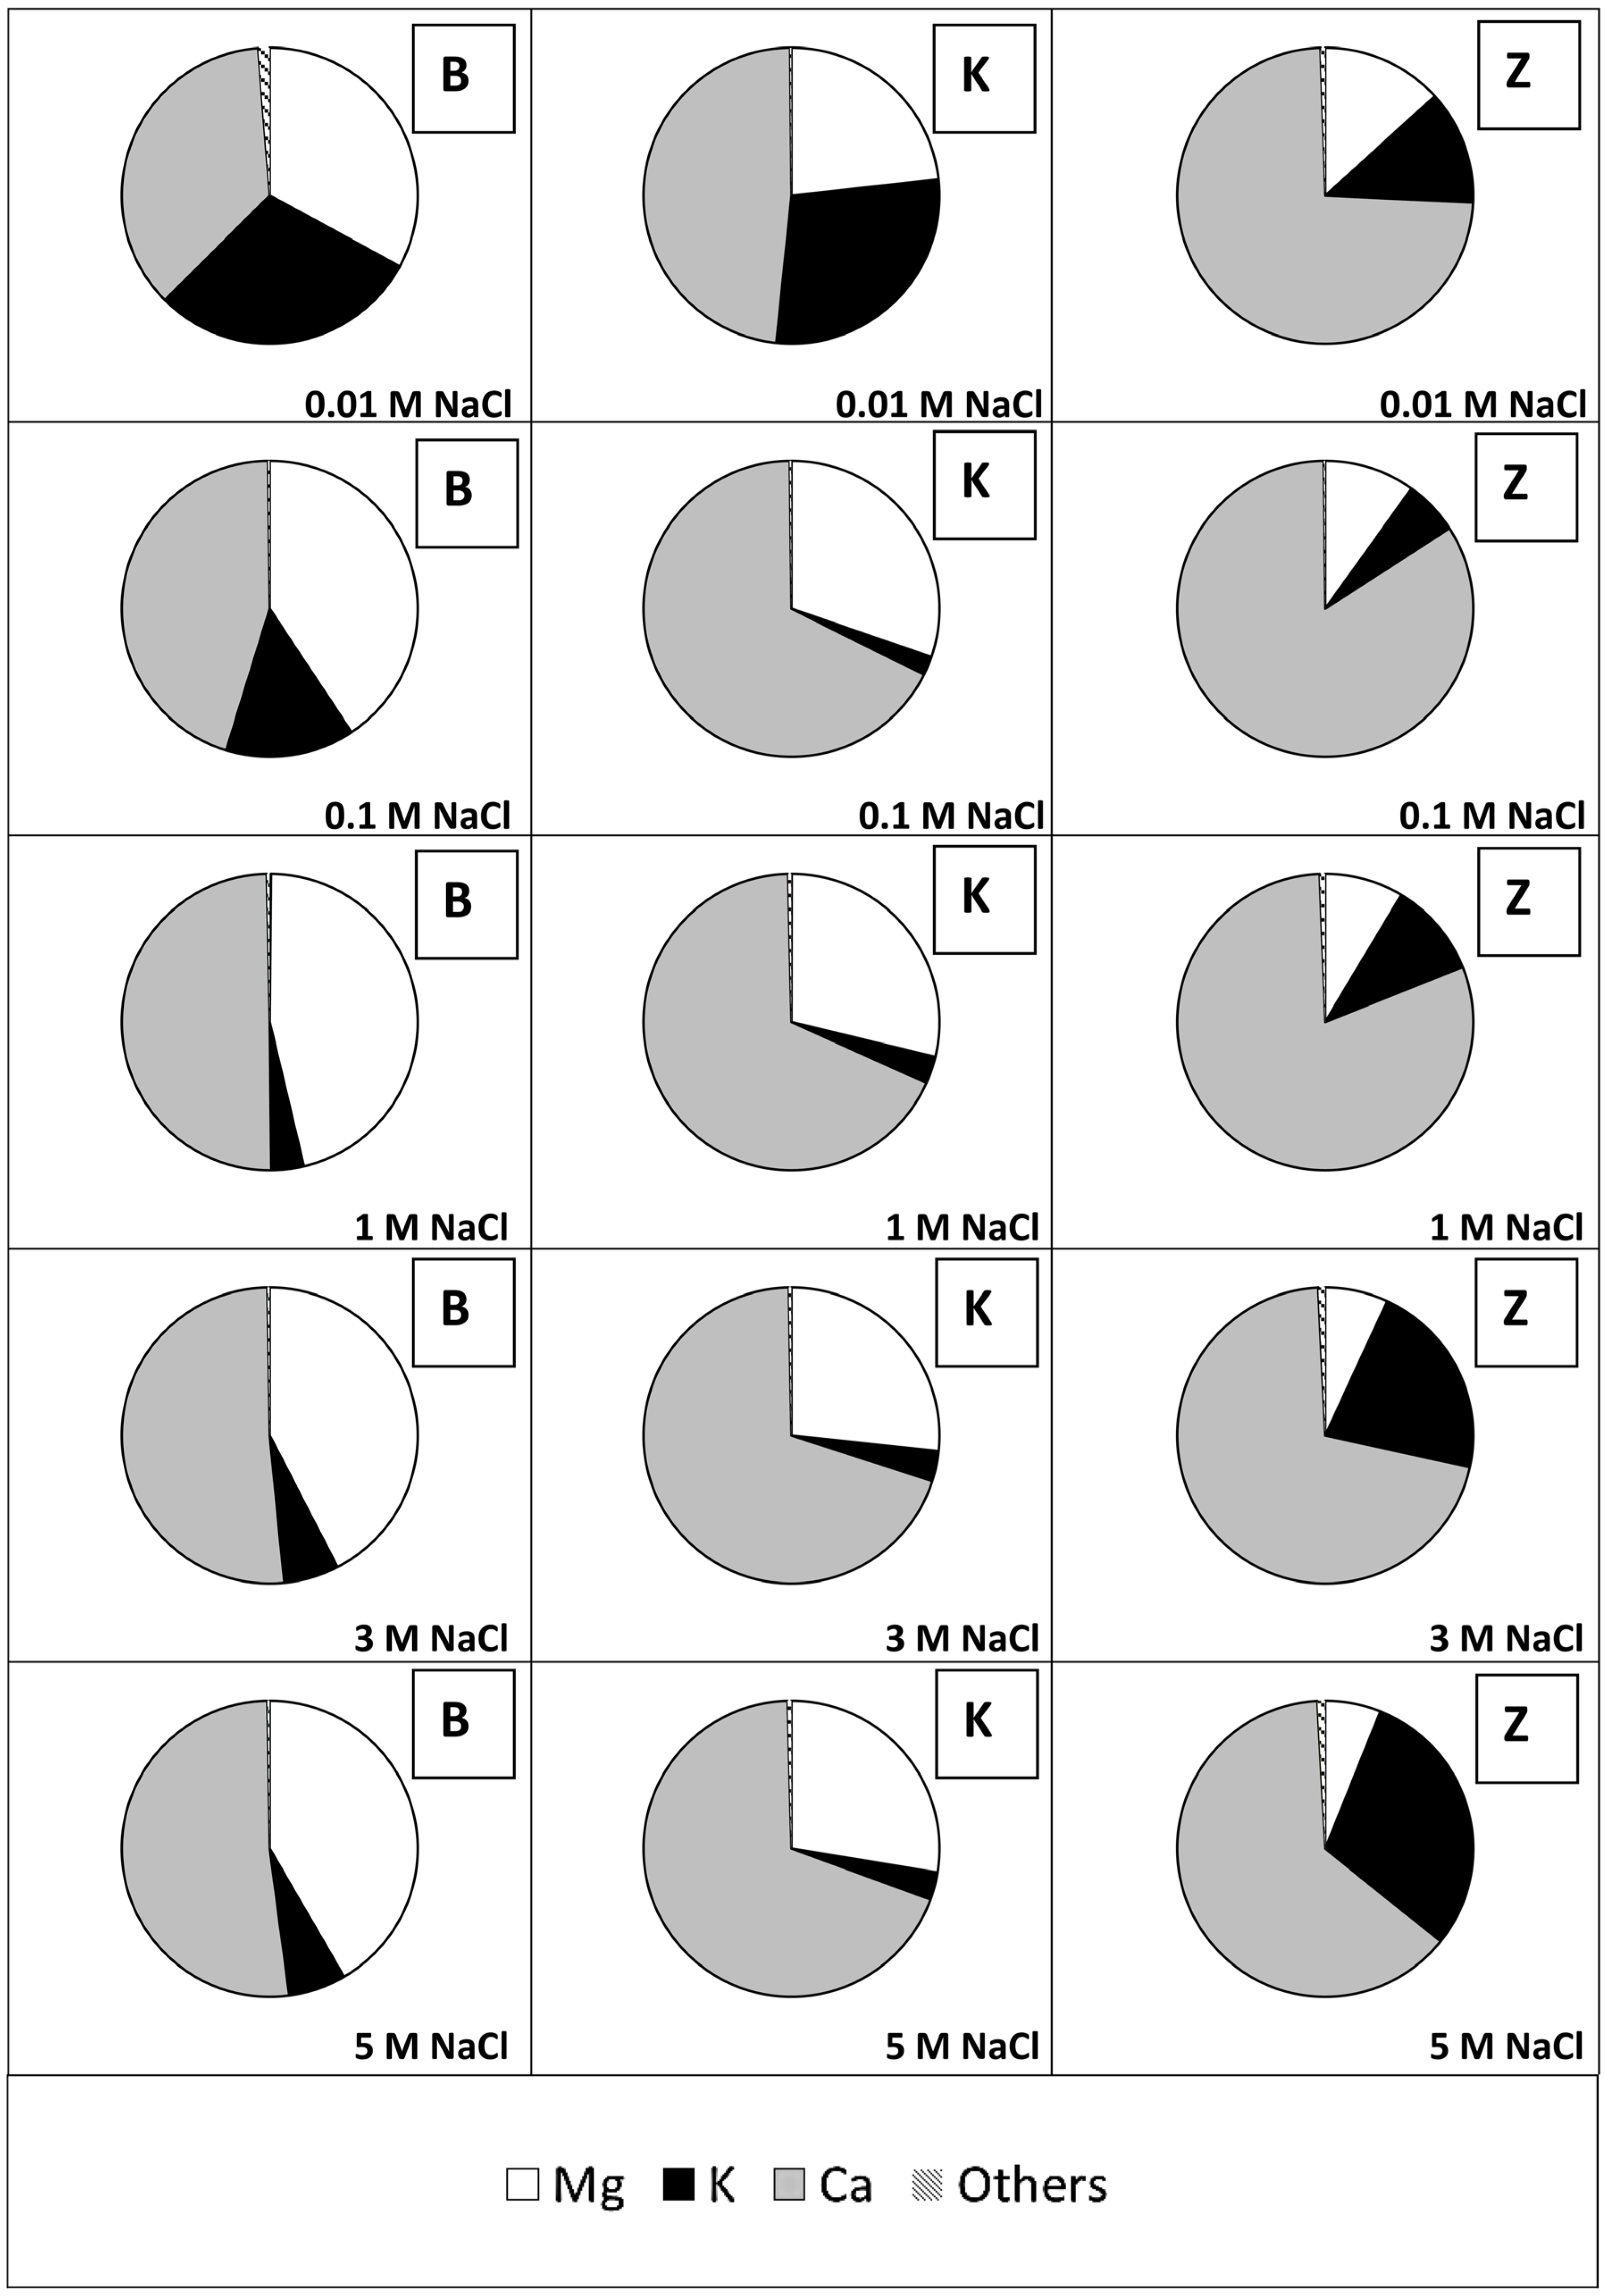
4.3. Relative Li Sorption

For all materials tested, in Figure 1 it can be seen that relative Li sorption decreases with increasing Li concentration in the solutions used for agitating the solids with. This is probably due to the limited number of exchange places available for Li sorption that are exhausted at some point.
For bentonite and zeolite, the decrease in relative Li sorption with increasing Na concentration follows a steadily decreasing trend. For kaolin, the decreasing trend of the curve is interrupted by a local maximum at 1 M NaCl. It is assumed that the increased ionic strength of the solution mobilized 2-valent cations (Ca2+ and Mg2+) bound to kaolin that could otherwise not have been mobilized. At high ionic strength the order of ease of cation replacement does not follow the Hofmeister Series (Li+ < Na+ < K+ < Rb+ < Cs+ and Mg2+ < Ca2+ < Sr2+ < Ba2+, [1,15]) anymore. So, not the thermodynamically most favorable ion will always be bound but steric and kinetic effects play a role, too. Further raising the Na concentration again decreases Li sorption in favor of Na.
As shown in Figure 2 the three solids used mainly release Ca, Mg and K. The differences in the extent of cation mobilization are assumed to be caused by:
-
Mineral composition (especially Ca, Mg, K content)
-
Structure of the minerals and how and where Ca, Mg and K are bound
-
The valency and consequently the binding strength of Ca, Mg and K
-
The ionic strength of the solution
At high ionic strength the order of ease of replacement does not follow the Hofmeister Series anymore (see Section 3.3). Therefore, Ca and Mg are increasingly mobilized from bentonite and kaolin. Zeolite, however, releases more K at higher ionic strength than at lower ionic strength. The reason for that can be seen in the higher content of K in zeolite as compared to bentonite (about 30% as compared to about 10% if the sum of Ca, Mg and K is set to 100%) and in structural differences (bentonite and kaolin mainly consist of clay minerals, i.e., sheet silicates; zeolite mainly consists of clinoptilolite, a tectosilicate).

4.4. The Impact of pH on Li Sorption

Li sorption on bentonite (see Figure 3) seems not to depend on pH. This is supported by [19] who found that the negative surface charge of bentonite colloids shows only a very small dependence on pH. They considered a pH range of 6 to 10 and determined the point of zero charge, i.e., the pH at which positive charge equals negative charge, of bentonite being saturated with H+ as 8.2.
As opposed to other clay minerals, kaolin is stable at low pH [20,21]. Therefore Li sorption, shown in Figure 3, does not decrease with decreasing pH. For kaolinite the isoelectric point is at about pH 4 to 5 [22]. So, one would assume the clay mineral’s surface to become more negatively charged, its cation exchange capacity to increase and Li sorption to increase as pH rises above this point. However, between pH 6 and 10 lowest Li sorption was observed. This is probably because at above pH 5, kaolin transforms to gibbsite, Al(OH)3 which has a point of zero charge of pH 8.1 to 9.6 [23]. Below its point of zero charge, gibbsite is more positively charged and its anion exchanger properties predominate. At higher pH values its cation exchanger properties increase and therefore Li sorption increases.
As a silicate mineral, zeolite tends to dissolve at low pH due to surface protonation, which polarizes inter-atomic bonds and destabilizes the crystal structure [1]. For clinoptilolite, the point of zero charge is at about pH 3 [24]. There, bond polarization is lowest and the mineral’s dissolution rate is lowest. In [24], the author investigated the zeolite mineral clinoptilolite, the main constituent of the zeolite used in the present study. She studied a pH range of 8 to 10 and showed that negative surface charge causes repulsion and increases dissolution rate. So, on the one hand increasing the pH to higher than 3 should increase the negative surface charge of zeolite and increase Li sorption; but increasing it too much on the other hand seems to destabilize the structure of zeolite and decrease Li sorption as shown in Figure 3. At pH 12 Li sorption again increases. Maybe structural changes or the extremely low concentration of H+, which might otherwise compete with Li+ for exchange places, are reasons for that. Structure analyses could elucidate structural changes.
The pH in all three materials studied with starting pH values ranging between 2 and 12 approaches a value that lies between the starting pH values. This underlines the materials’ pH buffering capacities. Whether or not such a common pH is finally reached was not examined. Yet it seems like for bentonite, the final pH for bentonite and kaolin/gibbsite will be around 8 (but the kaolin sample with an initial pH of 12 might not reach that value), and for zeolite about 7 (the samples with the most extreme pH values of 2 and 12 may not reach that value). Bentonite seems to have the greatest capacity to buffer the addition of acids and bases. The potential of kaolin/gibbsite to buffer the addition of acids seems to be higher than its potential to buffer the addition of bases. Zeolite seems to neither be able to balance the addition of strong acids nor of strong bases very well.
Now the observations from Figure 3 and Figure 4 will be combined. The great pH buffering capacity of bentonite is the reason why within the 24 h agitation period, the initial difference in pH nearly diminishes. No dependence of Li sorption on initial pH could be determined. To examine the pH dependence, pH stat experiments would be needed.
In the case of kaolin, pH buffering is similarly strong as for bentonite. Only the highest initial pH (12) could not be buffered within the time of the experiment. The transformation of kaolin to gibbsite is assumed to be the reason for the sorption minimum between pH 6 and 10. The elevated sorption at pH 12, also seen for zeolite, could be due to less competition by H+ or structural changes.
During the experiments, zeolite could only buffer the solutions with an initial pH ranging between 4 and 10. The reason for the differences in Li sorption might be due to structural changes and a decrease in stability of the framework. Structure analysis would be needed to understand micro scale processes.

5. Summary and Conclusions

In this study, a total of 3800 ± 380 ppm, 1300 ± 130 ppm and 3900 ± 390 ppm of Li was sorbed by bentonite, kaolin and zeolite, respectively. This is within the average to upper range typically found in clay minerals (7–6000 ppm, [14]). For kaolin this maximum Li content was reached when seemingly all exchange places were occupied with Li. The exchange places of bentonite and zeolite however were only partly taken by Li (about 55 to 79% and 9 to 26% of the typical CEC of smectites and zeolites, respectively). The reason for this difference can be seen in the different ways that exchange places are present in the respective solids as well as in the way Li is bound in them.
As Li dissolved in water occurs as monovalent cation with a thick hydrate envelope, it is assumed that it cannot approach the minerals’ surfaces very close and therefore only be bound in outer sphere complexes as well as in the diffuse ion swarm around the negatively charged surface of the mineral’s surface [10,13]. Consequently, a great share of the exchange places of montmorillonite and clinoptilolite cannot be used by Li. Nevertheless, due to their considerably higher CEC (about 70–100 meq/100 g and 220–620 meq/100 g, respectively, as compared to 3–15 meq/100 g for kaolinite [15]) Li sorption on them is still higher than on kaolinite.
Depending on the mineral, Li sorption is either independent on pH due to strong buffering capacities (bentonite); or sorption considerably changes with pH (zeolite and kaolin) due to changes in surface charge and stability or even decomposition and transformation to other minerals (kaolinite to gibbsite), respectively. At extremely low or high pH, the presence or absence of H+ as competing cation and the release of cations from the materials used might also play a role.
Even if it is possible to trace certain processes on the minerals’ surfaces by analyzing the solutions used for the sorption experiments, the possibilities are limited. Without structure analytical methods it is hard or even impossible to reliably predict the extent and manner of Li sorption. In order to gain a deeper understanding of Li sorption under different pH conditions, pH stat experiments are needed.
In most natural systems, the conditions will differ considerably from those of the experiments. However, in highly saline environments like salars, Li and other alkali, metal ion concentrations are similarly elevated, which makes them interesting as resources. In order to properly plan their exploitation, understanding and investigating how and where Li is present and bound is crucial. In future, additional, more sophisticated experiments (e.g., using XPS, EXAFS, XANES) could be performed to investigate how and where Li is bound on clay minerals.

Acknowledgements

The authors would like to thank Dr. Reiner Dohrmann from the LBEG Hannover and Prof. Dr. Ruben Kretzschmar from the ETH Zuerich for their helpful advice and constructive discussions throughout the experimental as well as the interpretative part of this work. Many thanks also to the “AG Salz- & Mineralchemie” of TU Bergakademie who provided the LiCl for the experiments. We thank as well two anonymous reviewers for their comments.

Author Contributions

Broder Merkel conceived and partly designed the experiments; Mandy Hoyer performed the experiments, analyzed and interpreted the data, and wrote the paper; Nicolai-Alexeji Kummer contributed help for chemical analysis. Broder Merkel and Nicolai-Alexeji Kummer reviewed and commented the paper.

Conflicts of Interest

The authors declare no conflict of interest.

References

  1. Stumm, W.; Morgan, J.J. Aquatic Chemistry; Wiley: New York, NY, USA, 1996. [Google Scholar]
  2. Garrett, D.E. Handbook of Lithium and Natural Calcium Chloride; Elsevier: Amsterdam, The Netherlands, 2004. [Google Scholar]
  3. Greenwood, N.N.; Earnshaw, A. Chemistry of the Elements; Elsevier Butterworth-Heinemann: Amsterdam, The Netherlands, 2003. [Google Scholar]
  4. Cannon, H.L.; Harms, T.F.; Hamilton, J.C. Lithium in Unconsolidated Sediments and Plants of the Basin and Range Province, Southern California and Nevada; U.S. Government Printing Office: Washington, DC, USA, 1975.
  5. Millot, R.; Vigier, N.; Gaillardet, J. Behaviour of lithium and its isotopes during weathering in the Mackenzie Basin, Canada. Geochim. Cosmochim. Acta 2010, 74, 3897–3912. [Google Scholar] [CrossRef] [Green Version]
  6. Brigatti, M.F.; Kile, D.E.; Poppi, M. Crystal structure and crystal chemistry of lithium-bearing muscovite-2M1. Can. Mineral. 2001, 39, 1171–1180. [Google Scholar] [CrossRef]
  7. Takamatsu, N.; Imahashi, M.; Shimodaira, K.; Kamiya, H. The dissolution of lithium minerals in salt solutions. Geochem. J. 1983, 17, 153–160. [Google Scholar] [CrossRef]
  8. Risacher, F.; Fritz, B. Quaternary geochemical evolution of the salars of Uyuni and Coipasa, Central Altiplano, Bolivia. Chem. Geol. 1991, 90, 211–231. [Google Scholar] [CrossRef]
  9. Sieland, R. Hydraulic Investigations of the Salar de Uyuni, Bolivia. Available online: http://tu-freiberg.de/sites/default/files/media/institut-fuer-geologie-718/pdf/fog_volume_37.pdf (accessed on 23 October 2014).
  10. Adamis, Z.; Williams, R.B. Bentonite, Kaolin, and Selected Clay Minerals; World Health Organization: Geneva, Switzerland, 2005. [Google Scholar]
  11. Zeolites. Available online: http://cool.conservation-us.org/byorg/abbey/an/an20/an20-7/an20-702.html (accessed on 23 October 2014).
  12. Bachmaf, S.; Merkel, B. Sorption of uranium (VI) at the clay mineral–water interface. Environ. Earth Sci. 2011, 63, 925–935. [Google Scholar] [CrossRef]
  13. Scheffer, F.; Schachtschabel, P.H.-P.; Thiele-Brune, S. Lehrbuch der Bodenkunde; Spektrum Akad.-Verl.: Heidelberg, Germany, 2010. [Google Scholar]
  14. Starkey, H.C. The Role of Clays in Fixing Lithium; U.S. Government Printing Office: Washington, DC, USA, 1982.
  15. Carroll, D. Ion exchange in clays and other minerals. Geol. Soc. Am. Bull. 1959, 70, 749–779. [Google Scholar] [CrossRef]
  16. Cation-Exchange Capacity of Zeolites. Available online: http://www.gsaresources.com/cationexchange.htm (accessed on 24 October 2014).
  17. Deberitz, J. Lithium; Verl. Moderne Industrie: Landsberg/Lech, Germany, 1993. [Google Scholar]
  18. Chang, F.-R.C.; Skipper, N.T.; Sposito, G. Monte Carlo and Molecular Dynamics Simulations of Interfacial Structure in Lithium-Montmorillonite Hydrates. Langmuir 1997, 13, 2074–2082. [Google Scholar] [CrossRef]
  19. Baik, M.H.; Lee, S.Y. Colloidal stability of bentonite clay considering surface charge properties as a function of pH and ionic strength. J. Ind. Eng. Chem. 2010, 16, 837–841. [Google Scholar] [CrossRef]
  20. Rex, R.W. Authigenic kaolinite and mica as evidence for phase equilibria at low temperatures. Clays Clay Miner. 1965, 13, 95–104. [Google Scholar] [CrossRef]
  21. Alba, M.D.; Castro, M.A.; Chain, P.; Orta, M.M.; Pazos, M.C.; Pavon, E. Hydrothermal Stability of layered silicates in neutral and acidic media. Clays Clay Miner. 2010, 58, 501–514. [Google Scholar] [CrossRef]
  22. Dohnalová, Ž.; Svoboda, L.; Šulcová, P. Characterization of kaolin dispersion using acoustic and electroacoustic spectroscopy. J. Min. Metall. Sect. B Metall. 2008, 44, 63–72. [Google Scholar] [CrossRef]
  23. Jodin, M.C.; Gaboriaud, F.; Humbert, B. Limitations of potentiometric studies to determine the surface charge of gibbsite gamma-Al(OH)3 particles. J. Colloid Interface Sci. 2005, 287, 581–591. [Google Scholar] [CrossRef] [PubMed]
  24. Bailey, J. Kirk-Othmer Encyclopedia of Chemical Technology; John Wiley & Sons: Hoboken, NJ, USA, 2004. [Google Scholar]

